Visual Cortex Neurons of Monkeys and Cats: Temporal Dynamics of the Spatial Frequency Response Function
|
|
|
- Suzanna Gordon
- 6 years ago
- Views:
Transcription
1 J Neurophysiol 91: , 2004; /jn Visual Cortex Neurons of Monkeys and Cats: Temporal Dynamics of the Spatial Frequency Response Function Robert A. Frazor, Duane G. Albrecht, Wilson S. Geisler, and Alison M. Crane Department of Psychology and Center for Perceptual Systems, University of Texas, Austin, Texas Submitted 2 September 2003; accepted in final form 29 January 2004 Frazor, Robert A., Duane G. Albrecht, Wilson S. Geisler, and Alison M. Crane. Visual cortex neurons of monkeys and cats: temporal dynamics of the spatial frequency response function. J Neurophysiol 91: , 2004; /jn We measured the responses of striate cortex neurons as a function of spatial frequency on a fine time scale, over the course of an interval that is comparable to the duration of a single fixation (200 ms). Stationary gratings were flashed on for 200 ms and then off for 300 ms; the responses were analyzed at sequential 1-ms intervals. We found that 1) the preferred spatial frequency shifts through time from low frequencies to high frequencies, 2) the latency of the response increases as a function of spatial frequency, and 3) the poststimulus time histograms (PSTHs) are relatively shape-invariant across spatial frequency. The dynamic shifts in preferred spatial frequency appear to be a simple consequence of the latency shifts and the transient nature of the PSTH. The effects of these dynamic shifts on the coding of spatial frequency information are examined within the context of several different temporal integration strategies, and pattern-detection performance is determined as a function of the interval of integration, following response onset. The findings are considered within the context of related investigations as well as a number of functional issues: motion selectivity in depth, coarse-to-fine processing, direction selectivity, latency as a code for stimulus attributes, and behavioral response latency. Finally, we demonstrate that the results are qualitatively consistent with a simple feedforward model, similar to the one originally proposed in 1962 by Hubel and Wiesel, that incorporates measured differences in the response latencies and the receptive field sizes of different lateral geniculate nucleus inputs. INTRODUCTION It has been known for more than three decades that most visual cortex neurons are selective along the dimension of spatial frequency. The average spatial frequency bandwidth is approximately 1.5 octaves (e.g., Campbell et al. 1969; Cooper and Robson 1968; De Valois et al. 1982; Movshon et al. 1978; Robson et al. 1988; for general reviews see De Valois and De Valois 1988; Geisler and Albrecht 2000; Shapley and Lennie 1985). This selectivity is very different from that of the neurons in the lateral geniculate nucleus (LGN) of the thalamus and the ganglion cells in the retina, which are not very selective for spatial frequency or orientation. In comparison, the spatial frequency bandwidth for neurons in the LGN ranges from 3 to 5 octaves (e.g., Croner and Kaplan 1995; Derrington and Lennie 1984; Hicks et al. 1983; Irvin et al. 1993; Kaplan and Shapley 1982; Rodieck and Stone 1965; So and Shapley 1981; Troy 1983a,b; Xu et al. 2002). Although it is unknown exactly how this transformation in the selectivity, from the LGN to the cortex, is produced, several different classes of models have Address reprint requests and other correspondence to D. G. Albrecht ( albrecht@psy.utexas.edu). been proposed (e.g., Anderson et al. 2000a,b; Carandini and Ringach 1997; Carandini et al. 1999; Chance et al. 1998; Douglas et al. 1995; Gilbert et al. 1990; Hubel and Wiesel 1962; Troyer et al. 1998; for recent reviews, see Albrecht et al. 2002, 2003; Ferster and Miller 2000). Most measurements of spatial frequency selectivity have been performed using moving stimuli that were presented for relatively long durations (generally several seconds) to approximate a steady-state condition. However, natural saccadic inspection of a visual scene typically produces transient stimulation: 200- to 300-ms fixations separated by rapid eye movements. Although there are minor differences in the temporal dynamics of saccadic eye movements among humans, macaque monkeys, and cats, fixation durations of approximately 200 ms are typical across all 3 species (Evinger and Fuchs 1978; Fuchs 1967; Stryker and Blakemore 1972; for general reviews see: Carpenter 1991; Ditchburn 1973). There is now a growing body of evidence to indicate that cortical neurons respond differently under transient, as opposed to steady-state, conditions. For example, 1) the temporal frequency tuning measured using steady-state stimuli shows relatively little low-frequency attenuation (Albrecht 1995; Hawken et al. 1996; Movshon et al. 1978), whereas the temporal response profile measured using transient stimuli decays quite rapidly, faster than would be expected based on the temporal frequency tuning (Albrecht et al. 2002; Müller et al. 1999, 2001; Tolhurst et al. 1980) 1 ; 2) the temporal frequency tuning measured using steady-state stimuli varies as a function of contrast (Albrecht 1995; Hawken et al. 1992; Holub and Morton-Gibson 1981), whereas the temporal response profile measured using transient stimuli is relatively invariant as a function of contrast (Albrecht et al. 2002); 3) the variability of cortical neurons is approximately proportional to the mean firing rate under steady-state conditions (e.g., Geisler and Albrecht 1997; Softky and Koch 1993; Tolhurst et al. 1983), whereas under transient conditions the relationship between the mean and variance is more complex (Albrecht et al. 2002; Mechler et al. 1998; Müller et al. 1999, 2001; for recent reviews of this literature, see Albrecht et al. 2002, 2003). Given these differences between the responses of visual cortex neurons under steady-state conditions, as opposed to transient conditions, it is important to measure the spatial frequency 1 If there is very little low-frequency attenuation, then the response to the 200-ms step function should be considerably more sustained than what is observed for the majority of neurons. The costs of publication of this article were defrayed in part by the payment of page charges. The article must therefore be hereby marked advertisement in accordance with 18 U.S.C. Section 1734 solely to indicate this fact /04 $5.00 Copyright 2004 The American Physiological Society 2607
2 2608 FRAZOR, ALBRECHT, GEISLER, AND CRANE tuning under transient conditions that are more comparable to natural fixation. Two recent investigations of spatial frequency tuning have presented gratings for very brief temporal intervals ( ms) in rapid, temporally contiguous succession; a reverse correlation technique was then used to measure the linear component of the responses (Bredfeldt and Ringach 2002; Mazer et al. 2002). 2 The goal of these studies was to measure the temporal dynamics of spatial frequency tuning over the course of the first 100 ms or so following stimulus onset. Although the results of the two studies are, on the whole, quite consistent, there are differences. First, Mazer et al. reported that the spatial frequency tuning changed very little through time (as they pointed out, the tuning was largely separable), whereas Bredfeldt and Ringach reported that the spatial frequency tuning changed substantially through time (i.e., the tuning was inseparable). Specifically, Bredfeldt and Ringach reported that during the initial time periods (at the onset of the responses) the tuning was quite broad, spanning both low frequencies and high frequencies (as they pointed out, very similar to the tuning of LGN neurons); however, through time, the responses to low frequencies were diminished, and thus the peak of the spatial frequency tuning shifted from low frequencies to high frequencies. Second, Mazer et al. reported that the latency of the response increased as spatial frequency increased (for the component of the response that they reported was not separable), whereas Bredfeldt and Ringach did not report a change in the latency as a function of spatial frequency. Specifically, they found that the onset of the responses to high frequencies and low frequencies appeared concurrently. The steady-state method of stimulation (with durations on the order of seconds) and the brief, temporally contiguous method of stimulation (with durations on the order of ms) have both provided important information about the properties of visual cortex neurons. However, these methods of stimulation are both different from the stimulation that occurs during normal saccadic viewing. In the present study we investigated the spatial frequency tuning of striate visual cortex neurons using stationary gratings that were presented for a temporal interval that is roughly comparable to the duration of a single fixation (i.e., 200 ms). Further, the responses were measured on a fine time scale to investigate the temporal dynamics of spatial frequency tuning during this interval. Using this stimulus protocol, we find that for most neurons the latency of the response increases as the spatial frequency increases and that the peak of the spatial frequency tuning shifts through time from low frequencies to high frequencies. Interestingly, these dynamic changes are qualitatively consistent with what would be expected from the model proposed four decades ago by Hubel and Wiesel (1962) if one assumes, in the monkey, that magnocellular and parvocellular neurons, or in the cat, that X and Y neurons, converge on the same cortical neuron. 2 Over the past several decades, reverse-correlation methodology has been used to measure the linear component of the responses of sensory neurons (Anzai et al. 1999; Chichilnisky 2001; DeAngelis et al. 1993; de Boer and Kuyper 1968; Eggermont et al. 1983; Emerson et al. 1989; Jones and Palmer 1987; Marmarelis and Marmarelis 1978; Mazer et al. 2002; McLean et al. 1994; Palmer et al. 1991; Reid et al. 1997; Ringach et al. 1997; for recent reviews, see Nykamp and Ringach 2002; Ringach et al. 1997; Simoncelli et al. 2004). METHODS Recording and physiology The procedures for the paralyzed anesthetized preparation, the electrophysiological recording, the stimulus display, and the measurement of neural responses using systems analysis were similar to those described elsewhere (Albrecht and Geisler 1991; Albrecht et al. 2002; Geisler and Albrecht 1997; Geisler et al. 2001; Hamilton et al. 1989; Metha et al. 2001). All experimental procedures were approved by the University of Texas at Austin Institutional Animal Care and Use Committee, and conform to the National Institutes of Health guidelines. In brief, young adult cats (Felis domesticus) and monkeys (Macaca fascicularis or Macaca mulatta) were prepared for recording under deep isoflurane anesthesia. Following the surgical procedures, isoflurane anesthesia was discontinued. Anesthesia and paralysis were maintained throughout the duration of the experiment using the following pharmaceuticals. For cats, anesthesia was maintained with sodium pentothal (2 6 mg kg 1 h 1 ). For monkeys, anesthesia was maintained with sufentanil citrate (2 8 g kg 1 h 1 ). For both species, paralysis was maintained with gallamine triethiodide (10 mg kg 1 h 1 ) as well as pancuronium bromide (0.1 mg kg 1 h 1 ). The physiological state of the animal was monitored throughout the experiment by continuous measurement of the following quantitative indices: body temperature, inhaled/exhaled respiratory gases, pressure in the airway, fluid input, urine output, urinary ph, caloric input, blood glucose level, electroencephalogram, and electrocardiogram. Microelectrodes were inserted into regions of the striate visual cortex such that the receptive fields of the neurons were located within 5 of the visual axis. Three different types of microelectrodes were used: varnish-insulated tungsten, glass pipette, or glass-coated platinumiridium. The impedances of the microelectrodes ranged from 8 to 21 M. Action potentials were collected with a temporal accuracy of 0.1 ms and then binned to produce a poststimulus time histogram (PSTH). Note that within this report, and elsewhere (Albrecht et al. 2002), we use the terms PSTH and temporal response profile interchangeably. The bin size for the PSTH was 10 ms, and this average (centered within the 10-ms time bin) was computed every millisecond: a 10-ms running average evaluated at every millisecond throughout the entire time course of the response (cf. De Valois and Pease 1973; Enroth- Cugell and Robson 1966; Gerstein 1960; Levick and Zacks 1970). Note that for some analyses (as will be noted, when appropriate), the PSTH bin size was 1 ms. Stimulus presentation The stimuli were presented on a monochrome Image Systems monitor at a frame rate of 100 Hz, with a mean luminance of 27.4 cd/m 2. To overcome the nonlinearities inherent in visual displays, both hardware and software methods were used to ensure a linear relationship between the requested luminance and the measured luminance. The precision of these methods to overcome the nonlinearities in the visual display was assessed through quantitative measurements that were performed before, during, and after each experiment. Preliminary measurements Before the main experimental protocol, several preliminary experiments were performed, using drifting gratings, to determine the optimal orientation, spatial frequency, temporal frequency, and direction of motion. First, the optimal parameters for these 4 dimensions were determined in a qualitative fashion by adjusting the stimulus and listening to the spike trains. Second, the optimal parameters were determined quantitatively by drifting 10 contiguous cycles of each stimulus along a given dimension. The response measure was the average rate of firing. The presentation sequence of the stimulus dimensions was: temporal frequency, orientation, spatial frequency,
3 SPATIAL FREQUENCY TEMPORAL DYNAMICS 2609 and contrast. The responses were plotted on-line and the optimal values were determined. Third, step two was repeated with 4 randomly interleaved repetitions of 10 contiguous cycles of each stimulus along a given dimension. Finally, the contrast response function was measured using stationary gratings, as described in Albrecht et al. (2002). For the dimension of contrast, the minimum detectable contrast, half-saturation contrast, and saturation contrast (i.e., the contrast above which further increases in contrast produce little or no further increases in response) were determined (cf. Albrecht and Hamilton 1982; Bonds 1991; McLean and Palmer 1996; Sclar et al. 1990). In all of the experiments reported here, the stimuli were confined to the conventional receptive field, which was determined by expanding the size (the length and the width separately) of an optimal drifting sine wave grating (presented at a saturating contrast) until the neuron s response stopped increasing (DeAngelis et al. 1994; De Valois et al. 1985). The contrast of the grating was held constant over the conventional receptive field; the windowing function was one half of one cycle of a cosine (0 to 180 ). The function was shifted and scaled to vary between one and zero, thus gradually modulating the contrast at the boundaries. The degree of direction selectivity was measured (Albrecht and Geisler 1991). Cells were classified as simple cells or complex cells using the criteria described by De Valois et al. (1982) as well as Skottun et al. (1991). Specifically, cells were classified as complex cells if the magnitude of the average rate of firing exceeded the magnitude of the first harmonic response. These measurements were performed in 3 monkeys and 3 cats. (Note that the same animals, and oftentimes the same cells, were also used for other stimulus protocols.) The cell types were distributed as follows: 25 monkey cells (18 complex; 7 simple) and 39 cat cells (24 complex; 15 simple). Stimulus protocol: stationary gratings at different spatial frequencies and phases Following the preliminary experiments, optimal stationary grating patterns were presented at a saturating contrast level (which was determined for each cell), in 8 different spatial phases, each separated by 45. Twelve different spatial frequencies were presented; the range of these frequencies was determined based on the responses to drifting gratings such that frequencies on either side of the preferred frequency were sampled. Each of these 12 frequencies was presented at each of the 8 spatial phases, making a total of 96 unique combinations of phase and spatial frequency. Each unique combination was turned on (flashed) for 200 ms and then turned off for 300 ms, with a minimum of 40 repeated presentations (and a maximum of 80). During the 300-ms interval, when the stationary grating was turned off, the animal viewed the mean luminance. As described in detail below, this interstimulus interval (ISI) was introduced to minimize potential interactions between the sequential stimuli. The stimuli were presented in a counterbalanced fashion such that all stimulus conditions were presented an equal number of times, in a random order. With 40 repeated presentations of each condition, this stimulus protocol required about 30 min to complete. The 300-ms ISI was introduced for several reasons. First, this interval permits recovery from any short-term pattern adaptation (Müller et al. 1999, 2001) or rapid local light adaptation (Adelson 1982; Crawford 1947; Geisler 1981; Hayhoe et al. 1987; Saito and Fukada 1975; for reviews see Hood 1998; Shapley and Enroth-Cugell 1984). Second, as will be shown in the RESULTS, for most cells, the latency of the response increases as the spatial frequency increases; thus if the stimuli are presented in close temporal proximity, then the responses to the 2 stimuli might overlap in time. For example, if a high spatial frequency is presented just prior to a low spatial frequency, with no ISI, the responses to the 2 stimuli will overlap in time (or even reverse order). Third, when a stationary stimulus is turned off, many cells produce large OFF responses that could overlap in time with the ON responses to a subsequent stimulus presented contiguously. In some cases, these OFF responses are larger than the ON responses and they can last nearly as long as the ON responses; none of the OFF responses in this sample lasted as long as 300 ms. Separating the stimuli by 300 ms precludes any of these problems. Presenting the grating in 8 different spatial phases ensures that 1) the space average luminance remains equivalent throughout the course of the experiment over the entire receptive field, 2) both optimal and nonoptimal spatial phases are sampled, and 3) many different regions of the receptive field are stimulated with different luminance increments and decrements. Further, presenting the stationary grating in 8 different spatial phases, and then computing the average, minimizes the potential errors that are introduced by not having the origin of the stimulus located at the exact center of the receptive field. Minor offsets, or any residual eye movements (cf. Forte et al. 2002), can potentially introduce substantial errors in the estimates of the spatial frequency tuning. For example, simulations (RA Frazor, unpublished observations) show that if the origin of the stimulus (i.e., the location where all spatial frequencies are aligned in the same phase) is offset from the center of the receptive field (which is not easy to measure with a high degree accuracy; cf. Albrecht 1995; Hamilton et al. 1989) by as little as a quarter of a cycle, then the estimate of the peak spatial frequency will be off by 0.5 octaves and the estimate of the bandwidth will be off by 10%. The simulations also show that these errors are eliminated by averaging across the 8 spatial phases. Finally, given that we are averaging the PSTHs across all of the spatial phases (for a given spatial frequency), it is important to point out that we have performed an analysis to assess the degree of any systematic variation in the overall shape of the PSTHs (for both simple and complex cells) at the different spatial phases (see Analysis of the variation in the PSTHs at different spatial phases, in the METHODS section of Albrecht et al. 2002). In general, we found that, although the amplitude of the response often varied as a function of spatial phase, the shape of the temporal response profile (i.e., the PSTH) was relatively invariant as a function of spatial phase. Approximately 95% of the variation across all 8 spatial phases could be accounted for by simply scaling the amplitude of the average of all 8 spatial phases. This observation held true for both simple and complex cells. Further, as noted in that report, there were no obvious trends in the amount of variance accounted for across animal type or cell type. Given that there is very little systematic residual variation (the median value was 4.2%) in the overall shape of the PSTHs as a function of spatial phase (compared with the average across spatial phase), and for the reasons discussed in the preceding paragraph, it therefore seemed reasonable to average the responses across spatial phase for both complex cells and simple cells. The stimulus protocol, saccades, and saccadic suppression Although the 200-ms presentation interval provides a good approximation to the average duration of a single fixation in humans, macaque monkeys, and cats (Evinger and Fuchs 1978; Fuchs 1967; Stryker and Blakemore 1972; for general reviews see Carpenter 1991; Ditchburn 1973), the 300-ms ISI does not provide a good approximation to the average duration of a single saccade. In comparison to humans, macaque monkeys make faster saccades (25 55 ms; Fuchs 1967) and cats make slower saccades ( ms; Evinger and Fuchs 1978). Note, however, that because visual cortex neurons are so selective along many different stimulus dimensions, it is highly unlikely that any single neuron will be stimulated during every fixation while viewing a complex natural image (see Geisler and Albrecht 1997; their Fig. 13 and related text). In fact, it is highly likely that there will be many fixations in between. We chose 300 ms to minimize interactions between stimuli and to maximize data collection. Another way in which this experimental protocol does not approximate normal saccadic inspection of a visual scene stems from the fact that the eyes are paralyzed and thus there is a lack of coordination between the time course of the stimulus presentation protocol and any
4 2610 FRAZOR, ALBRECHT, GEISLER, AND CRANE potential saccadic suppression signals, which might be generated by a corollary discharge from an oculomotor mechanism that produces saccadic eye movements. However, although saccadic suppression has been demonstrated psychophysically in the visual system as a whole (e.g., Campbell and Wurtz 1978; Riggs et al. 1974; Volkmann et al ; however, see Carpenter 1991; Greenhouse and Cohn 1991), physiological experiments in awake behaving monkeys suggest that saccadic suppression does not appear to be a factor at the level of the striate cortex (Bair and O Keefe 1998; Gur and Snodderly 1997; Gur et al. 1997; Judge et al. 1980). Quantitative index of the spatial frequency shift As will be shown in the RESULTS, for most cells the latency of the response increases as a function of spatial frequency. This fact, coupled with the transient nature of the PSTH, produces a shift in the peak of the spatial frequency tuning through time from low frequencies to high frequencies. In general, this pattern of results is systematic and robust within the large-amplitude initial transient component of the temporal response profile for all of the cells that show a frequency shift, and thus the pattern of results can be described during this interval with a reliable, quantitative index: the peak of the spatial frequency response function during this interval. However, because there is a great deal of heterogeneity in the shapes of the temporal response profiles from cell to cell (see Albrecht et al. 2002; Figs. 4 and 5), the pattern of results following the initial transient varies from cell to cell and becomes more difficult to describe in a systematic, unified fashion. To be more specific, as the amplitude of the response decreases through time following the initial transient, the trends in the frequency shifts become more complex from cell to cell. Further, the responses are more variable within each cell because the amplitude is reduced and thus the signal-to-noise ratio is also reduced, as a consequence of the mean variance relationship (for a review, see Geisler and Albrecht 1997). For example, for those cells that show a trough after the initial transient, the same trends that are observed during the initial transient are generally repeated in the rise to the sustained component. For those cells that do not show a prominent trough, and for those cells that show a small-amplitude sustained component, no systematic trends can be observed in the spatial frequency tuning following the initial transient, although presumably, the frequency and latency shifts are present during this interval as well. For these reasons, the quantitative index of the shift in the peak of the spatial frequency response function (i.e., the spatial frequency that produced the largest response) was restricted to the large-amplitude initial transient component of the temporal response profile, and the extent of this interval was determined in a qualitative fashion for each individual cell. Specifically, the interval began when the responses to the frequency with the shortest latency exceeded the spontaneous activity and the interval ended when the responses to the frequency with the longest latency reached a local minimum. For this sample of cells, the mean value of the duration of the initial transient component is 41.3 ms (SD 17.7). It should be noted that the determination of the extent of the initial transient component, in addition to the specific range of spatial frequencies that was sampled, could affect the estimates of the magnitude of the frequency and latency shifts, given in Fig. 7 and Table 1, for this sample of neurons. Statistical analysis of trends TABLE 1. Population statistics for the frequency and latency shifts Mean Median SE Frequency Shift (in octaves) All neurons Monkey Cat All neurons Simple* Complex* Monkey neurons Simple Complex Cat neurons Simple* Complex* Latency Shift (in ms) All neurons Monkey Cat All neurons Simple Complex Monkey neurons Simple Complex Cat neurons Simple Complex * Indicates that the pairwise comparison (in Tables 1 and 2) is statistically significant at the 0.05 level of confidence. Given the inherent variability within the responses of visual cortex neurons, and the finite number of repeated presentations of any given stimulus, it is possible that observed patterns in the responses are a consequence of random variation as opposed to systematic variation. To determine the likelihood that the observed variation in the responses is a consequence of chance alone we assess the sampling distribution that would be expected by chance alone (see, e.g., Albrecht et al. 2002; Edgington and Bland 1993; Gallant et al. 1996; Müller et al. 2001; for a general discussion see Edgington 1995). In this report, we use this statistical analysis to assess the degree to which PSTHs for a given cell are invariant across spatial frequency. Specifically, we compute the average PSTH and then scale and shift this average to fit the PSTH for each spatial frequency. To determine the amount of residual variation (following scaling and shifting the average PSTH) that would not be expected from chance alone, we performed the following analysis. First, the PSTH was averaged across all spatial frequencies, without any scaling. Second, the average PSTH was scaled and shifted to fit the measured responses at each spatial frequency. Third, the relationship between the mean rate of firing and the variance was measured. With these properties measured (the average PSTH, the optimized values for the scaling and shifting, and the mean variance relationship), the following statistical analysis was performed. 1) Random variation was introduced around the scaled and shifted average PSTH for each spatial frequency (given the mean variance relationship and the exact number of repeated presentations). 2) These new-randomized PSTHs were then averaged across spatial frequency. 3) The new-randomized average PSTH was scaled and shifted to fit the new-randomized PSTH for each spatial frequency. 4) The percentage of variation accounted for was computed. 5) Steps 1 4 were repeated on 10,000 occasions to obtain the sampling distribution for the estimate of the residual variation that would be expected based on the specific properties of each cell under the null hypothesis that there was no systematic variation in the shape of the PSTH across spatial frequency. We also use this statistical analysis to assess whether the observed latency and frequency shifts are greater than what would be expected by chance alone. Specifically, for each individual neuron in the sample, the average PSTH was scaled and shifted to fit the measured responses at each spatial frequency; in so doing, the latency and frequency shifts were removed. Then, random variation was introduced around the scaled and shifted average PSTH for each spatial
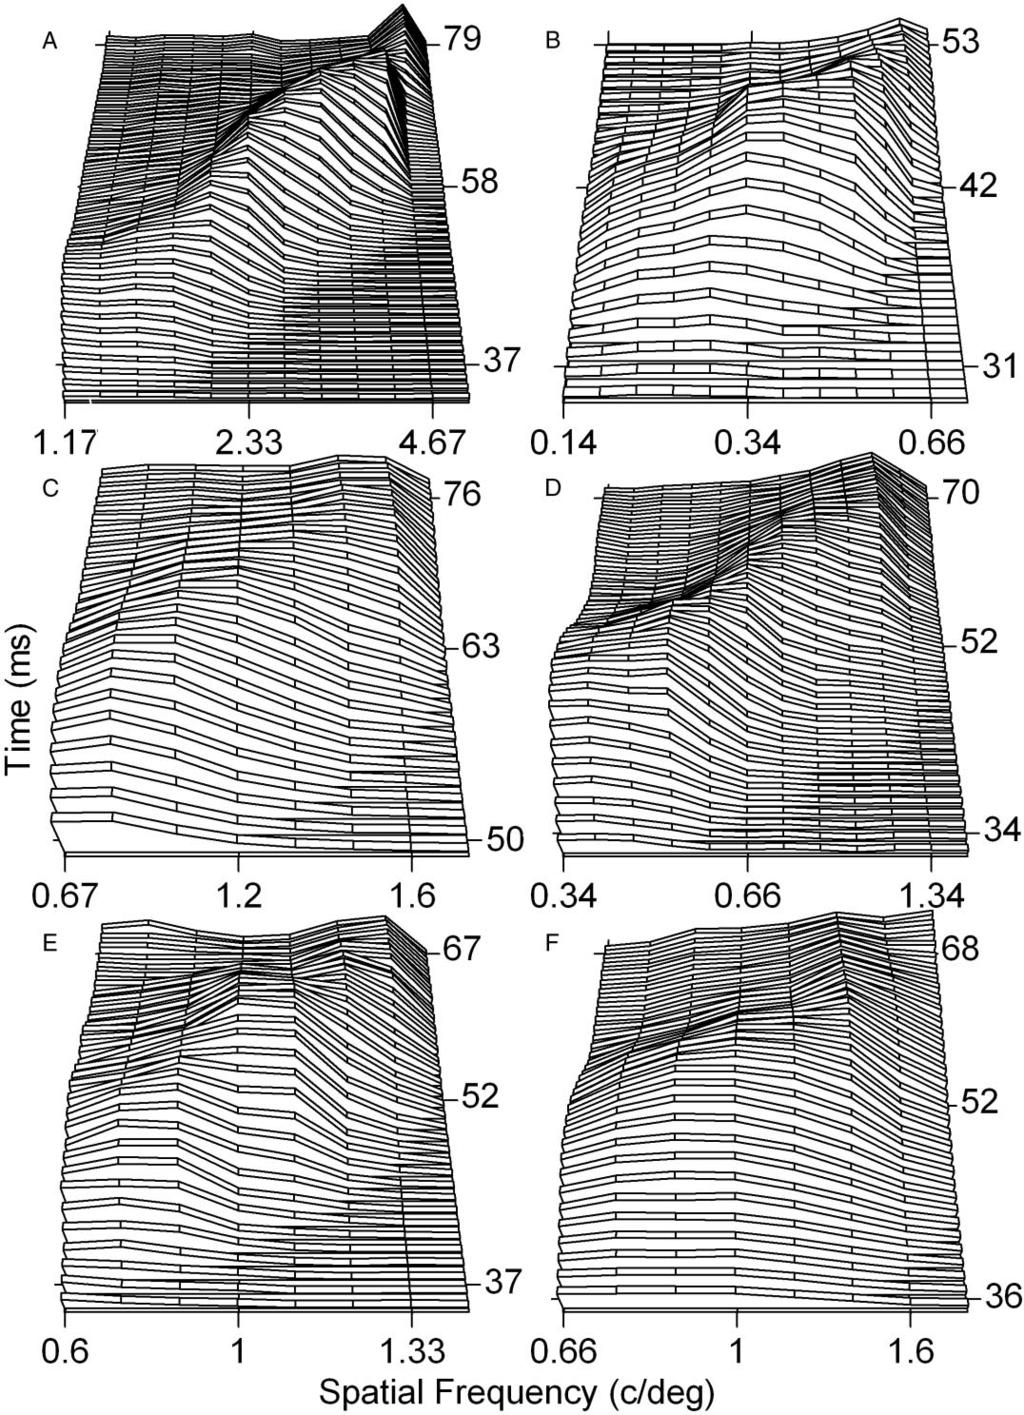
5 SPATIAL FREQUENCY TEMPORAL DYNAMICS 2611 frequency (given the mean variance relationship and the exact number of repeated presentations). Finally, the latency and frequency shifts were measured. This procedure was repeated on 10,000 occasions to obtain the sampling distributions for the latency and frequency shifts that would be expected based on the specific properties of each cell under the null hypothesis that there was no latency or frequency shift. Detection performance as a function of the integration interval Detection performance was measured using methods that are similar to those described in detail elsewhere (Albrecht et al. 2002; Geisler and Albrecht 1995, 1997; see also Müller et al. 2001; Tolhurst et al. 1983; for a general discussion within this context see Barlow 2003). Specifically, the signal-to-noise ratio was measured as a function of the interval of integration following response onset. The signal-to-noise ratio d is equal to the absolute value of the difference in the means divided by the square root of the average variance. Detection accuracy is related to d by the standard normal integral; when d is equal to 1.0, this is equivalent to 75% correct detection in a 2 alternative forced choices task (see Green and Swets 1966). To measure this detection performance, the following analysis was performed, using PSTHs where the bin size was 1 ms (not 10 ms). First, the PSTH for the optimal spatial frequency was averaged across all spatial phases. Second, this average PSTH was scaled to match the response at the optimal spatial phase. (The average PSTH was used because it is the most reliable measure of the PSTH shape; see RESULTS.) Third, we measured the relationship between the response mean and the response variance for each integration interval; that is, the variance proportionality constant (see Geisler and Albrecht 1997). Fourth, using this scaled PSTH and the variance proportionality constant, we determined the mean and the SD of the responses within the scaled PSTH for temporal intervals that increased in 1-ms steps, starting at the point in time when the responses to the preferred spatial frequency began (i.e., when we determined that the response appeared to be greater than the spontaneous rate of firing). Finally, the signalto-noise ratio was determined for each interval relative to the mean and SD of the spontaneous rate of firing (i.e., the base rate), measured over the same time interval. In so doing, this procedure assesses the ability of the cell to detect its optimal spatial frequency and phase in comparison to no stimulus. RESULTS The goal of the present set of experiments was to measure the development of spatial frequency tuning of visual cortex neurons, on a fine time scale, over the course of a temporal interval comparable to the duration of a single fixation during normal saccadic inspection of a visual scene. With this goal in mind, we measured and analyzed the responses of 64 striate visual cortex neurons (39 neurons recorded from within area 17 of the cat visual cortex and 25 neurons recorded from within area V1 of the monkey visual cortex), as a function of spatial frequency. The stimuli were stationary grating patterns that were turned on for 200 ms and then turned off for 300 ms. Twelve different spatial frequencies were each presented in 8 different spatial phases; the PSTH at each spatial frequency was averaged across the repetitions at each spatial phase and then the PSTH was averaged across all of the 8 spatial phases. PSTH as a function of spatial frequency Figure 1 shows the responses of 3 neurons recorded from within the monkey visual cortex (A, C, and E), and 3 neurons recorded from within the cat visual cortex (B, D, and F), measured over the course of a 200-ms interval, for different spatial frequencies. Each curve shows the PSTH for a particular spatial frequency, evaluated at 1-ms intervals using a 10-ms running average (see METHODS). The systematic trends in the initial transient component are more easily seen in Fig. 2 responses of the same cells plotted on a restricted time scale. Visual inspection of the responses illustrated in Figs. 1 and 2 reveals the following. First, in general, when visual cortex neurons are presented with a stationary grating pattern, there is an initial large-magnitude transient component followed by a smaller-magnitude sustained component (Albrecht et al. 2002; Müller et al. 1999, 2001; Tolhurst et al. 1980). Second, for many of the neurons, there is a brief trough in the firing rate between the transient and the sustained component, as described in previous reports (Albrecht et al. 2002; Müller et al. 2001; Tolhurst et al. 1980). Approximately half of the cells in this sample show a trough; for some cells the trough is very small and for other cells it is quite pronounced. Third, the shapes of the temporal response profiles for the different spatial frequencies appear to be qualitatively similar: they appear to differ by a vertical scaling of the magnitude and a horizontal shift in time. Fourth, as will be shown, the horizontal shift is systematic: for most neurons, as the spatial frequency increases, the latency increases. Spatial frequency tuning through time Figure 3 shows 3-dimensional plots ( ribbon-plots ) of the measured responses illustrated in Figs. 1 and 2. Spatial frequency is plotted along the x-axis, time is plotted along the y-axis, and response magnitude is plotted along the z-axis. Note that there is no smoothing of the 10-ms time bins in these plots. Thus for example, in Fig. 3A, there are 432 discrete measured average responses; that is, the average responses to 12 spatial frequencies measured over 36 time bins, with each bin being the average response to 320 repetitions of the same spatial frequency at that point in time. These plots illustrate the changes in spatial frequency tuning that occur over time. As can be seen, these frequency time plots are tilted diagonally to the right, indicating that spatial frequency tuning shifts from low frequencies to high frequencies through time. Early in time, tuning is restricted to low frequencies and there are no responses to high frequencies. Later in time, tuning is primarily restricted to high frequencies because the responses to low frequencies are greatly diminished. This pattern of results corresponds to 1) the fact that the latency of the response to low spatial frequencies is shorter than the latency of the response to high frequencies and 2) the fact that the responses to all spatial frequencies are transient (cf. the transient responses illustrated in Figs. 1 and 2). For example, in Fig. 3A, atthe early time intervals, the tuning is restricted to low frequencies because the responses to high frequencies are delayed and thus those responses are not yet contributing (cf. Fig. 2A); conversely, later in time, the tuning is primarily restricted to high frequencies because the responses to low frequencies have decayed and thus those responses are no longer contributing as strongly. To quantify the changes that occur in the spatial frequency tuning through time, we determined the spatial frequency that produced the largest response at sequential intervals through-
6 2612 FRAZOR, ALBRECHT, GEISLER, AND CRANE
7 SPATIAL FREQUENCY TEMPORAL DYNAMICS 2613 out the initial transient response. Figure 4 plots this index of the spatial frequency shift for the same six cells. To quantify the changes that occur in the latency of the response for different spatial frequencies, we measured the time from stimulus onset to the peak of the response for each spatial frequency (i.e., the peak of the PSTH for each frequency). Figure 5 plots this index of the latency shift for the same 6 cells. These two figures quantify the trends that can be seen qualitatively in Figs Once again, as the spatial frequency increases, the latency increases, and thus through time, the spatial frequency tuning shifts from low spatial frequencies to high spatial frequencies. The pattern of results illustrated in Figs. 4 and 5 is representative of the cells in this sample as a whole. Specifically, for those cells that show a frequency shift and latency shift, there is a continuous increase in the latency as a function of spatial frequency. Some cells show little or no latency shift It is important to point out that the pattern of results illustrated in Figs. 1 5 is not representative of all of the neurons in the sample. Specifically, some of the neurons do not show any shift in the latency as a function of spatial frequency, whereas other neurons show only a minor shift. None of the neurons in this sample showed a statistically significant negative shift (see analysis given below). Figure 6 plots the responses of a neuron for which the latency of the response is essentially equivalent for the 12 different spatial frequencies (which in this case spanned a relatively large range: 2.6 octaves). As can be seen, for this neuron there is little, if any, latency or frequency shift. This observation holds for other cells as well. Spatial frequency shift and latency shift for all of the neurons in the sample The spatial frequency shift through time can be quantified for the entire sample of neurons by measuring the difference between the peak spatial frequency at the beginning and at the end of the large-amplitude initial transient component (see METHODS). Figure 7A plots this quantitative index of the frequency shift (expressed in terms of octaves) for the entire sample of neurons. As can be seen, the frequency shift is small for some cells and large for others, with a virtual continuum in between. Across the sample as a whole, the frequency shift is approximately one octave (mean 0.91; median 0.99). The breakdown of the frequency shift across animal type and cell type is given in Table 1; the asterisks indicate pairwise comparisons that are statistically significant at the 0.05 level of confidence (using a t-test). Using a randomization test (see METHODS), we determined that the frequency shifts for 20 of the 64 neurons fall within the 95% confidence interval expected from chance alone (i.e., for these 20 neurons the shifts are not statistically significant). Of these 20 neurons, 3 are monkey simple cells, 4 are monkey complex cells, 7 are cat simple cells, and 6 are cat complex cells. The median frequency shift for these cells is 0.09 octaves. The latency shift can be quantified for the entire sample of neurons by measuring the difference between the latency for the lowest and highest spatial frequencies. Figure 7B plots this quantitative index of the latency shift for the entire sample of neurons. As can be seen, the latency shift is small for some cells and large for others, with a virtual continuum in between. Across the sample as a whole, the latency shift is approximately 30 ms (mean 32.8 ms; median 31.8 ms). The breakdown of the latency shift across animal type and cell type is given in Table 1. Using a randomization test (see METHODS), we determined that the latency shifts for 5 of the 64 neurons are not statistically significant. Of these 5 neurons, 1 is a monkey complex cell, 2 are cat simple cells, and 2 are cat complex cells. The median latency shift for these cells is 5.3 ms. Average PSTH as a function of spatial frequency In a previous investigation (Albrecht et al. 2002), we measured the responses of visual cortex neurons as a function of contrast using a stimulus protocol that was similar to the protocol used in this investigation (i.e., the stimuli were stationary gratings that were flashed on for 200 ms and off for 300 ms). In that study, we found that the shape of the temporal response profile (the PSTH) was relatively invariant as a function of contrast. Specifically, we found that, across the sample as a whole, approximately 95% of the variation in the responses as a function of contrast could be accounted for by simply shifting and scaling the average PSTH. Visual inspection of the responses shown in Fig. 1 within this report suggests that the temporal response profiles for these cells are qualitatively similar across spatial frequency. To assess this observation quantitatively for all of the neurons, we calculated the percentage of variation that could be accounted for by simply scaling and shifting the average PSTH. Across FIG. 1. The responses of 6 neurons, plotted as a function of time and spatial frequency. Stimulus was a stationary grating presented for a brief interval, comparable to the duration of a single fixation (200 ms). The interstimulus interval (ISI) was 300 ms. Twelve different spatial frequencies were presented in 8 different spatial phases. Each unique spatial frequency and phase combination was presented on 40 separate occasions, in a random fashion. Responses at a given spatial frequency were averaged across the repetitions and the spatial phases. A: responses measured for a neuron recorded from within the monkey visual cortex: poststimulus time histograms (PSTHs) are plotted for 12 different spatial frequencies: 1.17, 1.24, 1.4, 1.56, 1.87, 2.33, 2.8, 3.11, 3.5, 3.73, 4.67, and 5.6 cycles/deg. Note that for each PSTH there is a large magnitude initial transient component followed by a brief trough and a subsequent return to a smaller-magnitude sustained component. Further, note that the shapes of the PSTHs are qualitatively similar across the different spatial frequencies; however, as spatial frequency changes, the PSTHs appear to scale vertically and shift horizontally. C and E: responses of 2 additional monkey neurons. The same basic pattern of results is evident. The spatial frequencies presented to the cell in C were: 0.67, 0.8, 1.0, 1.2, 1.33, 1.5, 1.6, 2.0, 2.4, 2.67, 3.0, and 4.0 cycles/deg. Spatial frequencies presented to the cell in E were: 0.6, 0.67, 0.8, 1.0, 1.07, 1.20, 1.33, 1.6, 2.0, 2.4, 2.67, and 3.0 cycles/deg. B, D, and F: responses for 3 neurons recorded from within the cat visual cortex. Once again, the shapes of the PSTHs for each cell appear to be relatively invariant and, although it is somewhat difficult to visualize, as spatial frequency changes, the PSTHs appear to scale vertically and shift horizontally. Spatial frequencies presented to the cell in B were: 0.14, 0.18, 0.2, 0.22, 0.26, 0.34, 0.36, 0.4, 0.44, 0.54, 0.66, and 0.80 cycles/deg. Spatial frequencies presented to the cell in D were: 0.34, 0.36, 0.4, 0.44, 0.54, 0.66, 0.8, 0.88, 1.0, 1.06, 1.34, and 1.6 cycles/deg. Spatial frequencies presented to the cell in F were: 0.66, 0.8, 0.88, 1.0, 1.06, 1.34, 1.6, 1.78, 2.0, 2.66, 3.2, and 4.0 cycles/deg.
8 2614 FRAZOR, ALBRECHT, GEISLER, AND CRANE
9 SPATIAL FREQUENCY TEMPORAL DYNAMICS 2615 the sample as a whole, approximately 90% of the variation can be accounted for by shifting and scaling the average temporal response profile (median value 92%; mean value 89%). To assess whether the residual variation is random, as opposed to systematic, we performed a statistical analysis (see METH- ODS). The results of this analysis reveal that for 7 of the 64 neurons the residual variation is indeed statistically significant at the 99% confidence level. In other words, for these 7 neurons (all monkey complex cells), there are systematic changes in the shapes of the temporal response profiles as a function of spatial frequency. However, it is important to note that the magnitude of this systematic residual variation is relatively small: both the mean and the median value are approximately 3%. At the 95% confidence level, 14 of the 64 neurons (9 monkey complex cells and 5 cat complex cells) show systematic deviations from the average temporal response profile; the magnitude of the systematic deviation for these 14 neurons is about 2%. These results suggest that the spatial frequency shifts that can be seen in Fig. 3 are a consequence of 1) the latency shift as a function of spatial frequency, coupled with 2) the transient nature of the invariant temporal response profile. Further, these results have an important implication: If the latency shift is taken into consideration and the PSTHs are aligned, then the shape of the spatial frequency tuning function is relatively invariant (cf. Figs. 2, 3, 6, 9, and 10 in Albrecht et al. 2002). Temporal integration strategies and spatial frequency tuning The complex changes in the spatial frequency response function that occur through time could potentially provide information to subsequent neurons beyond what is contained in the total spike count, summed over the duration of a single fixation. Whether this additional information is extracted by subsequent neurons depends on how the responses are integrated. Therefore it is worth considering the consequences of several different temporal integration strategies that could, in principle, be used by subsequent neurons. One strategy would be to integrate the responses of visual cortex neurons over relatively brief temporal intervals. Consider, for example, the effect of integrating over specific 10-ms time intervals for the cell illustrated in Fig. 3A. When the running 10-ms integration interval is centered at 40 ms, as opposed to 60 ms, the spatial frequency tuning is considerably different; the ranges of spatial frequencies covered are almost nonoverlapping. Further, the bandwidths of these tuning functions for these brief integration intervals would be only a fraction of the bandwidth for a long integration interval. In general, as the integration intervals become longer, these changes in spatial frequency tuning become smaller (although the responses become more reliable; see detection analysis, below). Next, consider the strategy of integrating (summing action potentials) over intervals that begin at a fixed point in time: at stimulus onset, or at some point after stimulus onset. Here we consider the effects of increasing the duration of the summation interval on spatial frequency tuning. We take the beginning of the intervals to be the time at which the shortest latency responses begin. Figure 8 plots the spatial frequency tuning for progressively longer integration intervals, increasing in 1-ms steps, for the 6 neurons illustrated in Fig. 1. (Note that in this analysis the bin size for the PSTHs is 1 ms, not 10 ms.) The smooth curve through the data points, at each sequential integration interval, shows the best fit of a function that provides a good description of the spatial frequency tuning of visual cortex neurons (an asymmetrical Gabor function; see Geisler and Albrecht 1995, 1997). For example, to be even more specific, consider the cell shown in Fig. 8A. The first set of data points and the fitted curve at the bottom of the panel, show the spatial frequency tuning when the responses are integrated over only 1 ms, starting at 40 ms (see figure caption); the second set of data points and fitted curve, just above the lowermost one, show the spatial tuning when the responses are integrated over a total of 2 ms (i.e., 40 and 41 ms); the integration interval for the next set includes 40, 41, and 42 ms, for a total of 3 ms, and so forth. As the integration interval increases, the spatial frequency tuning is initially dynamic for very short integration intervals and then becomes relatively stable for longer, but still brief, integration intervals. For the first integration interval, with a duration of 1 ms, the peak spatial frequency is 0.89 cycles/deg, whereas for the integration interval with a duration of 20 ms, the peak frequency is 2.11 cycles/deg. After this point in time, the peak frequency changes very little; for example, when the integration process is extended to 200 ms (not shown in the figure), the peak frequency is 2.26 cycles/deg. Although these two integration strategies are plausible, there are many other strategies that could be used by subsequent neurons. For example, a subsequent neuron might not begin the integration process at a fixed point in time; instead, the neuron might begin the integration process when the response exceeds a threshold criterion. When this integration strategy is used, the dynamic changes in spatial frequency tuning are greatly diminished. We explored a variety of different integration strategies and found that they can produce different results when the integration interval is small; however, once the integration interval exceeds approximately ms, the different strategies produce similar results (i.e., the dynamic changes in spatial frequency tuning are greatly reduced). In the APPENDIX, we introduce a simple, atheoretical mathematical model that provides a good fit to the temporal dynamics of the spatial frequency response function. This descriptive function model could prove useful for assessing the effects of integration strategies not considered here. Effect of the integration interval on detection performance For most visual cortex neurons, a large fraction of the action potentials to stationary stimuli occurs during the initial transient component of the PSTH (cf. Fig. 1; see also Albrecht et al. 2002; Müller et al. 1999, 2001; Tolhurst et al. 1980). Given this observation, it is possible that reliable information could FIG. 2. The large-amplitude initial transient component of the responses of the cells shown in Fig. 1. The time scale is restricted to the initial transient portion of the responses to facilitate visualization of the rapid dynamic changes that occur as a function of spatial frequency during this time frame. Each point is the average response that occurred within a running 10-ms time bin, plotted in 1-ms increments. Note that 1) the shapes of the PSTHs for each cell are relatively invariant as a function of spatial frequency, 2) the magnitude of the response changes as a function of spatial frequency, and 3) the latency of the response changes as a function of spatial frequency. As will be shown in Figs. 3, 4, and 7, this shift in the latency of the response is systematic: as the spatial frequency increases, the latency increases.
10
Motion direction signals in the primary visual cortex of cat and monkey
 Visual Neuroscience (2001), 18, 501 516. Printed in the USA. Copyright 2001 Cambridge University Press 0952-5238001 $12.50 DOI: 10.1017.S0952523801184014 Motion direction signals in the primary visual
Nonlinear processing in LGN neurons
 Nonlinear processing in LGN neurons Vincent Bonin *, Valerio Mante and Matteo Carandini Smith-Kettlewell Eye Research Institute 2318 Fillmore Street San Francisco, CA 94115, USA Institute of Neuroinformatics
We (1 4) and many others (e.g., 5 8) have studied the
 and many others (e.g., 5 8) have studied the") Some transformations of color information from lateral geniculate nucleus to striate cortex Russell L. De Valois*, Nicolas P. Cottaris, Sylvia D. Elfar*, Luke E. Mahon, and J. Anthony Wilson* *Psychology
Some transformations of color information from lateral geniculate nucleus to striate cortex Russell L. De Valois*, Nicolas P. Cottaris, Sylvia D. Elfar*, Luke E. Mahon, and J. Anthony Wilson* *Psychology
M Cells. Why parallel pathways? P Cells. Where from the retina? Cortical visual processing. Announcements. Main visual pathway from retina to V1
 Announcements exam 1 this Thursday! review session: Wednesday, 5:00-6:30pm, Meliora 203 Bryce s office hours: Wednesday, 3:30-5:30pm, Gleason https://www.youtube.com/watch?v=zdw7pvgz0um M Cells M cells
Neuronal responses to plaids
 Vision Research 39 (1999) 2151 2156 Neuronal responses to plaids Bernt Christian Skottun * Skottun Research, 273 Mather Street, Piedmont, CA 94611-5154, USA Received 30 June 1998; received in revised form
Substructure of Direction-Selective Receptive Fields in Macaque V1
 J Neurophysiol 89: 2743 2759, 2003; 10.1152/jn.00822.2002. Substructure of Direction-Selective Receptive Fields in Macaque V1 Margaret S. Livingstone and Bevil R. Conway Department of Neurobiology, Harvard
Monocular and Binocular Mechanisms of Contrast Gain Control. Izumi Ohzawa and Ralph D. Freeman
 Monocular and Binocular Mechanisms of Contrast Gain Control Izumi Ohzawa and alph D. Freeman University of California, School of Optometry Berkeley, California 9472 E-mail: izumi@pinoko.berkeley.edu ABSTACT
Spectro-temporal response fields in the inferior colliculus of awake monkey
 3.6.QH Spectro-temporal response fields in the inferior colliculus of awake monkey Versnel, Huib; Zwiers, Marcel; Van Opstal, John Department of Biophysics University of Nijmegen Geert Grooteplein 655
Space-Time Maps and Two-Bar Interactions of Different Classes of Direction-Selective Cells in Macaque V-1
 J Neurophysiol 89: 2726 2742, 2003; 10.1152/jn.00550.2002. Space-Time Maps and Two-Bar Interactions of Different Classes of Direction-Selective Cells in Macaque V-1 Bevil R. Conway and Margaret S. Livingstone
Comparison Among Some Models of Orientation Selectivity
 Comparison Among Some Models of Orientation Selectivity Andrew F. Teich and Ning Qian J Neurophysiol 96:404-419, 2006. First published Apr 19, 2006; doi:10.1152/jn.00015.2005 You might find this additional
Spectrograms (revisited)
") Spectrograms (revisited) We begin the lecture by reviewing the units of spectrograms, which I had only glossed over when I covered spectrograms at the end of lecture 19. We then relate the blocks of a
Spectrograms (revisited) We begin the lecture by reviewing the units of spectrograms, which I had only glossed over when I covered spectrograms at the end of lecture 19. We then relate the blocks of a
Research Note. Orientation Selectivity in the Cat's Striate Cortex is Invariant with Stimulus Contrast*
 Exp Brain Res (1982) 46:457-461 9 Springer-Verlag 1982 Research Note Orientation Selectivity in the Cat's Striate Cortex is Invariant with Stimulus Contrast* G. Sclar and R.D. Freeman School of Optometry,
Input-speci"c adaptation in complex cells through synaptic depression
 0 0 0 0 Neurocomputing }0 (00) } Input-speci"c adaptation in complex cells through synaptic depression Frances S. Chance*, L.F. Abbott Volen Center for Complex Systems and Department of Biology, Brandeis
A Model of Neuronal Responses in Visual Area MT
 A Model of Neuronal Responses in Visual Area MT Eero P. Simoncelli a and David J. Heeger b a Center for Neural Science 4 Washington Place, Room 809 New York, NY 10003 b Department of Psychology Stanford
Supplementary materials for: Executive control processes underlying multi- item working memory
 Supplementary materials for: Executive control processes underlying multi- item working memory Antonio H. Lara & Jonathan D. Wallis Supplementary Figure 1 Supplementary Figure 1. Behavioral measures of
Receptive fields and suppressive fields in the early visual system
 To appear in Gazzaniga, M. S., ed. (2004). The Cognitive Neurosciences (MIT Press). 1 Receptive fields and suppressive fields in the early visual system Matteo Carandini Smith-Kettlewell Eye Research Institute
A Single Mechanism Can Explain the Speed Tuning Properties of MT and V1 Complex Neurons
 The Journal of Neuroscience, November 15, 2006 26(46):11987 11991 11987 Brief Communications A Single Mechanism Can Explain the Speed Tuning Properties of MT and V1 Complex Neurons John A. Perrone Department
The Emergence of Contrast-Invariant Orientation Tuning in Simple Cells of Cat Visual Cortex
 Article The Emergence of Contrast-Invariant Orientation Tuning in Simple Cells of Cat Visual Cortex Ian M. Finn, 1,2 Nicholas J. Priebe, 1,2 and David Ferster 1, * 1 Department of Neurobiology and Physiology,
The Influence of Contrasts on Directional and Spatial Frequency Tuning in Visual Cortex Areas 17/18 of the Cat
 pissn: 1011-8942 eissn: 2092-9382 Korean J Ophthalmol 2011;25(1):48-53 DOI: 10.3341/kjo.2011.25.1.48 Original Article The Influence of Contrasts on Directional and Spatial Frequency Tuning in Visual Cortex
Temporal-frequency tuning of cross-orientation suppression in the cat striate cortex
 Visual Neuroscience (2001), 18, 941 948. Printed in the USA. Copyright 2001 Cambridge University Press 0952-5238001 $12.50 DOI: 10.1017.S0952523801186116 Temporal-frequency tuning of cross-orientation
Adaptation to contingencies in macaque primary visual cortex
 Adaptation to contingencies in macaque primary visual cortex MATTO CARANDINI 1, HORAC B. BARLOW 2, LAWRNC P. O'KF 1, ALLN B. POIRSON 1, AND. ANTHONY MOVSHON 1 1 Howard Hughes Medical Institute and Center
OPTO 5320 VISION SCIENCE I
 OPTO 5320 VISION SCIENCE I Monocular Sensory Processes of Vision: Color Vision Mechanisms of Color Processing . Neural Mechanisms of Color Processing A. Parallel processing - M- & P- pathways B. Second
The response properties of primary visual cortical (V1) neurons
 neurons") Excitatory and suppressive receptive field subunits in awake monkey primary visual cortex (V1) Xiaodong Chen*, Feng Han, Mu-ming Poo*, and Yang Dan *Institute of Neuroscience, State Key Laboratory of Neuroscience,
Excitatory and suppressive receptive field subunits in awake monkey primary visual cortex (V1) Xiaodong Chen*, Feng Han, Mu-ming Poo*, and Yang Dan *Institute of Neuroscience, State Key Laboratory of Neuroscience,
SUPPLEMENTARY INFORMATION
 doi: 10.1038/nature06105 SUPPLEMENTARY INFORMATION Supplemental #1: Calculation of LGN receptive fields and temporal scales [Accompanying Butts et al. (2007)] To draw a direct comparison between the relevant
Physiological Correlates of Perceptual Learning in Monkey V1 and V2
 J Neurophysiol 87: 1867 1888, 2002; 10.1152/jn.00690.2001. Physiological Correlates of Perceptual Learning in Monkey V1 and V2 GEOFFREY M. GHOSE, TIANMING YANG, AND JOHN H. R. MAUNSELL Division of Neuroscience
Effects of Attention on MT and MST Neuronal Activity During Pursuit Initiation
 Effects of Attention on MT and MST Neuronal Activity During Pursuit Initiation GREGG H. RECANZONE 1 AND ROBERT H. WURTZ 2 1 Center for Neuroscience and Section of Neurobiology, Physiology and Behavior,
Local Signals From Beyond the Receptive Fields of Striate Cortical Neurons
 J Neurophysiol 90: 822 831, 2003. First published April 30, 2003; 10.1152/jn.00005.2003. Local Signals From Beyond the Receptive Fields of Striate Cortical Neurons James R. Müller, 1 Andrew B. Metha, 1
Feedforward Origins of Response Variability Underlying Contrast Invariant Orientation Tuning in Cat Visual Cortex
 Article Feedforward Origins of Response Variability Underlying Contrast Invariant Orientation Tuning in Cat Visual Cortex Srivatsun Sadagopan 1,2 and David Ferster 1, * 1 Department of Neurobiology, Northwestern
Early Stages of Vision Might Explain Data to Information Transformation
 Early Stages of Vision Might Explain Data to Information Transformation Baran Çürüklü Department of Computer Science and Engineering Mälardalen University Västerås S-721 23, Sweden Abstract. In this paper
Neuron, Volume 63 Spatial attention decorrelates intrinsic activity fluctuations in Macaque area V4.
 Neuron, Volume 63 Spatial attention decorrelates intrinsic activity fluctuations in Macaque area V4. Jude F. Mitchell, Kristy A. Sundberg, and John H. Reynolds Systems Neurobiology Lab, The Salk Institute,
Formal and Attribute-Specific Information in Primary Visual Cortex
 Formal and Attribute-Specific Information in Primary Visual Cortex DANIEL S. REICH, 1,2 FERENC MECHLER, 2 AND JONATHAN D. VICTOR 2 1 Laboratory of Biophysics, The Rockefeller University; and 2 Department
Speed can go up as well as down at low contrast: Implications for models of motion perception
 Vision Research 46 (2006) 782 786 Brief communication Speed can go up as well as down at low contrast: Implications for models of motion perception Peter Thompson a, *, Kevin Brooks b, Stephen T. Hammett
Response Plasticity in Primary Visual Cortex and its Role in Vision and Visuomotor Behaviour: Bottom-up and Top-down Influences
 IETE Journal of Research Vol 49, No 2, March-April, 2003, pp Response Plasticity in Primary Visual Cortex and its Role in Vision and Visuomotor Behaviour: Bottom-up and Top-down Influences VALENTIN DRAGOI,
Selectivity and Spatial Distribution of Signals From the Receptive Field Surround in Macaque V1 Neurons
 J Neurophysiol 88: 2547 2556, 2002; 10.1152/jn.00693.2001. Selectivity and Spatial Distribution of Signals From the Receptive Field Surround in Macaque V1 Neurons JAMES R. CAVANAUGH, 2 WYETH BAIR, 1,2
Similar adaptation effects in primary visual cortex and area MT of the macaque monkey under matched stimulus conditions
 Similar adaptation effects in primary visual cortex and area MT of the macaque monkey under matched stimulus conditions Carlyn A. Patterson, Jacob Duijnhouwer, Stephanie C. Wissig, Bart Krekelberg and
Stimulus dependence of neuronal correlation in primary visual cortex of the macaque Adam Kohn* and Matthew A. Smith
 Stimulus dependence of neuronal correlation in primary visual cortex of the macaque Adam Kohn* and Matthew A. Smith Center for Neural Science New York University, New York, NY 13 Abbreviated Title: Stimulus
Supplemental Material
 Supplemental Material Recording technique Multi-unit activity (MUA) was recorded from electrodes that were chronically implanted (Teflon-coated platinum-iridium wires) in the primary visual cortex representing
The effects of subthreshold synchrony on the perception of simultaneity. Ludwig-Maximilians-Universität Leopoldstr 13 D München/Munich, Germany
 The effects of subthreshold synchrony on the perception of simultaneity 1,2 Mark A. Elliott, 2 Zhuanghua Shi & 2,3 Fatma Sürer 1 Department of Psychology National University of Ireland Galway, Ireland.
Learning and Adaptation in a Recurrent Model of V1 Orientation Selectivity
 J Neurophysiol 89: 2086 2100, 2003. First published December 18, 2002; 10.1152/jn.00970.2002. Learning and Adaptation in a Recurrent Model of V1 Orientation Selectivity Andrew F. Teich and Ning Qian Center
Dual Inhibitory Mechanisms for Definition of Receptive Field Characteristics in Cat Striate Cortex
 Dual Inhibitory Mechanisms for Definition of Receptive Field Characteristics in Cat Striate Cortex A. B. Bonds Dept. of Electrical Engineering Vanderbilt University N ashville, TN 37235 Abstract In single
Weakly Modulated Spike Trains: Significance, Precision, and Correction for Sample Size
 J Neurophysiol 87: 2542 2554, 2002; 10.1152/jn.00420.2001. Weakly Modulated Spike Trains: Significance, Precision, and Correction for Sample Size CHOU P. HUNG, BENJAMIN M. RAMSDEN, AND ANNA WANG ROE Department
2/3/17. Visual System I. I. Eye, color space, adaptation II. Receptive fields and lateral inhibition III. Thalamus and primary visual cortex
 1 Visual System I I. Eye, color space, adaptation II. Receptive fields and lateral inhibition III. Thalamus and primary visual cortex 2 1 2/3/17 Window of the Soul 3 Information Flow: From Photoreceptors
Sum of Neurally Distinct Stimulus- and Task-Related Components.
 SUPPLEMENTARY MATERIAL for Cardoso et al. 22 The Neuroimaging Signal is a Linear Sum of Neurally Distinct Stimulus- and Task-Related Components. : Appendix: Homogeneous Linear ( Null ) and Modified Linear
Inhibition, Spike Threshold, and Stimulus Selectivity in Primary Visual Cortex
 Inhibition, Spike Threshold, and Stimulus Selectivity in Primary Visual Cortex Nicholas J. Priebe 1 and David Ferster 2, * 1 Section of Neurobiology, The University of Texas at Austin, 1 University Station
Vision Research 49 (2009) Contents lists available at ScienceDirect. Vision Research. journal homepage:
 Contents lists available at ScienceDirect. Vision Research. journal homepage:") Vision Research 49 (29) 29 43 Contents lists available at ScienceDirect Vision Research journal homepage: www.elsevier.com/locate/visres A framework for describing the effects of attention on visual responses
Vision Research 49 (29) 29 43 Contents lists available at ScienceDirect Vision Research journal homepage: www.elsevier.com/locate/visres A framework for describing the effects of attention on visual responses
Information Conveyed by Onset Transients in Responses of Striate Cortical Neurons
 The Journal of Neuroscience, September 1, 2001, 21(17):6978 6990 Information Conveyed by Onset Transients in Responses of Striate Cortical Neurons James R. Müller, 1 Andrew B. Metha, 1 John Krauskopf,
Analysis of in-vivo extracellular recordings. Ryan Morrill Bootcamp 9/10/2014
 Analysis of in-vivo extracellular recordings Ryan Morrill Bootcamp 9/10/2014 Goals for the lecture Be able to: Conceptually understand some of the analysis and jargon encountered in a typical (sensory)
Orientation selective neurons in primary visual cortex receive
 The spatial receptive field of thalamic inputs to single cortical simple cells revealed by the interaction of visual and electrical stimulation Prakash Kara*, John S. Pezaris, Sergey Yurgenson, and R.
Different Roles for Simple-Cell and Complex-Cell Inhibition in V1
 The Journal of Neuroscience, November 12, 2003 23(32):10201 10213 10201 Behavioral/Systems/Cognitive Different Roles for Simple-Cell and Complex-Cell Inhibition in V1 Thomas Z. Lauritzen 1,4 and Kenneth
The Nature of V1 Neural Responses to 2D Moving Patterns Depends on Receptive-Field Structure in the Marmoset Monkey
 J Neurophysiol 90: 930 937, 2003. First published April 23, 2003; 10.1152/jn.00708.2002. The Nature of V1 Neural Responses to 2D Moving Patterns Depends on Receptive-Field Structure in the Marmoset Monkey
The effect of stimulus duration on the persistence of gratings
 Perception & Psychophysics 1980,27 (6),574-578 The effect of stimulus duration on the persistence of gratings ALISON BOWLING and WILLIAM LOVEGROVE University oftasmania, Hobart, Tasmania, Australia 700/
Early and Late Mechanisms of Surround Suppression in Striate Cortex of Macaque
 11666 The Journal of Neuroscience, December 14, 25 25(5):11666 11675 Behavioral/Systems/Cognitive Early and Late Mechanisms of Surround Suppression in Striate Cortex of Macaque Ben S. Webb, 2 Neel T. Dhruv,
Signal transmission, feature representation and computation in areas. V1 and MT of the macaque monkey. Nicole C. Rust
 Signal transmission, feature representation and computation in areas V1 and MT of the macaque monkey by Nicole C. Rust A dissertation submitted in partial fulfillment of the requirements for the degree
The Precision of Single Neuron Responses in Cortical Area V1 during Stereoscopic Depth Judgments
 The Journal of Neuroscience, May 1, 2000, 20(9):3387 3400 The Precision of Single Neuron Responses in Cortical Area V1 during Stereoscopic Depth Judgments Simon J. D. Prince, Andrew D. Pointon, Bruce G.
Reading Assignments: Lecture 5: Introduction to Vision. None. Brain Theory and Artificial Intelligence
 Brain Theory and Artificial Intelligence Lecture 5:. Reading Assignments: None 1 Projection 2 Projection 3 Convention: Visual Angle Rather than reporting two numbers (size of object and distance to observer),
Differential contributions of magnocellular and parvocellular pathways to the contrast response of neurons in bush baby primary visual cortex (V1)
") Visual Neuroscience (2000), 17, 71 76. Printed in the USA. Copyright 2000 Cambridge University Press 0952-5238000 $12.50 Differential contributions of magnocellular and parvocellular pathways to the contrast
Visual Neuroscience (2000), 17, 71 76. Printed in the USA. Copyright 2000 Cambridge University Press 0952-5238000 $12.50 Differential contributions of magnocellular and parvocellular pathways to the contrast
Are primate lateral geniculate nucleus (LGN) cells really sensitive to orientation or direction?
 cells really sensitive to orientation or direction?") Visual Neuroscience (2002), 19, 97 108. Printed in the USA. Copyright 2002 Cambridge University Press 0952-5238002 $12.50 DOI: 10.1017.S0952523802191097 Are primate lateral geniculate nucleus (LGN) cells
Visual Neuroscience (2002), 19, 97 108. Printed in the USA. Copyright 2002 Cambridge University Press 0952-5238002 $12.50 DOI: 10.1017.S0952523802191097 Are primate lateral geniculate nucleus (LGN) cells
Neural Basis for Stereopsis from Second-Order Contrast Cues
 4370 The Journal of Neuroscience, April 19, 2006 26(16):4370 4382 Behavioral/Systems/Cognitive Neural Basis for Stereopsis from Second-Order Contrast Cues Hiroki Tanaka and Izumi Ohzawa Graduate School
Local Disparity Not Perceived Depth Is Signaled by Binocular Neurons in Cortical Area V1 of the Macaque
 The Journal of Neuroscience, June 15, 2000, 20(12):4758 4767 Local Disparity Not Perceived Depth Is Signaled by Binocular Neurons in Cortical Area V1 of the Macaque Bruce G. Cumming and Andrew J. Parker
Synaptic Depression and the Temporal Response Characteristics of V1 Cells
 The Journal of Neuroscience, June 15, 1998, 18(12):4785 4799 Synaptic Depression and the Temporal Response Characteristics of V1 Cells Frances S. Chance, Sacha B. Nelson, and L. F. Abbott Volen Center
Processing of first- and second-order motion signals by neurons in area MT of the macaque monkey
 Visual Neuroscience (1998), 15, 305 317. Printed in the USA. Copyright 1998 Cambridge University Press 0952-5238098 $12.50 Processing of first- and second-order motion signals by neurons in area MT of
Temporal Dynamics of Direction Tuning in Motion-Sensitive Macaque Area MT
 J Neurophysiol 93: 2104 2116, 2005. First published November 10, 2004; doi:10.1152/jn.00601.2004. Temporal Dynamics of Direction Tuning in Motion-Sensitive Macaque Area MT János A. Perge, Bart G. Borghuis,
COGS 101A: Sensation and Perception
 COGS 101A: Sensation and Perception 1 Virginia R. de Sa Department of Cognitive Science UCSD Lecture 5: LGN and V1: Magno and Parvo streams Chapter 3 Course Information 2 Class web page: http://cogsci.ucsd.edu/
Cambridge CB2 3EG (Received 8 November 1972)
") J. Physiol. (1973), 232, pp. 149-162 149 With 8 text-figures Printed in Great Britain PSYCHOPHYSICAL EVIDENCE FOR SUSTAINED AND TRANSIENT DETECTORS IN HUMAN VISION BY J. J. KULIKOWSKI AND D. J. TOLHURST*
J. Physiol. (1973), 232, pp. 149-162 149 With 8 text-figures Printed in Great Britain PSYCHOPHYSICAL EVIDENCE FOR SUSTAINED AND TRANSIENT DETECTORS IN HUMAN VISION BY J. J. KULIKOWSKI AND D. J. TOLHURST*
The Integration of Features in Visual Awareness : The Binding Problem. By Andrew Laguna, S.J.
 The Integration of Features in Visual Awareness : The Binding Problem By Andrew Laguna, S.J. Outline I. Introduction II. The Visual System III. What is the Binding Problem? IV. Possible Theoretical Solutions
Morton-Style Factorial Coding of Color in Primary Visual Cortex
 Morton-Style Factorial Coding of Color in Primary Visual Cortex Javier R. Movellan Institute for Neural Computation University of California San Diego La Jolla, CA 92093-0515 movellan@inc.ucsd.edu Thomas
Photoreceptors Rods. Cones
 Photoreceptors Rods Cones 120 000 000 Dim light Prefer wavelength of 505 nm Monochromatic Mainly in periphery of the eye 6 000 000 More light Different spectral sensitivities!long-wave receptors (558 nm)
The Role of Thalamic Population Synchrony in the Emergence of Cortical Feature Selectivity
 The Role of Thalamic Population Synchrony in the Emergence of Cortical Feature Selectivity Sean T. Kelly, Emory University Jens Kremkow, State University of New York Jianzhong Jin, State University of
Neurons in Dorsal Visual Area V5/MT Signal Relative
 17892 The Journal of Neuroscience, December 7, 211 31(49):17892 1794 Behavioral/Systems/Cognitive Neurons in Dorsal Visual Area V5/MT Signal Relative Disparity Kristine Krug and Andrew J. Parker Oxford
Models of Attention. Models of Attention
 Models of Models of predictive: can we predict eye movements (bottom up attention)? [L. Itti and coll] pop out and saliency? [Z. Li] Readings: Maunsell & Cook, the role of attention in visual processing,
Consciousness The final frontier!
 Consciousness The final frontier! How to Define it??? awareness perception - automatic and controlled memory - implicit and explicit ability to tell us about experiencing it attention. And the bottleneck
2 INSERM U280, Lyon, France
 Natural movies evoke responses in the primary visual cortex of anesthetized cat that are not well modeled by Poisson processes Jonathan L. Baker 1, Shih-Cheng Yen 1, Jean-Philippe Lachaux 2, Charles M.
Functional Maturation of the Macaque s Lateral Geniculate Nucleus
 2712 The Journal of Neuroscience, March 9, 2005 25(10):2712 2722 Behavioral/Systems/Cognitive Functional Maturation of the Macaque s Lateral Geniculate Nucleus J. Anthony Movshon, Lynne Kiorpes, Michael
Stimulus-driven population activity patterns in macaque primary visual cortex
 Stimulus-driven population activity patterns in macaque primary visual cortex Benjamin R. Cowley a,, Matthew A. Smith b, Adam Kohn c, Byron M. Yu d, a Machine Learning Department, Carnegie Mellon University,
The Neural Representation of Speed in Macaque Area MT/V5
 5650 The Journal of Neuroscience, July 2, 2003 23(13):5650 5661 Behavioral/Systems/Cognitive The Neural Representation of Speed in Macaque Area MT/V5 Nicholas J. Priebe, Carlos R. Cassanello, and Stephen
Neural Correlates of Perceived Brightness in the Retina, Lateral Geniculate Nucleus, and Striate Cortex
 The Journal of Neuroscience, July 15, 1999, 19(14):6145 6156 Neural Correlates of Perceived Brightness in the Retina, Lateral Geniculate Nucleus, and Striate Cortex Andrew F. Rossi and Michael A. Paradiso
G5)H/C8-)72)78)2I-,8/52& ()*+,-./,-0))12-345)6/3/782 9:-8;<;4.= J-3/ J-3/ "#&' "#% "#"% "#%$
H/C8-)72)78)2I-,8/52& ()*+,-./,-0))12-345)6/3/782 9:-8;<;4.= J-3/ J-3/ #&' #% #% #%$") # G5)H/C8-)72)78)2I-,8/52& #% #$ # # &# G5)H/C8-)72)78)2I-,8/52' @5/AB/7CD J-3/ /,?8-6/2@5/AB/7CD #&' #% #$ # # '#E ()*+,-./,-0))12-345)6/3/782 9:-8;;4. @5/AB/7CD J-3/ #' /,?8-6/2@5/AB/7CD #&F #&' #% #$
# G5)H/C8-)72)78)2I-,8/52& #% #$ # # &# G5)H/C8-)72)78)2I-,8/52' @5/AB/7CD J-3/ /,?8-6/2@5/AB/7CD #&' #% #$ # # '#E ()*+,-./,-0))12-345)6/3/782 9:-8;;4. @5/AB/7CD J-3/ #' /,?8-6/2@5/AB/7CD #&F #&' #% #$
Time [ms]
![Time [ms]](/thumbs/95/126316840.jpg "Time [ms]") Magazine R1051 Brief motion stimuli preferentially activate surroundsuppressed neurons in macaque visual area MT Jan Churan, Farhan A. Khawaja, James M.G. Tsui and Christopher C. Pack Intuitively one might
Magazine R1051 Brief motion stimuli preferentially activate surroundsuppressed neurons in macaque visual area MT Jan Churan, Farhan A. Khawaja, James M.G. Tsui and Christopher C. Pack Intuitively one might
Lateral Geniculate Nucleus (LGN)
") Lateral Geniculate Nucleus (LGN) What happens beyond the retina? What happens in Lateral Geniculate Nucleus (LGN)- 90% flow Visual cortex Information Flow Superior colliculus 10% flow Slide 2 Information
Lateral Geniculate Nucleus (LGN) What happens beyond the retina? What happens in Lateral Geniculate Nucleus (LGN)- 90% flow Visual cortex Information Flow Superior colliculus 10% flow Slide 2 Information
Characterizing Neurons in the Primary Auditory Cortex of the Awake Primate U sing Reverse Correlation
 Characterizing Neurons in the Primary Auditory Cortex of the Awake Primate U sing Reverse Correlation R. Christopher dec harms decharms@phy.ucsf.edu Michael M. Merzenich merz@phy.ucsf.edu w. M. Keck Center
Key questions about attention
 Key questions about attention How does attention affect behavioral performance? Can attention affect the appearance of things? How does spatial and feature-based attention affect neuronal responses in
CS294-6 (Fall 2004) Recognizing People, Objects and Actions Lecture: January 27, 2004 Human Visual System
 Recognizing People, Objects and Actions Lecture: January 27, 2004 Human Visual System") CS294-6 (Fall 2004) Recognizing People, Objects and Actions Lecture: January 27, 2004 Human Visual System Lecturer: Jitendra Malik Scribe: Ryan White (Slide: layout of the brain) Facts about the brain:
CS294-6 (Fall 2004) Recognizing People, Objects and Actions Lecture: January 27, 2004 Human Visual System Lecturer: Jitendra Malik Scribe: Ryan White (Slide: layout of the brain) Facts about the brain:
Stimulus Dependence of Neuronal Correlation in Primary Visual Cortex of the Macaque
 The Journal of Neuroscience, April 6, 2005 25(14):3661 3673 3661 Behavioral/Systems/Cognitive Stimulus Dependence of Neuronal Correlation in Primary Visual Cortex of the Macaque Adam Kohn and Matthew A.
Coding of the contrasts in natural images by visual cortex (V1) neurons: a Bayesian approach
 neurons: a Bayesian approach") Chirimuuta et al. Vol. 20, No. 7/July 2003/J. Opt. Soc. Am. A 1253 Coding of the contrasts in natural images by visual cortex (V1) neurons: a Bayesian approach Mazviita Chirimuuta, Philip L. Clatworthy,
Chirimuuta et al. Vol. 20, No. 7/July 2003/J. Opt. Soc. Am. A 1253 Coding of the contrasts in natural images by visual cortex (V1) neurons: a Bayesian approach Mazviita Chirimuuta, Philip L. Clatworthy,
Joint tuning for direction of motion and binocular disparity in macaque MT is largely separable
 J Neurophysiol 11: 286 2816, 213. First published October 2, 213; doi:1.1152/jn.573.213. Joint tuning for direction of motion and binocular disparity in macaque MT is largely separable Alexandra Smolyanskaya,*
Normal and amblyopic contrast sensitivity functions in central and peripheral retinas
 Normal and amblyopic contrast sensitivity functions in central and peripheral retinas Joseph Thomas Contrast sensitivity functions (CSF's)for temporally modulated sine wave gratings were established at
Space and Time Maps of Cone Photoreceptor Signals in Macaque Lateral Geniculate Nucleus
 The Journal of Neuroscience, July 15, 2002, 22(14):6158 6175 Space and Time Maps of Cone Photoreceptor Signals in Macaque Lateral Geniculate Nucleus R. Clay Reid 1,2 and Robert M. Shapley 1 1 Center for
The processing of feature discontinuities for different cue types in primary visual cortex
 BRAIN RESEARCH 1238 (2008) 59 74 available at www.sciencedirect.com www.elsevier.com/locate/brainres Research Report The processing of feature discontinuities for different cue types in primary visual
Dynamics of Response to Perceptual Pop-Out Stimuli in Macaque V1
 J Neurophysiol 98: 3436 3449, 27. First published September 26, 27; doi:1.1152/jn.441.27. Dynamics of Response to Perceptual Pop-Out Stimuli in Macaque V1 Matthew A. Smith, 1 Ryan C. Kelly, 1,2 and Tai
A new path to understanding vision
 A new path to understanding vision from the perspective of the primary visual cortex Frontal brain areas Visual cortices Primary visual cortex (V1) Li Zhaoping Retina A new path to understanding vision
Oblique Effect: A Neural Basis in the Visual Cortex
 J Neurophysiol 90: 204 217, 2003. First published February 26, 2003; 10.1152/jn.00954.2002. Oblique Effect: A Neural Basis in the Visual Cortex Baowang Li, Matthew R. Peterson, and Ralph D. Freeman Group
Contrast Dependence of Suppressive Influences in Cortical Area
 Articles in PresS. J Neurophysiol (October 13, 2004). doi:10.1152/jn.00629.2004 FINAL ACCEPTED VERSION Contrast Dependence of Suppressive Influences in Cortical Area MT of Alert Macaque Authors: Christopher
Contrast sensitivity and retinal ganglion cell responses in the primate
 PSYCHOLOGY NEUROSCIENCE Psychology & Neuroscience, 2011, 4, 1, 11-18 DOI: 10.3922/j.psns.2011.1.003 Contrast sensitivity and retinal ganglion cell responses in the primate Barry B. Lee 1,2 and Hao Sun
How Neurons Do Integrals. Mark Goldman
 How Neurons Do Integrals Mark Goldman Outline 1. What is the neural basis of short-term memory? 2. A model system: the Oculomotor Neural Integrator 3. Neural mechanisms of integration: Linear network theory
Supplemental Information. Gamma and the Coordination of Spiking. Activity in Early Visual Cortex. Supplemental Information Inventory:
 Neuron, Volume 77 Supplemental Information Gamma and the Coordination of Spiking Activity in Early Visual Cortex Xiaoxuan Jia, Seiji Tanabe, and Adam Kohn Supplemental Information Inventory: Supplementary
Dynamics of neuronal sensitivity in visual cortex and local feature discrimination
 Dynamics of neuronal sensitivity in visual cortex and local feature discrimination Valentin Dragoi, Jitendra Sharma, Earl K. Miller and Mriganka Sur Department of Brain and Cognitive Sciences, Picower
A contrast paradox in stereopsis, motion detection and vernier acuity
 A contrast paradox in stereopsis, motion detection and vernier acuity S. B. Stevenson *, L. K. Cormack Vision Research 40, 2881-2884. (2000) * University of Houston College of Optometry, Houston TX 77204
Contrast Dependence of Suppressive Influences in Cortical Area MT of Alert Macaque
 J Neurophysiol 93: 1809 1815, 2005. First published October 13, 2004; doi:10.1152/jn.00629.2004. Report Contrast Dependence of Suppressive Influences in Cortical Area MT of Alert Macaque Christopher C.
USING AUDITORY SALIENCY TO UNDERSTAND COMPLEX AUDITORY SCENES
 USING AUDITORY SALIENCY TO UNDERSTAND COMPLEX AUDITORY SCENES Varinthira Duangudom and David V Anderson School of Electrical and Computer Engineering, Georgia Institute of Technology Atlanta, GA 30332
Representation of sound in the auditory nerve
 Representation of sound in the auditory nerve Eric D. Young Department of Biomedical Engineering Johns Hopkins University Young, ED. Neural representation of spectral and temporal information in speech.