MSstatsQC: Longitudinal system suitability monitoring and quality control for proteomic experiments
|
|
|
- Blaise Page
- 6 years ago
- Views:
Transcription

1 MSstatsQC: Longitudinal system suitability monitoring and quality control for proteomic experiments Dr. Eralp DOGU Mugla University, TR Prof. Olga Vitek Group Northeastern University Skyline User Group Meeting at ASMS 2017 Indianapolis
2 Outline 1. Quality assurance and definition of quality 2. Basics of Statistical Process Control (SPC) 3. MSstatsQC 4. Case studies from CPTAC study 9.1 2

3 LC MS/MS is a process!
4 Outline 1. Quality assurance and definition of quality 2. Basics of Statistical Process Control (SPC) 3. MSstatsQC 4. Case studies from CPTAC study 9.1 4
5 Statistical Process Control (SPC) Typically used for quality control Developed in 1920s at Bell Telephone Laboratories by Walter Shewart to aid in the production of telephone components that were of uniform quality Based on theory of variation Long history of use within manufacturing, healthcare, food and chemical processes A key SPC tool is the control chart, which is the focus of this presentation Combines time-series analysis with graphical representation of data 5

 J.")
6 SPC applied to mass spectrometry proteomics SProCop Panorama AutoQC Bereman et. al. (2014) J. Am. Soc. Mass Spectrom Bereman et. al. (2016) J. Proteome Res.
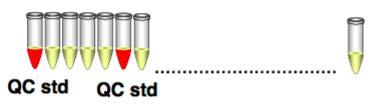
7 Sampling to set up a program To measure the process, we take samples and analyze the sample statistics following these steps a) QC or system suitability samples, vary from each other in terms of retention time b) After enough samples (guide set) are taken from a stable process, they form a pattern called a distribution c) There are many types of distributions, including the normal (bell-shaped) distribution, but distributions do differ in terms of central tendency (mean), standard deviation or variance, and shape Frequency Retention time Frequency # Retention time # # # # # # # # # # # # # # # # # # # # # # # # # Each of these represents one sample Central tendency Variation Shape Retention time Retention time 7
8 Sampling to set up a suitability program To measure the performance, we take samples and analyze the sample statistics following these steps (d) If only natural causes of variation are present, the output of a process forms a distribution that is stable over time and is predictable Frequency Prediction Retention time
9 Data : CPTAC Study 9.1 Site 86 9
10 Sampling to set up a suitability program To measure the performance, we take samples and analyze the sample statistics following these steps (e) If assignable causes are present, the process output is not stable over time and is not predicable Frequency?????????????????? Prediction Retention time 10

11 Data : CPTAC Study 9.1 Site 56A 11
12 Control Charts Constructed from historical data, the purpose of control charts is to help distinguish between natural variations and variations due to assignable causes Control Chart for 12 QC samples for a certain peptide Upper Control Limit=18 Out of control Variation due to assignable causes Mean=16 Variation due to natural causes Lower Control Limit= QC number Out of control Variation due to assignable causes 12

13 Patterns of control charts UCL RT mean LCL UCL Normal behavior. Process is in control. One sample out above (or below). Process is out of control. Peak area mean LCL Trends in either direction, 5 points. Investigate for cause of progressive change. Erratic behavior. Investigate. 13
14 Simultaneous monitoring of LC MS/MS mean and variation (a) These sampling distributions result in the charts below X-chart MR-chart UCL LCL UCL LCL (Sampling mean is shifting upward but range is consistent) (X chart detects shift in central tendency) (MR-chart does not detect change in mean) 14
15 Simultaneous monitoring of LC MS/MS mean and variation (b) These sampling distributions result in the charts below X-chart MR-chart UCL LCL UCL LCL (Sampling mean is constant but dispersion is increasing) (X-chart does not detect the increase in dispersion) (MR-chart detects increase in dispersion) 15
16 Simultaneous monitoring of LC MS/MS mean and variation (c) These sampling distributions result in the charts below X-chart MR-chart UCL LCL UCL LCL (Sampling mean is constant but dispersion is increasing) (X-chart detects shift in central tendency) (MR-chart detects increase in dispersion) 16
17 Outline 1. Quality assurance and definition of quality 2. Basics of Statistical Process Control (SPC) 3. MSstatsQC 4. Case studies from CPTAC study
18 The image part with relationship ID rid4 was not found in the file. MSstatsQC : statistical tool for longitudinal monitoring Open-source R-based web interface ( for statistical monitoring of system suitability and quality control (QC) samples in mass spectrometry-based proteomic experiments. MSstatsQC QC data gathering Data input and data processing Metric Summary Control charts and change point analysis * Test peptides for special causes of variation I. MSstatsQC compatible experiments II. MSstatsQC input I. Data input II. Data similarity analysis III. Data table I. Box plots for each suitability metric and peptide II. Decision-maps III. Metric summaries I. XmR control chart II. CUSUMm and CUSUMv control charts III. Mean and dispersion changepoint analysis 18
19 MSstats compatible experiments and metrics MS acquisition SRM DIA or SWATH DDA or shotgun Analysis Decision support tools Control charts Change point analysis label-free label-bpeptides Metrics Retention time Total peak area When Mean Variation Large shifts X MR Small shifts CUSUMm CUSUMv Time of a problem Change point Change point Full width at half maximum (FWHM) Peak asymmetry Many more


20 The image part with relationship ID rid3 was not found in the file. 1. Data input and data table MSstatsQC QC data gathering Data input and data processing Metric Summary Control charts and change point analysis 20

21 The image part with relationship ID rid3 was not found in the file. 1. Data input and data table MSstatsQC QC data gathering Data input and data processing Metric Summary Control charts and change point analysis 21

22 The image part with relationship ID rid3 was not found in the file. 2. Metric Summary MSstatsQC QC data gathering Data input and data processing Metric Summary Control charts and change point analysis 22

23 The image part with relationship ID rid3 was not found in the file. 2. Metric Summary MSstatsQC QC data gathering Data input and data processing Metric Summary Control charts and change point analysis 23
 and Moving Range (mr) MSstatsQC QC data gathering Data input and data processing")

24 The image part with relationship ID rid3 was not found in the file. 3. Control charts-individual (X) and Moving Range (mr) MSstatsQC QC data gathering Data input and data processing Metric Summary Control charts and change point analysis 1. XmR chart is useful when large shifts and isolated outliers exist in the dataset. 2. Analyst are encouraged to go back to their records and investigate the causes of out-ofcontrol observations and try to eliminate it. 24


25 3. Control charts-cumulative Sum (CUSUM) The image part with relationship ID rid3 was not found in the file. MSstatsQC QC data gathering Data input and data processing Metric Summary Control charts and change point analysis 1. CUSUM charts are sensitive to small, sustained shifts and drifts. 2. A CUSUM chart plots two statistics: a) A positive CUSUM for increases and b) A negative CUSUM for decreases. 25


26 4. Change point analysis The image part with relationship ID rid3 was not found in the file. MSstatsQC QC data gathering Data input and data processing Metric Summary Control charts and change point analysis 1. Change point analysis help identify the exact time of a shift. 2. The QC sample maximizes the change point function is considered as the change point estimate. 3. The analyst can start searching for the causes of the shift considering this information. 26
27 Outline 1. Quality assurance and definition of quality 2. Basics of Statistical Process Control (SPC) 3. MSstatsQC 4. Case studies from CPTAC study


28 Data : CPTAC Multisite Study


29 CPTAC Study 9.1 Site 54 Very nice SST for some peptides Changes in retention time for some peptides 29


30 CPTAC Study 9.1 Site 54 Instrument calibration problems, deterioration of column and emitter and wear in parts 30

31 CPTAC Study 9.1 Site 65 31

32 CPTAC Study 9.1 Site 65 32


33 CPTAC Study 9.1 Site 65 Column deterioration, contamination, and fitting fatigue 33

34 CPTAC Study 9.1 Site 86 Very nice SST 34
35 CPTAC Study 9.1 Site 86 Environmental factors such as temperature or pressure changes 35

36 CPTAC Study 9.1 Site 56A 36

37 CPTAC Study 9.1 Site 56A Variance inflation could occur during the equilibration phase of a new LC column 37
38 SPC applied to mass spectrometry proteomics SProCop Panorama AutoQC Bereman et. al. (2014) J. Am. Soc. Mass Spectrom Bereman et. al. (2016) J. Proteome Res.

 J.")
39 SPC applied to mass spectrometry proteomics Panorama AutoQC Bereman et. al. (2016) J. Proteome Res.


40 msstats.org/msstatsqc News about MsstatsQC Example datasets Related publications MSstatsQC daily Example datasets R shiny codes and functions 40


41 Acknowledgements Northeastern University Olga Vitek Sara Taheri Meena Choi University of Washington Brendan MacLean Buck Institute Birgit Schilling Thermo Fisher Sue Abbatiello North Carolina State University Michael Bereman 41

42 Related work 42
Targeted Proteomics Environment
 Targeted Proteomics Environment Targeted Proteomics Quantitative Analysis of Data Independent Acquisition MS/MS in Skyline Brendan MacLean; Jarrett Egertson; Donald M. Marsh; Michael J. MacCoss 2010 Multi-Instrument
MS1 and MS2 crosstalk in label free quantitation of mass spectrometry data independent acquisitions
 MS1 and MS2 crosstalk in label free quantitation of mass spectrometry data independent acquisitions MS1 528.18 +++ m/z 568.98 ++ m/z 678.34 ++ m/z MS2/SWATH June 9th, 2013 Matthew J. Rardin SIRT3 regulated
New Developments in LC-IMS-MS Proteomic Measurements and Informatic Analyses
 New Developments in LC-IMS-MS Proteomic Measurements and Informatic Analyses Erin Shammel Baker Kristin E. Burnum-Johnson, Xing Zhang, Cameron P. Casey, Yehia M. Ibrahim, Matthew E. Monroe, Tao Liu, Brendan
Farouk AL Quadan lecture 3 Implentation of
 How to implement a program? Establish written policies and procedures Assign responsibility for monitoring and reviewing Train staff Obtain control materials Collect data Set target values (mean, SD) Establish
Measuring Lipid Composition LC-MS/MS
 Project: Measuring Lipid Composition LC-MS/MS Verification of expected lipid composition in nanomedical controlled release systems by liquid chromatography tandem mass spectrometry AUTHORED BY: DATE: Sven
A NEW DIAGNOSIS SYSTEM BASED ON FUZZY REASONING TO DETECT MEAN AND/OR VARIANCE SHIFTS IN A PROCESS. Received August 2010; revised February 2011
 International Journal of Innovative Computing, Information and Control ICIC International c 2011 ISSN 1349-4198 Volume 7, Number 12, December 2011 pp. 6935 6948 A NEW DIAGNOSIS SYSTEM BASED ON FUZZY REASONING
Package MSstatsTMT. February 26, Title Protein Significance Analysis in shotgun mass spectrometry-based
 Package MSstatsTMT February 26, 2019 Title Protein Significance Analysis in shotgun mass spectrometry-based proteomic experiments with tandem mass tag (TMT) labeling Version 1.1.2 Date 2019-02-25 Tools
Probability-Based Protein Identification for Post-Translational Modifications and Amino Acid Variants Using Peptide Mass Fingerprint Data
 Probability-Based Protein Identification for Post-Translational Modifications and Amino Acid Variants Using Peptide Mass Fingerprint Data Tong WW, McComb ME, Perlman DH, Huang H, O Connor PB, Costello
Moving from targeted towards non-targeted approaches
 Gesundheitsdirektion Moving from targeted towards non-targeted approaches Anton Kaufmann Official Food Control Authority of the Canton of Zurich () Switzerland 2 Overview I From single residue to multi
Here are the various choices. All of them are found in the Analyze menu in SPSS, under the sub-menu for Descriptive Statistics :
 Descriptive Statistics in SPSS When first looking at a dataset, it is wise to use descriptive statistics to get some idea of what your data look like. Here is a simple dataset, showing three different
Outline. Title of Presentation. Problem Solution Details Summary. Increasing the Use of Measures by Decreasing Measurement Effort
 Increasing the Use of Measures by Decreasing Measurement Effort Mike Ferris mike.ferris@gdcanada.com Outline Problem Solution Details Summary 2 1 Problem Background GD Canada has chosen to focus on defect
Protein Reports CPTAC Common Data Analysis Pipeline (CDAP)
") Protein Reports CPTAC Common Data Analysis Pipeline (CDAP) v. 05/03/2016 Summary The purpose of this document is to describe the protein reports generated as part of the CPTAC Common Data Analysis Pipeline
Protein Reports CPTAC Common Data Analysis Pipeline (CDAP) v. 05/03/2016 Summary The purpose of this document is to describe the protein reports generated as part of the CPTAC Common Data Analysis Pipeline
Metabolomic and Proteomics Solutions for Integrated Biology. Christine Miller Omics Market Manager ASMS 2015
 Metabolomic and Proteomics Solutions for Integrated Biology Christine Miller Omics Market Manager ASMS 2015 Integrating Biological Analysis Using Pathways Protein A R HO R Protein B Protein X Identifies
Summary of Analytical Method for Quantitative Estimation of Fingolimod and Fingolimod Phosphate from Human Whole Blood Samples
 Fingolimod Whole Blood Analysis Summary of Analytical Method for Quantitative Estimation of Fingolimod and Fingolimod Phosphate from Human Whole Blood Samples Study Detail: - Determination of Fingolimod
Application Note # LCMS-89 High quantification efficiency in plasma targeted proteomics with a full-capability discovery Q-TOF platform
 Application Note # LCMS-89 High quantification efficiency in plasma targeted proteomics with a full-capability discovery Q-TOF platform Abstract Targeted proteomics for biomarker verification/validation
Lipidomic Analysis by UPLC-QTOF MS
 Lipidomic Analysis by UPLC-QTOF MS Version: 1 Edited by: Oliver Fiehn Summary Reagents and Materials Protocol Summary:Lipidomic analysis by UPLC-QTOF mass spectrometry Reagents and Materials: Reagent/Material
Nature Biotechnology: doi: /nbt Supplementary Figure 1
 Supplementary Figure 1 The timeline of the NGAG method for extraction of N-linked glycans and glycosite-containing peptides. The timeline can be changed based on the number of samples. Supplementary Figure
Comprehensive Forensic Toxicology Screening in Serum using On-Line SPE LC-MS/MS
 Comprehensive Forensic Toxicology Screening in Serum using On-Line SPE LC-MS/MS SCIEX QTRAP 4500 LC-MS/MS System and Spark Holland PICO Adrian M. Taylor 1, Peter Ringeling 2, Martin Sibum 2, Stefan Sturm
Don t miss a thing on your peptide mapping journey How to get full coverage peptide maps using high resolution accurate mass spectrometry
 Don t miss a thing on your peptide mapping journey How to get full coverage peptide maps using high resolution accurate mass spectrometry Kai Scheffler, PhD BioPharma Support Expert,LSMS Europe The world
Analysis and Interpretation of Data Part 1
 Analysis and Interpretation of Data Part 1 DATA ANALYSIS: PRELIMINARY STEPS 1. Editing Field Edit Completeness Legibility Comprehensibility Consistency Uniformity Central Office Edit 2. Coding Specifying
Targeted and untargeted metabolic profiling by incorporating scanning FAIMS into LC-MS. Kayleigh Arthur
 Targeted and untargeted metabolic profiling by incorporating scanning FAIMS into LC-MS Kayleigh Arthur K.Arthur@lboro.ac.uk Introduction LC-MS is a highly used technique for untargeted profiling analyses
User Guide. Protein Clpper. Statistical scoring of protease cleavage sites. 1. Introduction Protein Clpper Analysis Procedure...
 User Guide Protein Clpper Statistical scoring of protease cleavage sites Content 1. Introduction... 2 2. Protein Clpper Analysis Procedure... 3 3. Input and Output Files... 9 4. Contact Information...
Supplementary Figures and Notes for Digestion and depletion of abundant
 Supplementary Figures and Notes for Digestion and depletion of abundant proteins improves proteomic coverage Bryan R. Fonslow, Benjamin D. Stein, Kristofor J. Webb, Tao Xu, Jeong Choi, Sung Kyu Park, and
Announcement. Homework #2 due next Friday at 5pm. Midterm is in 2 weeks. It will cover everything through the end of next week (week 5).
.") Announcement Homework #2 due next Friday at 5pm. Midterm is in 2 weeks. It will cover everything through the end of next week (week 5). Political Science 15 Lecture 8: Descriptive Statistics (Part 1) Data
Announcement Homework #2 due next Friday at 5pm. Midterm is in 2 weeks. It will cover everything through the end of next week (week 5). Political Science 15 Lecture 8: Descriptive Statistics (Part 1) Data
Section9 : Real-World MS1 Filtering with Skyline - targeting posttranslational modifications
 Section9 : Real-World MS1 Filtering with Skyline - targeting posttranslational modifications NH + acetyl 3 HNCOCH transferases 3 deacetylases Birgit Schilling Buck Institute for Research on Aging OH OPO
OUTLIER SUBJECTS PROTOCOL (art_groupoutlier)
") OUTLIER SUBJECTS PROTOCOL (art_groupoutlier) Paul K. Mazaika 2/23/2009 Outlier subjects are a problem in fmri data sets for clinical populations. This protocol and program are a method to identify outlier
OUTLIER SUBJECTS PROTOCOL (art_groupoutlier) Paul K. Mazaika 2/23/2009 Outlier subjects are a problem in fmri data sets for clinical populations. This protocol and program are a method to identify outlier
SimGlycan. A high-throughput glycan and glycopeptide data analysis tool for LC-, MALDI-, ESI- Mass Spectrometry workflows.
 PREMIER Biosoft SimGlycan A high-throughput glycan and glycopeptide data analysis tool for LC-, MALDI-, ESI- Mass Spectrometry workflows SimGlycan software processes and interprets the MS/MS and higher
Quantitation by High Resolution Mass Spectrometry: Case Study of TOF MS for the Quantitation of Allopurinol from Human Plasma
 Quantitation by High Resolution Mass Spectrometry: Case Study of TOF MS for the Quantitation of Allopurinol from Human Plasma Shaokun Pang 1, Weixing Sun 2, Adrien Musuku 2, Xavier J. Misonne 1 1 SCIEX,
Multiple Treatments on the Same Experimental Unit. Lukas Meier (most material based on lecture notes and slides from H.R. Roth)
") Multiple Treatments on the Same Experimental Unit Lukas Meier (most material based on lecture notes and slides from H.R. Roth) Introduction We learned that blocking is a very helpful technique to reduce
Multiple Treatments on the Same Experimental Unit Lukas Meier (most material based on lecture notes and slides from H.R. Roth) Introduction We learned that blocking is a very helpful technique to reduce
* Skyline LC SRM. 2 Skyline LC-MS/MS. Skyline University of Washington Windows.
 Proteome Letters 2016 1 89-94 * *E-mail: fmatsuda@ist.osaka-u.ac.jp 565-0871 1-5 2016 4 20 2016 5 26 2016 5 27 LC SRM LC SRM 1 LC-MS/MS LC 1 3 SRM SRM LC-MS Skyline SRM LC-MS LC SRM 2 Skyline Skyline University
bivariate analysis: The statistical analysis of the relationship between two variables.
 bivariate analysis: The statistical analysis of the relationship between two variables. cell frequency: The number of cases in a cell of a cross-tabulation (contingency table). chi-square (χ 2 ) test for
SIEVE 2.1 Proteomics Example
 SIEVE 2.1 Proteomics Example Software Overview What is SIEVE? SIEVE is Thermo Scientific s differential software solution. SIEVE will continue to enhance our current product for label-free differential
Quantitative Data and Measurement. POLI 205 Doing Research in Politics. Fall 2015
 Quantitative Fall 2015 Theory and We need to test our theories with empirical data Inference : Systematic observation and representation of concepts Quantitative: measures are numeric Qualitative: measures
CONTROL CHART METHODOLOGY
 Center for Performance Sciences, 2001 CONTROL CHART METHODOLOGY Statistical Process Control (SPC) Analysis Statistical process control is a tool (e.g., control chart) used to help understand any process
Discovering Meaningful Cut-points to Predict High HbA1c Variation
 Proceedings of the 7th INFORMS Workshop on Data Mining and Health Informatics (DM-HI 202) H. Yang, D. Zeng, O. E. Kundakcioglu, eds. Discovering Meaningful Cut-points to Predict High HbAc Variation Si-Chi
What you should know before you collect data. BAE 815 (Fall 2017) Dr. Zifei Liu
 Dr. Zifei Liu") What you should know before you collect data BAE 815 (Fall 2017) Dr. Zifei Liu Zifeiliu@ksu.edu Types and levels of study Descriptive statistics Inferential statistics How to choose a statistical test
What you should know before you collect data BAE 815 (Fall 2017) Dr. Zifei Liu Zifeiliu@ksu.edu Types and levels of study Descriptive statistics Inferential statistics How to choose a statistical test
Control Chart Basics PK
 Control Chart Basics Primary Knowledge Unit Participant Guide Description and Estimated Time to Complete Control Charts are one of the primary tools used in Statistical Process Control or SPC. Control
for the Identification of Phosphorylated Peptides
 Application of a Data Dependent Neutral-Loss Experiment on the Finnigan LTQ for the Identification of Phosphorylated Peptides Gargi Choudhary Diane Cho Thermo Electron, San Jose, CA Abstracted from posters
Multi Omics Profiling of Methionine Restricted MCF7 Cells in 24 Hours Using a Prototype UPLC Compatible Microfluidic Device
 Multi Omics Profiling of Methionine Restricted MCF7 Cells in 24 Hours Using a Prototype UPLC Compatible Microfluidic Device J. Will Thompson 1, Jay Johnson 2, Giuseppe Astarita 2, Xiaohu Tang 1, Giuseppe
QUANTIFYING THE EFFECT OF SETTING QUALITY CONTROL STANDARD DEVIATIONS GREATER THAN ACTUAL STANDARD DEVIATIONS ON WESTGARD RULES
 AACC24 QUANTIFYING THE EFFECT OF SETTING QUALITY CONTROL STANDARD DEVIATIONS GREATER THAN ACTUAL STANDARD DEVIATIONS ON WESTGARD RULES Graham Jones Department of Chemical Pathology, St Vincent s Hospital,
High resolution mass spectrometry for bioanalysis at Janssen. Current experiences and future perspectives
 High resolution mass spectrometry for bioanalysis at Janssen. Current experiences and future perspectives Lieve Dillen Drug Safety Sciences Analytical Sciences, Non-regulated Bioanalysis Presentation outline
APPLICATION NOTE. Highly reproducible and Comprehensive Proteome Profiling of Formalin-Fixed Paraffin-Embedded (FFPE) Tissues Slices
 Tissues Slices") APPLICATION NOTE Highly reproducible and Comprehensive Proteome Profiling of Formalin-Fixed Paraffin-Embedded (FFPE) Tissues Slices INTRODUCTION Preservation of tissue biopsies is a critical step to This
APPLICATION NOTE Highly reproducible and Comprehensive Proteome Profiling of Formalin-Fixed Paraffin-Embedded (FFPE) Tissues Slices INTRODUCTION Preservation of tissue biopsies is a critical step to This
Impurity Identification using a Quadrupole - Time of Flight Mass Spectrometer QTOF
 Impurity Identification using a Quadrupole - Time of Flight Mass Spectrometer QTOF PUSHER TOF DETECTOR ZSPRAY TM Ion Source SAMPLING CONE SKIMMER RF HEXAPOLE RF HEXAPOLE QUADRUPOLE IN NARROW BANDPASS MODE
COAL COMBUSTION RESIDUALS RULE STATISTICAL METHODS CERTIFICATION SOUTHERN ILLINOIS POWER COOPERATIVE (SIPC)
") Regulatory Guidance Regulatory guidance provided in 40 CFR 257.90 specifies that a CCR groundwater monitoring program must include selection of the statistical procedures to be used for evaluating groundwater
Regulatory Guidance Regulatory guidance provided in 40 CFR 257.90 specifies that a CCR groundwater monitoring program must include selection of the statistical procedures to be used for evaluating groundwater
EBCC Data Analysis Tool (EBCC DAT) Introduction
 Introduction") Instructor: Paul Wolfgang Faculty sponsor: Yuan Shi, Ph.D. Andrey Mavrichev CIS 4339 Project in Computer Science May 7, 2009 Research work was completed in collaboration with Michael Tobia, Kevin L. Brown,
Instructor: Paul Wolfgang Faculty sponsor: Yuan Shi, Ph.D. Andrey Mavrichev CIS 4339 Project in Computer Science May 7, 2009 Research work was completed in collaboration with Michael Tobia, Kevin L. Brown,
[ APPLICATION NOTE ] High Sensitivity Intact Monoclonal Antibody (mab) HRMS Quantification APPLICATION BENEFITS INTRODUCTION WATERS SOLUTIONS KEYWORDS
![[ APPLICATION NOTE ] High Sensitivity Intact Monoclonal Antibody (mab) HRMS Quantification APPLICATION BENEFITS INTRODUCTION WATERS SOLUTIONS KEYWORDS](/thumbs/79/80328542.jpg "[ APPLICATION NOTE ] High Sensitivity Intact Monoclonal Antibody (mab) HRMS Quantification APPLICATION BENEFITS INTRODUCTION WATERS SOLUTIONS KEYWORDS") Yun Wang Alelyunas, Henry Shion, Mark Wrona Waters Corporation, Milford, MA, USA APPLICATION BENEFITS mab LC-MS method which enables users to achieve highly sensitive bioanalysis of intact trastuzumab
Yun Wang Alelyunas, Henry Shion, Mark Wrona Waters Corporation, Milford, MA, USA APPLICATION BENEFITS mab LC-MS method which enables users to achieve highly sensitive bioanalysis of intact trastuzumab
Metabolite identification in metabolomics: Metlin Database and interpretation of MSMS spectra
 Metabolite identification in metabolomics: Metlin Database and interpretation of MSMS spectra Jeevan K. Prasain, PhD Department of Pharmacology and Toxicology, UAB jprasain@uab.edu Outline Introduction
Example 1: How would you evaluate this transducer? What is the most common problem found in ultrasound QC testing? Uniformity is Subjective
 AAPM Working Group on Quantitative B-mode Ultrasound Quality Control: Software for assessment of transducer artifacts Sandra Larson, PhD University of Michigan Medical Center, Ann Arbor, MI, What is the
Developing Bioanalytical Methods Balancing the Statistical Tightrope
 Developing Bioanalytical Methods Balancing the Statistical Tightrope Lee: can I use this number? Process Development GSK, 1997 2 it s about 40 about 40? probably... 3 Enlightenment? 5 Unconscious Conscious
Monitoring Best Practices
 Aspire Doha, Qatar http://www.aspire.qa/trainingload2016/sessions.html?day=2 Monitoring Best Practices William A Sands, PhD, FACSM, CSCS, EMT W here are we going? A story about monitoring in three interconnected
User Guide. Association analysis. Input
 User Guide TFEA.ChIP is a tool to estimate transcription factor enrichment in a set of differentially expressed genes using data from ChIP-Seq experiments performed in different tissues and conditions.
Applications. DSC 410/510 Multivariate Statistical Methods. Discriminating Two Groups. What is Discriminant Analysis
 DSC 4/5 Multivariate Statistical Methods Applications DSC 4/5 Multivariate Statistical Methods Discriminant Analysis Identify the group to which an object or case (e.g. person, firm, product) belongs:
Statistics is the science of collecting, organizing, presenting, analyzing, and interpreting data to assist in making effective decisions
 Readings: OpenStax Textbook - Chapters 1 5 (online) Appendix D & E (online) Plous - Chapters 1, 5, 6, 13 (online) Introductory comments Describe how familiarity with statistical methods can - be associated
Digitizing the Proteomes From Big Tissue Biobanks
 Digitizing the Proteomes From Big Tissue Biobanks Analyzing 24 Proteomes Per Day by Microflow SWATH Acquisition and Spectronaut Pulsar Analysis Jan Muntel 1, Nick Morrice 2, Roland M. Bruderer 1, Lukas
Increased Identification Coverage and Throughput for Complex Lipidomes
 Increased Identification Coverage and Throughput for Complex Lipidomes Reiko Kiyonami, David Peake, Yingying Huang, Thermo Fisher Scientific, San Jose, CA USA Application Note 607 Key Words Q Exactive
QuickSplitTM Flow Splitters
 QuickTM Flow ters between 2 or more detectors such as Mass Spectroscopy and evaporative light scattering, UV, or IR. This is especially important when one of the detectors is destructive, such as Mass
4th Multidimensional Chromatography Workshop Toronto (January, 2013) Herman C. Lam, Ph.D. Calibration & Validation Group
 Herman C. Lam, Ph.D. Calibration & Validation Group") 4th Multidimensional Chromatography Workshop Toronto (January, 2013) Herman C. Lam, Ph.D. Calibration & Validation Group MDLC for Shotgun Proteomics Introduction General concepts Advantages Challenges
4th Multidimensional Chromatography Workshop Toronto (January, 2013) Herman C. Lam, Ph.D. Calibration & Validation Group MDLC for Shotgun Proteomics Introduction General concepts Advantages Challenges
Unit 1 Exploring and Understanding Data
 Unit 1 Exploring and Understanding Data Area Principle Bar Chart Boxplot Conditional Distribution Dotplot Empirical Rule Five Number Summary Frequency Distribution Frequency Polygon Histogram Interquartile
New Mass Spectrometry Tools to Transform Metabolomics and Lipidomics
 New Mass Spectrometry Tools to Transform Metabolomics and Lipidomics July.3.13 Ken Miller Vice President of Marketing, Life Sciences Mass Spectrometry 1 The world leader in serving science Omics & the
Conditional spectrum-based ground motion selection. Part II: Intensity-based assessments and evaluation of alternative target spectra
 EARTHQUAKE ENGINEERING & STRUCTURAL DYNAMICS Published online 9 May 203 in Wiley Online Library (wileyonlinelibrary.com)..2303 Conditional spectrum-based ground motion selection. Part II: Intensity-based
Achieve Broad Lipid Quantitation using a High-Throughput Targeted Lipidomics Method
 Achieve Broad Lipid Quantitation using a High-Throughput Targeted Lipidomics Method LC-Based Approach for Lipid Class Separation and Quantitation on QTRAP 6500+ System Mackenzie Pearson, Santosh Kumar
Northeastern University Healthcare Systems Engineering Institute Learning Statistical Thinking Through Games
 Northeastern University 2015 Learning Statistical Thinking Through Games James Benneyan PhD, 1 Shannon Provost PhD 2 1, Northeastern University, Boston MA 2 Carroll School of Management, Boston College,
Comparison of a UPLC Method across Multiple UHPLC Systems
 Comparison of a UPLC Method across Multiple UHPLC Systems Tanya Jenkins Waters Corporation, Milford, MA, U.S. INTRODUCTION In 2004, Waters introduced the ACQUITY UPLC System. Since this launch, many liquid
Introduction to Statistical Data Analysis I
 Introduction to Statistical Data Analysis I JULY 2011 Afsaneh Yazdani Preface What is Statistics? Preface What is Statistics? Science of: designing studies or experiments, collecting data Summarizing/modeling/analyzing
Statistics is the science of collecting, organizing, presenting, analyzing, and interpreting data to assist in making effective decisions
 Readings: OpenStax Textbook - Chapters 1 5 (online) Appendix D & E (online) Plous - Chapters 1, 5, 6, 13 (online) Introductory comments Describe how familiarity with statistical methods can - be associated
Lipididentifizierung in der LC-MS-basierten Lipidomik mittels einer Kombination aus SWATH und DMS
 Lipididentifizierung in der LC-MS-basierten Lipidomik mittels einer Kombination aus SWATH und DMS Michael Witting, et al. Helmholtz Zentrum München Research Unit Analytical BioGeoChemistry Berlin, 14/3/17
How to describe bivariate data
 Statistics Corner How to describe bivariate data Alessandro Bertani 1, Gioacchino Di Paola 2, Emanuele Russo 1, Fabio Tuzzolino 2 1 Department for the Treatment and Study of Cardiothoracic Diseases and
CHAPTER 3 DATA ANALYSIS: DESCRIBING DATA
 Data Analysis: Describing Data CHAPTER 3 DATA ANALYSIS: DESCRIBING DATA In the analysis process, the researcher tries to evaluate the data collected both from written documents and from other sources such
Data mining with Ensembl Biomart. Stéphanie Le Gras
 Data mining with Ensembl Biomart Stéphanie Le Gras (slegras@igbmc.fr) Guidelines Genome data Genome browsers Getting access to genomic data: Ensembl/BioMart 2 Genome Sequencing Example: Human genome 2000:
The new standard for shotgun proteomics. Innovation With Integrity
 The new standard for shotgun proteomics Innovation With Integrity Shotgun/Bottom-up proteomics Proteome analyzer challenge Several million peptides 20 000 Genes Expression >10 6 Proteoforms Digestion >
Unsupervised Identification of Isotope-Labeled Peptides
 Unsupervised Identification of Isotope-Labeled Peptides Joshua E Goldford 13 and Igor GL Libourel 124 1 Biotechnology institute, University of Minnesota, Saint Paul, MN 55108 2 Department of Plant Biology,
SUPPLEMENTAL MATERIAL
 1 SUPPLEMENTAL MATERIAL Response time and signal detection time distributions SM Fig. 1. Correct response time (thick solid green curve) and error response time densities (dashed red curve), averaged across
IE 361 Module 31. Patterns on Control Charts Part 1. Reading: Section 3.4 Statistical Methods for Quality Assurance. ISU and Analytics Iowa LLC
 IE 361 Module 31 Patterns on Control Charts Part 1 Reading: Section 3.4 Statistical Methods for Quality Assurance ISU and Analytics Iowa LLC (ISU and Analytics Iowa LLC) IE 361 Module 31 1 / 9 (and Other
Development of a Bioanalytical Method for Quantification of Amyloid Beta Peptides in Cerebrospinal Fluid
 Development of a Bioanalytical Method for Quantification of Amyloid Beta Peptides in Cerebrospinal Fluid Joanne ( 乔安妮 ) Mather Senior Scientist Waters Corporation Data courtesy of Erin Chambers and Mary
Reveal Relationships in Categorical Data
 SPSS Categories 15.0 Specifications Reveal Relationships in Categorical Data Unleash the full potential of your data through perceptual mapping, optimal scaling, preference scaling, and dimension reduction
A NOVEL METHOD OF M/Z DRIFT CORRECTION FOR OA-TOF MASS SPECTROMETERS BASED ON CONSTRUCTION OF LIBRARIES OF MATRIX COMPONENTS.
 A NOVEL METHOD OF M/Z DRIFT CORRECTION FOR OA-TOF MASS SPECTROMETERS BASED ON CONSTRUCTION OF LIBRARIES OF MATRIX COMPONENTS. Martin R Green*, Keith Richardson, John Chipperfield, Nick Tomczyk, Martin
High-Throughput, Cost-Efficient LC-MS/MS Forensic Method for Measuring Buprenorphine and Norbuprenorphine in Urine
 High-Throughput, Cost-Efficient LC-MS/MS Forensic Method for Measuring and in Urine Xiaolei Xie, Joe DiBussolo, Marta Kozak; Thermo Fisher Scientific, San Jose, CA Application Note 627 Key Words, norbuprenorphine,
Knowledge discovery tools 381
 Knowledge discovery tools 381 hours, and prime time is prime time precisely because more people tend to watch television at that time.. Compare histograms from di erent periods of time. Changes in histogram
38 Int'l Conf. Bioinformatics and Computational Biology BIOCOMP'16
 38 Int'l Conf. Bioinformatics and Computational Biology BIOCOMP'16 PGAR: ASD Candidate Gene Prioritization System Using Expression Patterns Steven Cogill and Liangjiang Wang Department of Genetics and
DIAGNOSTIC ACCREDITATION PROGRAM. Spirometry Quality Control Plan
 DIAGNOSTIC ACCREDITATION PROGRAM Spirometry Quality Control Plan Table of Contents Introduction...1 Spirometry Definitions and Requirements...2 Spirometry Requirements... 2...4 Daily Quality Control (see
Nature Methods: doi: /nmeth.3115
 Supplementary Figure 1 Analysis of DNA methylation in a cancer cohort based on Infinium 450K data. RnBeads was used to rediscover a clinically distinct subgroup of glioblastoma patients characterized by
A Method for Statistical Process Control of Radiation Sterilization Facilities
 A Method for Statistical Process Control of Radiation Sterilization Facilities 2006 A Method for Statistical Process Control (SPC) of Radiation Sterilization Facilities Scope This document describes a
PosterREPRINT RAPID, SELECTIVE SCREENING OF URINE SAMPLES FOR GLUCURONIDES BY LC/MS/MS INTRODUCTION ABSTRACT
 ABSTRACT The traditional study of in vivo drug metabolism in plasma or urine samples is often complicated by the presence of many endogenous compounds. Several mass spectrometric techniques are often applied
Dr. Erin E. Chambers Waters Corporation. Presented by Dr. Diego Rodriguez Cabaleiro Waters Europe Waters Corporation 1
 Development of an SPE-LC/MS/MS Assay for the Simultaneous Quantification of Amyloid Beta Peptides in Cerebrospinal Fluid in Support of Alzheimer s Research Dr. Erin E. Chambers Waters Corporation Presented
Preliminary Report on Simple Statistical Tests (t-tests and bivariate correlations)
") Preliminary Report on Simple Statistical Tests (t-tests and bivariate correlations) After receiving my comments on the preliminary reports of your datasets, the next step for the groups is to complete
Preliminary Report on Simple Statistical Tests (t-tests and bivariate correlations) After receiving my comments on the preliminary reports of your datasets, the next step for the groups is to complete
AP Statistics. Semester One Review Part 1 Chapters 1-5
 AP Statistics Semester One Review Part 1 Chapters 1-5 AP Statistics Topics Describing Data Producing Data Probability Statistical Inference Describing Data Ch 1: Describing Data: Graphically and Numerically
Robust extraction, separation, and quantitation of structural isomer steroids from human plasma by SPE-UHPLC-MS/MS
 TECHNICAL NOTE 21882 Robust extraction, separation, and quantitation of structural isomer steroids human plasma by SPE-UHPLC-MS/MS Authors Jon Bardsley 1, Kean Woodmansey 1, and Stacy Tremintin 2 1 Thermo
Chapter 1: Exploring Data
 Chapter 1: Exploring Data Key Vocabulary:! individual! variable! frequency table! relative frequency table! distribution! pie chart! bar graph! two-way table! marginal distributions! conditional distributions!
Data Independent MALDI Imaging HDMS E for Visualization and Identification of Lipids Directly from a Single Tissue Section
 Data Independent MALDI Imaging HDMS E for Visualization and Identification of Lipids Directly from a Single Tissue Section Emmanuelle Claude, Mark Towers, and Kieran Neeson Waters Corporation, Manchester,
Quality Assurance Mapping Your QC Program Equipment and Test Quality. Susan Blonshine RRT, RPFT, FAARC, AE-C
 Quality Assurance Mapping Your QC Program Equipment and Test Quality Susan Blonshine RRT, RPFT, FAARC, AE-C How to Begin Gather resources Define PF scope of service Procedures performed Equipment Describe
Spatiotemporal clustering of synchronized bursting events in neuronal networks
 Spatiotemporal clustering of synchronized bursting events in neuronal networks Uri Barkan a David Horn a,1 a School of Physics and Astronomy, Tel Aviv University, Tel Aviv 69978, Israel Abstract in vitro
Top 10 Tips for Successful Searching ASMS 2003
 Top 10 Tips for Successful Searching I'd like to present our top 10 tips for successful searching with Mascot. Like any hit parade, we will, of course, count them off in reverse order 1 10. Don t specify
QUALITY MONITORING OF INSTANT WHOLE MILK POWDER USING VARIOUS CONTROL METHODS
 QUALITY MONITORING OF INSTANT WHOLE MILK POWDER USING VARIOUS CONTROL METHODS Mansi Gupta 1, Ayush Garg 2 1Department of Food Science, The University of Auckland, Auckland, New Zealand 2Department of Chemical
Clustering mass spectrometry data using order statistics
 Proteomics 2003, 3, 1687 1691 DOI 10.1002/pmic.200300517 1687 Douglas J. Slotta 1 Lenwood S. Heath 1 Naren Ramakrishnan 1 Rich Helm 2 Malcolm Potts 3 1 Department of Computer Science 2 Department of Wood
Evaluation of an LC-MS/MS Research Method for the Analysis of 33 Benzodiazepines and their Metabolites
 Evaluation of an LC-MS/MS Research Method for the Analysis of 33 Benzodiazepines and their Metabolites Valérie Thibert 1, Norbert Dirsch 2, Johannes Engl 2, Martin Knirsch 2 1 Thermo Fisher Scientific,
LC-MS. Pre-processing (xcms) W4M Core Team. 29/05/2017 v 1.0.0
 W4M Core Team. 29/05/2017 v 1.0.0") LC-MS Pre-processing (xcms) W4M Core Team 29/05/2017 v 1.0.0 Acquisition files upload and pre-processing with xcms: extraction, alignment and retention time drift correction. SECTION 1 2 LC-MS Data What
LC-MS Pre-processing (xcms) W4M Core Team 29/05/2017 v 1.0.0 Acquisition files upload and pre-processing with xcms: extraction, alignment and retention time drift correction. SECTION 1 2 LC-MS Data What
Chapter 1. Introduction
 Chapter 1 Introduction 1.1 Motivation and Goals The increasing availability and decreasing cost of high-throughput (HT) technologies coupled with the availability of computational tools and data form a
Mobile Health Application for Early Disease Outbreak-Period Detection
 Mobile Health Application for Early Disease Outbreak-Period Detection Preetika Rani preetika125@gmail.com Vaskar Raychoudhury vaskar@ieee.org Sandeep Singh Sandha sandha.iitr@gmail.com Dhaval Patel patelfec@iitr.ac.in
Statistical Process Control for Software
 Statistical Process Control for Software Anita D. Carleton Software Engineering Institute Carnegie Mellon University Pittsburgh, PA 15213-389 Sponsored by the U.S. Department of Defense 1999 by Carnegie