Award Number: W81XWH TITLE: Biochemical characterisation of TSC1 and TSC2 variants identified in patients with tuberous sclerosis complex
|
|
|
- Austen Watkins
- 6 years ago
- Views:
Transcription
1 Award Number: W81XWH TITLE: Biochemical characterisation of TSC1 and TSC2 variants identified in patients with tuberous sclerosis complex PRINCIPAL INVESTIGATOR:Mark Nellist CONTRACTING ORGANIZATION:Erasmus MC The Netherlands REPORT DATE:July 2010 TYPE OF REPORT:Final PREPARED FOR: U.S. Army Medical Research and Materiel Command Fort Detrick, Maryland DISTRIBUTION STATEMENT: X Approved for public release; distribution unlimited The views, opinions and/or findings contained in this report are those of the author(s) and should not be construed as an official Department of the Army position, policy or decision unless so designated by other documentation.
2 REPORT DOCUMENTATION PAGE Form Approved OMB No Public reporting burden for this collection of information is estimated to average 1 hour per response, including the time for reviewing instructions, searching existing data sources, gathering and maintaining the data needed, and completing and reviewing this collection of information. Send comments regarding this burden estimate or any other aspect of this collection of information, including suggestions for reducing this burden to Department of Defense, Washington Headquarters Services, Directorate for Information Operations and Reports ( ), 1215 Jefferson Davis Highway, Suite 1204, Arlington, VA Respondents should be aware that notwithstanding any other provision of law, no person shall be subject to any penalty for failing to comply with a collection of information if it does not display a currently valid OMB control number. PLEASE DO NOT RETURN YOUR FORM TO THE ABOVE ADDRESS. 1. REPORT DATE 2. REPORT TYPE Final 3. DATES COVERED 4. TITLE AND SUBTITLE 5a. CONTRACT NUMBER Biochemical characterisation of TSC1 and TSC2 variants identified in patients with tuberous sclerosis complex 5b. GRANT NUMBER W81XWH c. PROGRAM ELEMENT NUMBER 6. AUTHOR(S) 5d. PROJECT NUMBER Mark Nellist, Marianne Hoogeveen-Westerveld, Dicky Halley 5e. TASK NUMBER 5f. WORK UNIT NUMBER 7. PERFORMING ORGANIZATION NAME(S) AND ADDRESS(ES) 8. PERFORMING ORGANIZATION REPORT NUMBER Erasmus MC, The Netherlands 9. SPONSORING / MONITORING AGENCY NAME(S) AND ADDRESS(ES) 10. SPONSOR/MONITOR S ACRONYM(S) U.S. Army Medical Research and Materiel Command, Fort Detrick, Maryland SPONSOR/MONITOR S REPORT NUMBER(S) 12. DISTRIBUTION / AVAILABILITY STATEMENT Approved for public release; distribution unlimited 13. SUPPLEMENTARY NOTES 14. ABSTRACT The key findings of the project during the research period (1/7/07-31/7/10) are as follows: 1. Derivation and functional testing of 107 TSC2 variants: 69 classified as ; 38 classified as probably neutral.. 2. Development of an In-Cell Western assay to measure TSC1-TSC2 activity. 3. Demonstration that TSC1 missense mutations inactivate the TSC1-TSC2 complex to cause TSC. 4. Derivation and functional testing of 45 unclassified TSC1 variants: 16 classified as ; 29 classified as probably neutral 5. Identification of TSC1 functional domains. 6. Improvements in assay cost, throughput and reproducibility. 15. SUBJECT TERMS Tuberous Sclerosis Complex, unclassified variants, TSC1, TSC2 16. SECURITY CLASSIFICATION OF: 17. LIMITATION OF ABSTRACT a. REPORT b. ABSTRACT U c. THIS PAGE U U U 18. NUMBER OF PAGES a. NAME OF RESPONSIBLE PERSON USAMRMC 19b. TELEPHONE NUMBER (include area code) Standard Form 298 (Rev. 8-98) Prescribed by ANSI Std. Z39.18
3 Table of Contents Introduction page 5 Body page 6 Key Research Accomplishments page 9 Reportable Outcomes page -9 Conclusions page 11 References page 12 Supporting Data Appendix 1 page Appendix 2 page Appendix 3 page Appendix 4 page 124
4 Introduction Subject: Tuberous sclerosis complex (TSC) is a genetic disorder caused by mutations in the TSC1 and TSC2 tumour suppressor genes [1-3]. The TSC1 and TSC2 gene products form a protein complex that inhibits the activity of the mammalian target of rapamycin (mtor) complex 1 (TORC1). TORC1 coordinates nutritional, hormonal and other cues to regulate the cellular growth machinery. Therefore, inactivation of the TSC1-TSC2 complex results in inappropriate TORC1 activity and cell growth defects [4]. Mutation analysis of the TSC1 and TSC2 genes is a useful diagnostic tool for helping individuals and families affected by TSC [5]. In most cases of TSC, a definite TSC1 or TSC2 mutation is identified. However, in some cases it is difficult to determine whether identified sequence changes are or not. These 'unclassified variants', typically missense changes, small in-frame insertions or deletions, or changes that could affect splicing, present a significant problem for diagnostics and genetic counselling. Purpose: The purpose of this research project was to develop and apply assays of TSC1-TSC2 function to determine whether unclassified TSC1 and TSC2 variants are or not. In this way, the individuals carrying these variants, as well as their families, could obtain clearer information about their condition and the associated risks. Furthermore, correlation of the biochemical effects of the different variants with the observed patient phenotypes could provide insight into genotype-phenotype correlations in TSC, and the identification of amino acids and/or regions that are important for different aspects of TSC1-TSC2 function could help define the structural and catalytic domains of the TSC1- TSC2 complex. Scope: The specific aims of the project were to: 1. Apply functional assays to determine whether specific TSC1 and TSC2 variants are mutations. 2. Determine whether specific TSC1 and TSC2 mutations are associated with specific TSC phenotypes. 3. To identify amino acid residues that are essential for TSC1 or TSC2 function. 4. To develop a simple, reliable and rapid test for TSC1-TSC2 function. 5
5 Body 1. Application of functional assays to determine whether specific TSC1 and TSC2 variants are mutations. The TSC1-TSC2 complex inhibits the mammalian target of rapamycin (mtor) complex 1 (TORC1), preventing the phosphorylation of TORC1 substrates, including p70 S6 kinase (S6K) [4]. To investigate the effects of amino acid substitutions and small in-frame insertions or deletions on TSC1 and TSC2 function, we introduced the corresponding nucleotide changes into TSC1 and TSC2 expression constructs by site-directed mutagenesis and expressed the variant proteins in mammalian cells in culture. After 24 hours, cell lysates were prepared and subjected to denaturing polyacrylamide gel electrophoresis (SDS-PAGE). After transfer to nitrocellulose membranes, the activity of the TSC1 and TSC2 variants was estimated by immunoblotting. The phosphorylation status of ectopically expressed S6K and the expression levels of the TSC1 and TSC2 variants were determined using an Odyssey infra-red scanner (Li-Cor Biosciences). S6K phosphorylated at the T389 position was detected using a commercially available antibody (1A5, Cell Signaling Technology); TSC1 and total S6K were detected with a rabbit polyclonal antibody against the myc epitope tag (Cell Signaling Technology); TSC2 was detected with a rabbit polyclonal antibody [6]. Unclassified TSC1 and TSC2 variants were selected from our own patient cohort, the Leiden Open Variation Database ( case reports from literature, or were specific requests from genetic counsellors. We performed functional testing on 107 TSC2 variants and 45 TSC1 variants, applying systematic criteria to determine whether TSC1-TSC2 function was affected by the corresponding amino acid changes. A manuscript summarising the results of these experiments is currently in preparation and will be submitted for publication in the near future (see Supplementary Data: Appendix 1). At the start of the project, it was not known whether missense mutations in the TSC1 gene could cause TSC. Our work showed that TSC1 amino acid changes do occur and that, so far, they are all clustered within a conserved ~250 amino acid region close to the N-terminal of the protein. These substitutions affect the turn-over and stability of TSC1 [7, 8]. Some substitutions had no discernible effect on the activity of the TSC1-TSC2 complex in our assays. However, in some cases there was evidence from predictive computer-based algorithms (NetGene2 Server, BDGP: Splice Site Prediction by Neural Network, Human Splicing Finder, that the corresponding nucleotide changes could affect 6
6 splicing. We obtained ethical approval to approach patients for skin biopsies and have prepared RNA from fibroblasts cultures derived from patients. In one case, we detected a novel TSC2 splice isoform with a small in-frame deletion. This change was tested using our functional assay, and we concluded that it was [9]. In another case, we idenitified a putative TSC1 splice site mutation, predicted to cause an in-frame deletion. However, the deletion had no effect in our functional assay. TSC1 was still active. We concluded that this change was unlikely to be [8]. Unfortunately we were unable to complete the analysis of any other fibroblast cultures prior to the ending of the funding period. We will apply for new funding to continue and complete this work. 2. Determine whether specific TSC1 and TSC2 mutations are associated with specific TSC phenotypes. Although they occur mostly in isolation, renal angiomyolipomas (AML) are a frequent symptom in TSC patients. We investigated a case in which an individual was identified with bilateral AMLs, but without other signs suggestive for TSC. We identified 2 UVs in the probands TSC2 gene, one paternal, one maternal. Our analysis indicates that while neither variant is likely to cause TSC, it is possible that they affected the pathogenesis of the AMLs in this patient, and suggests that TSC2 variants that do not cause TSC may play a role in the aetiology of AML (see Supplementary Data: Appendix 2). We identified a TSC2 R1200W variant in multiple, unrelated families exhibiting relatively mild symptoms of TSC. We investigated the effect of the R1200W substitution on TSC2 activity in relation to the observed phenotypes (see Supplementary Data: Appendix 3). TSC-associated cortical tubers show many histopathologic similarities to the malformations associated with focal cortical dysplasia type IIb (FCD IIb). We demonstrated decreased binding between TSC2 and the TSC1 H732Y variant associated with FCD IIb [10]. 3. Effect of truncation on TSC1 and TSC2 function We studied the effects of truncating TSC1 and TSC2 mutations on the activity of the TSC1-TSC2 complex. Truncation of TSC1 revealed regions of the protein involved in stability, aggregation and interaction [11]. To study the effect of truncation on TSC2 in more detail, we removed the amino acid sequences encoded by specific exons using site-directed mutagenesis. The sequences encoded by exons 3, 5, 6, 12, 19, 22, 25 and 41 were removed. Unfortunately, due to the ending of the funding period, we were unable to investigate the effects of these deletions on the TSC1-7
7 TSC2 interaction, or on the activity of the TSC1-TSC2 complex. We will apply for new funding to continue and complete this work. 4. Identification of amino acid residues/domains that are essential for TSC1 or TSC2 function. Amino acid substitution prediction methods use sequence and/or structural information to predict the effects of amino acid changes on protein function [12, 13]. In the absence of adequate genetic or functional data, prediction methods have been applied to try and resolve whether specific variants are or not [14]. The more information there is about a particular protein, the more accurate the prediction is likely to be. We have compared our functional data with predictions using the SIFT algorithm [12, 13]. Some predicted tolerated changes were found to affect TSC1-TSC2 function; while no effect on function could be established for some changes that were predicted not to be tolerated, indicating that predictive methods are not reliable for molecular genetic diagnostics and that functional tests provide important, extra insight into the effects of different amino acid changes (see Supplementary Data: Appendix 1). Studies using truncated TSC2 proteins [15, 16], indicate that the N-terminal region of TSC2 is important for the interaction with TSC1. Interaction between TSC1 and TSC2 stabilises TSC1 in a soluble, TSC2-bound form, increasing the amount of TSC1 detected by immunoblotting [17]. We quantified the effects of different TSC2 variants on TSC1 expression levels. TSC1 expression levels were reduced in the presence of TSC2 variants with amino acid changes to the N-terminal region of the protein (amino acids 1-900). In contrast, most changes to the C-terminal region of TSC2 (amino acids ) did not have such a large effect on TSC1 expression levels. Nevertheless, amino acid substitutions within this region still resulted in inactivation of the TSC1-TSC2 complex, as estimated from the T389 phosphorylation of S6K (see Supplementary Data: Appendix 1). Our studies on a series of truncated TSC1 proteins as well as on a number of TSC1 amino acid changes showed that a conserved ~250 amino acid region close to the N-terminal of the TSC1 is required for TSC1 stability [7, 8, 11]. 4. Development of a rapid test for TSC1-TSC2 function. At the start of the project our approach was to perform several different tests to analyse TSC1-TSC2 binding and the effect of TSC1-TSC2 expression on TORC1 activity. We set up an in-cell Western (ICW) assay for analysing TSC2 variants [18]. ICW assays have 8
8 the advantage of being reproducible, amenable to automation and simple to perform. However, the ICW required large quantities of antibody, making the test relatively expensive. Therefore, we decided to focus on improving our immunoblot assay. The ability to reproducibly quantify the intensity of the signals obtained by immunoblotting [19] has made it possible to reliably estimate the differences between the variants being tested, wild-type TSC2 and known inactive, variants. We have been able to improve the immunoblot assay so that larger numbers of variants can be analysed more easily and accurately, and at a reduced cost per analysed variant (see Supplementary Data: Appendix 1). Key Research Accomplishments (1/7/07-31/7/10) 1. Derived and tested 107 TSC2 variants: 69 ; 38 probably neutral. 2. Derived and tested 45 TSC1 variants: 16 ; 29 probably neutral. 3. Improvements in assay cost, throughput and reproducibility. 4. Identification of regions of TSC1 involved in interactions, stability and aggregation. 5. Identification of regions of TSC2 involved in the interaction with TSC1. Reportable Outcomes (since the start of the project) 1. Manuscripts (see Supplementary Data: Appendix 4): Nellist M, Sancak O, Goedbloed M, Adriaans, Wessels M, Maat-Kievit A, Baars M, Dommering C, van den Ouweland A and Halley D. "Functional characterisation of the TSC1- TSC2 complex te assess multiple TSC2 variants identified in single families affected by tuberous sclerosis complex". BMC Med. Genet. (2008) 9:10 doi: / Nellist M, van den Heuvel D, Schluep D, Exalto C, Goedbloed M, Maat-Kievit A, van Essen T, van Spaendonck-Zwarts, Jansen F, Helderman P, Bartalini G, Vierimaa O, Penttinen M, van den Ende J, van den Ouweland A and Halley D. "Missense mutations to the TSC1 gene cause tuberous sclerosis complex". Eur. J. Hum. Genet. (2009) 17:
9 Coevoets R, Arican S, Hoogeveen-Westerveld M, Simons E, van den Ouweland A, Halley D and Nellist M. "A reliable cell-based assay for testing unclassified TSC2 gene variants." Eur. J. Hum. Genet. (2009) 17: Mozaffari M, Hoogeveen-Westerveld M, Kwiatkowski D, Sampson J, Ekong R, Povey S, den Dunnen J, van den Ouweland A, Halley D and Nellist M. "Identification of a region required for TSC1 stability by functional analysis of TSC1 missense mutations found in individuals with tuberous sclerosis complex". BMC Med. Genet. (2009) 10:88 doi: / Lugnier C, Majores M, Fassunke J, Pernhorst K, Niehusmann P, Simon M, Nellist M, Schoch S and Becker A. "Hamartin variants that are frequent in focal dysplasias and cortical tubers have reduced tuberin binding and aberrant subcellular distribution in vitro". J. Neuropathol. Exp. Neurol. (2009) 68: Hoogeveen-Westerveld M, Exalto C, Maat-Kievit A, van den Ouweland A, Halley D and Nellist M. "Analysis of TSC1 truncations defines regions involved in TSC1 stability, aggregation and interaction. Biochim. Biophys. Acta (2010), doi: /j.bbadis Abstracts/Presentations: Nellist M "Functional analysis of TSC1 and TSC2 variants" 9th International Research Conference on Tuberous Sclerosis Complex, 11-13th September 2008, University of Sussex, Brighton, U.K. (invited talk). Mozaffari M, Hoogeveen-Westerveld M and Nellist M "Functional analysis of TSC1 missense mutations identified in individuals with tuberous sclerosis complex" Poster Session, 6th November 2008, LAM/TSC Seminar series, Harvard Medical School, Boston, Massachusetts, U.S.A. (poster presentation). 10
10 Nellist M "Genetic basis of tuberous sclerosis complex" 8th Dutch Endo-Neuro-Psycho Meeting, 3rd - 5th June 2009, Doorwerth, The Netherlands. (invited talk) Nellist M "Functional analysis of TSC1 and TSC2 variants identified in individuals with tuberous sclerosis complex" 9th July 2009, Department of Neuropathology, University Hospital, Bonn, Germany (invited talk) 3. Degrees awarded (supported by this award): none 4. Databases: Data generated by this study will be added to the LOVD TSC1 and TSC2 mutation databases [7, 8]. Conclusions Pathogenic, non-truncating TSC1 and TSC2 mutations can be distinguished from non changes by studying the effects of the changes on the TSC1-TSC2 protein complex. Functional characterisation of unclassified TSC1 and TSC2 variants complements existing diagnostic tests and enables appropriate clinical care and counselling for more TSC patients and their relatives. According to the results of our functional assessment we classified 69 TSC2 variants and 16 TSC1 variants as, and 38 TSC2 variants and 29 TSC1 variants as probably neutral. Characterisation of multiple TSC1 and TSC2 variants has helped refine the important structural and catalytic regions in TSC1 and TSC2 and should help provide insight into the folding and three-dimensional structure of the TSC1-TSC2 complex, as well as the regulation and mechanism of GAP catalysis. The stability of different variants, the strength of the TSC1- TSC2 interaction and the catalytic GAP activity all influence the biological activity of the TSC1-TSC2 complex. Innovations: The functional characterisation of TSC1 and TSC2 variants has extended the diagnostic service that can be offered to TSC patients and their families. Further, it has helped 11
11 refine important structural and functional regions in TSC1 and TSC2, and identified specific genotype-phenotype correlations in TSC. Impact: Tests to distinguish and non- TSC1 and TSC2 variants are of direct importance to the individuals who carry or may inherit these variants. The data generated by this study should benefit individuals and families in whom the tested variants are identified. Comparison of the biochemical effects of different variants with the corresponding phenotypes in affected individuals has provided insight into possible genotypephenotype correlations in TSC. Several reports indicate that specific non-truncating TSC2 mutations are associated with a less severe TSC phenotype. Finally, the identification of amino acids essential for TSC1-TSC2 function has provided more insight into TSC1-TSC2 function. These data will be useful not only for assessing and testing the accuracy of current predictive methods of amino acid substitution analysis but also in the development of improved predictive algorithms for analysing unclassified TSC1 and TSC2 variants. References 1. Gomez M, Sampson J, Whittemore V, eds. The tuberous sclerosis complex. Oxford University Press, Oxford, UK, The European Chromosome 16 TSC Consortium. Identification and characterisation of the tuberous sclerosis gene on chromosome 16. Cell 75 (1993) van Slegtenhorst M, de Hoogt R, Hermans C, Nellist M, Janssen LAJ, Verhoef S, Lindhout D, van den Ouweland AMW, Halley DJJ, Young J, Burley M, Jeremiah S, Woodward K, Nahmias J, Fox M, Ekong R, Wolfe J, Povey S, Osborne J, Snell RG, Cheadle JP, Jones AC, Tachataki M, Ravine D, Sampson JR, Reeve MP, Richardson P, Wilmer F, Munro C, Hawkins TL, Sepp T, Ali, JBM, Ward S, Green AJ, Yates JRW, Short MP, Haines JH, Jozwiak S, Kwiatkowska J, Henske EP and Kwiatkowski DJ. Identification of the tuberous sclerosis gene (TSC1) on chromosome 9q34. Science (1997)
12 4. Huang J and Manning BD: The TSC1-TSC2 complex: a molecular switchboard controlling cell growth. Biochem J. (2008) Sancak O, Nellist M, Goedbloed M, Elfferich P, Wouters C, Maat-Kievit A, Zonnenberg B, Verhoef S, Halley D and van den Ouweland A. Mutational analysis of the TSC1 and TSC2 genes in a diagnostic setting: Genotype - phenotype correlations and comparison of diagnostic DNA techniques in Tuberous Sclerosis Complex. Eur. J. Hum. Genet. (2005) Nellist M, Sancak O, Goedbloed MA, Rohe C, van Netten D, Mayer K, Tucker- Williams A, van den Ouweland AMW and Halley DJJ. Distinct effects of single amino acid changes to tuberin on the function of the tuberin-hamartin complex. Eur. J. Hum. Genet. (2005) Nellist M, van den Heuvel D, Schluep D, Exalto C, Goedbloed M, Maat-Kievit A, van Essen T, van Spaendonck-Zwarts, Jansen F, Helderman P, Bartalini G, Vierimaa O, Penttinen M, van den Ende J, van den Ouweland A and Halley D. Missense mutations to the TSC1 gene cause tuberous sclerosis complex. Eur. J. Hum. Genet. (2009) Mozaffari M, Hoogeveen-Westerveld M, Kwiatkowski D, Sampson J, Ekong R, Povey S, den Dunnen J, van den Ouweland A, Halley D and Nellist M. Identification of a region required for TSC1 stability by functional analysis of TSC1 missense mutations found in individuals with tuberous sclerosis complex. BMC Med. Genet. (2009) 10:88 9. Jansen FE, Braams O, Vincken KL, Algra A, Anbeek P, Jennekens-Schinkel A, Halley D, Zonnenberg BA, van den Ouweland A, van Huffelen AC, van Nieuwenhuizen O and Nellist M. Overlapping neurologic and cognitive phenotypes in patients with TSC1 or TSC2 mutations. Neurology (2008) Lugnier C, Majores M, Fassunke J, Pernhorst K, Niehusmann P, Simon M, Nellist M, Schoch S and Becker A. Hamartin variants that are frequent in focal dysplasias and cortical tubers have reduced tuberin binding and aberrant subcellular distribution in vitro. J. Neuropathol. Exp. Neurol. (2009)
13 11. Hoogeveen-Westerveld M, Exalto C, Maat-Kievit A, van den Ouweland A, Halley D and Nellist M. Analysis of TSC1 truncations defines regions involved in TSC1 stability, aggregation and interaction. Biochim. Biophys. Acta (2010), doi: /j.bbadis Ng PC and Henikoff S. Predicting the effects of amino acid substitutions on protein function. Annu. Rev. Genomics Hum. Genet. (2006) Ng PC and Henikoff S. Accounting for human polymorphisms predicted to affect protein function. Genome Res. (2002) Mathe E, Olivier M, Kato S, Ishioka C, Hainaut P and Tavtigian SV. Computational approaches for predicting the biological effect of p53 missense mutations: a comparison of three sequence analysis based methods. Nuc. Acids. Res. (2006) Nellist M, Verhaaf B, Goedbloed M, Reuser A, van den Ouweland A and Halley D. TSC2 missense mutations inhibit tuberin phosphorylation and prevent formation of the tuberin-hamartin complex. Hum. Molec. Genet. (2001) Li Y, Inoki K, Guan K-L. Biochemical and functional characterization of small GTPase Rheb and TSC2 GAP activity. Mol. Cell Biol. (2004) Nellist M, van Slegtenhorst M, Goedbloed M, van den Ouweland A, Halley D and van der Sluijs P. Characterization of the cytosolic tuberin-hamartin complex: tuberin is a cytosolic chaperone for hamartin. J. Biol. Chem. (1999) Coevoets R, Arican S, Hoogeveen-Westerveld M, Simons E, van den Ouweland A, Halley D and Nellist M. A reliable cell-based assay for testing unclassified TSC2 gene variants. Eur. J. Hum. Genet. (2009) Schutz-Geschwender A, Zhang Y, Holt T, McDermitt D and Olive DM (2004) Quantitative, two-color Western blot detection with infrared fluorescence. (25 Jul.2006). 14
14 Supporting Data Appendix 1: Functional assessment of variants in the TSC1 and TSC2 genes identified in individuals with Tuberous Sclerosis Complex (manuscript in preparation) Appendix 2: Unclassified TSC2 variants associated with bilateral, sporadic angiomyolipoma (manuscript in preparation) Appendix 3: The TSC2 c.3598c>t (p.r1200w) missense mutation co-segregates with tuberous sclerosis complex in multiple mildy affected kindreds (manuscript in preparation) Appendix 4: publications 15
15 Appendix 1: Title page: Functional assessment of variants in the TSC1 and TSC2 genes identified in individuals with Tuberous Sclerosis Complex Marianne Hoogeveen-Westerveld 1, Marjolein Wentink 1, Diana van den Heuvel 1, Melika Mozaffari 1, Rosemary Ekong 2, Sue Povey 2, Johan den Dunnen 3, Kay Metcalfe 4, Stephanie Vallee 5, Stefan Krueger 6, JoAnn Bergoffen 7, Vandana Shashi 8, Frances Elmslie 9, David Kwiatkowski 10, Julian Sampson 11, Anneke Maat-Kievit 1, Ans van den Ouweland 1, Dicky Halley 1 and Mark Nellist 1 1 Department of Clinical Genetics, Erasmus Medical Centre, 3015 GE Rotterdam, The Netherlands. 2 Research Department of Genetics, Evolution and Environment, University College London, London NW1 2HE, U.K. 3 Department of Human and Clinical Genetics, Leiden University Medical Centre, 2333 ZC Leiden, The Netherlands. 4 Department of Genetic Medicine, Central Manchester University Hospitals NHS Foundation Trust, Manchester M13 9WL, U.K. 5 Department of Clinical Genetics, Dartmouth-Hitchcock Medical Center, Lebanon, NH 03756, U.S.A. 6 Center for Human Genetics, Gutenbergstr. 5, D Dresden, Germany. 7 Department of Genetics, 5755 Cottle Road, San Jose, CA 95123, U.S.A. 16
16 8 Department of Pediatrics, Duke University Medical Center, Durham, NC, U.S.A. 9 Department of Medical Genetics, St. George's Hospital, London SW17 0RE, U.K. 10 Translational Medicine Division, Brigham and Womens Hospital, Boston MA 02115, U.S.A. 11 Institute of Medical Genetics, University of Wales College of Medicine, Heath Park, Cardiff CF4 4XN, U.K. To whom correspondence should be addressed: Dr. Mark Nellist, Department of Clinical Genetics, Erasmus Medical Centre, Dr. Molewaterplein 50, 3015 GE Rotterdam, The Netherlands, Tel: ; Fax: ; m.nellist@erasmusmc.nl Running title: Functional assessment of TSC1 and TSC2 variants 17
17 Abstract The effects of missense changes and small in-frame deletions and insertions on protein function are not easy to predict. The identification of such unclassified variants (UVs) in individuals at risk of genetic disease can complicate genetic counselling. One solution is to perform functional tests to assess whether UVs affect protein function. We have used this strategy to characterise variants identified in the TSC1 and TSC2 genes in individuals with, or suspected of having, Tuberous Sclerosis Complex (TSC). Here we present an overview of our functional studies on 45 TSC1 and 107 TSC2 variants. Using a standardised protocol we classified 16 TSC1 variants and 69 TSC2 variants as. Keywords: tuberous sclerosis complex, TSC1, TSC2, unclassified variants 18
18 Introduction Tuberous Sclerosis Complex (TSC) is an autosomal dominant disorder characterised by the development of hamartomas in a variety of organs and tissues, most notably the brain, skin and kidneys [Gomez et al., 1999]. Most individuals with TSC have epilepsy and many suffer from cognitive impairments and/or autism-spectrum disorders. Mutations in either the TSC1 gene on chromosome 9q34 [van Slegtenhorst et al., 1997], or the TSC2 gene on chromosome 16p13.3 [European Chromosome 16 Tuberous Sclerosis Consortium, 1993] cause TSC and comprehensive mutation screens in TSC patients have identified a wide variety of mutations [Jones et al., 1999; Niida et al., 1999; Dabora et al., 2001; Sancak et al., 2005; Au et al., 2007]. Most TSC1 and TSC2 mutations result in premature termination of the respective open-reading frame and complete inactivation of the mutated allele. However, approximately 20% of the mutations identified in the TSC2 gene, and a small number of TSC1 mutations [Hodges et al., 2001; Nellist et al. 2009], are nonterminating missense changes or small in-frame deletions or insertions. The consequences of such non-terminating changes are not easy to predict with certainty, making it difficult to distinguish disease-causing mutations from neutral (non-) variants, particularly if clinical and/or genetic data are incomplete. In a cohort of 490 putative TSC cases, we identified 29 variants (6% of the total) that could not be classified as either or neutral from the available clinical and genetic data [Sancak et al., 2005]. In such cases, in vitro functional comparisons between the wild-type and variant proteins can help assess whether an unclassified variant (UV) is or not [Nellist et al. 2008]. The TSC1 and TSC2 gene products, TSC1 and TSC2, interact to form a protein complex that integrates multiple growth factor- and energy-dependent signals to help control cell growth [Inoki and Guan, 2009]. The N-terminal region of TSC2 is required for the 19
19 binding with TSC1 [Li et al., 2004], while the TSC2 C-terminal region contains the active site of the complex, an "asparagine-thumb" GTPase activating protein (GAP) domain [Daumke et al., 2004]. The TSC1-TSC2 complex stimulates the GTPase activity of RHEB to promote the conversion of active, GTP-bound RHEB to inactive RHEB-GDP and thereby prevent the RHEB-GTP-dependent stimulation of the mammalian target of rapamycin (mtor) complex 1 (TORC1) [Li et al., 2003]. In cells lacking either TSC1 or TSC2, the downstream targets of TORC1, including elongation factor 4E binding protein 1 (4E-BP1), p70 S6 kinase (S6K) and ribosomal protein S6, are constitutively phosphorylated [Zhang et al., 2003; Kwiatkowski et al., 2001]. The effects of specific amino acid changes on TSC1-TSC2 complex formation, on the activation of RHEB GTPase activity by the complex, and on the phosphorylation status of 4E-BP1, S6K and S6, have been determined [Nellist et al., 2001; Inoki et al. 2002, Tee et al, 2002]. Pathogenic missense changes in the N-terminal region of TSC1 (amino acids ) reduce TSC1 stability [Nellist et al. 2009; Mozaffari 2009]. Pathogenic missense changes in TSC2 have distinct effects on the TSC1-TSC2 complex, depending on the region of TSC2 that is affected. Some TSC2 amino acid substitutions prevent TSC1-TSC2 complex formation while others do not affect TSC1-TSC2 binding, but still inactivate the complex [Nellist et al., 2005]. Interestingly, although TSC2 mutations are generally associated with a more severe TSC phenotype [Dabora et al. 2001], there are several reports of families where specific TSC2 missense mutations cosegregate with apparently mild forms of the disease [Khare et al., 2001; O'Connor et al., 2003; Mayer et al., 2004; Jansen et al., 2006]. This raises the possibility that specific types of TSC1 or TSC2 mutation may help determine the clinical course of the disease, as has been proposed for the neurodevelopmental abnormalities associated with TSC [de Vries and Howe, 2007]. In other genetic diseases, clear correlations 20
20 between the effects of specific missense mutations on protein function and the clinical course are recognised [Hermans et al., 2004] and for individuals with specific TSC1 or TSC2 variants, it would be useful to be able to predict whether the detected changes are more or less likely to lead to a severe phenotype. Previously we have used immunoblotting, double-label immunofluorescent microscopy, in-cell Western analysis and GAP assays to study the effects of 47 TSC2 missense and in-frame insertions/deletions and 26 TSC1 missense and in-frame insertions/deletions on TSC1-TSC2 activity [Nellist et al., 2005; Jansen et al., 2006, Jansen et al., 2008, Nellist et al., 2008, Nellist et al., 2009; Coevoets et al., 2009; Mozaffari et al., 2009]. Here we compare these 73 variants to 79 new variants (19 TSC1 and 60 TSC2) using a standardised protocol. To assess the effects of the variants on both the formation and activity of the TSC1-TSC2 complex we decided to use immunoblotting followed by infra-red scanner-based detection. In our experience, double-label microscopy and GAP assays were too labour-intensive and/or unreliable for routine use and, although the in-cell Western was a simple and reliable assay [Coevoets et al., 2009], it required large amounts of (expensive) antibodies and did not provide information on the TSC1-TSC2 interaction. Our aim was to investigate the reliability of the assay, the degree of concordance between the in vitro results and computer-based predictive methods and, ultimately, to use the results of the functional assessment to determine whether UVs identified in individuals with, or suspected of having, TSC were. Furthermore, we hoped to gain insight into the structural properties of TSC1 and TSC2 by comparing the properties of the different variants. Materials and Methods TSC1 and TSC2 variants 21
21 The relative positions of the variants selected for functional assessment are shown in Figure 1. Previously untested variants are indicated in Tables 1., 2. and 3. It is important to note that the TSC2 variants were compared to wild-type TSC2 as originally described [European Chromosome 16 Tuberous Sclerosis Consortium, 1993]. This isoform lacks the amino acids encoded by the alternatively spliced exon 31. The amino acid numbering according to the TSC2 Leiden Open Variation Database (LOVD) ( where this differs from the original numbering due to the inclusion of exon 31, is given in Table 3. Constructs and antisera Expression constructs encoding the TSC1 and TSC2 variants were derived from the wild-type expression constructs [Nellist et al., 2005] using the QuikChange site-directed mutagenesis kit (Stratagene, La Jolla, U.S.A.). In each case the complete open reading frame of the mutated construct was verified by sequence analysis. In most cases, multiple clones were isolated, checked and used for the assays described below. Other constructs used in this study have been described previously [Nellist et al., 2005]. Antibodies were purchased from Cell Signaling Technology (Danvers, U.S.A.) (1A5, anti T389 phospho-s6k mouse monoclonal; 9B11, anti-myc tag mouse monoclonal; anti-myc tag rabbit polyclonal), Li-Cor Biosciences (Lincoln, U.S.A.) (goat anti-rabbit 680 nm and goat anti-mouse 800 nm conjugates) or DAKO (Glostrup, Denmark) (cyanine (Cy2)-coupled secondary antibodies against mouse immunoglobulins), or have been described previously [van Slegtenhorst et al., 1998]. Transfection-based immunoblot assay for functional assessment of TSC1 and TSC2 variants 22
22 TSC1 and TSC2 variants were assayed using essentially the same protocol. HEK 293T cells were seeded into 24-well plates and grown overnight in Dulbecco's modified Eagle medium (DMEM) (Lonza, Verviers, Belgium) supplemented with 10% foetal bovine serum, 50 U/ml penicillin and 50 μg/ml streptomycin in a 10% carbon dioxide humidified incubator. Cells at 80-90% confluency were transfected with 0.2 μg TSC2 expression construct, 0.4 μg TSC1 expression construct and 0.1 μg S6K expression construct using 2.1 μg polyethyleneimine (Polysciences Inc., Warrington, U.S.A.) in DMEM, as described previously [Coevoets et al., 2009]. For control transfections, pcdna3 vector DNA was added to make a total of 0.7 μg DNA per transfection. In each experiment up to 20 TSC1 or TSC2 variants were tested. Cells expressing the TSC2 variants were compared to cells expressing wild-type TSC1-TSC2, a known variant (TSC2-R611Q [Nellist et al., 2005]), TSC1 and S6K only (no TSC2), and cells transfected with vector DNA only (control). Cells expressing the TSC1 variants were compared to wild-type TSC1-TSC2, a known variant (TSC1-L117P [Nellist et al., 2009]), TSC2 and S6K only (no TSC1), TSC1 and S6K only (no TSC2) and cells transfected with vector DNA only (control). After 4 hours the transfection mixtures were replaced with DMEM supplemented with 10% foetal bovine serum, 50 U/ml penicillin and 50 μg/ml streptomycin. Twenty-four hours after transfection the cells were transferred to ice, washed with phosphate-buffered saline (PBS) (4 o C) and harvested in 75 μl lysis buffer (50 mm Tris-HCl ph 8.0, 150 mm NaCl, 50 mm NaF and 1% Triton X100, containing a protease inhibitor cocktail (Complete, Roche Molecular Biochemicals, Woerden, The Netherlands)). The soluble, supernatant fractions were recovered by centrifugation ( g for 10 minutes at 4 o C), diluted in loading buffer and incubated at 96 o C for 5 minutes prior to electrophoresis on Criterion TM 4-12% SDS- PAGE gradient gels (Bio-Rad, Hercules, U.S.A.) and transfer to nitrocellulose membranes, according to the manufacturer's recommendations. 23
23 Blots were blocked for 1 hour at room temperature with 5% low-fat milk powder (Campina Melkunie, Eindhoven, The Netherlands) in PBS and incubated overnight at 4 o C with the following primary antibodies: 1/ dilution of 1895 (rabbit polyclonal against TSC2 [van Slegtenhorst et al., 1998]), 1/5 000 dilution of 2197 (rabbit polyclonal against TSC1 [van Slegtenhorst et al. 1998]), 1/5 000 dilution of a rabbit polyclonal against the myc epitope tag and 1/2 000 dilution of 1A5 (mouse monoclonal against p70 S6 kinase (S6K) phosphorylated at amino acid T389). Antibodies were diluted in PBS containing 0.1 % Tween 20 (PBST) (Sigma-Aldrich Fine Chemicals, Poole, U.K). After washing 3 times for 5 minutes in PBST, the blots were incubated for 1 hour at room temperature in the dark in PBST containing 1/ dilutions of goat anti-rabbit 680 and goat anti-mouse 800 secondary antibodies. After washing 3 times for 5 minutes in PBST and once in PBS, the blots were scanned using the Odyssey TM Infrared Imager (Li-Cor Biosciences) at default intensity, medium quality, 169 μm resolution with 0 mm focus offset. To estimate the expression levels of the different proteins and the ratio of T389-phosphorylated S6K to total S6K, in the presence of the different TSC1 and TSC2 variants, the scanned blots were analysed using the Odyssey quantification software. The integrated intensities of the protein bands were determined using default settings with the 3 pixel width border mean average background correction method. To correct for the detection of endogenous proteins, we subtracted the signals detected in control cells (transfected with vector DNA only) from the corresponding TSC2, TSC1, S6K and T389-phosphorylated S6K signals for all variants. Immunofluorescent detection of TSC1 variants HEK 293T cells were seeded onto glass coverslips coated with poly-l-lysine (Sigma- Aldrich) and transfected with expression constructs encoding the TSC1 variants. Twenty-four hours after transfection the cells were fixed, permeabilised and incubated with a mouse 24
24 monoclonal antibody specific for the TSC1 C-terminal myc epitope tag, followed by a Cy2- coupled secondary antibody against mouse immunoglobulins, as described previously [Mozaffari et al. 2009]. Cells were studied using a Leica DM RXA microscope and Image Pro-Plus version 6 image analysis software. Prediction analysis To indicate whether the TSC1 and TSC2 nucleotide changes might affect RNA splicing, 3 different splice-site prediction programs were used: splicesitefinder.html, and To indicate whether the TSC1 and TSC2 amino acid substitutions were likely to affect TSC1-TSC2 structure and function, the Sorting Intolerant From Tolerant (SIFT) algorithm was used [Ng and Henikoff, 2006]. SIFT scores were calculated using multiple sequence alignments of TSC1 and TSC2 from 16 different species (human, chimpanzee, maccaca, cow, dog, horse, mouse, rat (TSC1 only), chicken, zebrafish (TSC2 only), pufferfish, honey bee (TSC1 only), fruitfly, mosquito, methylotrophic yeast (TSC2 only) and fission yeast). Results Immunoblot analysis We compared 152 variants (45 TSC1 and 107 TSC2), including 79 previously untested variants (19 TSC1 and 60 TSC2). Each variant was tested in at least 4 independent transfection experiments. In each experiment, the integrated intensities of the bands on the immunoblot corresponding to TSC2, TSC1, total S6K and T389-phosphorylated S6K were 25
25 determined for each variant relative to the integrated intensities of the bands for wild-type TSC1-TSC2. The variants were then assessed according to 3 criteria. First, to determine whether the different variants were transfected at comparable efficiencies, the total S6K signals were compared per variant. Next, the activity of TORC1, as indicated by the amount of T389-phosphorylated S6K, was estimated in the presence of the different variants. For each variant, the ratio of the T389-phosphorylated S6K signal to the total S6K signal, relative to wild-type TSC1-TSC2, was determined. We referred to this as the T389/S6K ratio. The higher the T389/S6K ratio, the higher the activity of TORC1, and therefore the lower the activity of the exogenously expressed TSC1 and TSC2. This was the primary criterium for deciding whether a variant was likely to be and cause TSC. Finally, in addition to the T389/S6K ratio, we compared the signals of the TSC1 and TSC2 variants and their wild-type binding partner (TSC1 or TSC2) to the signals for wildtype TSC1-TSC2. If the variant signal itself, or the signal of the wild-type binding partner, was significantly less than the wild-type TSC1-TSC2 complex, this was taken as supporting evidence that the variant was. Representative examples of immunoblots of 13 TSC1 variants and 15 TSC2 variants are shown in Figures 2 and 3 respectively. The mean values for the TSC2, TSC1 and S6K signals and the mean T389/S6K ratios for all the variants tested are shown in Figures 4, 5 and 6. As shown in Figures 4D, 5D and 6D, the S6K signals were relatively constant for all the variants and controls, indicating that the transfection efficiencies were comparable between the different variants. The mean T389/S6K ratios for the TSC1 and TSC2 variants are shown in Figures 4C, 5C and 6C. To determine whether the T389/S6K ratios for the different variants were significantly different from wild-type TSC1-TSC2, we performed Student's t-tests. We classified the variants with a T389/S6K ratio significantly higher than 26
26 wild-type TSC1-TSC2 (p < 0.05), as (Figures 4C, 5C and 6C and Tables 1, 2 and 3). Sixty-nine TSC2 variants (69/107; 64%) and 16 TSC1 variants (16/45; 36%) fell into this category. For variants where the T389/S6K ratio was not significantly higher than wild-type TSC1-TSC2 (p > 0.05), we compared the T389/S6K ratio to the variant that was included in each transfection experiment (TSC2 R611Q for TSC2 variants; TSC1 L117P for TSC1 variants). Variants that did not have a significantly higher T389/S6K ratio than wildtype TSC1-TSC2, had a significantly lower T389/S6K ratio than the corresponding variant, indicating that the variant was active in our assay. We classified these variants as probably neutral (Tables 1, 2 and 3). Next, we compared the signal for each variant with the corresponding signal for the wild-type protein (Figures 4B, 5A and 6A). We classified variants with a significantly lower mean signal than the corresponding wild-type protein (p < 0.05, paired t-test) as unstable (Tables 1, 2 and 3). We identified 39 unstable TSC2 variants and 16 unstable TSC1 variants. All of the unstable TSC1 variants were classified as, according to the comparisons between the variant and wild-type T389/S6K ratios. Furthermore, consistent with a previous study [Mozaffari et al., 2009], all the unstable TSC1 variants gave a diffuse cytoplasmic signal as detected by immunofluorescent microscopy, in contrast to wild-type TSC1 and the stable TSC1 variants that all gave a characteristic punctate localisation pattern (data not shown). Of the unstable TSC2 variants, 36/39 were defined as according to the comparisons of the T389/S6K ratios. In the 3 remaining cases (TSC2 R1159L, TSC2 R1159Q and TSC2 R1772C), the variant inhibited S6K T389-phosphorylation as effectively as wildtype TSC2, despite being detected at lower levels (Figure 6A and C). In a previous study we concluded that the R1772C variant was unlikely to be because an individual with this variant and TSC had another TSC2 mutation [Nellist et al., 2008]. Furthermore, individuals with this variant and no signs of TSC have 27
27 been identified ( Therefore, we classified the TSC2 R1772C variant as probably neutral (Table 3). The antiserum used to detect the TSC2 variants binds epitopes encoded by the last exon of TSC2, which includes codon 1772 (M. Wentink, M. Nellist; unpublished results). It is possible that the R1772C substitution reduces the affinity of the antiserum for TSC2, resulting in a lower immunoblot signal. The R1159L and R1159Q variants inhibited S6K-T389 phosphorylation as ceffectively as wild-type TSC2 in our assay and were therefore classified as probably neutral (Table 3) However, the reduced signals for these variants may reflect destabilising effects of the substitutions on TSC2. It is possible that the variants are too unstable to inhibit TORC1 signalling in vivo and are consequently changes (see Discussion). Finally, we compared the signals for wild-type TSC1 in the presence of the different TSC2 variants (Figures 5B and 6B), and the signals for wild-type TSC2 in the presence of the different TSC1 variants (Figure 4A). Coexpression of TSC2 helps stabilise TSC1 [Nellist et al., 1999]. Therefore we classified TSC2 variants that were associated with a significantly reduced TSC1 signal (p < 0.05, paired t-test) and TSC1 variants that were associated with a significantly reduced TSC2 signal (p < 0.05, paired t-test) as destabilising. Three TSC1 variants, L93R, N198F199delinsI and M224R, were associated with a significant reduction in the TSC2 signal (Figure 4A). In each case we had classified the variant as due to a significantly increased T389/S6K ratio compared to wild-type TSC1 (Table 1). Thirty-eight TSC2 variants were associated with a significant reduction in the TSC1 signal (Figures 5B and 6B). We divided these variants into 2 groups. One group of 31 variants clustered within the N-terminal half of TSC2 (amino acids ), while a small group of 7 variants clustered close to the C-terminus (amino acids ). In all 38 cases we had classified the variant as due to a significantly increased T389/S6K ratio compared to wildtype TSC1-TSC2 (Tables 2 and 3). 28
28 Prediction Analysis We investigated the possibility that the nucleotide changes corresponding to variants that did not affect TSC1-TSC2 function in our assay affected either TSC1 or TSC2 splicing. We analysed the TSC1 and TSC2 nucleotide changes using 3 different splice-site prediction programs and identified 8 variants (5 TSC1 and 3 TSC2) that were predicted to cause splicing abnormalities (Tables 1 and 2). In one case (TSC2 c.1235a>t), this was confirmed by functional assessment of the predicted TSC2 splice variant (TSC2 412del8; Figures 3 and 5, Table 2; [Jansen et al., 2008]). Next, we investigated whether the functional assessments of the TSC1 and TSC2 variants were in agreement with the Sorting Intolerant From Tolerant (SIFT) amino acid substitution prediction method [Ng and Henikoff, 2006]. The SIFT algorithm combines information from the chemical structure of the individual amino acids and the evolutionary conservation of a protein to predict whether specific substitutions can be tolerated by the protein. SIFT analysis of TSC1 indicated that the N-terminal (amino acids 1-300) and C- terminal (amino acids ) regions were relatively intolerant to amino acid changes [Mozaffari et al., 2009]. All the TSC1 variants classified as according to our functional assessment clustered within the substitution intolerant N-terminal region (Table 1). SIFT predicted that 18/41 (44%) of the TSC1 missense changes would not be tolerated. In 36 cases (88%), the SIFT prediction was consistent with the functional assessment. In 5 cases (R190C, R246K, R246T, H732Y and R1097H), SIFT predicted that the substitution would not be tolerated, while the functional assessment indicated that the amino acid changes were probably neutral. In the case of the R246K and R246T substitutions, splice site prediction analysis indicated that the corresponding nucleotide changes (c.737g>a and c.737g>c) were likely to cause splicing errors. Similarly, although the K121R, G305R and G305W 29
29 substitutions were tolerated by the SIFT analysis and were probably neutral according to the functional assessment, splice site prediction analysis indicated that the corresponding nucleotide changes were most likely splice site mutations. The TSC1 H732Y variant has been identified in individuals without TSC ( and is unlikely to cause TSC, consistent with the results of our functional assessment (Figures 2 and 4; Table 1). However, this variant is associated with focal cortical dysplasia type II [Lugnier et al. 2009]. Therefore, the SIFT result may still be accurate, even though the H732Y substitution is not critical for TSC1 function as determined in our assay. Due to reduced amino acid sequence conservation at the C-terminus of TSC1, the SIFT prediction for the TSC1 R1097H substitution was made with a low degree of confidence, and is therefore not reliable (data not shown). SIFT analysis of TSC2 indicated that amino acids and , corresponding to the TSC1-binding domain and the GAP domain respectively, were intolerant of amino acid substitutions (Supplemental Figure 1). In total, the SIFT prediction and functional assessment were consistent for 78 TSC2 variants (81%)(Tables 2 and 3). SIFT tolerated 42/96 (44%) of the TSC2 amino acid substitutions subjected to functional testing. Of these, 13 (31%) were classified as according to the functional assessment. Of the 54 substitutions not tolerated by SIFT, 5 were classified as neutral according to the functional assessment. In one case where the substitution was tolerated by SIFT (c.1118a>c, p.q373p) and 2 cases where the substitution was not tolerated (c.1235a>t, p.e412v and c.1255c>t, p.p419s), the functional assessment indicated that the amino acid substitution was probably neutral, while splice site analysis predicted that the corresponding nucleotide change would affect splicing. Overall, there was broad agreement between the SIFT predictions and our functional assessments for both the TSC1 and TSC2 variants. Nevertheless, there were sufficient 30
30 exceptions to indicate that the results of SIFT and similar prediction algorithms should be treated with caution. In summary, using a transfection-based immunoblot assay we classified 16/45 TSC1 variants (36%) and 69/107 TSC2 variants (64%) as. Of the 79 previously untested variants, we classified 42 (53%) as, including 5/19 TSC1 (26%) and 37/60 TSC2 variants (62%). We classified 24/45 TSC1(53%) and 35/107 TSC2 variants (33%) as probably neutral. In 8 cases (5 TSC1 and 3 TSC2), the variant was neutral according to the functional assessment, but splice site analysis predicted that the corresponding nucleotide change was likely to be a splice site mutation. Discussion Mutation analysis of individuals with, or suspected of having, a genetic disease facilitates the diagnosis, treatment and genetic counselling of those individuals and their families. However, in some cases it is not possible to determine from the genetic data whether an identified nucleotide change is disease-causing. Functional analysis of predicted protein variants provides an additional method for determining whether specific changes are. We have characterised the effects of 152 TSC1 and TSC2 amino acid substitutions and small in-frame insertions/deletions on the TSC1-TSC2 complex. Based on our functional assessment we classified 85 (56%) of the changes as. In 8 (5%) cases where we did not detect an effect on protein function, the corresponding nucleotide change was predicted to cause splicing defects. We tested 45 TSC1 variants, of which 42 were amino acid substitutions and 3 were inframe insertion/deletion changes. In 4 cases we analysed multiple changes at the same codon. 31
31 Sixteen variants were detected at significantly reduced levels compared to wild-type TSC1. In each case, TORC1 activity, as estimated from the ratio of T389 phosphorylated S6K to total S6K, was increased compared to the wild-type control and we classified these variants as. Consistent with previous studies [Nellist et al., 2009, Mozaffari et al., 2009], all the variants that were detected at low levels by immunoblotting mapped to the TSC1 N- terminal region (amino acids ) and had a distinct cytoplasmic localisation pattern compared to wild-type TSC1, confirming the importance of this region for TSC1 function, localisation and stability. We tested 104 TSC2 variants, of which 95 were amino acid substitutions, 3 were small in-frame insertions (1-3 amino acids) and 6 were in-frame deletions (1-26 amino acids). In 12 cases we analysed multiple changes at the same codon. Fifty-five changes affected the N- terminal half of the protein (amino acids 1-900), and 52 affected the C-terminal region (amino acids ). Twenty-one (38%) of the changes in the N-terminal region were unstable, and 31 (56%) were associated with significantly reduced levels of TSC1, consistent with an important role for the TSC2 N-terminal region in binding and stabilising TSC1 [Li et al. 2004]. Eighteen (35%) of the changes in the C-terminal region were unstable and 7 (13%) were associated with significantly reduced levels of TSC1. The 7 C-terminal variants associated with reduced levels of TSC1 mapped between amino acids 1525 and 1729, suggesting that this region may also play a role in maintaining stable TSC1-TSC2 complexes. We compared our functional assessment with the classifications listed in the TSC1 and TSC2 LOVD ( In general there was good agreement between the LOVD classifications and our functional assessment (Tables 1, 2 and 3). However, we identified one TSC1 variant (F216S) and 4 TSC2 variants (K599M, F615S, R951S and L1771I) for which there was strong disagreement. The TSC1 F216S variant is classified as probably not in the LOVD because it was identified in an 32
32 apparently unaffected parent, but is a change according to our functional assessment. The TSC2 K599M substitution is classified as in the LOVD because it was identified as a de novo change in a TSC patient [Niida et al. 1999] and because it reduced the TSC2-dependent inhibition of 4E-BP1 phosphorylation in vitro [Tee et al. 2002]. However, consistent with our previous studies [Nellist et al. 2001; Nellist et al. 2005], in our assay, the K599M substitution did not affect TSC1-TSC2 binding or stability, and inhibited S6K T389 phosphorylation as effectively as wild-type TSC2. The TSC2 F615S substitution is classified as having no known ity in the LOVD, but is a change according to our functional assessment, consistent with our previous studies [Nellist et al. 2001; Nellist et al. 2005]. The TSC2 R951S substitution is classified as probably in the LOVD, but according to our functional assessment is probably neutral. Codon 951 is encoded by the alternatively spliced exon 25 of the TSC2 gene [Xu et al. 1995]. Very few changes have been identified in this exon ( Furthermore, complete removal of this exon did not affect TSC2 function in our assay (M. Wentink, M. Nellist, unpublished observations). Finally, the LOVD lists the TSC2 L1773I variant as probably, but is probably neutral according to our functional assessment. The L1773I substitution is a conservative change in the last exon of TSC2. Deletion of the amino acids encoded by this exon did not affect TSC2 function in our assay (M. Wentink, M. Nellist, unpublished observations). We classified 31 TSC2 and 29 TSC1 variants as probably neutral. In some cases, these variants are very likely to be rare, neutral variants that do not cause TSC. However, all the variants were identified in individuals with, or suspected of having, TSC and must therefore be considered to be potentially. We could not exclude the possibility that some variants had sufficient activity in our over-expression system to inhibit TORC1, while in vivo 33
33 they may be inactive or unstable. Therefore, it would be useful to have additional, more sensitive assays to characterise these variants in more detail. We classified 152 different TSC1 and TSC2 variants using a transfection-based immunoblot assay. We distinguished TSC1 and TSC2 variants from probable neutral variants according to whether there was evidence for increased S6K-T389 phosphorylation. Based on the functional assessment, 85 variants were classified as. In addition, we identified 8 putative splice site mutations. Further work is required to exclude the possibility that the 67 variants classified as probably neutral affect TSC1-TSC2 function in vivo and are in fact. Acknowledgments Financial support was provided by the U.S. Department of Defense Congressionally- Directed Medical Research Program (grant #TS060052), the Michelle Foundation and the Tuberous Sclerosis Alliance. The authors report no conflicts of interest. 34
34 References Adachi H, Igawa M, Shiina H, Urakami S, Shigeno K, Hino O Human bladder tumors with 2-hit mutations of tumor suppressor gene TSC1 and decreased expression of p27. J. Urol. 170: Au K-S, Williams AT, Roach ES, Batchelor L, Sparagana SP, Delgado MR, Wheless JW, Baumgartner JE, Roa BB, Wilson CM, Smith-Knuppel TK, Cheung MY, Whittemore VH, King TM, Northrup H Genotype/phenotype correlation in 325 individuals referred for a diagnosis of tuberous sclerosis complex in the United States. Genet Med 9: Benit P, Kara-Mostefa A, Hadj-Rabia S, Munnich A, Bonnefont JP Protein truncation test for screening hamartin gene mutations and report of new disease-causing mutations. Hum Mutat 14: Choi JE, Chae JH, Hwang YS, Kim KJ Mutational analysis of TSC1 and TSC2 in Korean patients with tuberous sclerosis complex. Brain Dev 28: Coevoets R, Arican S, Hoogeveen-Westerveld M, Simons E, van den Ouweland A, Halley D, Nellist M 2009 A reliable cell-based assay for testing unclassified TSC2 gene variants. Eur J Hum Genet 17: Dabora SL, Jozwiak S, Franz DN, Roberts PS, Nieto A, Chung J, Choy YS, Reeve MP, Thiele E, Egelhoff JC, Kasprzyk-Obara J, Domanska-Pakiela D, Kwiatkowski DJ
35 Mutational analysis in a cohort of 224 tuberous sclerosis patients indicates increased severity of TSC2, compared with TSC1, disease in multiple organs. Am J Hum Genet 68: Daumke O, Weyand M, Chakrabarti PP, Vetter IR, Wittinghofer A The GTPaseactivating protein Rap1GAP uses a catalytic asparagine. Nature 429: European Chromosome 16 Tuberous Sclerosis Consortium Identification and characterization of the tuberous sclerosis gene on chromosome 16. Cell 75: Gomez MG, Sampson JR, Holets-Whittemore V, eds The tuberous sclerosis complex. 3rd edn. Developmental Perspectives in Psychiatry, Oxford University Press, New York and Oxford. Hermans MM, van Leenen D, Kroos MA, Beesley CE, van der Ploeg AT, Sakuraba H, Wevers R, Kleijer W, Michelakakis H, Kirk EP, Fletcher J, Bosshard N, Basel-Vanagaite L, Besley G, Reuser AJ Twenty-two novel mutations in the lysosomal alpha-glucosidase gene (GAA) underscore the genotype-phenotype correlation in glycogen storage disease type II. Hum Mutat 23: Hodges AK, Li S, Maynard J, Parry L, Braverman R, Cheadle JP, DeClue JE, Sampson JR Pathological mutations in TSC1 and TSC2 disrupt the interaction between hamartin and tuberin. Hum Mol Genet 10: Huang J, Dibble CC, Matsuzaki M, Manning BD The TSC1-TSC2 complex is required for proper activation of mtor complex 2. Mol Cell Biol 28:
36 Hung CC, Su YN, Chien SC, Liou HH, Chen CC, Chen PC, Hsieh CJ, Chen CP, Lee WT, Lin WL, Lee CN Molecular and clinical analyses of 84 patients with tuberous sclerosis complex. BMC Med Genet 7:72. Inoki K, Li Y, Zhu T, Wu J, Guan K-L TSC2 is phosphorylated and inhibited by Aky and suppresses mtor signalling. Nat Cell Biol 4: Inoki K, Guan K-L Tuberous sclerosis complex, implication from a rare genetic disease to common cancer treatment. Hum Mol Genet 18:R94-R100. Jansen AC, Sancak O, D'Agostino MD, Badhwar A, Roberts P, Gobbi G, Wilkinson R, Melanson D, Tampieri D, Koenekoop R, Gans M, Maat-Kievit A, Goedbloed M, van den Ouweland AMW, Nellist M, Pandolfo M, McQueen M, Sims K, Thiele EA, Dubeau F, Andermann F, Kwiatkowski DJ, Halley DJJ, Andermann E Unusually mild tuberous sclerosis phenotype is associated with TSC2 R905Q mutation. Ann Neurol. 60: Jansen FE, Braams O, Vincken KL, Algra A, Anbeek P, Jennekens-Schinkel A, Halley D, Zonnenberg BA, van den Ouweland A, van Huffelen AC, van Nieuwenhuizen O, Nellist M Overlapping neurologic and cognitive phenotypes in patients with TSC1 or TSC2 mutations. Neurology 70: Jones AC, Shyamsundar MM, Thomas MW, Maynard J, Idziaszczyk S, Tomkins S, Sampson JR, Cheadle JP Comprehensive mutation analysis of TSC1 and TSC2, and phenotypic correlations in 150 families with tuberous sclerosis. Am J Hum Genet 64:
37 Khare L, Strizheva GD, Bailey JN, Au K-S, Northrup H, Smith M, Smalley SL, Henske EP A novel missense mutation in the GTPase activating protein homology region of TSC2 in two large families with tuberous sclerosis complex. J Med Genet 38: Kwiatkowski DJ, Zhang H, Bandura JL, Heiberger KM, Glogauer M, el-hashemite N, Onda H A mouse model of TSC1 reveals sex-dependent lethality from liver hemangiomas, and up-regulation of p70s6 kinase activity in Tsc1 null cells. Hum Mol Genet 11: Li Y, Corradetti MN, Inoki K, Guan J-L TSC2: filling the GAP in the mtor signaling pathway. Trends Biochem Sci 28: Li Y, Inoki K, Guan K-L Biochemical and functional characterization of small GTPase Rheb and TSC2 GAP activity. Mol Cell Biol 24: Lugnier C, Majores M, Fassunke J, Pernhorst K, Niehusmann P, Simon M, Nellist M, Schoch S, Becker A Hamartin variants that are frequent in focal dysplasias and cortical tubers have reduced tuberin binding and aberrant subcellular distribution in vitro. J Neuropathol Exp Neurol 68: Mayer K, Goedbloed M, van Zijl K, Nellist M, Rott HD Characterisation of a novel TSC2 missense mutation in the GAP related domain associated with minimal clinical manifestations of tuberous sclerosis. J Med Genet 41:64. 38
38 Mozaffari M, Hoogeveen-Westerveld M, Kwiatkowski D, Sampson J, Ekong R, Povey S, den Dunnen JT, van den Ouweland A, Halley D, Nellist M Identification of a region required for TSC1 stability by functional analysis of TSC1 missense mutations found in individuals with tuberous sclerosis complex. BMC Med Genet 10:88. Nellist M, van Slegtenhorst MA, Goedbloed M, van den Ouweland AMW, Halley DJJ, van der Sluijs P Characterization of the cytosolic tuberin-hamartin complex: tuberin is a cytosolic chaperone for hamartin. J Biol Chem 274: Nellist M, Verhaaf B, Goedbloed MA, Reuser AJJ, van den Ouweland AMW, Halley DJJ TSC2 missense mutations inhibit tuberin phosphorylation and prevent formation of the tuberin-hamartin complex. Hum Molec Genet 10: Nellist M, Sancak O, Goedbloed MA, Rohe C, van Netten D, Mayer K, Tucker-Williams A., van den Ouweland AMW, Halley DJJ Distinct effects of single amino acid changes to tuberin on the function of the tuberin-hamartin complex. Eur J Hum Genet 13: Nellist M, Sancak O, Goedbloed M, Adriaans A, Wessels M, Maat-Kievit A, Baars M, Dommering C, van den Ouweland A, Halley D Functional characterisation of the TSC1-TSC2 complex to assess multiple TSC2 variants identified in single families affected by tuberous sclerosis complex. BMC Med Genet 9:10. Nellist M, van den Heuvel D, Schluep D, Exalto C, Goedbloed M, Maat-Kievit A, van Essen T, van Spaendonck-Zwarts K, Jansen F, Helderman P, Bartalini G, Vierimaa O, Penttinen M, 39
39 van den Ende J, van den Ouweland A, Halley D Missense mutations to the TSC1 gene cause tuberous sclerosis complex. Eur J Hum Genet 17: Ng PC, Henikoff S Predicting the effects of amino acid substitutions on protein function. Ann Rev Genomics Hum Genet 7: Niida Y, Lawrence-Smith N, Banwell A, Hammer E, Lewis J, Beauchamp RL, Sims K, Ramesh V, Ozelius L Analysis of both TSC1 and TSC2 for germline mutations in 126 unrelated patients with tuberous sclerosis. Hum Mutat 14: O'Connor SE, Kwiatkowski DJ, Roberts PS, Wollmann RL, Huttenlocher PR A family with seizures and minor features of tuberous sclerosis and a novel TSC2 mutation. Neurology 61: Qin W, Kozlowski P, Taillon BE, Bouffard P, Holmes AJ, Janne P, Camposano S, Thiele E, Franz D, Kwiatkowski DJ Ultra deep sequencing detects a low rate of mosaic mutations in Tuberous Sclerosis Complex. Hum Genet 127: Ramantani G, Niggemann P, Hahn G, Nake A, Fahsold R, Lee-Kirsch MA Unusual radiological presentation of tuberous sclerosis complex with leptomeningeal angiomatosis associated with a hypomorphic mutation in the TSC2 gene. J Child Neurol 24: Rendtorff ND, Bjerregaard B, Frodin M, Kjaergaard S, Hove H, Skovby F, Brondum-Nielsen K, Schwartz M Analysis of 65 tuberous sclerosis complex (TSC) patients by TSC2 40
40 DGGE, TSC1/TSC2 MLPA, and TSC1 long-range PCR sequencing, and report of 28 novel mutations. Hum Mutat 26: Sancak O, Nellist M, Goedbloed M, Elfferich P, Wouters C, Maat-Kievit A, Zonnenberg B, Verhoef S, Halley D, van den Ouweland A Mutational analysis of the TSC1 and TSC2 genes in a diagnostic setting: genotype-phenotype correlations and comparison of diagnostic DNA techniques in tuberous sclerosis complex. Eur J Hum Genet 13: van Slegtenhorst M, de Hoogt R, Hermans C, Nellist M, Janssen B, Verhoef S, Lindhout D, van den Ouweland A, Halley D, Young J, Burley M, Jeremiah S, Woodward K, Nahmias J, Fox M, Ekong R, Wolfe J, Povey S, Osborne J, Snell RG, Cheadle JP, Jones AC, Tachataki M, Ravine D, Sampson JR, Reeve MP, Richardson P, Wilmer F, Munro C, Hawkins TL, Sepp T, Ali JBM, Ward S, Green AJ, Yates JRW, Short MP, Haines JH, Jozwiak S, Kwiatkowska J, Henske EP, Kwiatkowski DJ Identification of the tuberous sclerosis gene TSC1 on chromosome 9q34. Science 277: van Slegtenhorst M, Nellist M, Nagelkerken B, Cheadle J, Snell R, van den Ouweland A, Reuser A, Sampson J, Halley D, van der Sluijs P Interaction between hamartin and tuberin, the TSC1 and TSC2 gene products. Hum Mol Genet 7: Tee AR, Fingar DC, Manning BD, Kwiatkowski DJ, Cantley LC, Blenis J Tuberous sclerosis complex-1 and -2 gene products function together to inhibit mammalian target of rapamycin (mtor)-mediated downstream signaling. Proc Natl Acad Sci USA 99:
41 de Vries P, Howe CJ The tuberous sclerosis complex proteins - a GRIPP on cognition and neurodevelopment. Trends Mol Med 13: Xu L, Sterner C, Maheshwar MM, Wilson PJ, Nellist M, Short PM, Haines JL, Sampson JR, Ramesh V Alternative splicing of the tuberous sclerosis 2 (TSC2) gene in human and mouse tissues. Genomics 27: Zhang H, Cicchetti G, Onda H, Koon HB, Asrican K, Bajraszewski N, Vazquez F, Carpenter CL, Kwiatkowski DJ Loss of Tsc1/Tsc2 activates mtor and disrupts PI3K-Akt signaling through downregulation of PDGFR. J Clin Invest 112: Zhang H, Nanba E, Yamamoto T, Ninomiya H, Ohno K, Mizuguchi M, Takeshita K Mutational analysis of TSC1 and TSC2 genes in Japanese patients with tuberous sclerosis complex. J Hum Genet 44:
42 Titles and legends to figures Figure 1: Overview of the TSC1 and TSC2 variants analysed as part of this study. Variants are numbered as originally described [van Slegtenhorst et al., 1997; European Chromosome 16 Tuberous Sclerosis Consortium, 1993] and according to the amino acid sequences encoded by the expression constructs used in this study. (A) TSC1 variants. The positions of the TSC1 variants analysed as part of this study are indicated relative to the coding exons (3-23) of the TSC1 gene. (B) Variants mapping to the N-terminal half of TSC2 (amino acids 1-900). The positions of the variants are indicated relative to exons 1-23 of the TSC2 gene. (C) Variants mapping to the C-terminal half of TSC2 (amino acids ). The positions of the variants are indicated relative to exons of the TSC2 gene. The alternatively spliced exons 25 and 31 are shown in grey and the position of the GAP domain, corresponding to exon 37, is shown in black. The amino acids encoded by exon 31 were not present in the TSC2 expression constructs used in this study. Figure 2: Immunoblot analysis of TSC1 variants. Cells were transfected with expression constructs encoding TSC2, S6K and wild-type TSC1 (TSC1/TSC2/S6K), TSC2, S6K and the L117P variant (L117P), TSC2, S6K and the TSC1 variants, TSC2 and S6K only (TSC2/S6K), TSC1 and S6K only (TSC1/S6K) or with an empty vector (control) and analysed by immunoblotting. (A) Immunoblot showing signals for wild-type TSC2 (TSC2), wild-type TSC1 and the TSC1 variants (TSC1), total S6K (S6K) and T389-phosphorylated S6K (T389). 43
43 (B) Quantification of the TSC2 signals shown in (A), relative to the wild-type control (TSC1/TSC2/S6K). (C) Quantification of the TSC1 signals shown in (A), relative to the wild-type control (TSC1/TSC2/S6K). (D) Quantification of the total S6K signals shown in (A), relative to the wild-type control (TSC1/TSC2/S6K). (E) Ratio of T389-phosphorylated S6K to total S6K in the presence of the TSC1 variants. The ratio of the signal for T389 phosphorylated S6K (T389) to the total S6K protein (S6K) was determined relative to the wild-type control (TSC1/TSC2/S6K; T389/S6K ratio = 1) for each variant shown in (A). Figure 3: Immunoblot analysis of TSC2 variants. Cells were transfected with expression constructs encoding TSC1, S6K and wild-type TSC2 (TSC2), TSC1, S6K and the R611Q variant (R611Q), TSC1, S6K and the TSC2 variants, or with an empty vector (control), and analysed by immunoblotting. (A) Immunoblot showing signals for wild-type TSC2 and the TSC2 variants (TSC2), wildtype TSC1 (TSC1), total S6K (S6K) and T389-phosphorylated S6K (T389). (B) Quantification of the TSC2 signals shown in (A), relative to the wild-type control (TSC2). (C) Quantification of the TSC1 signals shown in (A), relative to the wild-type control (TSC2). (D) Quantification of the total S6K signals shown in (A), relative to the wild-type control (TSC2). (E) Ratio of T389-phosphorylated S6K to total S6K in the presence of the TSC2 variants. The ratio of the signal for T389 phosphorylated S6K (T389) to the total S6K protein (S6K) was determined relative to the wild-type control (TSC2; T389/S6K ratio = 1) for each variant shown in (A). 44
44 Figure 4.: Functional assessment of the TSC1 variants. The signals for TSC2, TSC1, total S6K (S6K) and T389-phosphorylated S6K (T389) were determined per variant, relative to the wild-type control (TSC1) in at least 4 independent transfection experiments. The mean signals are shown for each variant. Error bars represent the standard error of the mean; variants that were significantly different from the wild-type control (TSC1) are indicated with an asterisk. The signals from cells expressing exogenous TSC2 and S6K only, and no exogenous TSC1, are also shown (TSC2). (A) Mean TSC2 signals in the presence of the TSC1 variants, relative to wild-type TSC1- TSC2 (TSC1; signal = 1). (B) Mean signals for the TSC1 variants, relative to wild-type TSC1 (TSC1; signal =1). (C) Mean T389/S6K ratios for the TSC1 variants, relative to wild-type TSC1-TSC2 (TSC1; ratio = 1). (D) Mean total S6K signals in the presence of the TSC1 variants, relative to wild-type TSC1- TSC2 (TSC1; signal = 1). Figure 5.: Functional assessment of the TSC2 variants mapping to the N-terminal half of TSC2 (amino acids 1-900). The signals for TSC2, TSC1, total S6K (S6K) and T389- phosphorylated S6K (T389) were determined per variant, relative to the wild-type control (TSC2) in at least 4 independent transfection experiments. The mean signals are shown for each variant. Error bars represent the standard error of the mean; variants that were significantly different from the wild-type control (TSC2) are indicated with an asterisk. (A) Mean signals for the TSC2 variants, relative to wild-type TSC2 (TSC2; signal =1). (B) Mean TSC1 signals in the presence of the TSC2 variants, relative to wild-type TSC1- TSC2 (TSC2; signal = 1). 45
45 (C) Mean T389/S6K ratios for the TSC2 variants, relative to wild-type TSC1-TSC2 (TSC2; ratio = 1). (D) Mean total S6K signals in the presence of the TSC2 variants, relative to wild-type TSC1- TSC2 (TSC2; signal = 1). Figure 6.: Functional assessment of the TSC2 variants mapping to the C-terminal half of TSC2 (amino acids ). The signals for TSC2, TSC1, total S6K (S6K) and T389- phosphorylated S6K (T389) were determined per variant, relative to the wild-type control (TSC2) in at least 4 independent transfection experiments. The mean signals are shown for each variant. Error bars represent the standard error of the mean; variants that were significantly different from the wild-type control (TSC2) are indicated with an asterisk. (A) Mean signals for the TSC2 variants, relative to wild-type TSC2 (TSC2; signal =1). (B) Mean TSC1 signals in the presence of the TSC2 variants, relative to wild-type TSC1- TSC2 (TSC2; signal = 1). (C) Mean T389/S6K ratios for the TSC2 variants, relative to wild-type TSC1-TSC2 (TSC2; ratio = 1). (D) Mean total S6K signals in the presence of the TSC2 variants, relative to wild-type TSC1- TSC2 (TSC2; signal = 1). 46
46 Figure 1 A E478G U781nsGS R1097H L111P B N275K 275deiN A357V AA60T N c 47
47 Figure 2 A 8 relative TSC2 s1gnal c relative TSC1 signal _,. TSC2 TSC ~ T D relative S6K signal E rolativo T389/S6K ratio 48
48 Figure 3 A B rt latlvt TSC2 signal 1.S TSC TSCt ~ - T c 1.2 o.a rt1 1fvt TSC t signal = lve Sfl( Ill ) '\~~.._ 0.5 ~~~~~####ff#;~~~~$~~.. <:>,..... '~~ ~.,-. ~., ~., ~"i <P-"' <t> ~ #'~ ~., -<;._<f'...,, ~~... ~ v"'.,, TSC2 varlant E rtladvt nttis6t< ratio 1 49

49 Figure 4 A rtlotlve TSC2 algnal * * * 0.4 B ~~-~~~'t~~#l'--~.. ~{~~~~c$.~~~:~~~~/#/h~~$'~y/~~/~"'~~1~<f>-tl' ~# relative TSC1 signal 2.5 TSC1 variant * * * * *** ** * 1: i I ~ ~ I * :II iii 50
50 c relative T389/S6K ratio * * * * * * * * * * * ** D 1.8 relative S6K signal 1.4 I T [[ r r l T T T ~ r r l L T T r r l f T T T T T T T T r T r T r r 0.6 T

51 Figure 5 A felatlve TSC2 signal * * * * * * * * * * * * * * * * * ~~~~~.,t~~1-~~~~y/-i~#~~~~~wa~~~~~~.,$.~$~~~t~~~ya~~ " TSC2variant B relative TSC1 signal * * * * * * * * * * * * * * * * * * * * * * * * ** * * * * * _l 1 ~~~~~.,t~~~~~~~~~~~~~~~'~"'~»~~»~.,$.~$~-!q+~t6~~~!t$c, ~ 1 TSC2 variant 52

52 C relative T389/S6K ratio * ** * * * * * * * * * * * * * ** * * ** * ** ** * * * * * * I I I I I I i I D TSC2 variant relative S6K signal ~~.r~{fl~t~~$~#~~~~~~~~.:-~y/~-f!~.jf"$>~$~~~~~~~/q$?~~»~~~ ~ TSC2 variant 53

53 Figure 6 A 2.5 "'"''.,. TSC2 signal * * * * * * * * * * B 1.1 "'"'tlvo TSCI signal TSC2 variant 0.6 * * 0.2 TSC2variant 54

54 c relative T389/S6K ratio 6.5 * 5.5 * * * ** * * * ** * * ** * * * * * * 4.5 * * * * * * * * * * * 3.5 * * * 2.5 * I j I I I TSC2 variant D relative S6K signal TSC2 variant 55
55 Table 1. TSC1 variants. TSC1 nucleotide changes and exon numbers are given according to the TSC1 Leiden Open Variation Database ( Nucleotide changes predicted to cause splicing defects are marked with an asterisk. Amino acid changes are numbered according to van Slegtenhorst et al., Amino acid substitutions predicted by SIFT to be tolerated (T) or not tolerated (NT) are indicated. Previously untested variants are indicated in bold. Exon Variant SIFT LOVD Reference/ Functional prediction classification source assessment 4 c.149t>c (p.l50p) NT unknown Mozaffari et al., 2009 unstable, 4 c.153a>c T probably no Mozaffari et al., probably neutral (p.e51d) ity c.182t>c NT probably Mozaffari et al., unstable, (p.l61p) c.215t>c NT probably Benit et al., 1999 unstable, (p.l72p) 5 c.227t>a (p.i76n) NT unknown Au et al., 2007 unstable, 5 c.245a>c (p.k82t) T unknown Adachi et al., 2003 probably neutral 5 c.250g>a T probably no LOVD probably neutral (p.a84t) ity 5 c.278t>g NT probably Mozaffari et al., unstable, (p.l93r) 2009 destabilising, 56
56 5 c.346t>g T unknown this study probably neutral (p.l116v) 5 c.350t>c NT probably Nellist et al., 2009 unstable, (p.l117p) 5 c.362a>g* (p.k121r) T unknown LOVD probably neutral (predicted splice mutation) 6 c.381_383deltgt* (p.128delv) - unknown Nellist et al., 2009 unstable, 6 c.397g>t (p.v133f) NT unknown Mozaffari et al., 2009 unstable, 7 c.539t>c NT probably Nellist et al., 2009 unstable, (p.l180p) 7 c.568c>t NT no known Mozaffari et al., probably neutral (p.r190c) ity c.569g>c (p.r190p) NT unknown Mozaffari et al., 2009 unstable, 7 c.572t>a NT probably Nellist et al., 2009 unstable, (p.l191h) 7 c.572t>g (p.l191r) NT unknown LOVD unstable, 7 c.593_595delact - probably Hodges et al., unstable, (p.n198f199delinsi) 2001; Mozaffari destabilising, et al.,
57 7 c.602_604delcct (p.s201del) - unknown Hung et al., 2006 unstable, 7 c.647t>c NT probably no LOVD unstable, (p.f216s) ity 8 c.671t>g NT probably Nellist et al., 2009 unstable, (p.m224r) destabilising, 8 c.737g>a* NT probably Nellist et al., 2009 probably neutral (p.r246k) (predicted splice mutation) 8 c.737g>c* NT probably LOVD probably neutral (p.r246t) (predicted splice mutation) 9 c.853t>g T unknown this study probably neutral (p.f285v) 9 c.913g>a* T probably Nellist et al., 2009 probably neutral (p.g305r) (predicted splice mutation) 9 c.913g>t* T probably Nellist et al., 2009 probably neutral p.g305w (predicted splice mutation) 10 c.1001c>t T probably no Mozaffari et al., probably neutral p.s334l ity c.1250c>t T no known Choi et al., 2006 probably neutral 58
58 (p.t417i) 14 c.1433a>g* (p.e478g) 14 c.1433a>g* (p.e478ginsgn) ity T unknown Mozaffari et al., unknown Mozaffari et al., 2009 probably neutral probably neutral 15 c.1460c>g T unknown this study probably neutral (p.s487c) 15 c.1526g>a T probably no Nellist et al., 2009 probably neutral (p.r509q) ity 15 c.1648c>g (p.q550e) T unknown Mozaffari et al., 2009 probably neutral 15 c.1760a>g T no known LOVD probably neutral (p.k587r) ity 15 c.1849c>g T unknown this study probably neutral (p.h617d) 15 c.1974c>g T probably no Mozaffari et al., probably neutral (p.d658e) ity c.1976c>t T probably no Mozaffari et al., probably neutral (p.a659v) ity c.2194c>t NT no known Lugnier et al., probably neutral (p.h732y) ity c.2420t>c (p.i807t) T unknown Mozaffari et al., 2009 probably neutral 21 c.2653c>t T unknown Au et al., 2007 probably neutral (p.r885w) 59
59 21 c.2696c>g (p.t899s) T unknown Zhang et al., 1999 probably neutral 23 c.3103g>a T no known Nellist et al., 2009 probably neutral (p.g1035s) ity 23 c.3184c>t T unknown Qin et al., 2010 probably neutral (p.r1062w) 23 c.3290g>a NT probably no Nellist et al., 2009 probably neutral (p.r1097h) ity Table 2. TSC2 variants (amino acids 1-900). TSC2 nucleotide changes and exon numbers are given according to the TSC2 Leiden Open Variation Database ( Nucleotide changes predicted to cause splicing defects are marked with an asterisk. Amino acid changes were numbered according to European Chromosome 16 Tuberous Sclerosis Consortium, Amino acid substitutions predicted by SIFT to be tolerated (T) or not tolerated (NT) are indicated. Previously untested variants are indicated in bold. Exon Variant SIFT Reference Pathogenicity (LOVD Functional prediction database) assessment 2 c.170g>a (p.r57h) NT this study unknown unstable, 2 c.185g>a T Coevoets et unknown probably neutral (p.g62e) al., c.292c>t NT Coevoets et unknown destabilising, 60
60 (p.r98w) al., c.307_315dup (p.105insall) - LOVD unknown destabilising, 4 c.395c>g T Nellist et probably no probably neutral (p.s132c) al., 2008 ity 4 c.447c>g T Nellist et probably no probably neutral (p.f143l) al., 2008 ity 5 c.586g>a T Nellist et probably no probably neutral (p.a196t) al., 2008 ity 6 c.646g>a T this study unknown probably neutral (p.e216k) 7 c.656t>c (p.l219p) NT this study unknown destabilising, 7 c.730t>c NT Nellist et probably unstable, (p.c244r) al., 2008 destabilising, 8 c.782g>c (p.r261p) T LOVD probably destabilising, 8 c.781c>t NT Hodges et probably no probably neutral (p.r261w) al., 2001 ity 8 c.825c>g T this study unknown probably neutral (p.n275k) 8 c.824_826del - Coevoets et unknown destabilising, (p.275deln) al., c.1001t>c NT this study unknown unstable, 61
61 (p.v334a) destabilising, 10 c.1001t>g (p.v334g) NT LOVD probably unstable, destabilising, 10 c.1019t>c NT this study unknown (p.l340p) 10 c.1070c>t T this study unknown probably neutral (p.a357v) 10 c.1100g>a T Nellist et no known ity probably neutral (p.r367q) al., c.1118a>c* T Coevoets et unknown probably neutral (p.q373p) al., 2009 (predicted splice mutation) 11 c.1235a>t* NT Jansen et unknown probably neutral (p.e412v) al., 2008 (splice mutation) 11 c.1235a>t* - Jansen et unknown unstable, (p.412del8) al., 2008 destabilising, 11 c.1255c>t* NT Huang et probably probably neutral (p.p419s) al., 2008 (predicted splice mutation) 13 c.1366a>g T this study unknown probably neutral (p.e456k) 13 c.1378g>a T Ramantani unknown probably neutral 62
62 (p.a460t) et al., c.1385g>a (p.r462h) NT this study unknown unstable, destabilising, 13 c.1385_1386del insct (p.r462p) 13 c.1397t>c (p.l466p) NT this study unknown unstable, destabilising, T LOVD unknown unstable, destabilising, 14 c.1574a>g T Nellist et no known ity probably neutral (p.n525s) al., c.1678g>a T this study unknown probably neutralc (p.v560m) 16 c.1736del78 - Coevoets et unknown unstable, (p.580del26) al., 2009 destabilising, 16 c.1790inscac - Jansen et unknown destabilising, (p.597insh) al., c.1792t>c T Nellist et probably destabilising, (p.y598h) al., c.1796a>t T Tee et al., probably neutral (p.k599m) 2002; Nellist et al.,
63 16 c.1820c>a T Coevoets et unknown unstable, (p.a607e) al., 2009 destabilising, 16 c.1819g>t T this study unknown probably neutral (p.a607s) 16 c.1819g>a (p.a607t) T LOVD probably no ity probably neutral 16 c.1826_1828du - Nellist et destabilising, p al., 2005 (p.609inss) 16 c.1832g>a NT Nellist et unstable, (p.r611q) al., 2005 destabilising, 16 c.1831c>t NT Nellist et destabilising, (p.r611w) al., c.1841c>a* T Nellist et probably unstable, (p.a614d) al., 2005 destabilising, 17 c.1844t>c T Nellist et no known ity destabilising, (p.f615s) al., c.1864c>t (p.r622w) NT this study unknown unstable, destabilising, 17 c.1882c>g* T Au et al., unknown destabilising, (p.r628g)
64 18 c.1973a>c T this study unknown probably neutral (p.k658t) 18 c.1972_1974del (p.658delk) - this study no known ity probably neutral 18 c.2078t>c (p.l693p) NT this study unknown unstable, destabilising, 18 c.2087g>a NT Nellist et unknown unstable, (p.c696y) al., 2005 destabilising, 20 c.2306t>a T Nellist et probably unstable, (p.v769e) al., 2005 destabilising, 21 c.2363t>g (p.m788r) NT LOVD probably unstable, destabilising, 21 c.2410t>c (p.c804r) NT LOVD probably destabilising, 21 c.2458_2460del - Nellist et unstable, (p.820deli) al., 2008 destabilising, 21 c.2476c>a NT Nellist et no known ity probably neutral (p.l826m) al., c.2666c>t (p.a889v) NT LOVD probably unstable, destabilising, 65
65 23 c.2690t>c NT Rendtorff probably unstable, (p.f897s) et al., 2005 destabilising, Table 3. TSC2 variants (amino acids ). TSC2 nucleotide changes and exon numbers are given according to the TSC2 Leiden Open Variation Database ( Nucleotide changes predicted to cause splicing defects are marked with an asterisk. Amino acid changes were numbered according to the sequence of the wild-type TSC2 expression construct [European Chromosome 16 Tuberous Sclerosis Consortium, 1993]. Amino acid changes according to the TSC2 Leiden Open Variation Database are also given, where this differs from the original sequence due to the inclusion of 23 amino acids encoded by the alternatively spliced exon 31. Amino acid substitutions predicted by SIFT to be tolerated (T) or not tolerated (NT) are indicated. Previously untested variants are indicated in bold. Exon Variant SIFT Reference Pathogenicity Functional prediction (LOVD assessment database) 23 c.2713c>g NT Jansen et al. probably (p.r905g) c.2714g>a NT Jansen et al. (p.r905q)
66 23 c.2713c>t NT Jansen et al. (p.r905w) c.2765t>g NT Jansen et probably unstable, (p.l916r) al., c.2853a>t (p.r951s) T this study probably probably neutral 25 c.2963g>c T this study unknown probably neutral (p.r988p) 26 c.2978c>t T Nellist et probably no probably neutral (p.t993m) al., 2008 ity 26 c.3082g>a (p.d1028n) NT this study unknown unstable, 26 c.3095g>c (p.r1032p) NT this study probably 26 c.3106t>c NT O'Connor probably (p.s1036p) et al., c.3182t>c (p.l1061p) NT this study unknown unstable, 27 c.3203c>a NT Coevoets et unknown (p.t1068i) al., c.3224c>t NT Coevoets et unknown probably neutral (p.t1075i) al., c.3382c>t T this study unknown probably neutral (p.r1122c) 29 c.3476g>t T LOVD unknown unstable, 67
67 (p.r1159l) 29 c.3476g>a (p.r1159q) T LOVD no known ity probably neutral unstable, probably neutral 29 c.3475c>t T LOVD unknown probably neutral (p.r1159w) 29 c.3596t>g T Coevoets et unknown unstable, (p.v1199g) al., c.3598c>t (p.r1200w) 29 c.3605c>a NT LOVD unstable, T this study unknown (p.p1202h) 30 c.3611g>a* (p.g1204e) NT LOVD probably 32 c.3943c>g T Coevoets et unknown probably neutral (p.p1315a/ al., 2009 P1292A) 33 c.4105c>t (p.r1369w/ R1346W) 33 c.4225c>t (p.r1409w/ R1386W) T LOVD probably no ity T LOVD no known ity probably neutral probably neutral 33 c.4298c>t T Coevoets et unknown probably neutral (p.s1433l/ S1410L) al., c.4316g>a T Coevoets et unknown probably neutral 68
68 (p.g1439d/g1416d) al., c.4490c>g NT LOVD (p.p1497r/p1474r) 33 c.4489c>t T this study unknown (p.p1497s/p1474s) 33 c.4489c>a (p.p1497t/p1474t) 34 c.4499t>g (p.v1500g/v1477g) 34 c.4525_4527del (p.1510delf/ 1487delF) NT LOVD probably T LOVD probably - LOVD no known ity probably neutral 35 c.4601t>a NT Nellist et probably unstable, p.l1534h/l1511h) al., c.4604a>c NT Coevoets et unknown (p.d1535a/d1512a) al., c.4643t>c (p.l1548p/l1525p) NT this study unknown unstable, destabilising, 36 c.4700g>t NT Coevoets et unknown destabilising, (p.g1567v al., 2009 /G1544V) 36 c.4726_4783del - Coevoets et unknown unstable, (p.1575del19/ al., del19) 69
69 36 c.4733t>c (p.l1578p/l1555p) NT LOVD probably unstable, destabilising, 36 c.4735g>a NT Nellist et probably (p.g1579s/g1556s) al., c.4918c>t NT Coevoets et unknown (p.h1640y/h1617y) al., c.4925g>a NT this study unknown (p.g1642d/g1619d) 37 c.4927a>c NT this study unknown (p.n1643h/n1620h) 37 c.4928a>t (p.n1643i/n1620i) 37 c.4929c>g (p.n1643k/n1620k) NT LOVD probably NT LOVD probably unstable, 37 c.4928a>g NT this study unknown (p.n1643s/n1620s) 37 c.4937t>g NT Coevoets et unknown unstable, (p.v1646g/v1623g) al., 2009 destabilising, 38 c.5057a>c (p.q1686p/q1663p) T this study unknown unstable, destabilising, 39 c.5138g>a (p.r1713h/r1690h) NT LOVD unknown unstable, destabilising, 70
70 40 c.5228g>a NT Coevoets et (p.r1743q/r1720q) al., c.5227c>t NT Coevoets et (p.r1743w/ al., 2009 R1720W) 40 c.5238_5255del (p.1746del6/ 1723del6) - LOVD unstable, destabilising, 41 c.5383c>t NT Nellist et no known probably neutral (p.r1795c/r1772c) al., 2008 ity 41 c.5386c>a (p.l1796i/l1773i) T LOVD probably probably neutral 71
71 Supplemental Figure SIFT analysis of TSC2. The TSC2 amino acid sequence from the TSC2 Leiden Open Variation Database was analysed using the SIFT algorithm [Ng and Henikoff, 2006]. The number of tolerated and not tolerated substitutions was determined for each amino acid residue. In the figure each amino acid position is represented by a box. Solid green boxes represent positions that are completely tolerant (all substitutions possible, according to SIFT); open green boxes represent positions where 1 or 2 substitutions are not tolerated. Solid red boxes represent intolerant positions (no substitutions tolerated); open red boxes represent positions where 3 or fewer substitutions are tolerated. Empty boxes represent positions where between 3 and 17 substitutions are tolerated. 72

72 TSC2 SIFT analysis o o o o o oooo ooo o o o oo o ooooooooooo o o o o oooooo o o o ooooooooo ao ooo oo oooooooooo oooo oooo ooooooo o o o oo oo o oooo ooooo oo o o o o o oooo 1oo o o oooooooooo ooo oooooo oo o ooo oooooo ooo o o o o o o o o o o o o o ~o o oooooo ooooooooooooooooooooo oo ooooo oooo o oo ooooooo o oo o o o o o o o ooo oo uo oooooooooooooooooooooo. oo ooo oooo. ooooo ooo o o oo o o o o oo o o ~o o o o oo o oooo o oo o o o oo o o ooo oo ooo o o o o o ooo o oo o o oooo o o o o o ooooo o oo o wo o o ooo ooo oo ooo o o o o o o o o oo oo o oo o ooo o o o ~o o oo o oo ooooooooooooooooooooooooo oooo no o o o oo ooooo o o ooooo oo oo ooo oooooooo oooooo o ooo oooooo o o o o o o ooo oooo oooo oo o o o oo oo o o o J o o o o o o o o o ~o ooooooo ooo oo oooooo oooo oooooooo o o wo o o o o o o o oooooo o DD1MO ooooo ooooooooooo o o oo oooooooooo 11m o oo 1mo oooo oo o «0 ooooo o o o o o o o o o oo oo o 1~o o oooooooo o oooooo oo ooooo o o o o o o o o o o o ooo o o o oooooo oo 1ooo o o ooooooo o o o o o ooo o ooooooo oo o o o o o o o oo o o o o o o o o o oo 1~o ooooooooooooooo o o o oo oooooo ooooo o o o o o o ooo ooo oo oooo oooooo oooo 1roo o ooooo o o o o oooooo ooooo oooooo o o o no change tolerated 0 0 <3 changes tolerated 0 <2 chan9es not tolerated no restroct1on stop codon 73
73 Appendix 2: Title page: Unclassified TSC2 variants associated with bilateral, sporadic angiomyolipoma Karin Diderich 1,3, Marianne Hoogeveen-Westerveld 1, Ans van den Ouweland 1, Dicky Halley 1, Michael den Bakker 2, Mark Nellist 1 and Anja Wagner 1 1 Department of Clinical Genetics, Erasmus Medical Centre, Rotterdam, The Netherlands. 2 Department of Pathology, Erasmus Medical Centre, Rotterdam, The Netherlands. 3 To whom correspondence should be addressed: Dr. Karin Diderich, Department of Clinical Genetics, Erasmus Medical Centre, Westzeedijk 112, 3016 AH Rotterdam, The Netherlands, Tel: ; Fax: ; k.diderich@erasmusmc.nl Running title: TSC2 variants in angiomyolipoma 74
74 Abstract Angiomyolipomas (AMLs) are classified as PEComas, neoplasms characterised by perivascular epithelioid cell differentiation. AMLs show a marked female predominance, immunoreactivity for melanocytic and smooth muscle markers and occur predominantly in the kidneys, liver and lungs. Renal AML is highly associated with tuberous sclerosis complex (TSC), an autosomal dominant disorder caused by inactivating mutations in either the TSC1 or TSC2 gene, and both sporadic and TSC-associated renal AMLs show loss of heterozygosity at the TSC1 or TSC2 locus. Here we report on an individual with bilateral, sporadic AMLs, without other clinical signs of TSC, who carries 2 unclassified variants in the TSC2 gene. Keywords: angiomyolipoma, loss of heterozygosity, TSC2 75
75 Introduction Angiomyolipoma (AML) consists of various mesenchymal components, including blood vessels, smooth muscle, epithelioid cells and adipose tissue. AMLs show a marked female predominance, immunoreactivity for melanocytic and smooth muscle markers and, along with lymphangiomyomatosis and clear cell 'sugar' tumour of the lung, are classified as PEComas, tumours that show perivascular epithelioid cell differentiation [Hornick and Fletcher, 2006]. Most AML are single, sporadic lesions; multiple AML are rare and can be associated with several different diseases including Klippel-Trenauney-Weber syndrome, multiple endocrine neoplasia (MEN) type 1, Cowden's disease and tuberous sclerosis complex (TSC) [Carter et al., 1995; Dong et al., 1997; Eng, 2000]. TSC is an autosomal dominant disorder characterised by the development of hamartomas in a variety of organs and tissues [Gomez et al., 1999] TSC is caused by inactivating mutations in either the TSC1 gene on chromosome 9q34 [van Slegtenhorst et al., 1997], or the TSC2 gene on chromosome 16p13.3 [European Consortium, 1993]. The TSC1 and TSC2 gene products, TSC1 and TSC2, interact to form a stable protein complex that inhibits the target of rapamycin complex 1 (TORC1) [Inoki and Guan 2009]. Inactivation of the TSC1-TSC2 complex results in increased TORC1 activity, increased phosphorylation of TORC1 targets including p70 S6 kinase (S6K) and 4E-BP1, and increased protein synthesis and cell growth. Renal AMLs occur frequently in the TSC patient population [Rakowski et al., 2006]. TSC-associated AMLs often show activated TORC1 signalling [Kenerson et al., 2007] as well as loss of heterozygosity (LOH) at either the TSC1 or TSC2 locus [Niida et al., 2001]. LOH at the TSC2 locus has also been demonstrated in sporadic renal AMLs [Henske et al., 1995], suggesting that genetic alterations in TSC1 and TSC2 may play a more general role in the pathogenesis of these lesions. One possibility is that specific TSC1 and TSC2 variants, 76
76 functionally distinct from the inactivating mutations found in TSC patients, may be sufficient to predispose individuals to developing AMLs. TSC2 variants that affect TSC2 gene expression, but are insufficient to cause TSC have been described [Roberts et al., 2003]. Here we describe the genetic and immunohistochemical investigation of a female without signs of TSC but with bilateral renal AMLs, renal cysts and AML and focal nodular hyperplasia of the liver. Two rare TSC2 variants were identified in the proband. The possible roles of these variants in AML pathogenesis are discussed. Materials and Methods Tissue samples Formalin-fixed, paraffin-embedded samples of the AML were prepared according to standard procedures. DNA was isolated from both a buccal swab and peripheral blood using standard techniques. Chemicals and reagents Antibodies were purchased from Cell Signaling Technology (Beverly, U.S.A.) unless stated otherwise. Secondary antibodies for Western blot experiments were obtained from Li- Cor Biosciences (Lincoln, U.S.A.). Other chemicals were from Sigma-Aldrich (St. Louis, U.S.A.), unless stated otherwise. Immunohistochemistry Five micrometer tissue sections on glass slides were deparaffinized and rehydrated prior to antigen retrieval and quenching of endogenous peroxidase activity, as described previously [Bakker et al., 2000]. Sections were incubated with primary antibodies overnight at 4 o C, followed by a 3-step streptavidin-biotin based detection kit (Zymed Laboratories, San 77
77 Fransisco, U.S.A.). Slides were counterstained with haemotoxylin, dehydrated and mounted using Entellan (Electron Microscopy Sciences, Hatfield, U.S.A.), prior to examination under an Olympus BX40 microscope. Loss of heterozygosity analysis Genomic DNA was isolated from serial 20 micrometer sections of the paraffinembedded tumour material as described [van Beers et al. 2006]. DNA concentration and quality were determined by spectrophotometry and agarose gel electrophoresis. Exon-specific PCR amplification, followed by sequencing was performed as previously described [Sancak et al., 2005] using 20 ng template DNA. Functional analysis of TSC2 variants Expression constructs encoding TSC2 variants were derived by site-directed mutagenesis (QuikChange, Stratagene, La Jolla, U.S.A.), or have been described previously [Nellist et al., 2005]. In each case, the complete open reading frame of the new construct was verified by sequence analysis. To investigate the ability of the variants to inhibit TORC1 signalling, HEK 293T cells were transfected with a 4:2:1 mixture of TSC1, TSC2 and S6K expression constructs, as described previously [Coevoets et al., 2009]. The following day the cells were harvested and analysed by immunoblotting. To analyse the ability of the TSC2 variants to form a stable TSC1-TSC2 complex, coimmunoprecipitation was performed. HEK 293T cells were transfected with a 1:1 mixture of TSC2 and myc-tagged TSC1 expression constructs and lysed, 24 hours later, in 50 mm HEPES ph 7.5, 10% glycerol, 1 mm DTT, 100 mm NaCl, 10 mm NaF, 50 mm β- glycerophosphate and 0.1% Triton X-100 plus Complete protease inhibitor cocktail (Roche 78
78 Molecular Biochemicals, Woerden, The Netherlands). After centrifugation ( g, 10 minutes, 4 o C), TSC1-TSC2 complexes were immunoprecipitated from the supernatant fraction by gentle mixing with anti-myc immunoaffinity beads (Sigma-Aldrich) for 90 minutes at 4 o C. After 3 washes with a 20-fold excess of lysis buffer, the immunoprecipitates were analysed by Western blotting, as described previously [Coevoets et al., 2009]. Results Patient clincal and genetic investigations The 34-year old proband presented with abdominal pain and was referred for classification of a liver tumour seen on an abdominal CT scan. Further imaging revealed an AML (maximal diameter 40 mm) and two focal nodal hyperplasias in the liver, a small AML (maximal diameter 9 mm) in the right kidney and a large AML (maximal diameter 81 mm) in the left kidney. A partial left nephrectomy was performed and tumour pathology confirmed the diagnosis AML. The proband had a normal head circumference meaning Cowden's disease was unlikely [ref] and no signs suggestive of Klippel-Trenauney-Weber syndrome were found. There was no family history of TSC and no signs of the disease in the proband, apart from the AMLs. Dermatological, neurological, opthalmological, cardiac and dental investigations revealed no signs of TSC. In addition, imaging showed no lymphangioleiomyomatosis in the lungs nor focal lesions in the brain. Nevertheless, mutation screening of the TSC1 and TSC2 genes was performed. Two TSC2 variants of uncertain clinical significance were identified in the proband, a TSC2 1088C-T (A357V) missense variant in exon 10 and an insertion in intron 38, TSC ins34. As shown in Figure 1, the proband inherited the 1088T allele from her father, and the ins34 allele from her mother. No other variants were identified in either TSC2 or TSC1. To exclude MEN type 1, 79
79 mutation analysis was performed on the CDKN1B gene [Georgitsi et al., 2007]. No variants were identified. Immunohistochemistry Haemotoxylin-eosin staining revealed abundant fat cells, and characteristic areas of smooth muscle-like cells. Very little normal appearing tissue was visible in the sections examined. Sections of the kidney AML showed regions of HMB-45 positivity, confirming the classification of the tumour as a PEComa (data not shown). Most cells were robustly positive for S6 and AKT (Figure 2), and were also clearly positive for S6 phosphorylated at the S235/236 position, AKT phosphorylated at either T308 or S473, and S6K phosphorylated at the T389 hydrophobic motif (Figure 2). It was not possible to determine whether the observed staining was increased relative to the normal kidney tissue in this individual as there was no normal kidney tissue in the available paraffinembedded material. Nevertheless, the strong staining for phosphorylated S6K and S6 indicated that TORC1 signalling was active in the resected AML tissue. Consistent with previous results [Kenerson et al., 2007], we detected phosphorylated AKT in the resected tumour. However, we were unable to determine whether this was reduced compared to the surrounding normal kidney tissue. Loss of heterozygosity (LOH) LOH at the TSC2 locus has been demonstrated in sporadic and TSC-associated AMLs [Niida et al., 2001]. The presence of 2 genetic variants in the probands' TSC2 gene allowed us to test directly whether LOH had occurred at the TSC2 locus in the resected, paraffinembedded AML tissue. We compared sequence reads of TSC2 exon 10 and exons 38/39 from genomic DNA isolated from leukocytes, with the reads derived from the tumour DNA. In all 80
80 cases, comparison of the heterozygous peaks indicated that in the tumour DNA there was a comparative loss of the 1088C (wild-type) ins34 haplotype, inherited from the proband's mother, compared to the 1088T (wild-type) haplotype inherited from the father (Figures 1 and 3). The demonstration of LOH in the tumour DNA was consistent with the inactivation of the TSC2 gene playing an important role in the pathogenesis of the proband's AML. Furthermore, the loss of the mother's allele indicated that the copy of chromosome 16 inherited from the father harboured the variant predisoposing to AML. One possibility was that the TSC2 1088C-T (A3576V) missense change was the predisposing allele. Therefore, we investigated whether the ability of the TSC2 A357V missense variant to inhibit TORC1 activity was impaired, as has been demonstrated for TSC2 variants associated with TSC [Nellist et al., 2005]. We used the SIFT algorithm [Ng and Henikoff, 2006] to determine whether the A357V substitution was likely to affect TSC2 function, and performed coimmunoprecipitation and Western blotting to investigate whether the A357V variant was able to bind TSC1 and to inhibit TORC1 signalling. The results of this analysis are shown in Figure 4. SIFT predicted that the A - V substitution would be tolerated by TSC2, and was therefore unlikely to affect the protein's function. Furthermore, using 3 different splice prediction programs (NetGene2 Server, BDGP: Splice Site Prediction by Neural Network, and Splice Site Finder, splicesitefinder.html], no effect of the nucleotide change on TSC2 mrna splicing was predicted (data not shown). Expression of the TSC2 A357V variant in HEK 293T cells inhibited S6K-T389 phosphorylation (as a read-out for TORC1 activity) as effectively as wild-type TSC2, and significantly better than a known TSC2 variant, R611Q (Figure 4). No differences in TSC1-TSC2 binding were observed between wild-type TSC2 and the A357V variant (Figure 4). 81
81 Consistent with the lack of TSC-associated lesions in both the proband (except for the AMLs) and her father, the TSC2 A357V variant was still able to inhibit TORC1 activity. Therefore, although we could find no evidence that the A357V substitution affected TSC2 activity, the possibility that the A357V variant is associated with AML could not be excluded. Discussion The close association between AMLs and TSC is well-established. Genetic alterations at the TSC1 and TSC2 loci and up-regulation of TORC1 signalling in AML tumour tissue indicates that the active TSC1-TSC2 complex plays an important role in preventing the pathogenesis of these lesions. Here we describe a patient with bilateral AMLs. HMB-45 positivity in the tumour tissue confirmed that the lesions were AMLs, and the detection of activated components of the TORC1 signalling cascade in the tumour tissue was consistent with the dysregulation of this pathway contributing to the pathogenesis of the lesions [Kenerson et al., 2007]. Because bilateral AMLs are associated with TSC [Rakowski et al., 2006], TSC was considered as a diagnosis for the patient. However, no other clinical signs of TSC were identified and no clear inactivating mutation was identified in either the TSC1 or TSC2 gene. Interestingly however, 2 rare TSC2 variants were identified in the probands' DNA and in DNA from her parents. The TSC ins34 variant was inherited by the proband from her mother. In most individuals, the last 18 nucleotides of exon 38 and the beginning of intron 38 consist of 2.3 copies of a 34 base pair repeat sequence (Figure 3). In some individuals one copy of the repeat is deleted (TSC del34; Tuberous sclerosis database - Leiden Open Variation Database, resulting in reduced TSC2 mrna expression [Roberts et al., 2003]. An extra copy of the repeat, as found here, has also been described previously 82
82 [Roberts et al., 2003]( Tuberous sclerosis database - Leiden Open Variation Database, However, it is not known whether the insertion of an extra copy of the repeat affects TSC2 mrna expression. Unfortunately, no RNA from the proband or her mother was available for testing. LOH analysis of the proband's tumour DNA showed that this allele was lost in the AML tissue, suggesting that it is unlikely to predispose to AML. The TSC21088C-T (A357V) missense change was inherited from the proband's father and was retained in the tumour DNA. It is therefore possible that this variant is either the predisposing allele, or is in close proximity to it. The fact that the father carries the allele, but has not (yet) developed AML can be explained by the observation that sporadic AMLs show a strong female bias [Hornick and Fletcher, 2006] and that sex hormones play an important role in the initiation and/or progression of these lesions. Any effect of the A357V substitution on the activity of the TSC1-TSC2 complex is likely to be mild, since the proband had no signs of TSC apart from the AMLs and renal cysts, and no effect on TSC1-TSC2 function was detected in vitro. We could not exclude the possibility that the AMLs are caused by another, undetected TSC2 variant, or a variant within another gene close to the TSC2 locus. Summary Here we describe the genetic and immunohistochemical investigation of a female with bilateral renal AMLs and AML of the liver, but without a history of TSC. HMB-45 positivity in the tumour tissue, as detected by immunohistochemistry, confirmed that the tumours were AMLs. Furthermore, the demonstration of activated components of the AKT-TORC1 signalling cascade in the tumour cells was consistent with the dysregulation of this pathway contributing to the pathogenesis of these lesions. Genetic analysis revealed 2 rare TSC2 variants, TSC ins34 and TSC21088C- T (A357V). The TSC ins34 variant was inherited from the proband's mother and was 83
83 lost from the genomic DNA isolated from the AML. In contrast, the TSC21088C-T (A357V) variant was retained in the tumour DNA, suggesting that the A357V substitution may predispose to the development of AMLs. Consistent with the lack of any further clinical signs of TSC in either the proband or her father, no differences in activity between the TSC2 A357V variant and wild-type TSC2 could be detected. Acknowledgments Financial support was provided by the U.S. Department of Defense Congressionally- Directed Medical Research Program (grant #TS060052). The authors report no conflicts of interest. References Bakker CE, de Diego Otero Y, Bontekoe C, Raghoe P, Luteijn T, Hoogeveen AT, Oostra BA, Willemsen R Immunocytochemical and biochemical characterization of FMRP, FXR1P, and FXR2P in the mouse. Exp Cell Res 258: van Beers EH, Joosse SA, Ligtenberg MJ, Fles R, Hogervorst FB, Verhoef S, Nederlof PM A multiplex PCR predictor for acgh success of FFPE samples. Br J Cancer 94: Carter DA, Kim K, Brinker RA and Raffel C Extradural tumor causing spinal cord compression in Klippel-Trenaunay-Weber syndrome. Surg Neurol 43:
84 Coevoets R, Arican S, Hoogeveen-Westerveld M, Simons E, van den Ouweland A, Halley D, Nellist M 2009 A reliable cell-based assay for testing unclassified TSC2 gene variants. Eur J Hum Genet 17: Dong Q, Debelenko LV, Chandrasekharappa SC, Emmert-Buck MR, Zhuang Z, Guru SC, Manickam P, Skarulis M, Lubensky IA, Liotta LA, Collins FS, Marx SJ and Spiegel AM Loss of heterozygosity at 11q13: Analysis of pituitary tumors, lung carcinoids, lipomas and other uncommon tumors in subjects with familial multiple endocrine neoplasia type 1. J Clin Endocrinol Metab 82: Eng C Will the real Cowden syndrome please stand up: revised diagnostic criteria. J Med Genet 37: European Chromosome 16 Tuberous Sclerosis Consortium Identification and characterization of the tuberous sclerosis gene on chromosome 16. Cell 75: Georgitsi M, Raitila A, Karhu A, van der Luijt RB, Aalfs CM, Sane T, Vierimaa O, Makinen MJ, Tuppurainen K, Paschke R, Gimm O, Koch CA, Gundogdu S, Lucassen A, Tischkowitz M, Izatt L, Aylwin S, Bano G, Hodgson S, DeMenis E, Launonen V, Vahteristo P, Aaltonen LA Germline CDKN1B/p27Kip1 mutation in multiple endocrine neoplasia. J Clin Endocrinol Metab 92: Gomez MG, Sampson JR, Holets-Whittemore V, eds The tuberous sclerosis complex. 3rd edn. Developmental Perspectives in Psychiatry, Oxford University Press, New York and Oxford. 85
85 Hornick JL, Fletcher CDM PEComa: what do we know so far? Histopathol 48: Inoki K, Guan K-L Tuberous sclerosis complex, implication from a rare genetic disease to common cancer treatment. Hum Mol Genet 18:R94-R100. Kenerson H, Folpe AL, Takayama TK, Yeung RS Activation of the mtor pathway in sporadic angiomyolipomas and other perivascular epithelioid cell neoplasms. Hum Pathol 38: Nellist M, Sancak O, Goedbloed MA, Rohe C, van Netten D, Mayer K, Tucker-Williams A., van den Ouweland AMW, Halley DJJ Distinct effects of single amino acid changes to tuberin on the function of the tuberin-hamartin complex. Eur J Hum Genet 13: Ng PC, Henikoff S Predicting the effects of amino acid substitutions on protein function. Ann Rev Genomics Hum Genet 7: Niida Y, Stemmer-Rachamimov AO, Logrip M, Tapon D, Perez R, Kwiatkowski DJ, Sims K, MacCollin M, Louis DN, Ramesh V Survey of somatic mutations in tuberous sclerosis complex (TSC) hamartomas suggests different genetic mechanisms for pathogenesis of TSC lesions. Am J Hum Genet 69: Rakowski SK, Winterkorn EB, Paul E, Steele DJ, Halpern EF, Thiele EA Renal manifestations of tuberous sclerosis complex: incidence, prognosis and predictive factors. Kidney Int 70:
86 Roberts PS, Ramesh V, Dabora S, Kwiatkowski DJ A 34 bp deletion within TSC2 is a rare polymorphism, not a mutation. Ann Hum Genet 67: Sancak O, Nellist M, Goedbloed M, Elfferich P, Wouters C, Maat-Kievit A, Zonnenberg B, Verhoef S, Halley D, van den Ouweland A Mutational analysis of the TSC1 and TSC2 genes in a diagnostic setting: genotype-phenotype correlations and comparison of diagnostic DNA techniques in tuberous sclerosis complex. Eur J Hum Genet 13: van Slegtenhorst M, de Hoogt R, Hermans C, Nellist M, Janssen B, Verhoef S, Lindhout D, van den Ouweland A, Halley D, Young J, Burley M, Jeremiah S, Woodward K, Nahmias J, Fox M, Ekong R, Wolfe J, Povey S, Osborne J, Snell RG, Cheadle JP, Jones AC, Tachataki M, Ravine D, Sampson JR, Reeve MP, Richardson P, Wilmer F, Munro C, Hawkins TL, Sepp T, Ali JBM, Ward S, Green AJ, Yates JRW, Short MP, Haines JH, Jozwiak S, Kwiatkowska J, Henske EP, Kwiatkowski DJ Identification of the tuberous sclerosis gene TSC1 on chromosome 9q34. Science 277: van Slegtenhorst M, Nellist M, Nagelkerken B, Cheadle J, Snell R, van den Ouweland A, Reuser A, Sampson J, Halley D, van der Sluijs P Interaction between hamartin and tuberin, the TSC1 and TSC2 gene products. Hum Mol Genet 7:
87 Figures Figure 1: Pedigree of the investigated family. The TSC2 haplotypes are shown for the 1088C-T variant in exon 10 (alleles C or T), and the insertion of an extra copy of the 34 basepair repeat in intron 38 (alleles - or ins34). The haplotypes inherited by the proband (filled circle) are shown in the open boxes. 88
88 Figure 2 : Immunohistochemical analysis of the AML. (A) Immunoreactivity for AKT, and S473- and T308- phosphorylated AKT (B) Immunoreactivity for S6K and T389-phosphorylated S6K. (C) Immunoreactivity for S6 and S235/S236-phosphorylated S6. Robust immunoreactivity for the above markers was observed in most tumour cells. 89
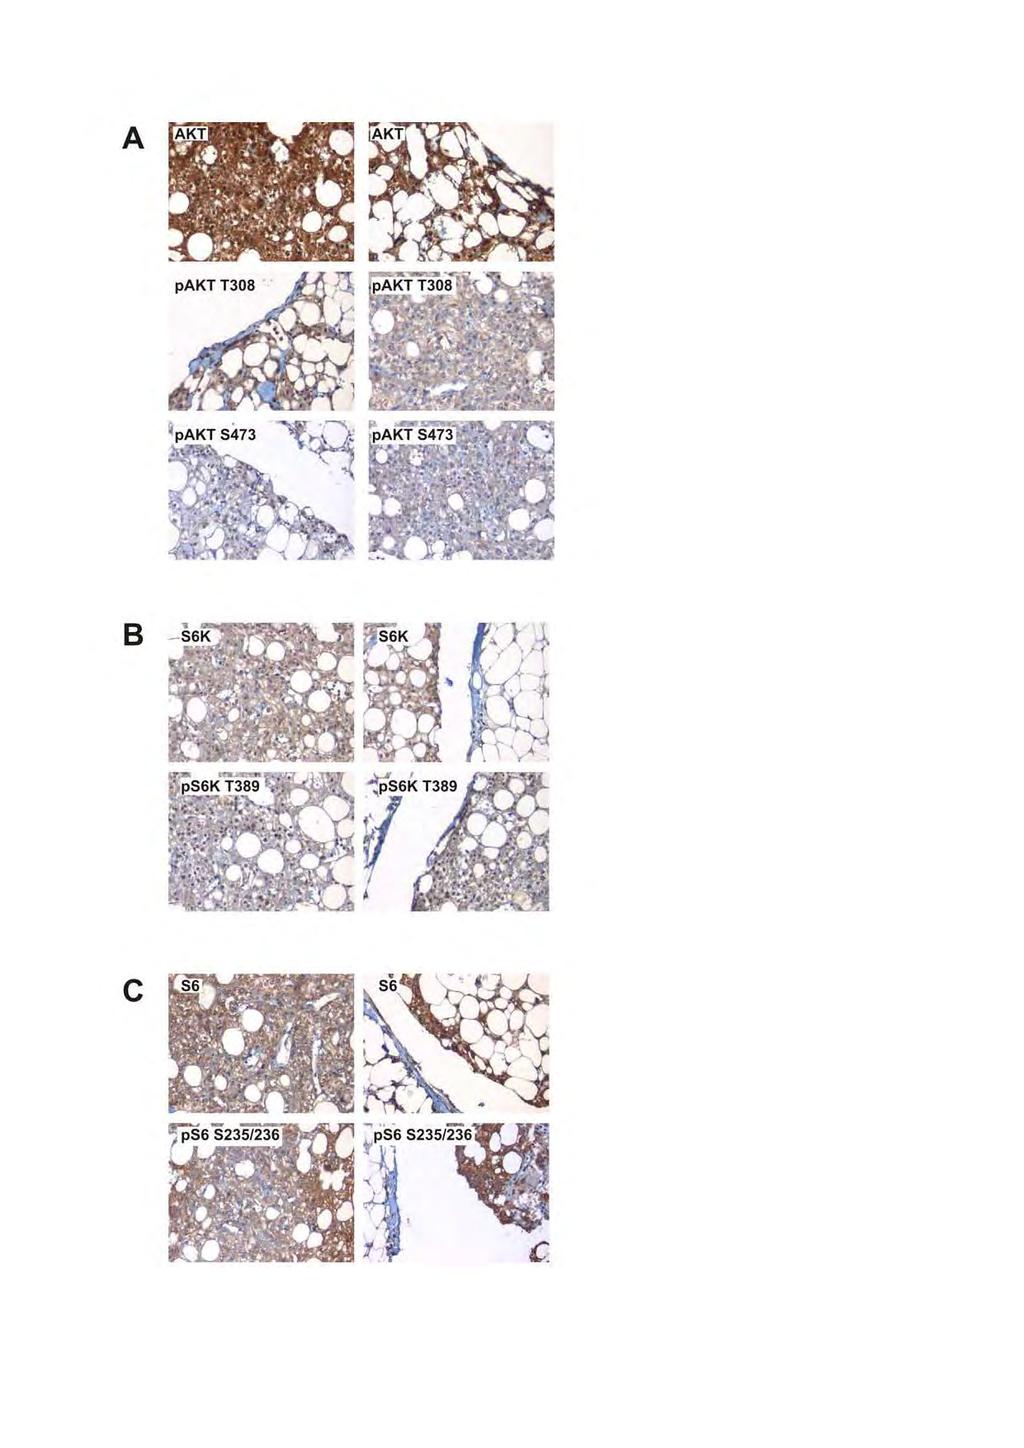
89 A 8 c 90
90 Figure 3: Loss of heterozygosity analysis. Genomic DNA isolated from blood and from the paraffin-embedded tumour material was amplified by PCR and sequenced. The individual sequencing peaks were compared. (A) Sequence analysis of the TSC2 1088C-T (A357V) variant in the proband. Height of the blue electropherogram peak (arrow; C allele) is comparable to the height of the red peak (arrow; T allele) in the blood DNA (box, top). In contrast, in the tumour DNA, the blue (C allele) peak is reduced relative to the red (T allele) peak. (B) TSC ins34 variant. Sequence (forward strand only) of the repeat region in TSC2 exon 38 and intron 38. Exonic nucleotides are represented by capital letters, intronic nucleotides are in lower case. The 2.3 copies of the repeat sequence are indicated in purple, orange and blue. The position of the extra copy of the 34 nucleotide repeat detected in the proband (green) is indicated. (C) Sequence analysis of the TSC ins34 variant. Top: The forward strand sequences of both of the proband's TSC2 alleles are shown. The allele containing the 34 nucleotide insertion (green) is shown in italics. Bottom: The heights of the electropherogram peaks in the blood DNA were compared to the peak heights in the tumor samples. The peak heights of the underlined nucleotides, all from the allele containing the insertion, were reduced compared to the corresponding peak from the other allele. 91
91 A ~ - tumour ~ - ~ blood DNA DNA B ccctgcaqtgcaggaaaggt.gggccgggt9ggg exon 38 AACCTGGTGTCCCT CAACTTTGTCCACGTGATCGTCACCCCGCTGGACTACGAGTGC TGCAGGAAAGgtagggccgggtggggccctgcagtgcaggaaa ggtagggccgggtggggccctgcagtgtggcgccaagagccctgggcctggcgtgaccacc aagtctccccaggcatggagggccttgtggccaccagcgttg exon 39 c ggtagggccgggtggggccctgcagtgtggcgccaaga ccctgggcctggcgtgaccacc ggtagggccgggtggggccct~agtgc.ggaaaggta ggccgggtggggccctgcagtg blood DNA cagtqtggcgccaoga c gtr.;c qr; aggt tumour DNA caqtqtqgcqc caaga CAgtgc gg.e ~C'II tumour DNA cagtgtggcqccaaga c- qcg~ gg wt 92
92 Figure 4: Functional analysis of the TSC2 A357V variant (A) Cells expressing TSC1, S6K and the TSC2 A357V variant, and control cells expressing TSC1, S6K and either wild-type TSC2 or the TSC2 R611Q variant, were analysed by immunoblotting. The signals for TSC2, TSC1, S6K and T389-phosphorylated S6K (T389) are shown. (B) Quantification of the immunoblot signals to show the inhibition of S6K T389 phosphorylation in the presence of the TSC2 variants. The ratio of the S6K T389 phosphorylation signal to the total S6K signal (T389/S6K) was determined relative to wildtype TSC2 (wild-type TSC2 T389/S6K ratio = 1). Standard deviations are indicated. Variants with a significantly increased T389/S6K ratio (p values < 0.05; paired Student's t-test) compared to wild-type TSC2 are indicated with an asterisk. 93
93 A TSC2 -.~...-- TSC1 --- S6K..,..,.. T389-8 rei. T389/S6K 6 * TSC2 R611Q A357V c TSC2 --- TSC1 input TSC2 - TSC1 TSC11P 94
94 Appendix 3: Title page: The TSC2 c.3598c>t (p.r1200w) missense mutation co-segregates with tuberous sclerosis complex in multiple mildy affected kindreds Marjolein Wentink 1., Mark Nellist 1., Marianne Hoogeveen-Westerveld 1., Bernard Zonnenberg 2., Dorinne van der Kolk 3., Soo-Mi Park 4., Dicky Halley 1., Ans van den Ouweland 1. and Anneke Maat-Kievit Department of Clinical Genetics, Erasmus MC, 3015 GE Rotterdam, The Netherlands. 2. Department of Oncology, University of Utrecht Medical Centre, Utrecht, The Netherlands. 3. Department of Clinical Genetics, University Medical Centre Groningen, Groningen, The Netherlands. 4. Department of Clinical Genetics, Addenbrooke's Hospital, Cambridge, U.K. Corresponding author: Anneke Maat-Kievit Department of Clinical Genetics, Erasmus MC, 3015 GE Rotterdam, The Netherlands. running title: TSC2 R1200W missense mutation 95
95 Abstract Tuberous sclerosis complex (TSC) is an autosomal dominant disorder characterised by a combination of neurological symptoms and hamartomatous growths in various organ systems. The disease is caused by mutations in the TSC1 and TSC2 genes. Overall, TSC2 mutations are associated with a more severe disease phenotype. We identified the c.3598c>t nucleotide change in the TSC2 gene in 6 different families with TSC. In each case, the TSC phenotype was mild, characterised by a lack of disfiguring skin lesions, severe mental retardation or major organ involvement. Our findings support other studies showing that some TSC2 missense mutations are associated with less severe TSC phenotypes. keywords: Tuberous sclerosis complex, TSC2, TSC2, mild phenotype 96
96 Introduction Tuberous sclerosis complex (TSC) is an autosomal dominant disorder characterized by the development of hamartomas in a variety of tissues, including the brain, skin and kidneys [Gomez et al., 1999]. TSC is caused by mutations in either the TSC1 gene on chromosome 9p34 [van Slegtenhorst et al., 1997] or the TSC2 gene on chromosome 16p13.3 [European Consortium, 1993]. Penetrance is considered to be complete and the disease is estimated to occur in 1/6000-1/10000 live births [Gomez et al., 1999]. Approximately 60%-70% of cases are caused by de novo mutations, indicating a high spontaneous mutation rate [Cheadle et al., 2000]. The TSC1 and TSC2 gene products, TSC1 and TSC2, interact to form a protein complex. TSC2 contains a catalytic GTPase activating protein (GAP) domain and acts on the GTPase RHEB to inhibit RHEB-GTP-dependent stimulation of the target of rapamycin complex 1 (TORC1) [Inoki and Guan, 2009]. Inactivation of the TSC1-TSC2 complex results in the phosphorylation of TORC1 targets, including p70 S6 kinase (S6K), the ribosomal protein S6 and the elongation factor 4 binding protein 1 (4E-BP1). Although the clinical phenotypes of TSC patients are highly variable, individuals with a TSC2 mutation are more likely to have more clinical features and more severe symptoms than those with a TSC1 mutation [Dabora et al., 2001]. Interestingly however, several families with a TSC2 missense mutation and a mild TSC phenotype have been described [Khare et al., 2001; O' Connor et al., 2003; Mayer et al., 2004; Jansen et al., 2006], suggesting that some TSC2 mutations may be associated with less severe forms of TSC. Here we report five unrelated families and one sporadic patient, carrying the c.3598 C-T (p.r1200w) missense mutation in the TSC2 gene. In general, the mutation carriers were 97
97 relatively mildly affected, and many carriers did not fulfil the diagnostic criteria for definite TSC. We compared the in vitro activity of the TSC2 R1200W mutant protein to wild-type TSC2 and other TSC2 variants. Our analysis indicates that although the R1200W substitution does not prevent TSC1-TSC2 binding, the subcellular distribution of the mutant complex is altered and it is unable to inhibit TORC1 signalling. The effects of the R1200W substitution on in vitro assays of TSC1-TSC2 function are discussed in relation to the mild phenotypes observed in the families described here. Materials and methods Collection of clinical data A standardized evaluation form/questionnaire was completed for each family member by the clinician involved. DNA mutation analysis Mutation analysis was performed as described previously [Sancak et al., 2005] or by sequence analysis of all coding exons and exon/intron boundaries (primers available on request). The mutation is described according to HGVS nomenclature (Accession number NM_ ). Haplotype analysis Six microsatellite markers, cgr484 (rs ), cgr485 (rs ), cgr527, cgr531 (KG8), cgr533 (rs ) and cgr534 (rs ), were typed in all the available family 98
98 members. All the markers mapped within 0.5 Mb of the TSC2 genomic locus. Primer sequences are available on request. Prediction analysis To investigate whether the TSC2 c.3598c>t change affected RNA splicing, ALAMUT software (Mutation Interpretation Software; version 1.5, May 2009; Interactive Biosoftware, Rouen, France) was used. The effect of the R1200W substitution on TSC2 structure and function were predicted using SIFT [Ng and Henikoff, 2006]. SIFT scores were calculated using a multiple sequence alignment of TSC2 from 14 different species (human, chimpanzee, maccaca, cow, dog, horse, mouse, chicken, zebrafish, pufferfish, fruitfly, mosquito, methylotrophic yeast and fission yeast). Constructs and antisera Expression constructs were derived by site-directed mutagenesis using the Stratagene QuickChange kit, or have been described previously [Nellist et al., 2005]. All constructs were sequenced completely. Antibodies were purchased from Cell Signaling Technology (Danvers, MA, U.S.A.), except for a mouse monoclonal antibody against TSC2 which was purchased from Zymed Laboratories (San Francisco, CA, U.S.A.), or were described previously [van Slegtenhorst, 1998]. Coimmunoprecipitation HEK 293T cells in 6 cm dishes were transfected with expression constructs encoding different TSC2 variants and C-terminal myc-tagged TSC1 using polyethyleneimine 99
99 (Polysciences Inc., Warrington, PA, U.S.A.)[Coevoets et al., 2009]. Twenty-four hours after transfection the cells were washed with cold PBS and lysed in 0.4 ml lysis buffer (50 mm Tris-HCl ph 7.5, 100 mm NaCl, 50 mm NaF, 1 % Triton X100 and a protease inhibitor cocktail (Complete, Roche Molecular Biochemicals)) for 10 minutes on ice. The lysates were cleared by centrifugation ( g for 10 minutes at 4 o C) and the supernatant fractions transfered to EZ Red anti-myc affinity beads (Sigma-Aldrich) preequilibrated in lysis buffer. After gentle rotation for 3 hours at 4 o C, the beads were recovered by gentle centrifugation (1000 g for 15 seconds at 4 o C), washed 3 times with >20-fold excess of lysis buffer, and resuspended in sample buffer prior to immunoblot analysis (Criterion SDS-PAGE system; BioRad, Hercules, CA, U.S.A.). Protein expression levels were estimated by near infra-red detection and quantification of the blotted proteins on an Odyssey TM scanner (Li-Cor Biosciences, Lincoln, NE, U.S.A.). Immunoblot analysis of S6K T389 and TSC2 T1439 phosphorylation HEK 293T cells in 3.5 cm dishes were transfected with expression constructs encoding TSC2 variants and myc-tagged TSC1 and S6K and harvested in 0.3 ml lysis buffer, as described above. After centrifugation ( g for 10 minutes at 4 o C), the supernatant fractions were recovered and the pellets resuspended by sonication in 0.3 ml lysis buffer. Supernatant and pellet fractions were analysed by immunoblotting, as above. To investigate the effect of AKT activity on TSC2 T1439 phosphorylation, transfected cells were treated with 10nM wortmannin (Sigma-Aldrich) for 0-30 minutes prior to harvesting. Immunofluorescent microscopy 100
100 Tsc2 -/- mouse embryo fibroblasts (MEFs) were seeded onto glass coverslips, transfected and processed for immunofluorescent microscopy as described previously [Nellist et al., 2005]. Fixed, permeabilised cells were incubated with a primary mouse monoclonal antibody specific for TSC2 (Zymed) and a primary rabbit monoclonal antibody specific for S235/236 phosphorylated S6 (Cell Signaling Technology), followed by Cy2- and Cy3-coupled secondary antibodies (DAKO, Carpinteria, CA, U.S.A.). Cells were mounted in Mowiol (Calbiochem, La Jolla, CA, U.S.A.) and studied using a Leica DM RXA microscope and Image Pro-Plus version 6 image analysis software. The S6 S235/236 phosphorylation status of TSC2-expressing cells was compared to nonexpressing (untransfected) cells. The numbers of TSC2 positive cells in which S235/236 phosphorylated S6 was visible were counted independently by three observers in two separate experiments. Results Clinical and genetic findings Six families, 5 from The Netherlands and one from the United Kingdom, were identified with the TSC2 c.3598c>t (p.r1200w) variant. The pedigrees are shown in Figure 1 and the clinical findings are summarised in Tables 1-3. Six microsatellite markers mapping close to the TSC2 locus were typed in all the available family members from the five Dutch families. In each case, the disease haplotype was different (data not shown), indicating that the TSC2 c.3598c>t change was more likely to have occurred multiple times, than to be derived from a common founder. 101
101 Family 1488 Family 1488 is shown in Figure 1A and the clinical findings in the mutation carriers are summarised in Table 2. Six individuals (I.2, II.1, III.3, III.4, IV.1 and IV.2) had signs and/or symptoms of TSC, including 2 (III.3, IV.2) with a history of epilepsy in childhood. All 6 had skin lesions consistent with TSC, but no ophtalmological lesions were found. IV.1 had a single renal cyst, and in IV.2 a possible angiomyolipoma (AML) was detected. III.3 showed signs of cardiomegaly, but no rhabdomyoma were detected. Dental pits (DP) were observed in III.4. Brain magnetic resonance imaging (MRI) or computed tomography (CT) was performed in 6 individuals. A single cortical tuber was detected in IV.1, the only family member to fulfill the diagnostic criteria for definite TSC. Clinical exams did not reveal any signs of TSC in III.2 or IV.3. The TSC2 c.3598c>t variant was detected in II.1, III.3 and III.4, and was absent from III.2. DNA testing was not possible in the other family members. Family Family is shown in Figure 1B and the clinical findings in the mutation carriers are summarised in Table 2. Five individuals had signs or symptoms of TSC. III.2 had seizures and behavioral disturbances and was diagnosed with definite TSC on the basis of skin lesions, cardiac rhabdomyoma and brain lesions. II.2 and III.1 had skin lesions only. No renal abnormalities were detected. Hydrocephalus was anamnestically reported for III.3 and I.2 was reported to have had epilepsy. However, no other clinical or genetic information were available for these individuals. II.2 and III.2 carried the TSC2 c.3598c>t variant; II.3 did not. Family
102 Family is shown in Figure 1C and the clinical findings in the mutation carriers are summarised in Table 2. Three individuals were reported to fulfil the criteria for definite TSC, although the results of the clinical investigations were unavailable. Skin lesions were reported in 5 individuals. However, no other abnormalities were found and no epilepsy, mental retardation or behavioral problems were reported. DNA mutation analysis was performed in 13 individuals, 8 of whom carried the TSC2 c.3598c>t variant. Family Family is shown in Figure 1D and the clinical findings in the mutation carriers are summarised in Table 2. Seven individuals showed at least one sign of TSC. The TSC2 c.3598c>t variant was identified in 5 individuals, all of whom had skin lesions. Cortical tubers were detected in III.4, IV.2 and IV.3, and IV.3 had a cardiac rhabdomyoma. All thoracic X-ray, dental and ophtalmological examinations were normal. Seven individuals were reported to have had epilepsy. In 4 cases this remitted during childhood. IV.2 and IV.3 were reported as having behavioral disturbances. II.1 did not carry the TSC2 c.3598c>t variant and was not reported to have any signs of the disease. Family The TSC2 c.3598c>t variant was identified in an individual with seizures, mild mental retardation, skin lesions, cortical tubers and subependymal nodules, but no lesions in kidneys, heart, mouth or eyes (Table 2). No data on other family members was available. Family
103 Family is shown in Figure 1E. III.1 had seizures that remitted at 17 years, brain imaging suggestive of TSC and skin lesions but no renal findings (Table 2). I.1, II.1 and III.2 were all reported to have had epilepsy, however no other data was available for these individuals.. Functional characterisation of the TSC2 R1200W variant The TSC2 R1200W variant interacts with TSC1 and is phosphorylated by AKT We compared TSC1-TSC2 complex formation in HEK 293T cells expressing the TSC2 R1200W variant with cells expressing wild-type TSC2 and cells expressing the TSC2 R611Q variant [Nellist et al., 2001]. The variants were coexpressed with a TSC1 fusion protein containing a C-terminal myc epitope tag and TSC1-TSC2 complexes were immunoprecipitated using myc-affinity beads. Coimmunoprecipitated TSC2 variants were detected by immunoblotting. As shown in Figure 2A, the TSC2 R1200W variant was coimmunoprecitated with TSC1 as effectively as wild-type TSC2. Next, we compared the AKT-dependent phosphorylation of wild-type TSC2 and the R1200W variant at the T1439 position. As shown in Figure 2B, we did not observe any differences, indicating that TSC2 phosphorylation is unlikely to be affected by the R1200W substitution. The TSC2 R1200W variant is unable to inhibit TORC1 signalling To determine whether the TSC2 R1200W variant could inhibit TORC1 signalling, S6 S235/236 phosphorylation was assessed in transfected Tsc2 -/- MEFs by immunofluorescent microscopy (Figure 3) and S6K T389 phosphorylation was estimated in the transfected HEK293T cells by immunoblotting (Figure 4). S6 S235/236 phosphorylation was inhibited in less than 12% of the in Tsc2 -/- MEFs expressing the 104
104 R1200W or R611Q variants, compared to more than 95% of the cells expressing wildtype TSC2 (Figure 4C) and S6K T389-phosphorylation was not inhibited in the presence of the TSC2 R1200W variant (Figure 3A and D). Therefore we concluded that the R1200W substitution is a change, that restricts the TSC1-TSC2-dependent inhibition of TORC1 activity, without preventing TSC1-TSC2 binding. We noticed that the signal for the R1200W variant on the immunoblot was reduced relative to wild-type TSC2 (Figure 4A and B) and that the localisation pattern of this variant in the Tsc2 -/- MEFs was different to the wild-type protein (Figure 3A). The R1200W variant localised predominantly in a perinuclear aggregate- or inclusion-like pattern. We determined the proportions of the R1200W variant and co-expressed TSC1 in Triton X100-soluble and -insoluble fractions. As shown in Figure 4F, compared to wildtype TSC2, less of the R1200W variant and more TSC1 was detected in the Triton X100- insoluble fraction, suggesting that the TSC1-TSC2 R1200W complexes are less stable than the wild-type TSC1-TSC2 complex, and more prone to aggregation and/or degradation. Discussion The majority of TSC patients are sporadic, and carry a de novo TSC1 or TSC2 mutation [Sancak et al., 2005]. In familial cases, approximately half of the mutations identified are in the TSC2 gene [Sancak et al., 2005], and most families are small and have a unique mutation. Large, multi-generation kindreds are not common. Nevertheless, a few large families have been described where a TSC2 missense mutation cosegregates with 105
105 less severe symptoms of TSC, generally skin lesions and mild neurological symptoms without severe hamartomatous lesions in other organs [Khare et al., 2001; O' Connor et al., 2003; Mayer et al., 2004; Jansen et al., 2006]. Here we describe multiple, unrelated families with predominantly mildly affected individuals carrying a TSC2 c.3598c>t (p.r1200w) mutation. The clinical diagnoses in the mutation carriers are summarised in Table 1, and the clinical findings are shown in Table 2. We compared the clinical findings in the mutation carriers to a large cohort of TSC patients with TSC2 mutations [Sancak et al., 2005]. As shown in Table 3, with the exception of hypomelanotic macules, the incidence of the signs and symptoms associated with TSC were lower in the TSC2 c.3598c>t (p.r1200w) mutation carriers, compared to the general TSC2 mutation population. Notably, only one TSC2 c.3598c>t (p.r1200w) mutation carrier was mildly mentally retarded, the rest were of normal intelligence; no renal lesions were detected and the incidence of facial angiofibroma was approximately 4-fold lower than in the total TSC2 population. We studied the effect of the R1200W substitution on the TSC1-TSC2 complex in vitro, and demonstrated that the change inactivated the TSC1-TSC2 complex, without disrupting TSC1-TSC2 binding. Interestingly, functional studies on the S1036P, R905Q and G1556S substitutions, identified in mildly affected families with TSC, showed that these substitutions also inactivate the TSC1-TSC2 complex without disrupting TSC1- TSC2 binding [unpublished observations; Jansen et al., 2006; Mayer et al., 2004]. It is possible that in vivo these variants retain some activity, and therefore provide (partial) protection from the more severe symptoms of TSC. It will be interesting to determine whether other TSC2 missense mutations that do not affect TSC1-TSC2 binding are associated with less severe TSC phenotypes. 106
106 We investigated the possibility that the TSC2 c.3598c>t (p.r1200w) mutation was a single mutational event by haplotype analysis. We identified a different disease haplotype in each family, and concluded that the TSC2 c.3598c>t (p.r1200w) change is a recurrent mutation. According to the TSC2 Leiden Open Variation Database ( the TSC2 c.3598c>t (p.r1200w) mutation has been identified in at least 4 other cases of TSC, including 2 de novo and 2 familial cases [Wilson et al., 1996; Au et al., 1998; Au et al., 2007]. Wilson et al. described a parent and 2 affected children with skin features and seizures. One family member was mentally retarded, and another had behavioural problems [Wilson et al., 1996]. Au et al. described a large family with mild skin features, epilepsy and cerebral MRI abnormalities, but no retardation or other TSC-associated symptoms [Au et al., 1998]. In summary, we identified the c.3598c>t (p.r1200w) mutation in the TSC2 gene in 6 unrelated families with TSC. In each family the TSC phenotype was relatively mild. We demonstrated that the TSC2 R1200W substitution inactivated the TSC1-TSC2 complex, without preventing TSC1-TSC2 binding. Interestingly, functional analysis of the R905Q, S1036P and R1200W variants, that all cosegregate with mild symptoms of TSC in extended families, suggests that some TSC2 variants that inactivate the TSC1-TSC2 complex without affecting TSC1-TSC2 binding may be associated with a milder TSC phenotype. References 107
107 Au KS, Rodriguez JA, Finch JL, Volcik KA, Roach ES, Delgado MR, Rodriguez E Jr, Northrup H Germ-line mutational analysis of the TSC2 gene in 90 tuberous sclerosis patients. Am J Hum Genet 62: Au K-S, Williams AT, Roach ES, Batchelor L, Sparagana SP, Delgado MR, Wheless JW, Baumgartner JE, Roa BB, Wilson CM, Smith-Knuppel TK, Cheung MY, Whittemore VH, King TM, Northrup H Genotype/phenotype correlation in 325 individuals referred for a diagnosis of tuberous sclerosis complex in the United States. Genet Med 9: Cheadle JP, Reeve MP, Sampson JR, Kwiatkowski DJ Molecular genetic advances in tuberous sclerosis. Hum Genet 107: Coevoets R, Arican S, Hoogeveen-Westerveld M, Simons E, van den Ouweland A, Halley D, Nellist M 2009 A reliable cell-based assay for testing unclassified TSC2 gene variants. Eur J Hum Genet 17: Dabora SL, Jozwiak S, Franz DN, Roberts PS, Nieto A, Chung J, Choy YS, Reeve MP, Thiele E, Egelhoff JC, Kasprzyk-Obara J, Domanska-Pakiela D, Kwiatkowski DJ Mutational analysis in a cohort of 224 tuberous sclerosis patients indicates increased severity of TSC2, compared with TSC1, disease in multiple organs. Am J Hum Genet 68: European Chromosome 16 Tuberous Sclerosis Consortium Identification and characterization of the tuberous sclerosis gene on chromosome 16. Cell 75:
108 Gomez MG, Sampson JR, Holets-Whittemore V, eds The tuberous sclerosis complex. 3rd edn. Developmental Perspectives in Psychiatry, Oxford University Press, New York and Oxford. Inoki K, Guan K-L Tuberous sclerosis complex, implication from a rare genetic disease to common cancer treatment. Hum Mol Genet 18:R94-R100. Jansen AC, Sancak O, D'Agostino MD, Badhwar A, Roberts P, Gobbi G, Wilkinson R, Melanson D, Tampieri D, Koenekoop R, Gans M, Maat-Kievit A, Goedbloed M, van den Ouweland AMW, Nellist M, Pandolfo M, McQueen M, Sims K, Thiele EA, Dubeau F, Andermann F, Kwiatkowski DJ, Halley DJJ, Andermann E Unusually mild tuberous sclerosis phenotype is associated with TSC2 R905Q mutation. Ann Neurol. 60: Khare L, Strizheva GD, Bailey JN, Au K-S, Northrup H, Smith M, Smalley SL, Petri Henske E A novel missense mutation in the GTPase activating protein homology region of TSC2 in two large families with tuberous sclerosis complex. J Med Genet 38: Mayer K, Goedbloed M, van Zijl K, Nellist M, Rott HD Characterisation of a novel TSC2 missense mutation in the GAP related domain associated with minimal clinical manifestations of tuberous sclerosis. J Med Genet 41 e64. Nellist M, Verhaaf B, Goedbloed MA, Reuser AJJ, van den Ouweland AMW, Halley DJJ TSC2 missense mutations inhibit tuberin phosphorylation and prevent formation of the tuberin-hamartin complex. Hum. Molec. Genet. 10:
109 Nellist M, Sancak O, Goedbloed MA, Rohe C, van Netten D, Mayer K, Tucker-Williams A., van den Ouweland AMW, Halley DJJ Distinct effects of single amino acid changes to tuberin on the function of the tuberin-hamartin complex. Eur J Hum Genet 13: Ng PC, Henikoff S Predicting the effects of amino acid substitutions on protein function. Ann Rev Genomics Hum Genet 7: O'Connor SE, Kwiatkowski DJ, Roberts PS, Wollmann RL, Huttenlocher PR A family with seizures and minor features of tuberous sclerosis and a novel TSC2 mutation. Neurology 61: Roach ES, Gomez MR, Northrup H Tuberous sclerosis complex consensus conference: revised clinical diagnostic criteria. J Child Neurol 13: Sancak O, Nellist M, Goedbloed M, Elfferich P, Wouters C, Maat-Kievit A, Zonnenberg B, Verhoef S, Halley D, van den Ouweland A Mutational analysis of the TSC1 and TSC2 genes in a diagnostic setting: genotype-phenotype correlations and comparison of diagnostic DNA techniques in tuberous sclerosis complex. Eur J Hum Genet 13: van Slegtenhorst M, de Hoogt R, Hermans C, Nellist M, Janssen B, Verhoef S, Lindhout D, van den Ouweland A, Halley D, Young J, Burley M, Jeremiah S, Woodward K, Nahmias J, Fox M, Ekong R, Wolfe J, Povey S, Osborne J, Snell RG, Cheadle JP, Jones AC, Tachataki M, Ravine D, Sampson JR, Reeve MP, Richardson P, Wilmer F, Munro C, Hawkins TL, Sepp T, Ali JBM, Ward S, Green AJ, Yates JRW, Short MP, Haines JH, Jozwiak S, Kwiatkowska J, 110
110 Henske EP, Kwiatkowski DJ Identification of the tuberous sclerosis gene TSC1 on chromosome 9q34. Science 277: van Slegtenhorst M, Nellist M, Nagelkerken B, Cheadle J, Snell R, van den Ouweland A, Reuser A, Sampson J, Halley D, van der Sluijs P Interaction between hamartin and tuberin, the TSC1 and TSC2 gene products. Hum Mol Genet 7: Wilson PJ, Ramesh V, Kristiansen A, Bove C, Jozwiak S, Kwiatkowski DJ, Short MP, Haines JL Novel mutations detected in the TSC2 gene from both sporadic and familial TSC patients. Hum Mol Genet 5:
111 Figures Figure 1. Pedigrees of the families with the TSC2 c.3598 C-T (p.r1200w) mutation. Clear symbols indicate no signs or symptoms of TSC; 1/4-filled symbols indicate possible TSC; half-filled symbols indicate probable TSC; filled symbols indicate definite TSC. Individuals reported as having TSC, but without clinical data are shown in grey. Individuals with epilepsy (E) are indicated. Genotypes are indicated for the individuals for whom DNA testing was performed. + indicates the presence of the TSC2 c.3598 C-T (p.r1200w) allele. (A) Family 1488; (B) Family 15396; (C) Family 28874; (D) Family 29614; (E) Family
112 A 8 II c / / D E 113
113 Figure 2. The TSC2 R1200W variant interacts with TSC1 and is phosphorylated by AKT. (A) Interaction between TSC1 and the TSC2 R1200W variant. TSC1-TSC2 complexes were immunoprecipitated with a TSC1-specific antibody from cells overexpressing wildtype TSC2 (TSC2), the R611Q or R1200W variants, or TSC1 only (control). (B) Effect of wortmannin treatment on TSC2-T1439 phosphorylation (T1439) in cells expressing wild-type (TSC2 ) or the R611Q or R1200W variants. 114
114 Figure 3. The TSC2 R1200W variant is unable to inhibit S6-S235/236 phosphorylation in Tsc2 -/- MEFs. S6-S235/236 phosphorylation in Tsc2 -/- MEFs expressing wild-type TSC2 (TSC2), the R611Q or R1200W variants was estimated by immunofluorescent microscopy. (A) Expression of wild-type TSC2, or the TSC2 variants. Arrows indicate the transfected cells. (B) S6-S235/236 phosphorylation in the cells shown in (A). Arrows indicate the transfected cells expressing the TSC2 variants, as shown in (A). (C) S6-S235/236 phosphorylation in cells expressing wild-type TSC2 (TSC2), the R611Q or R1200W variants was assessed independently by 3 observers in 2 separate experiments. Cells showing clear inhibition of S6-S235/236 phosphorylation were counted. 115

115 R1200W,~ -.,~1 c /236 phosphorylated 56 (%cells) TSC2 R611Q R1200W 116
116 Figure 4. The TSC2 R1200W variant is unable to inhibit S6K-T389 phosphorylation. S6K-T389 phosphorylation in cells expressing wild-type TSC2 (TSC2), the R611Q or R1200W variants, or no TSC2 (TSC1/S6K) was estimated by immunoblotting in 4 separate experiments. The signals on the blots were quantified, relative to the wild-type (TSC2 ; = 1). (A) Immunoblot; (B) TSC2 signal; (C) TSC1 signal; (D) T389/S6K ratio; (E) Total S6K signal. (F) Triton X100 solubility of the TSC2-R1200W variant. Triton X100-soluble and - insoluble cell lysate fractions were analysed by immunoblotting. 117
117 A - TSC2 - ~ TSC1 - S6K -- T389 B 1. rei. TSC2 signal 2 D rei. T389/S6K ratio TSC2 R611Q R1200W TSC1/S6K c rei. TSC1 signal 1.4 E rei. S6K signal TSC2 R611Q R1200W TSC1/S6K TSC2 R611Q R1200W TSC1/S6K F TSC1 TSC2 Triton X100 soluble Triton X1 00 insoluble 118
118 Tables Table 1. Summary of the clinical diagnoses according to the diagnostic criteria of Roach et al. [Roach et al., 1998] in the TSC2 c.3598c>t (p.r1200w) mutation carriers. clinical data 16 no clinical data 4 possible TSC 10/16 (63%) probable TSC 2/16 (13%) definite TSC 4/16 (25%) 119
119 Table 2. Overview of the clinical findings in the mutation carriers. Key: MR, mental retardation; BD, behavioural disturbance; + indicates the presence of a single major or minor diagnostic criteria; ++ indicates the presence of multiple major or minor diagnostic criteria; - indicates the absence of any signs of TSC. Individual MR/BD Seizures? Diagnosis Skin Kidney Heart Mouth Eyes Brain imaging 1488 II.1 probable ++ TSC 1488 III.3 BD yes possible TSC 1488 III.4 - no probable TSC II.2 possible TSC III.2 BD yes definite TSC
120 28874 I.1 - no possible TSC II.1 - no possible TSC II.2 - no possible + - TSC II.8 possible + TSC II.2 yes possible + TSC II.3 possible + TSC III.4 - yes definite TSC IV.2 BD yes definite TSC IV.3 BD yes definite TSC
121 22931 II.2 MR yes definite TSC yes probable TSC 122
122 Table 3. Comparison of the clinical findings in the TSC2 c.3598c>t (p.r1200w) mutation carriers to TSC patients with a TSC2 mutation described by Sancak et al. [Sancak et al., 2005]. Key: HMM, hypomelanotic macule; SP, shagreen patch; FA, facial angiofibroma; AML, renal angiomyolipoma. P indicates the number of individuals positive for the clinical feature and N the total number of patients examined. Symptoms TSC2 c.3598c>t (p.r1200w) mutation carriers P/N (%) Total cohort [Sancak et al., 2005] % HMM 16/16 (100%) 92% SP 5/16 (31%) 49% FA 3/16 (19%) 82% CNS lesions 7/10 (62%) 89% AML 0/10 (0%) 50% rhabdomyoma 2/7 (29%) 42% dental pits 1/5 (20%) 50% eyes (retinal phakoma) 0/6 (0%) 37% mental retardation 2/10 (20%) 83% epilepsy 8/13 (62%) 91% 1
123 Appendix 4: Publications 2
124 BMC Medical Genetics BioMed Central Research article Functional characterisation of the TSC1 TSC2 complex to assess multiple TSC2 variants identified in single families affected by tuberous sclerosis complex Mark Nellist* 1, Özgür Sancak 1, Miriam Goedbloed 1, Alwin Adriaans 1, Marja Wessels 1, Anneke Maat-Kievit 1, Marieke Baars 2, Charlotte Dommering 2, Ans van den Ouweland 1 and Dicky Halley 1 Open Access Address: 1 Department of Clinical Genetics, Erasmus Medical Centre, Rotterdam, The Netherlands and 2 Department of Clinical and Human Genetics, Free University Medical Centre, Amsterdam, The Netherlands Mark Nellist* - m.nellist@erasmusmc.nl; Özgür Sancak - Ozgur.Sancak@dsm.com; Miriam Goedbloed - m.goedbloed@erasmusmc.nl; Alwin Adriaans - a.adriaans@erasmusmc.nl; Marja Wessels - m.w.wessels@erasmusmc.nl; Anneke Maat-Kievit - j.a.maat@erasmusmc.nl; Marieke Baars - m.j.baars@amc.uva.nl; Charlotte Dommering - cj.dommering@vumc.nl; Ans van den Ouweland - a.vandenouweland@erasmusmc.nl; Dicky Halley - d.halley@erasmusmc.nl * Corresponding author Published: 26 February 2008 BMC Medical Genetics 2008, 9:10 doi: / This article is available from: Received: 9 October 2007 Accepted: 26 February Nellist et al; licensee BioMed Central Ltd. This is an Open Access article distributed under the terms of the Creative Commons Attribution License ( which permits unrestricted use, distribution, and reproduction in any medium, provided the original work is properly cited. Abstract Background: Tuberous sclerosis complex (TSC) is an autosomal dominant disorder characterised by seizures, mental retardation and the development of hamartomas in a variety of organs and tissues. The disease is caused by mutations in either the TSC1 gene on chromosome 9q34, or the TSC2 gene on chromosome 16p13.3. The TSC1 and TSC2 gene products, TSC1 and TSC2, interact to form a protein complex that inhibits signal transduction to the downstream effectors of the mammalian target of rapamycin (mtor). Methods: We have used a combination of different assays to characterise the effects of a number of TSC2 amino acid substitutions on TSC1 TSC2 complex formation and mtor signalling. Results: We used these assays to compare the effects of 9 different TSC2 variants (S132C, F143L, A196T, C244R, Y598H, I820del, T993M, L1511H and R1772C) identified in individuals with symptoms of TSC from 4 different families. In each case we were able to identify the mutation. Conclusion: Functional characterisation of TSC2 variants can help identify changes in individuals with TSC, and assist in the diagnosis and genetic counselling of the index cases and/or other family members. Background Tuberous sclerosis complex (TSC) is an autosomal dominant disorder characterised by seizures, mental retardation and the development of hamartomas in a variety of organs and tissues [1]. The disease is caused by mutations in either the TSC1 gene on chromosome 9q34 [2], or the Page 1 of 12 (page number not for citation purposes)
125 BMC Medical Genetics 2008, 9:10 TSC2 gene on chromosome 16p13.3 [3]. Loss of heterozygosity studies at the TSC1 and TSC2 loci in TSC-associated lesions indicate that TSC1 and TSC2 are tumour suppressor genes [1]. Comprehensive screens for mutations at both the TSC1 and TSC2 loci have been performed in several large cohorts of TSC patients and a wide variety of different mutations have been described [4-10]. In most studies approximately 20% of the identified mutations are either missense changes or small, non-truncating insertions/deletions, predominantly in the TSC2 gene. The phenotypic expression of TSC is highly variable and in some cases it can be difficult to establish a definitive clinical diagnosis. Generally the diagnosis is made based on multiple clinical criteria that are categorized into major and minor features [11]. The presence of 2 major features, or one major and 2 minor features, is sufficient for a definite diagnosis. In recent years, mutation analysis has become an additional diagnostic tool in familial as well as sporadic TSC. However, it is sometimes difficult to establish whether an identified nucleotide change, particularly a missense change, is a genuine mutation, or a (rare) polymorphism. In familial cases where a missense change cosegregates with TSC, or in cases where key relatives are not available for testing, a distinction cannot be made on genetic grounds alone. Furthermore, many tools for the analysis of amino acid substitutions [12-14], may not predict the effect of a particular substitution reliably. The TSC1 and TSC2 gene products, TSC1 and TSC2, interact to form a protein complex which acts as a GTPase activating protein (GAP) for the rheb GTPase, preventing the rheb-gtp-dependent stimulation of cell growth through the mammalian target of rapamycin (mtor) [15]. In cells lacking either TSC1 or TSC2, the downstream targets of mtor, p70 S6 kinase (S6K) and ribosomal protein S6, are constitutively phosphorylated [16,17]. The identification of the role of the TSC1 TSC2 complex in regulating signal transduction through mtor has made it possible to assess the activity of different TSC1 and TSC2 variants. The effects of amino acid changes on TSC1 TSC2 complex formation, on the activation of rheb GTPase activity by the complex, and on the phosphorylation status of S6K and S6, the downstream effectors of mtor, can be determined [18,19]. Here, we apply assays of TSC1 TSC2 function to assist in the identification, diagnosis and counselling of 4 families with TSC. In each index case at least 2 changes in the TSC2 gene were detected. To identify the disease-causing mutation in each family we characterised the effects of the changes on the activity of the TSC1 TSC2 complex. In each case we were able to identify the TSC2 variant. Our analysis demonstrates that biochemical assays can help resolve otherwise intractable problems in clinical genetic diagnostics. Methods Mutation analysis DNA was extracted from peripheral blood using standard techniques. Mutation analysis was performed using a combination of single-strand conformational polymorphism analysis, denaturing gradient gel electrophoresis, direct sequencing, Southern blotting and fluorescence in situ hybridisation, as previously described [8]. In addition, the multiplex ligation-dependent probe amplification assay was performed (MRC Holland, The Netherlands). TSC2 sequence changes were numbered according to the original cloning paper [3]. To investigate whether the changes had an effect on RNA splicing, 3 different splice-site prediction programs [12-14]. were used. Amino acid substitutions were evaluated using the PAM 250 [15], BLOSUM 62 [16] and Grantham [17] matrices and SCANSITE [23]. Generation of constructs and antisera Expression constructs encoding the identified variants were derived using the Stratagene QuikChange sitedirected mutagenesis kit and in each case verified by sequencing the complete open reading frame. All the other constructs used in this study have been described previously [21,24,25]. Polyclonal rabbit antisera specific for human TSC1 and TSC2 have been described previously [25]. Other antibodies were purchased from Cell Signaling Technology. Transfections, immunocytochemistry, immunoblotting, immunoprecipitation assays and the in vitro assay of rheb GTPase activity were performed as described previously [21]. Results Patient characteristics Family 1 (Figure 1A) The index case (II:2) died shortly after birth due to a solitary rhabdomyoma in the right ventricle of the heart. Post-mortem examination did not reveal any other findings indicative of TSC. Both parents underwent a full clinical evaluation. Dermatological, cardiological, ophthalmological, neurological and radiological examinations were negative for signs of TSC except for one nail groove and one hypomelanotic macule in individual I:1. The sibling of the index case (II:1) was healthy, but was not investigated further. At the first trimester of the third pregnancy, mutation analysis of the index case had not been completed and prenatal DNA testing could not be offered. Fetal echocardiography did not reveal any heart Page 2 of 12 (page number not for citation purposes)
126 BMC Medical Genetics 2008, 9:10 A. Family 1.l'f R1772C del + - B. Family 2 T993M - L1511 H - L 1511H - T993M + - L 1511H L 1511H + C. Family 3 D. Family 4 1:1 S132C + F143L + C244R A196T + - Y598H + - S132C + - F143L + - C244R + - Pedigrees Figure 1 of the investigated families Pedigrees of the investigated families. (A) Family 1, (B) Family 2, (C) Family 3 and (D) Family 4. Arrows indicate the index cases. Clear symbols indicate no signs or symptoms of TSC; 1/4-filled symbols indicate one minor feature of TSC; 1/2-filled symbols indicate possible TSC; 3/4-filled symbols indicate probable TSC, filled symbols indicate definite TSC, and individuals with epilepsy only are indicated. A question mark indicates individuals where no clinical data was available. Genotypes are shown for the individuals where DNA was available for testing. Page 3 of 12 (page number not for citation purposes)
127 BMC Medical Genetics 2008, 9:10 defects and the pregnancy resulted in the birth of a healthy child (II:3). Family 2 (Figure 1B) The index case (III:4) had multiple hypomelanotic macules and dental pits, epilepsy and electroencephalographic abnormalities, and was diagnosed with 'probable TSC'. One of the parents of the index case (II:10) had multiple dental pits and a computer tomography scan revealed 2 small calcifications in the nucleus caudatus which were not typical for TSC. Magnetic resonance imaging was performed and showed no additional abnormalities. Individual II:9, the other parent of the index case, had a single 2 centimetre cyst in the left kidney and a single ash leaf-shaped area of hypopigmentation, insufficient for a diagnosis of TSC. Individual II:11, the sibling of II:10, had neurological and ophthalmological problems and died at the age of 13 due to status epilepticus. Individual III:1, the half-sibling of the index case and the child of individual II:9, had a history of possible epilepsy at the age of 3 years and was again diagnosed with epilepsy at 12 years of age. A subsequent full diagnostic work-up identified cortical tubers and 7 hypomelanotic macules, fulfilling the diagnostic criteria for definite TSC. Individual II:8 had multiple dental pits and 10 irregular hypopigmentations, atypical for TSC. Family 3 (Figure 1C) The index case (II:1) was diagnosed with definite TSC. One parent (I:2) did not show any clinical signs of TSC, and there was no information on the other parent (I:1). Family 4 (Figure 1D) The index case (II:1) was diagnosed with definite TSC. Individual I:1, the parent of the index case, had angiomyolipoma but no other reported signs of TSC, and individual II:2, the sibling of the index case had epilepsy, but no other signs of TSC. Mutation analysis Family 1 The index case (II:2) was heterozygous for 2 changes in the TSC2 gene: TSC2 2476delATC (deletion of isoleucine at codon 820, I820del) and TSC2 5332C>T (arginine to cysteine substitution at codon 1772, R1772C). Analysis of the parents indicated that the index case had inherited one change from each parent. No DNA was available from other relatives. Family 2 The index case (III:4) was heterozygous for 2 missense changes: TSC2 2996C>T (threonine to methionine substitution at codon 993, T993M) and TSC2 4550T>A (leucine to histidine amino acid substitution at position 1511, L1511H). Analysis of additional family members (individuals I:3, I:4, II:9, II:10 and III:3) confirmed that one substitution was paternal in origin and the other maternal. Family 3 The index case (II:1) was heterozygous for 2 missense changes: TSC2 604G>A (alanine to threonine substitution at codon 196, A196T) and TSC2 1810T>C (tyrosine to histidine substitution at codon 598, Y598H). Neither substitution was detected in parent I:2, and DNA from parent I:1 was not available for testing. Family 4 The index case (II:1) was heterozygous for 3 missense changes in the TSC2 gene: TSC2 413C>G (serine to cysteine substitution at codon 132, S132C), TSC2 447C>G (phenylalanine to leucine substitution at codon 143, F143L) and TSC2 748T>C (cysteine to arginine substitution at codon 244, C244R). The S132C and F143L substitutions were inherited from parent I:1. No DNA was available from the other parent. Comparison of the allele ratios of the index cases and parents did not reveal any evidence for somatic mosaicism in the leukocyte DNA from any of the families studied. None of the changes showed an effect on splicing according to the 3 splice-site prediction programs used. As shown in Table 1, the identified amino acid changes were compared using the PAM 250 [15], BLOSUM 62 [16] and Grantham matrices [17]. In addition, the degree of conservation of the amino acid residues in different metazoan species was compared, as shown in Table 2. Functional analysis Families 1 and 2 The genetic data from families 1 and 2 indicated that in both families the index case had inherited a different, rare TSC2 variant from each parent. To determine whether the I820del, R1772C, T993M and L1511H variants corresponded to mutations, the biochemical activity of each variant was compared to wild-type TSC2 and a known, TSC2 missense variant (R611Q) using a variety of functional assays. To investigate the ability of the TSC2 I820del, R1772C, T993M and L1511H variants to interact with TSC1, coimmunoprecipitation experiments were performed using antibodies specific for TSC1. As shown in Figures 2A and 2B, coimmunoprecipitation of the TSC2 I820del variant was reduced compared to wild-type TSC2, but was not prevented completely (compare the I820del variant to the R611Q variant). The R1772C, T993M and L1511H amino Page 4 of 12 (page number not for citation purposes)
128 BMC Medical Genetics 2008, 9:10 Table 1: Scores of the BLOSUM 62, PAM 250 and Grantham matrices. BLOSUM 62 scores range between -4 and 11, PAM 250 scores between -8 and 17, and Grantham scores between 5 and 215. For the BLOSUM 62 and PAM 250 matrices, a more negative score corresponds to a less conservative amino acid change. For the Grantham matrix, a higher number reflects a less conservative change. Amino Acid Substitution Family BLOSUM 62 PAM 250 Grantham TSC2 R1772C TSC2 T993M TSC2 L1511H TSC2 A196T TSC2 Y598H TSC2 S132C TSC2 F143L TSC2 C244R acid substitutions did not reduce TSC1 TSC2 coimmunoprecipitation. Next, the activation of rheb GTPase activity by the immunoprecipitated variant TSC1 TSC2 complexes was assayed. As shown in Figure 2C, in the presence of the wild-type TSC1 TSC2 complex the ratio of rheb-bound GDP to GTP was 3-fold higher than in the presence of TSC1 alone (control GDP/GTP = 0.4; wild-type GDP/GTP Table 2: Evolutionary conservation of the variant TSC2 amino acids. Inter-species conservation of the TSC2 S132, F143, A196, C244, Y598 I820, T993, L1511 and R1772 amino acids is shown. Family 1 I820 R1772 human PDIIIKALP GQRKRLISS mouse PDIIIKALP GQRKRLISS rat PDIIIKALP GQRKRLISS pufferfish PDIMIKLLP GQRKRLVST fruitfly PEALMRKLP no homology Family 2 T993 L1511 human SRIQTSLTS SVQLLDQIP mouse SRIQTSLTS SVQLLDQIP rat SRIQTSLTS SVQLLDQIP pufferfish RRMHTSTTT AVKVLDQMP fruitfly no homology AVSLIDLVP Family 3 A196 Y598 human DEYIARM V IQLHYKHSY mouse DEYIASM V IQLHYKHGY rat DEYIAPM V IQLHYKHGY pufferfish DQNVASM V LQLHYKNKY fruitfly DKDILVGIV LELHYERPK Family 4 S132 F143 C244 human KDYPS NED RLEVFKALT IVTLCRTIN mouse KDYPS NED RLEVFKALT IITLCRTIN rat KDYPS NED RLEVFKALT IITLCRTVN pufferfish RDYQPCNED RLEVFKALT IITLCRTVN fruitfly IQNHEARED LLELLDTLT ITTLCRTVN = 1.4). Coimmunoprecipitation of the TSC2 I820del variant was reduced compared to wild-type TSC2, and consequently the activation of rheb GTPase activity was also reduced (wild-type GDP/GTP = 1.4; I820del GDP/GTP = 0.9). The immunoprecipitated R1772C and T993M variant complexes increased the GDP/GTP ratio more than 4-fold above the control value, and were therefore both at least as active as wild-type TSC2 (wild-type GDP/GTP = 1.4; R1772C and T993M GDP/GTP = 1.9). In contrast, although TSC1 TSC2 coimmunoprecipitation was unaffected by the L1511H substitution, the activation of rheb GTPase activity was reduced 3-fold compared to wild-type (wild-type GDP/GTP = 1.4; L1511H GDP/GTP = 0.5). To determine whether the TSC2 I820del, R1772C, T993M and L1511H variants affected mtor activity, the variants were overexpressed together with TSC1 and S6K in human embryonal kidney 293 cells. Phosphorylation of the exogenous S6K linker domain (T389), as detected by immunoblotting, was used as a read-out for mtor activity. As shown in Figure 2E and 2F, S6K T389 phosphorylation was increased in the presence of the TSC2 I820del, L1511H and R611Q variants, compared to wild-type TSC2 and the R1772C and T993M variants. To confirm these findings, TSC1 and the TSC2 variants were overexpressed in Tsc2 -/- mouse embryo fibroblasts (MEFs) [16]. The S235/S236 phosphorylation of S6 in the MEFs expressing the TSC2 variants was determined by doublelabel immunofluorescent microscopy, as described previously [21]. As shown in Figure 2D, expression of the TSC2 R1772C and T993M variants suppressed S6 phosphorylation in more than 90% of the transfected cells, similar to wild-type TSC2. In contrast, less than 20% of the MEFs expressing the TSC2 I820del, L1511H or R611Q variants showed inhibition of S6 phosphorylation. Therefore, in both assays, the TSC2 I820del and L1511H variants were unable to inhibit mtor, indicating that both these variants are, while the TSC2 R1772C and T993M Page 5 of 12 (page number not for citation purposes)
129 BMC Medical Genetics 2008, 9:10 Page 6 of 12 (page number not for citation purposes)
130 BMC Medical Genetics 2008, 9:10 T993M Figure Results and of 2 the L1511H) functional assays on the TSC2 variants identified in family 1 (variants I820del and R1772C) and family 2 (variants Results of the functional assays on the TSC2 variants identified in family 1 (variants I820del and R1772C) and family 2 (variants T993M and L1511H). (A) Interaction between TSC1 and TSC2 variants. TSC1 TSC2 complexes were immunoprecipitated with antibodies specific for exogenous TSC1 from HEK 293 cells over-expressing TSC1 and wild-type TSC2 (wt) or TSC1 and the TSC2 variants. (B) Interaction between TSC1 and TSC2 variants. Ratio of coimmunoprecipitated TSC2:TSC1, as detected by immunoblotting, was estimated by densitometry scanning (Total Scan). (C) In vitro rheb GAP activity of immunoprecipitated TSC1 TSC2 complexes. Rheb-bound GDP/GTP ratios were determined after 90 minutes incubation with the immunoprecipitated wild-type TSC1 TSC2 complex (wt), protein A beads only (control), TSC1 only, or TSC1 TSC2 variant complexes. Rheb-bound GDP/GTP prior to addition of the TSC1 TSC2 complexes is shown (t = 0). (D) Inhibition of S6 phosphorylation in Tsc2 -/- MEFs. Percentage of Tsc2 -/- MEFs transfected with expression constructs encoding TSC1 and wild-type TSC2, or TSC1 and the TSC2 variants, and showing inhibition of S6 phosphorylation. Data from at least 3 separate experiments are shown. (E) TSC2-dependent inhibition of S6K-T389 phosphorylation. S6K, TSC1 and wild-type TSC2 (wt), or S6K, TSC1 and the TSC2 variants, were coexpressed in HEK 293 cells. Phosphorylation of S6K at the T389 position was determined by immunoblotting. A representative example of at least 3 separate experiments is shown. (E) TSC2-dependent inhibition of S6K-T389 phosphorylation. Ratio of total S6K:T389-phosphorylated S6K, as detected by immunoblotting, was estimated by densitometry scanning (Total Scan). Mean ratios relative to TSC2 wild-type (wt) are shown. Page 7 of 12 (page number not for citation purposes)
131 BMC Medical Genetics 2008, 9:10 variants were just as active as wild-type TSC2 and are therefore not amino acid substitutions. Families 3 and 4 In families 3 and 4, the clinical and genetic data was incomplete. Multiple TSC2 variants were identified in the index cases, but it was not clear if they were de novo, or had been inherited from an untested parent. It was also unclear whether the changes were confined to the same allele. Therefore, to investigate the effects of the changes on the ability of the TSC1 TSC2 complex to antagonise mtor signalling, TSC2 variants containing the different combinations of amino acid substitutions were characterised. As shown in Figure 3A and 3B, S6K T389 phosphorylation was inhibited by expression of the TSC2 S132C, F143L and A196T single variants, and by the S132C/F143L double variant. In contrast, expression of the C244R and Y598H single variants did not inhibit S6K phosphorylation, and expression of TSC1 was reduced in the presence of these variants. Consistent with these observations, the S132C/F143L/C244R triple variant and A196T/Y598H double variant were unable to inhibit S6K phosphorylation and TSC1 expression was reduced in the presence of these variants, compared to in the presence of wild-type TSC2. To provide confirmation for these data, doublelabel immunofluorescent microscopy was performed to determine whether S6 phosphorylation was down-regulated in Tsc2 -/- MEFs expressing the different variants. As shown in Figure 3C, expression of the TSC2 C244R, S132C/F143L/C244R, Y598H and A196T/Y598H variants was unable to inhibit S6 phosphorylation in the Tsc2 -/- MEFs. Therefore, in both assays, the Y598H and C244R variants correspond to the mutations in families 3 and 4 respectively. Discussion Mutation analysis of the TSC1 and TSC2 genes in individuals with TSC, and in those suspected of having the disease, facilitates the diagnosis of TSC, and can help genetic counselling. In most cases, analysis of the patient's DNA results in the identification of a mutation. However, in some cases it is impossible to determine from the genetic data alone whether specific, identified changes are or not. This can be a particular problem when a change co-segregates with signs of TSC in a single family. To address such cases, we have performed functional analysis of the predicted protein products of the TSC2 variants identified in 4 families with TSC. In families 1 and 2 the index case did not fulfil the diagnostic criteria for TSC and had inherited 2 non-truncating TSC2 nucleotide changes, one from each parent. It was not possible to determine from the clinical and genetic data alone whether the families were affected by TSC and, if that was the case, which nucleotide change was the disease-causing mutation. In families 3 and 4, in which the index case did fulfil the diagnostic criteria for TSC, it was impossible to determine whether the identified TSC2 variant was because essential genetic and/or clinical data was not available. In all the above cases we analysed the effect of the identified changes on the activity of the TSC1 TSC2 complex in order to establish which of the changes were mutations. Families 1 and 2 The in vitro GTPase activity of rheb was not stimulated in the presence of the TSC2 I820del and L1511H variants, and neither variant was able to inhibit S6K and S6 phosphorylation as effectively as wild-type TSC2, or the R1772C and T993M variants. In addition, the I820del variant formed a complex with TSC1 less efficiently than wild-type TSC2. The I820del and L1511H changes therefore had similar effects to other TSC2 missense mutations, disrupting the function of the TSC1 TSC2 complex in vitro. We classified the I820del and L1511H variants as mutants. The R1772C and T993M substitutions had no effect on TSC1 TSC2 activity in the assays used and were therefore classified as rare polymorphisms. In utero cardiac rhabdomyoma was the only sign of TSC in the index patient of family 1 (individual II:2). Rhabdomyoma is the most common foetal and neonatal cardiac tumour and although it can be associated with several different genetic disorders, TSC is implicated in as many as two-thirds of the cases [26]. Confirmation of the inactivating nature of the TSC2 I820del mutation identified in family 1 meant that a diagnosis of TSC could be assigned to individuals I:1 and II:2 with more certainty. Previously, the very mild presentation of the disease in individal I:1 had made diagnosis difficult. Mutation analysis, complemented by functional assays, was required to establish whether this individual carried a TSC2 mutation, and the identification of a mutation in this individual has implications for the family in regard to decisions about having additional children and to the risk of other relatives of the parent. Somatic mosaicism in individual I:1 could not be rigorously excluded, since only leukocyte DNA was available for analysis. Therefore, the recurrence risk for this couple is up to 50%. Analysis of the TSC2 I820del mutant indicated that the isoleucine residue helps to stabilise TSC1 TSC2 binding. However, since some TSC1 TSC2 binding was detected, and some rheb GAP activity could also be measured, it is possible that the TSC2 I820del variant retains some activ- Page 8 of 12 (page number not for citation purposes)
132 BMC Medical Genetics 2008, 9:10 S132C, Figure Results F143L of 3 the functional and C244R) assays on the TSC2 variants identified in family 3 (variants A196T and Y598H) and family 4 (variants Results of the functional assays on the TSC2 variants identified in family 3 (variants A196T and Y598H) and family 4 (variants S132C, F143L and C244R). (A) TSC2-dependent inhibition of S6K-T389 phosphorylation. S6K, TSC1 and wild-type TSC2 (wt), or S6K, TSC1 and the TSC2 variants, were overexpressed in HEK 293 cells. Phosphorylation of S6K at the T389 position was determined by immunoblotting. A representative example of at least 3 separate experiments is shown. (B) TSC2-dependent inhibition of S6K-T389 phosphorylation. Ratio of total S6K:T389-phosphorylated S6K, as detected by immunoblotting, was estimated by densitometry scanning (Total Scan). Mean ratios relative to TSC2 wild-type (wt) are shown.(c) Inhibition of S6 phosphorylation in Tsc2 -/- MEFs. Percentage of Tsc2 -/- MEFs transfected with expression constructs encoding TSC1 and wildtype TSC2, or TSC1 and the TSC2 variants, and showing inhibition of S6 phosphorylation. Data from at least 3 separate experiments are shown. Page 9 of 12 (page number not for citation purposes)
133 BMC Medical Genetics 2008, 9:10 ity in vivo. This provides a possible explanation for the mild symptoms in individual I:1. The second variant identified in family 1, TSC2 R1772C, did not have a deleterious effect on the activity of the TSC1 TSC2 complex. This was somewhat surprising as the R1772 residue is part of the consensus extracellular signal-regulated kinase (ERK) phosphorylation site that has been shown to be involved in regulating the activity of the complex [27,28]. Indeed, SCANSITE [23] indicated that the R1772C substitution destroys the putative ERK phosphorylation site. Furthermore, both the BLOSUM 62 and PAM 250 matrices indicated that the R1772C substitution is likely to have a deleterious effect on TSC2 structure. One possibility is that under certain conditions, the R1772C substitution may have a modifying effect on the TSC1 TSC2 complex, enhancing TSC1 TSC2 activity by preventing the Erkdependent down-regulation of the complex [28]. This may explain the increased rheb GTPase activity measured in the presence of the TSC2 R1772C variant, compared to wild-type TSC2 (wild-type TSC2 GDP/GTP ratio = 1.4; R1772C GDP/GTP ratio = 1.9; Figure 2B). Both the 2476delATC (I820del) and 5332C>T (R1772C) variants have been identified in TSC patients by other researchers [29-31]. Strizheva et al. [30] suggested that the R1772C substitution could be a change while Langkau et al. [31] concluded that it was a polymorphism. The status of the I820del change was not certain [29]. Our analysis is consistent with the findings of Langkau et al. and, in addition, indicates that the TSC2 I820del variant is. Furthermore, this example demonstrates that predictions about the ity of missense changes based on the results of the BLOSUM 62, PAM 250 and Grantham matrices are not always reliable. In family 2, mutation analysis resulted in the identification of 2 novel TSC2 missense changes, 2996C>T (T993M) and 4550T>A (L1511H), in the index case (individual III:4). Individual III:1, the half-sibling of the index case was later diagnosed with TSC on the basis of the accepted clinical criteria and was found to carry the TSC2 4550T>A (L1511H) substitution only. No other nucleotide changes were identified in the TSC1 or TSC2 genes in either individual. The identification of the TSC2 L1511H change in individual III:1 excluded the T993M change as the common cause of TSC in this family. However, it did not confirm the ity of the TSC2 L1511H change. The presence of multiple dental pits in both individual II:8 and individual II:10 suggested that the signs of TSC in individuals III:1 and III:4 could be caused by two different mutations, inherited from individuals II:8 and II:12 respectively. However, the functional tests confirmed the nature of the TSC2 L1511H substitution, indicating that this was the diseasecausing mutation in both cases. The substitution of a basic histidine residue for a nonpolar leucine residue at position 1511 did not affect the TSC1 TSC2 interaction, but did abrogate the rheb GAP activity of the TSC1 TSC2 complex. Although L1511 is outside the predicted TSC2 GAP domain [3], it is clearly necessary for activity. The substitution of a polar threonine for nonpolar methione at position 993 had no deleterious effect on the TSC1 TSC2 interaction or on the activity of the complex. The T993M substitution occurs at a possible site of protein kinase B (PKB)-dependent phosphorylation [27], and may therefore inhibit PKB-mediated inactivation of the TSC1 TSC2 complex. This may explain why the TSC2 T993M variant, like the R1772C variant, had a higher in vitro rheb GAP activity than wild-type TSC2 (wild-type TSC2 GDP/GTP ratio = 1.4; T993M GDP/GTP ratio = 1.9; Figure 2B). The T993M polymorphism may therefore also act as a positive modifier of TSC1 TSC2 activity. In family 3, 2 missense changes (TSC2 604G>A (A196T) and TSC2 1810T>C (Y598H)) were identified in the index case (individual II:1). Since there was no genetic or clinical data on one of the parents, it was not possible to determine whether either of the changes was responsible for TSC in this individual. Both variants had been identified previously in other TSC patients [29], however in these patients it was also not clear whether the changes were. Functional analysis indicated that the TSC2 Y598H substitution reduced TSC1 TSC2 binding and the TSC1 TSC2 dependent inhibition of mtor activity. In contrast, the A196T substitution did not affect TSC2 activity. Therefore, the Y598H substitution was responsible for TSC in individual II:1, as well as in other TSC patients [29], and the A196T substitution is a rare polymorphism. In family 4, 3 missense changes were identified in the TSC2 gene. The 413C>G (S132C) and 447C>G (F143L) substitutions were inherited from a parent with symptoms suggesting TSC. The third substitution, 748T>C (C244R), was either a de novo mutation, or was inherited from the other parent, on whom there was no clinical or genetic data. None of these changes have been described previously [29]. One possibility in this family was that the combination of missense changes was responsible for the TSC phenotype. Therefore we tested all the individual TSC2 single amino acid variants (S132C, F143L and C244R) as well as the TSC2 S132C/F143L double variant and TSC2 S132C/F143L/C244R triple amino acid variant. Neither the S132C nor the F143L changes had a significant effect on TSC1 TSC2 function. In some assays the F143L variant appeared less active than wild-type TSC2, but still had the ability to significantly inhibit mtor activity. In contrast, the C244R amino acid substitution reduced TSC1 TSC2 binding and was unable to inhibit mtor activity, either alone or in combination with the S132C and F143L variants. We concluded that the C244R Page 10 of 12 (page number not for citation purposes)
134 BMC Medical Genetics 2008, 9:10 substitution was the mutation in the index case. Individual I:1 tested negative for the TSC2 748T>C (C244R) substitution, but was diagnosed with angiomyolipomas. Although insufficient for a definite diagnosis of TSC, the incidence of angiomyolipomas is high in the TSC patient population. One possibility is that this individual is a mosaic for the TSC2 748T>C (C244R) susbstitution, and that the angiomyolipoma originates from these mosaic cells. An alternative explanation is that the TSC2 447C>G (F143L) substitution does have an effect on TSC2 function, sufficient to allow the formation of angiolipoma. The F143L amino acid substitution may therefore be a negative modifier of TSC1 TSC2 activity, in contrast to the R1772C and T993M substitutions identified in families 1 and 2, that, in some assays, appeared to increase TSC1 TSC2 activity. Although there was no evidence in family 1 or family 2 for the non- TSC2 variant acting in trans to neutralise the variant, it will be interesting to determine whether there are 'hyperactive' TSC1 and TSC2 variants that can (partially) compensate for the presence of TSC1 and TSC2 variants. Improving the sensitivity and reliability of the assays of TSC1 TSC2 activity will allow us to more accurately define the activity of different TSC1 and TSC2 variants. We did not investigate the other putative functions of TSC2 since, in each family, we were able to differentiate between the TSC2 variants on the basis of their inhibition of mtor signalling. However, it may also be informative to investigate the effects of and non- amino acid substitutions on the other proposed functions of TSC2, such as the regulation of p27 [32]. Care must always be taken in the interpretation of nucleotide or amino acid changes identified during molecular genetic investigations. As the examples described here demonstrate, both the affection status of individuals in a family and the nature of the nucleotide changes identified in those individuals are not always clear. To distinguish between mutations and harmless polymorphisms, we have analysed the effects of different amino acid changes on the activity of the TSC1 TSC2 complex. In each case we have been able to distinguish TSC2 variants from rare polymorphic variants, and thereby identify the mutation in each family. We have shown that functional assays can be a useful tool to complement traditional DNA-based mutation analysis in TSC. Identification of the mutations in the TSC families described here enabled not only genetic counselling and prenatal testing for future pregnancies but also improved the diagnosis of affected family members to facilitate their critical clinical care. The use of functional assays to differentiate between polymorphisms and mutations, in TSC and other diseases, will facilitate not only the identification of mutations but will also help establish how different amino acid residues contribute to protein function. Conclusion Deletion of isoleucine at amino acid residue 820 of TSC2 and the TSC2 L1511H, C244R and Y598H amino acid substitutions are sufficient to cause TSC. The TSC2 R1772C, T993M, S132C, F143L and A196T substitutions are rare polymorphisms that do not inhibit TSC1 TSC2 function, and do not cause TSC. Abbreviations DNA, deoxyribonucleic acid; ERK, extracellular regulated kinase; GAP, GTPase activating protein; GDP, guanosine diphosphate; GTP, guanosine triphosphate; HEK 293, human embryonal kidney cells; MEFs, mouse embryo fibroblasts; mtor, mammalian target of rapamycin; PKB, protein kinase B; rheb, ras homolog expressed in brain; RNA, ribonucleic acid; S6K, p70 S6 kinase; TSC, tuberous sclerosis complex. Competing interests The author(s) declare that they have no competing interests. Authors' contributions MN, OS, MG and AA performed the practical work; MW, AM-K, MB and CD co-ordinated the clinical investigations of the patients; AvdO and DH led the research. The manuscript was drafted by OS, MN, AvdO and DH, and read and approved by all authors. Acknowledgements Financial support was provided by the U.S. Department of Defense Congressionally-Directed Medical Research Program (grant #TS060052), the Nederlandse Organisatie voor Wetenschappelijk Onderzoek (NWO), the Nationaal Epilepsie Fonds, the Michellestichting and the Department of Clinical Genetics (Erasmus MC). Dr. H. Onda (Brigham and Women's Hospital, USA) is thanked for supplying the Tsc1 -/- and Tsc2 -/- MEFs. Dr. M. van Slegtenhorst (Fox Chase Cancer Center, USA) and Dr. T. Nobukini (Friedrich Miescher Institute, Switzerland) are thanked for supplying rheb and S6K expression constructs respectively. We thank the family members who contributed to this study. References 1. Gomez M, Sampson J, Whittemore V, eds: The tuberous sclerosis complex Oxford, UK: Oxford University Press; van Slegtenhorst M, de Hoogt R, Hermans C: Identification of the tuberous sclerosis gene TSC1 on chromosome 9q34. Science 1997, 277(5327): The European Chromosome 16 Tuberous Sclerosis Consortium: Identification and characterization of the tuberous sclerosis gene on chromosome 16. Cell 1993, 75(7): Jones AC, Shyamsundar MM, Thomas MW: Comprehensive mutation analysis of TSC1 and TSC2, and phenotypic correlations in 150 families with tuberous sclerosis. Am J Hum Genet 1999, 64(5): van Slegtenhorst M, Verhoef S, Tempelaars A: Mutational spectrum of the TSC1 gene in a cohort of 225 tuberous sclerosis complex patients: no evidence for genotype-phenotype correlation. J Med Genet 1999, 36(4): Page 11 of 12 (page number not for citation purposes)
135 BMC Medical Genetics 2008, 9: Au KS, Rodriguez JA, Finch JL: Germ-line mutational analysis of the TSC2 gene in 90 tuberous sclerosis patients. Am J Hum Genet 1998, 62(2): Dabora SL, Jozwiak S, Franz DN: Mutational analysis in a cohort of 224 tuberous sclerosis patients indicates increased severity of TSC2, compared with TSC1, disease in multiple organs. Am J Hum Genet 2001, 68(1): Sancak O, Nellist M, Goedbloed M: Mutational analysis of the TSC1 and TSC2 genes in a diagnostic setting: genotype-phenotype correlations and comparison of diagnostic DNA techniques in tuberous sclerosis complex. Eur J Hum Genet 2005, 13(6): Niida Y, Lawrence-Smith N, Banwell A: Analysis of both TSC1 and TSC2 for germline mutations in 126 unrelated patients with tuberous sclerosis. Hum Mutat 1999, 14(5): Au K-S, Williams AT, Roach ES: Genotype/phenotype correlation in 325 individuals referred for a diagnosis of tuberous sclerosis complex in the United States. Genet Med 2007, 9(2): Roach ES, DiMario FJ, Kandt RS: Tuberous sclerosis consensus conference: recommendations for diagnostic evaluation. National Tuberous Sclerosis Association. J Child Neurol 1999, 14(6): NetGene2 Server [ 13. SpliceSiteFinder [ finder.html] 14. BDGP: Splice Site Prediction by Neural Network [ Dayhoff MO, Schwartz RM, Orcutt BC: A model of evolutionary change in proteins. "Atlas of Protein Sequence and Structure" 1978, 5(3): Henikoff S, Henikoff J: Amino acid substitution matrices from protein blocks. Proc Natl Acad Sci USA 1992, 89: Grantham R: Amino acid difference formula to help explain protein evolution. Science 1974, 185(4154): Li Y, Corradetti MN, Inoki K: TSC2: filling the GAP in the mtor signaling pathway. Trends Biochem Sci 2004, 29: Zhang H, Cicchetti G, Onda H: Loss of Tsc1/Tsc2 activates mtor and disrupts PI3K-Akt signaling through downregulation of PDGFR. J Clin Invest 2003, 112: Kwiatkowski DJ, Zhang H, Bandura JL: A mouse model of TSC1 reveals sex-dependent lethality from liver hemangiomas, and up-regulation of p70s6 kinase activity in Tsc1 null cells. Hum Mol Genet 2002, 11(5): Nellist M, Sancak O, Goedbloed MA: Distinct effects of single amino acid changes to tuberin on the function of the tuberinhamartin complex. Eur J Hum Genet 2005, 13(1): Inoki K, Li Y, Zu T: TSC2 is phosphorylated and inhibited by Akt and suppresses mtor signalling. Nat Cell Biol 2002, 4(9): Obenauer JC, Cantley LC, Yaffe MB: Scansite 2.0: Proteome-wide prediction of cell signaling interactions using short sequence motifs. Nucleic Acids Res 2003, 31(13): Nellist M, Verhaaf B, Goedbloed MA: TSC2 missense mutations inhibit tuberin phosphorylation and prevent formation of the tuberin-hamartin complex. Hum Mol Genet 2001, 10(25): van Slegtenhorst M, Nellist M, Nagelkerken B: Interaction between hamartin and tuberin, the TSC1 and TSC2 gene products. Hum Mol Genet 1998, 7(6): Isaacs H Jr: Fetal and neonatal cardiac tumors. Pediatr Cardiol 2004, 25(3): Ballif B, Roux PP, Gerber SA: Quantitative phosphorylation profiling of the ERK/p90 ribosomal S6 kinase-signaling cassette and its targets, the tuberous sclerosis tumor suppressors. PNAS 2005, 102(3): Ma L, Chen Z, Erdjument-Bromage H, Tempst P, Pandolfi PP: Phosphorylation and functional inactivation of TSC2 by Erk implications for tuberous sclerosis and cancer pathogenesis. Cell 2005, 121(2): Tuberous sclerosis database Leiden Open Variation Database [ 30. Strizheva GD, Carsillo T, Kruger WD: The spectrum of mutations in TSC1 and TSC2 in women with tuberous sclerosis and lymphangiomyomatosis. Am J Respir Crit Care Med 2001, 163(1): Langkau N, Martin N, Brandt R: TSC1 and TSC2 mutations in tuberous sclerosis, the associated phenotypes and a model to explain observed TSC1/TSC2 frequency ratios. Eur J Pediatr 2002, 161(7): Rosner M, Freilinger A, Hanneder M: p27kip1 localization depends on the tumor suppressor protein tuberin. Hum Mol Genet 2007, 16(13): Pre-publication history The pre-publication history for this paper can be accessed here: Publish with BioMed Central and every scientist can read your work free of charge "BioMed Central will be the most significant development for disseminating the results of biomedical research in our lifetime." Sir Paul Nurse, Cancer Research UK Your research papers will be: available free of charge to the entire biomedical community peer reviewed and published immediately upon acceptance cited in PubMed and archived on PubMed Central yours you keep the copyright Submit your manuscript here: BioMedcentral Page 12 of 12 (page number not for citation purposes)
136 European Journal of Human Genetics (2009) 17, & 2009 Macmillan Publishers Limited All rights reserved /09 $ ARTICLE Missense mutations to the TSC1 gene cause tuberous sclerosis complex Mark Nellist*,1, Diana van den Heuvel 1, Diane Schluep 1, Carla Exalto 1, Miriam Goedbloed 1, Anneke Maat-Kievit 1, Ton van Essen 2, Karin van Spaendonck-Zwarts 2, Floor Jansen 3, Paula Helderman 4, Gabriella Bartalini 5, Outi Vierimaa 6, Maila Penttinen 7, Jenneke van den Ende 8, Ans van den Ouweland 1 and Dicky Halley 1 1 Department of Clinical Genetics, Erasmus Medical Centre, Rotterdam, The Netherlands; 2 Department of Genetics, University Medical Center Groningen, University of Groningen, Groningen, The Netherlands; 3 Department of Child Neurology, Rudolf Magnus Institute for Neuroscience, University Medical Centre Utrecht, Utrecht, The Netherlands; 4 Department of Clinical Genetics, Maastricht University Medical Centre, Maastricht, The Netherlands; 5 Department of Clinical Pediatrics, University of Siena, Siena, Italy; 6 Department of Clinical Genetics, Oulu University Hospital, Oulu, Finland; 7 Clinical Genetics Unit, Department of Pediatrics, Turku University Central Hospital, Turku, Finland; 8 Centre of Medical Genetics, University of Antwerp, Antwerp, Belgium Tuberous sclerosis complex (TSC) is an autosomal dominant disorder characterised by the development of hamartomas in a variety of organs and tissues. The disease is caused by mutations in either the TSC1 gene on chromosome 9q34 or the TSC2 gene on chromosome 16p13.3. The TSC1 and TSC2 gene products, TSC1 and TSC2, interact to form a protein complex that inhibits signal transduction to the downstream effectors of the mammalian target of rapamycin (mtor). Here we investigate the effects of putative TSC1 missense mutations identified in individuals with signs and/or symptoms of TSC on TSC1 TSC2 complex formation and mtor signalling. We show that specific amino-acid substitutions close to the N-terminal of TSC1 reduce steady-state levels of TSC1, resulting in the activation of mtor signalling and leading to the symptoms of TSC. European Journal of Human Genetics (2009) 17, ; doi: /ejhg ; published online 1 October 2008 Keywords: tuberous sclerosis complex; TSC1; TSC2 Introduction Tuberous sclerosis complex (TSC) is an autosomal dominant disorder characterised by the development of hamartomas in a variety of organs and tissues, including the brain, skin and kidneys. 1,2 Mutations in either the TSC1 gene on chromosome 9q34 3 or the TSC2 gene on chromosome 16p cause *Correspondence: Dr M Nellist, Department of Clinical Genetics, Erasmus Medical Centre, Dr. Molewaterplein 50, 3015 GE Rotterdam, The Netherlands. Tel: þ ; Fax: þ ; m.nellist@erasmusmc.nl Received 2 May 2008; revised 16 July 2008; accepted 27 August 2008; published online 1 October 2008 TSC. The TSC1 and TSC2 gene products, TSC1 and TSC2, interact to form a protein complex. TSC2 contains a GTPase-activating protein domain and the TSC1 TSC2 complex acts on the rheb GTPase to prevent the rheb-gtpdependent stimulation of cell growth through the mammalian target of rapamycin (mtor). 5 In cells lacking either TSC1 or TSC2, the downstream targets of mtor, including p70 S6 kinase (S6K) and ribosomal protein S6, are constitutively phosphorylated. 6,7 The identification of the role of the TSC1 TSC2 complex in regulating mtor activity has made it possible to compare TSC1 and TSC2 variants found in the normal population with variants identified in individuals with symptoms of TSC. The effects of amino-acid changes on TSC1 TSC2 complex formation, on the activation of rheb GTPase activity by the complex
137 320 Functional analysis of TSC1 variants M Nellist et al and on the phosphorylation status of S6K and S6 can be determined. 8 Comprehensive screens for mutations at both the TSC1 and TSC2 loci have been performed in several large cohorts of TSC patients, and a wide variety of different mutations have been described Although B20% of the mutations identified in the TSC2 gene are missense changes, missense mutations in the TSC1 gene appear much less frequently. One simple explanation for this observation is that TSC1 missense mutations are rare because the majority of TSC patients have a mutation in the TSC2 gene. According to the TSC1 mutation database, putative missense mutations have been identified in TSC patients. However, only one of these is a confirmed de novo mutation. Here, we investigate the effects of 10 TSC1 missense changes (c.350t4c (p.l117p), c.539t4c (p.l180p), c.572t4a (p.l191h), c.671t4g (p.m224r), c.737g4a (p.r246k), c.913g4a (p.g305r), c.913g4t (p.g305w), c.1526g4a (p.r509q), c.3103g4a (p.g1035s) and c.3290g4a (p.r1097h)) on TSC1 TSC2 function. We compared these TSC1 variants with wild-type TSC1 and three truncation variants: c.379_381deltgt (p.128delv), c.593_595delact (p.n198f199delinsi) and c.2075c4t (p.r692x). Our analysis demonstrates that TSC1 missense mutations reduce steady-state levels of TSC1, resulting in increased mtor activity and leading to the symptoms of TSC. Materials and methods Patient characteristics Samples from patients with either a putative or definite diagnosis of TSC were received for mutation analysis. Details on clinical symptoms were obtained from the treating physicians who were sent a standardised clinical evaluation form (see Supplementary Table 1). Mutation analysis DNA was extracted from peripheral blood using standard techniques. Mutation analysis was performed as described earlier, 13 or by direct sequence analysis of all TSC1 and TSC2 coding exons and exon/intron boundaries. In addition, both genes were analysed using the multiplex ligation-dependent probe amplification assay (MRC Holland, Amsterdam, The Netherlands). To investigate whether the identified changes had an effect on splicing, three different splice-site prediction programs were used, as described earlier. 13 Generation of constructs and antisera Expression constructs encoding C-terminal YFP- and myctagged TSC1 variants were derived using the QuikChange site-directed mutagenesis kit (Stratagene, La Jolla, CA, USA). In each case, the complete open reading frame of the mutated construct was verified by sequence analysis. The other constructs used in this study have been described earlier. 8,20,21 Polyclonal rabbit antisera specific for human TSC1 and TSC2 have been described earlier. 21 Other antibodies were purchased from Cell Signaling Technology (Danvers, MA, USA). Functional analysis of TSC1 variants Expression of TSC1 variants in transfected cells Human embryonal kidney (HEK) 293T cells seeded into 6-cm diameter dishes were transfected with a 1:1 mixture of the TSC1 and TSC2 expression constructs using Lipofectamine Plus (Invitrogen, Carlsbad, CA, USA), following the manufacturer s instructions. Two days after transfection, the cells were lysed in 50 mm Tris-HCl (ph 8.0), 100 mm NaCl, 50 mm NaF, 0.5 mm EDTA and 1% Triton X-100 plus protease inhibitors (Roche, Basel, Switzerland) and separated into supernatant and pellet fractions by centrifugation at g for 10 min at 41C as described earlier. 22 Wild-type TSC1 and the TSC1 variants were immunoprecipitated from the supernatant fractions by incubation with a monoclonal antibody against the C-terminal myc epitope tag for 90 min at 41C before incubation with Protein G beads (GE Healthcare, Uppsala, Sweden). After gentle agitation for 90 min at 41C, the beads were washed three times with a 450-fold excess of lysis buffer. The immunoprecipitated proteins were detected by immunoblotting. Blots were developed using enhanced chemiluminescent detection (GE Healthcare). 8 Immunoblot analysis of S6K T389 phosphorylation in cells overexpressing TSC1 variants HEK 293T cells were transfected with a 4:2:1 mixture of the TSC1, TSC2 and S6K expression constructs. A total of 1.75 mg DNA was diluted in 200 ml Dulbecco s modified Eagle s medium (DMEM) containing 7 mg polyethyleneimine (Polysciences, Warrington, PA, USA). Where necessary, an empty expression vector (pcdna3; Invitrogen) was added to make up the total amount of DNA. After 15 min at room temperature, the DNA/polyethyleneimine complexes were added to 80% confluent cells in 3.5-cm diameter dishes. After 4 h at 371C, the transfection mixture was replaced with DMEM containing 10% foetal calf serum. Twenty-four hours after transfection, the cells were harvested and analysed by immunoblotting as before or by near infrared fluorescent detection on an Odysseyt Infrared Imager (169 mm resolution, medium quality with 0 mm focus offset) (Li-Cor Biosciences, Lincoln, NE, USA). The integrated intensities of the protein bands were determined using the Odyssey software (default settings with background correction; 3-pixel width border average method). The mean ratios of the T389-phosphorylated S6K signal to the total S6K signal (T389/S6K) and the total TSC2 signal to the total TSC1 signal (TSC2/TSC1) were determined relative to wild-type TSC1 from at least three independent experiments (wild-type T389/S6K and TSC2/TSC1 ratios ¼ 1). European Journal of Human Genetics
138 Immunofluorescent detection of S235/236 phosphorylation of ribosomal protein S6 in TSC1-deficient cells Tsc1 / mouse embryo fibroblasts (MEFs) 7 were transfected with expression constructs encoding wild-type TSC1 or the TSC1 variants, using Lipofectamine Plus (Invitrogen), following the manufacturer s instructions. Twenty-four hours after transfection, S6 (S235/236) phosphorylation in the transfected cells was detected by immunofluorescent microscopy using a rabbit polyclonal antibody specific for S235/236-phosphorylated S6. 23 TSC1 variants were identified either directly (for C-terminal-tagged TSC1-YFP variants) or with a mouse monoclonal antibody against the myc epitope tag (for C-terminal-tagged TSC1-myc variants). If possible, at least 50 cells expressing each TSC1 variant were counted per experiment and the Functional analysis of TSC1 variants M Nellist et al number of cells showing a clear reduction in S6 (S235/ 236) phosphorylation was noted. The mean proportions of expressing cells with reduced S6 phosphorylation were calculated from at least three independent experiments. Results Patient characteristics and mutation analysis The TSC1 c.350t4c (p.l117p) change was detected in two generations of a family with TSC (Figure 1a). The index patient (I:1) had epilepsy since the age of 22 years and fulfilled the diagnostic criteria for definite TSC, with facial angiofibroma, ungual fibroma, hypomelanotic macules, a shagreen patch and cerebral white matter migration lines. No mental disability was reported. The youngest child 321 Figure 1 Pedigrees of the investigated families with TSC. Arrows indicate the index cases. Open symbols indicate no signs or symptoms of TSC; black symbols indicate individuals with definite TSC; hatched symbols indicate individuals with possible TSC. A question mark indicates individuals where no clinical data were available. Genotypes are indicated for the individuals where DNA was available for testing. (a) Family with TSC and the TSC1 c.350t4c (p.l117p) variants. (b) Family with TSC and cosegregation of the TSC1 c.671t4g (p.m224r) and c.3103g4a (p.g1035s) variants. (c) Family with cosegregation of TSC and the TSC1 c.539t4c (p.l180p) variants. (d) Family with a de novo TSC1 c.572t4a (p.l191h) mutation. European Journal of Human Genetics
139 322 Functional analysis of TSC1 variants M Nellist et al (II:2) had the c.350t4c change. Despite being somewhat hyperactive, this child developed normally until 4 years of age when epileptic seizures occurred and development stagnated. The child is now severely mentally retarded. No information was available about other signs of TSC. The eldest child (II:1), who could not yet be tested for the c.350t4c change, suffered severe anoxia at birth and has severe infantile encephalopathy with spastic tetraplegia and epilepsy. The TSC1 c.671t4g (p.m224r) and TSC1 c.3103g4a (p.g1035s) changes were identified in two generations of a family with TSC 24 (Figure 1b). The index case (II:3) had definite TSC with multiple shagreen patches, hypomelanotic macules, ungual fibromas, dental pits, epilepsy and severe mental disability. One parent (I:2) and both siblings (II:1 and II:2) of the index case also fulfilled the diagnostic criteria for definite TSC. Individual I:2, who was seizurefree and of below-average intelligence (IQ 73), had skin lesions pathognomonic for TSC. Individual II:1, who was of normal intelligence (IQ 94), had seizures, cortical tubers and multiple TSC skin lesions. Individual II:2 had epilepsy, below-average intelligence (IQ 67) and multiple TSC skin lesions. All the affected individuals in this family were heterozygous for the c.671t4g and c.3103g4a changes. Three affected individuals (I:2, II:1 and II:2) were heterozygous for a polymorphism in the TSC2 gene (TSC2 c c4g). The index case was homozygous for the wild-type TSC C allele, consistent with TSC segregating with a mutation at the TSC1 locus in this family. The TSC1 c.539t4c (p.l180p) change was detected in three generations of a family with TSC (Figure 1c). Individual I:2 had an ungual fibroma as the only reported sign of TSC. Individual II:2 had epilepsy, no mental disability, skin signs typical for TSC and a subependymal giant cell astrocytoma as well as other brain lesions consistent with a definite diagnosis of TSC. Individual II:3, the half-sibling of II:2, had typical TSC-associated skin lesions and possible mild mental retardation. Individual II:4, the other half-sibling of II:2, had a history of seizures during puberty and some skin tags, not typical of TSC. Individual III:1, the child of II:2, had epilepsy, and typical TSC-associated skin and brain lesions. Individual III:2, the sibling of III:1, had multiple cardiac rhabdomyoma and Wolff Parkinson White syndrome. No mental disability was reported for either individual III:1 or III:2. TSC did not cosegregate with markers mapping close to the TSC2 locus on chromosome 16p13.3, and no candidate TSC2 mutation was identified in the index case. The TSC1 c.572t4a (p.l191h) change was identified in an individual who met the clinical criteria for definite TSC, including typical skin, heart and brain lesions. The individual had a history of seizures but no mental disability was reported. The c.572t4a change was absent in the individual s parents and child (Figure 1d). None of these individuals showed any signs of TSC. Two TSC patients, one Finnish and one Dutch, were identified with the TSC1 c.737g4a (p.r246k) change. No information was available on the parents of either of these two individuals. The Finnish individual had typical TSC-associated skin, brain and kidney lesions. No mental disability or history of seizures was reported. The Dutch individual was also reported to have definite TSC. The sibling of this individual did not have any signs of TSC and did not carry the c.737g4a change. The TSC1 c.1526g4a (p.r509q) change was identified in a child of African origin, suspected of having TSC due to an echodensity that was detected prenatally in the septum of the heart. After birth, physical examination of the child did not reveal any signs of TSC but multiple congenital malformations that fitted with VACTERL (vertebral anomalies, atresia, cardiac malformations, tracheoesophageal fistula, renal anomalies and limb anomalies) association were identified. The same c.1526g4a change was identified in one of the parents. Neither parent reported any signs of TSC. The TSC1 c.3290g4a (p.r1097h) change was identified in a child with cardiac rhabdomyoma who subsequently developed epilepsy at the age of 3 months. An MRI scan of the brain showed multiple subependymal nodules, cortical tubers and white matter abnormalities. This individual fulfilled the diagnostic criteria for definite TSC, with angiomyolipoma and multiple skin lesions. The c.3290g4a change was also identified in one of the parents; neither parent showed any signs of TSC. The TSC1 c.379_381deltgt (p.128delv) change was detected in a child with epilepsy and a definite diagnosis of TSC (multiple skin signs, subependymal nodules and angiomyolipoma). No mental disability was reported and no information was available on the phenotypic or genetic status of the parents. The same change has been reported in another unrelated TSC patient. 25 The TSC1 c.593_ 595delACT (p.n198f199delinsi), c.913g4a (p.g305r) and c.913g4t (p.g305w) missense changes have been reported earlier to cosegregate with TSC in three independent families. 15,26 In all the above cases, no other putative mutations were identified and comparison of the allele ratios of the index cases and parents (where possible) did not reveal any evidence for somatic mosaicism in the leukocyte DNA. Comparative analysis of TSC1 amino-acid substitutions During our initial mutation screening, the L117P change was the only putative TSC1 amino-acid substitution identified. We compared the L117P variant with wild-type TSC1, an earlier characterised TSC1 inframe deletion (N198F199delinsI) 27 and to a common TSC1 truncation mutation, R692X 3,10 (Figure 2). Wild-type TSC1 was detected predominantly in the post g European Journal of Human Genetics
 or the L117P, N198F199delinsI (del) or R692X variants (all containing a C-terminal myc epitope tag) were overexpressed in HEK 293T cells alone (a) or in the presence of")
140 Functional analysis of TSC1 variants M Nellist et al 323 Figure 2 Analysis of the TSC1 L117P variant. Wild-type TSC1 (wt) or the L117P, N198F199delinsI (del) or R692X variants (all containing a C-terminal myc epitope tag) were overexpressed in HEK 293T cells alone (a) or in the presence of coexpressed TSC2 (b). Cell lysates were separated into post g centrifugation pellet and supernatant fractions. The TSC1 variants were detected with a monoclonal mouse antibody against the myc epitope tag (9B11; Cell Signaling Technology). TSC1 TSC2 complexes were immunoprecipitated from the supernatant fractions using the same antibody. TSC2 was detected with a polyclonal rabbit antiserum. 8 (a) Expression of the TSC1 variants in the absence of TSC2. Wild-type TSC1 (wt) was detected predominantly in the pellet fraction. In contrast, the variants were detected predominantly in the supernatant fraction. The signals for the L117P and N198F199delinsI (del) variants are clearly less than wild-type TSC1 and the R692X variants (as detected with the 9B11 antibody). (b) Coexpression of TSC2 and the TSC1 variants. In the presence of TSC2, wild-type TSC1 and the variants were detected in both subcellular fractions. Coexpression of TSC2 resulted in a shift of wild-type TSC1 to the supernatant fraction and a shift of the variants to the pellet fraction. TSC1 and the TSC1 variants were immunoprecipitated with an antibody against the myc epitope tag. TSC2 was coimmunoprecipitated with all three variants. However, in each case, the TSC2 signal in the immunoprecipitate was clearly less than with the wild-type TSC1. pellet fraction, whereas the three variants were detected in the supernatant fraction (Figure 2a). Upon coexpression of TSC2, the variants as well as wild-type TSC1 were detected in both subcellular fractions (Figure 2b). TSC2 was coimmunoprecipitated from the supernatant fraction with all three variants, although clearly less effectively than with wild-type TSC1. Next, we investigated whether the variants could inhibit mtor signalling. Expression of wild-type TSC1 alone is insufficient to inhibit mtor activity. 28 Therefore, the variants were coexpressed with TSC2 and S6K in HEK 293T cells, and S6K T389 phosphorylation was analysed by immunoblotting (Figure 3a). To try and achieve comparable expression levels of the different variants, we used different quantities of the corresponding expression constructs. Coexpression of wild-type TSC1 and TSC2 resulted in a reduction in S6K T389 phosphorylation, even with low levels of the TSC1 expression construct. In contrast, coexpression of TSC2 with the variants did not reduce S6K T389 phosphorylation, indicating that they were unable to inhibit mtor effectively. Compared with wild-type TSC1, the L117P European Journal of Human Genetics
 T389 phosphorylation of S6K in HEK 293T cells coexpressing TSC2, myc-tagged S6K and myc-tagged wild-type TSC1 (wt) or the TSC1 L117P, N198F199delinsI (del) or R692X variants was determined by")
141 324 Functional analysis of TSC1 variants M Nellist et al Figure 3 TSC1 TSC2-dependent inhibition of mtor signalling by the TSC1 L117P variant. (a) T389 phosphorylation of S6K in HEK 293T cells coexpressing TSC2, myc-tagged S6K and myc-tagged wild-type TSC1 (wt) or the TSC1 L117P, N198F199delinsI (del) or R692X variants was determined by immunoblotting. Cells transfected with differing amounts of wild-type or variant expression constructs, as indicated, were analysed. The first lane on the left (control) corresponds to cells transfected with S6K and wild-type TSC1 expression constructs only (no TSC2 expression construct). The coexpression of only TSC2 and wild-type TSC1 inhibited S6K phosphorylation. (b) TSC1-dependent inhibition of S6 phosphorylation. YFP-tagged wild-type TSC1 (YFPTSC1) and the YFP-tagged N198F199delinsI (YFPdel) and L117P (YFPL117P) variants were expressed in Tsc1 / MEFs. S6 S235/236 phosphorylation in the YFP-positive cells was detected by immunofluorescent microscopy using an antibody specific for S235/236- phosphorylated S6 (Cell Signaling Technology). As a control, S6 phosphorylation in cells expressing YFP only was also determined. At least 50 cells were counted per variant per experiment. Mean percentage scores of three separate experiments are shown. Values significantly different from the wild type are indicated. and N198F199delinsI variants were detected at low levels, even when the quantity of transfected expression construct DNA was increased. To confirm that the L117P and N198F199delinsI variants were unable to inhibit mtor, they were expressed in Tsc1 / MEFs. These cells exhibit constitutive S6 (S235/ European Journal of Human Genetics

142 Functional analysis of TSC1 variants M Nellist et al ) phosphorylation. 7 As shown in Figure 3b, wild-type YFP-tagged TSC1 reduced S6 phosphorylation in 460% of the YFP-positive Tsc1 / MEFs, consistent with earlier results. 8 In contrast, S6 phosphorylation was reduced in o30% of cells expressing the L117P or N198F199delinsI variants (paired t-test Po0.001). Nevertheless, a reduction in S6 phosphorylation was observed in a higher proportion of variant-expressing cells than in cells expressing YFP only (paired t-test Po0.02). Therefore, although both variants were clearly less effective than wild-type TSC, we could not exclude the possibility that the variants can antagonise mtor activity. As a result of on-going TSC1 and TSC2 mutation screening, we identified eight additional TSC1 single amino-acid changes: p.128delv, p.l180p, p.l191h, p.m224r, p.r246k, p.r509q, p.g1035s and p.r1097h. The p.m224r and p.g1035s changes cosegregated with TSC in a single family (Figure 1b). To investigate the effects of these two amino-acid substitutions on TSC1 function, the corresponding single and double variants were compared with wild-type TSC1 and the R692X truncation. As shown in Figure 4a, the M224R variant and the M224R/ G1035S double variant were detected at lower levels than wild-type TSC1 and the G1035S variant. Furthermore, the expression of wild-type TSC1 or the G1035S variant reduced S6 phosphorylation in 450% of transfected Tsc1 / MEFs whereas o20% of the MEFs expressing the M224R, M224R/G1035S or R692X variants showed a reduction in S6 phosphorylation (Figure 4b), indicating that the M224R substitution is the mutation in this family and that the G1035S substitution is a cosegregating neutral variant. 24 We did not observe any differences between the M224R single mutant and the M224R/G1035S double mutant. Figure 4 Results of the functional assays on the M224R, G1035S and M224R/G1035S variants. (a) TSC1 TSC2-dependent inhibition of S6K-T389 phosphorylation. TSC2, S6K and wild-type TSC1 (wt TSC1), or the TSC1 variants, were expressed in HEK 293T cells. T389 phosphorylation of S6K was determined by immunoblotting and was reduced in the presence of wild-type TSC1 and the G1035S variants only. S6K, wild-type TSC1 and the TSC1 variants were detected with an antibody against the myc epitope tag. The signal for the M224R and M224R/G1035S variants is reduced compared with wild-type TSC1 and the G1035S and R692X variants. A representative example of at least three separate experiments is shown. (b) Inhibition of S6 phosphorylation in Tsc1 / MEFs. Wild-type myc-tagged TSC1 (TSC1) and the myc-tagged variants were expressed in Tsc1 / MEFs. S6 S235/ 236 phosphorylation in the myc-positive cells was determined by double-label immunofluorescent microscopy using a rabbit polyclonal antibody specific for S235/236-phosphorylated S6 and a mouse monoclonal antibody specific for the myc tag. The percentage of Tsc1 / MEFs expressing the TSC1 variants and showing a clear reduction in S6 phosphorylation is indicated. Because the signals for the M224R and M224R/G1035S variants were very low, it was difficult to unequivocally differentiate 450 expressing cells. Therefore, the total number of counted cells after two experiments is indicated above each bar. European Journal of Human Genetics
 TSC1-dependent inhibition of S6K T389 phosphorylation.")
143 326 Functional analysis of TSC1 variants M Nellist et al Figure 5 Analysis of the 128delV, L180P, L191H, R246K, G305R, G305W, R509Q and R1097H variants. (a) TSC1-dependent inhibition of S6K T389 phosphorylation. S6K T389 phosphorylation was determined by immunoblotting as before except that the blots were developed using Odyssey near infrared detection (Li-Cor Biosciences). Cells expressing S6K, TSC2 and wild-type TSC1 (wt) or the TSC1 variants were analysed. As controls, cells transfected with expression constructs for wild-type TSC1 and S6K only (TSC1/S6K), TSC2 and S6K only (TSC2/S6K), S6K only (S6K) or empty vector only (pcdna3) were also analysed. S6K and the TSC1 variants were detected with an antibody specific for the myc epitope tag. The R692X truncation variant is indicated with a large arrowhead; molecular weight markers are indicated with small arrows. Expression of wild-type TSC1 or the R246K, G305R, G305W, R509Q, G1035S and R1097H variants clearly inhibited S6K phosphorylation. The signals for the L117P, 128delV, L180P, L191H and M224R variants were clearly reduced compared with wild-type TSC1 (see also panel b), and S6K T389 phosphorylation was increased (see also panel c). A representative example of three separate experiments is shown. (b) Relative expression of the TSC1 variants. The integrated intensities of the TSC1 and TSC2 signals for each variant were determined in three independent experiments using the Odyssey scanning software. The mean TSC2/TSC1 ratios, relative to the wild-type TSC1 (wt) (wild-type TSC1 TSC2/TSC1 ratio ¼ 1), were determined. Standard deviations are indicated. (c) TSC1-dependent inhibition of S6K T389 phosphorylation. The ratio of the T389 S6K phosphorylation signal intensity to the total S6K signal intensity (T389/S6K) was measured in three independent experiments. The integrated intensity of each band was determined using the Odyssey scanning software and the mean T389/S6K ratios, relative to the wild-type TSC1 (wt) (wild-type TSC1 T389/S6K ratio ¼ 1), were determined. Standard deviations are indicated. (d) Inhibition of S6 phosphorylation in Tsc1 / MEFs. Wild-type myc-tagged TSC1 (wt) or the myc-tagged variants were expressed in Tsc1 / MEFs. S6 S235/236 phosphorylation in the myc-positive cells was determined by immunofluorescent microscopy as before. At least 50 cells were counted per variant per experiment. Each variant was tested in at least two separate experiments. Mean percentages of Tsc1 / MEFs expressing the TSC1 variants and showing reduced phosphorylation of S6 are shown. Standard deviations are indicated. European Journal of Human Genetics
144 Functional analysis of TSC1 variants M Nellist et al 327 To determine whether the 128delV, L180P, L191H, R246K, R509Q and R1097H amino-acid changes were, we compared these variants with the previously characterised L117P and R692X variants, and with two additional putative missense variants, G305R and G305W 15 (Figure 5). The R246K, G305R, G305W, R509Q and R1097H variants were detected at comparable levels with wild-type TSC1 (Figure 5a and b) and were just as effective at inhibiting S6K T389 phosphorylation (Figure 5a and c). In contrast, the 128delV, L180P and L191H variants were detected at low levels, similar to the L117P and M224R variants (Figure 5a and b). Furthermore, S6K T389 phosphorylation was not inhibited by the expression of these variants (Figure 5a and c). Consistent with the immunoblot data, the expression of the L117P, 128delV, L180P, L191H, M224R, M224R/G1035S and R692X variants in Tsc1 / MEFs reduced S6 phosphorylation in o40% of cells, whereas wild-type TSC1 and the R246K, G305R, G305W, R509Q, G1035S and R1097H variants reduced S6 phosphorylation in 450% of the expressing cells (Figure 5d). We concluded that the 128delV, L180P and L191H changes destabilise TSC1, resulting in increased mtor activity. The R246K, G305R, G305W, R509Q, G1035S and R1097H amino-acid substitutions did not affect TSC1 function in our assays. Splice-site prediction analysis Splice-site prediction analysis of the identified variants was performed according to a standard protocol 13 using three independent splice-site prediction programs. Effects were predicted for four of the variants: TSC1 c.379_381deltgt (p.128delv), c.737g4a (p.r246k) c.913g4a (p.g305r) and c.913g4t (p.g305w). According to two of the prediction programs, the c.379_381deltgt mutation created a potential new acceptor site within exon 6. However, the values of the new site (0.48 and 0.33 in Fruitfly and NetGene2, respectively) were lower than the values of the wild-type acceptor site (0.98 and 0.97, respectively). It is therefore unlikely that this sequence change affects splicing. The R246K, G305R and G305W amino-acid substitutions did not affect TSC1 function. However, the c.737g4a (p.r246k) nucleotide substitution altered the last nucleotide of exon 8 and all three programs indicated that this change disrupted the intron 8 splice donor site, leaving a new potential donor site 90 nucleotides downstream. Similarly, the c.913g4a (p.g305r) and c.913g4t (p.g305w) substitutions affect the last nucleotide of exon 9 and were predicted by all three programs to disrupt splicing to the intron 9 donor site. We concluded that these three variants are most likely splice-site mutations, not missense mutations. Unfortunately, the effect of these sequence changes on TSC1 RNA splicing could not be confirmed experimentally because no new samples could be obtained. An overview of the functional assays and splice-site analysis is presented in Supplementary Table 2. Discussion Mutation analysis of the TSC1 and TSC2 genes in individuals with TSC, and in those suspected of having the disease is important for diagnosis and genetic counselling. During our screening of a cohort of approximately 900 index cases with TSC, or possible TSC, we identified eight putative TSC1 missense changes, c.350t4c (p.l117p), c.539t4c (p.l180p), c.572t4a (p.l191h), c.671t4g (p.m224r), c.737g4a (p.r246k), c.1526g4a (p.r509q), c.3103g4a (p.g1035s) and c.3290g4a (p.r1097h), as well as a putative in-frame deletion mutant, TSC1 c.379_381deltgt (p.128delv). We compared these variants with the earlier reported c.913g4a (p.g305r), c.913g4t (p.g305w), c.593_595delact (p.n198f199delinsi) and c.2074c4t (p.r692x) mutants. 2,15,26 The TSC1 L117P, 128delV, L180P, L191H, N198F199- delinsi and M224R changes resulted in reduced levels of TSC1 and a reduction in TSC1-dependent inhibition of mtor activity, as detected by immunoblotting. In each case, the functional characterisation was consistent with the genetic and phenotypic findings and we concluded that the changes were. The R246K, G305R, G305W, R509Q, G1035S and R1097H amino-acid substitutions did not affect TSC1 function in our assays. However, we concluded that the TSC1 c.737g4a (p.r246k), c.913g4a (p.g305r) and c.913g4t (p.g305w) changes were most likely splice-site mutations. The c.737g4a transition was predicted to destroy the splice donor site at the 3 0 end of exon 8 and the c.913g4a and c.913g4t substitutions affect the last nucleotide of exon 9, also disrupting the normal splice donor site. The c.1526g4a (p.r509q), c.3103g4a (p.g1035s) and c.3290g4a (p.r1097h) variants did not appear to affect either TSC1 RNA splicing or TSC1 function. The c.1526g4a change was identified in a foetus suspected of having TSC. However, after birth, the child showed multiple congenital malformations that fitted with VACTERL association, and a normal physical examination of the child did not reveal any signs of TSC. We concluded that this variant is unlikely to cause TSC. The c.3103g4a variant cosegregated with the c.671t4g (p.m224r) variant and TSC in a single family. 24 We concluded that the p.g1035s substitution was a neutral variant, consistent with previous reports. 29,30 The c.3290g4a change was identified in a child with definite TSC and in one unaffected parent, and we concluded that it was also most likely a rare neutral variant. Here we demonstrate that specific amino-acid substitutions close to the N-terminal of TSC1 (amino acids 117 European Journal of Human Genetics
145 328 Functional analysis of TSC1 variants M Nellist et al 224) reduce the steady-state levels of TSC1. The location and the effects of these changes on TSC1 function are very similar to a small number of missense mutations described recently in some cases of bladder cancer, 31 suggesting that the pathogenetic mechanisms underlying TSC-associated lesions and tumours of the bladder may be related. Several studies indicate that TSC1 mutations are associated with a less severe clinical presentation in TSC patients. 9,12,13,15 The small number of patients that we identified with a TSC1 missense mutation made it difficult to identify a specific phenotypic spectrum in this group. Nevertheless, the use of functional assays to differentiate between polymorphisms and mutations, in TSC and other diseases, will not only facilitate the identification of mutations but also help investigate possible genotype phenotype correlations and provide insight into how specific amino-acid residues contribute to protein function. Acknowledgements Financial support was provided by the US Department of Defense Congressionally-Directed Medical Research Program (grant no. TS060052) and the Michelle Foundation. We thank the family members who contributed to this study. Dr N Migone is thanked for helpful comments on the paper. The authors report no conflicts of interest. References 1 Gomez M, Sampson J, Whittemore V eds: The Tuberous Sclerosis Complex. Oxford, UK: Oxford University Press, Roach ES, DiMario FJ, Kandt RS et al: Tuberous sclerosis consensus conference: recommendations for diagnostic evaluation. National Tuberous Sclerosis Association. J Child Neurol 1999; 14: van Slegtenhorst M, de Hoogt R, Hermans C et al: Identification of the tuberous sclerosis gene TSC1 on chromosome 9q34. Science 1997; 277: The European Chromosome 16 Tuberous Sclerosis Consortium: Identification and characterization of the tuberous sclerosis gene on chromosome 16. Cell 1993; 75: Li Y, Corradetti MN, Inoki K et al: TSC2: filling the GAP in the mtor signaling pathway. Trends Biochem Sci 2003; 28: Zhang H, Cicchetti G, Onda H et al: Loss of Tsc1/Tsc2 activates mtor and disrupts PI3K-Akt signaling through downregulation of PDGFR. J Clin Invest 2003; 112: Kwiatkowski DJ, Zhang H, Bandura JL et al: A mouse model of TSC1 reveals sex-dependent lethality from liver hemangiomas, and up-regulation of p70s6 kinase activity in Tsc1 null cells. Hum Mol Genet 2001; 11: Nellist M, Sancak O, Goedbloed MA et al: Distinct effects of single amino acid changes to tuberin on the function of the tuberin hamartin complex. Eur J Hum Genet 2005; 13: Jones AC, Shyamsundar MM, Thomas MW et al: Comprehensive mutation analysis of TSC1 and TSC2, and phenotypic correlations in 150 families with tuberous sclerosis. Am J Hum Genet 1999; 64: van Slegtenhorst M, Verhoef S, Tempelaars A et al: Mutational spectrum of the TSC1 gene in a cohort of 225 tuberous sclerosis complex patients: no evidence for genotype phenotype correlation. J Med Genet 1999; 36: Au KS, Rodriguez JA, Finch JL et al: Germ-line mutational analysis of the TSC2 gene in 90 tuberous sclerosis patients. Am J Hum Genet 1998; 62: Dabora SL, Jozwiak S, Franz DN et al: Mutational analysis in a cohort of 224 tuberous sclerosis patients indicates increased severity of TSC2, compared with TSC1, disease in multiple organs. Am J Hum Genet 2001; 68: Sancak O, Nellist M, Goedbloed M et al: Mutational analysis of the TSC1 and TSC2 genes in a diagnostic setting: genotype phenotype correlations and comparison of diagnostic DNA techniques in tuberous sclerosis complex. Eur J Hum Genet 2005; 13: Niida Y, Lawrence-Smith N, Banwell A et al: Analysis of both TSC1 and TSC2 for germline mutations in 126 unrelated patients with tuberous sclerosis. Hum Mutat 1999; 14: Au K-S, Williams AT, Roach ES et al: Genotype/phenotype correlation in 325 individuals referred for a diagnosis of tuberous sclerosis complex in the United States. Genet Med 2007; 9: Tuberous sclerosis database Leiden Open Variation Database. [ ¼ TSC2]. 17 NetGene2 Server. [ 18 SpliceSiteFinder. [ html]. 19 BDGP: Splice Site Prediction by Neural Network. [ org/seq_tools/splice.html]. 20 Nellist M, van Slegtenhorst MA, Goedbloed M et al: Characterization of the cytosolic tuberin hamartin complex: tuberin is a cytosolic chaperone for hamartin. J Biol Chem 1999; 274: van Slegtenhorst M, Nellist M, Nagelkerken B et al: Interaction between hamartin and tuberin, the TSC1 and TSC2 gene products. Hum Mol Genet 1998; 7: Nellist M, Verhaaf B, Goedbloed MA et al: TSC2 missense mutations inhibit tuberin phosphorylation and prevent formation of the tuberin-hamartin complex. Hum Mol Genet 2001; 10: Jaeschke A, Hartkamp J, Saitoh M et al: Tuberous sclerosis complex tumor suppressor-mediated S6 kinase inhibition by phosphatidylinositide-3-oh kinase is mtor independent. J Cell Biol 2002; 159: Jansen FE, Braams O, Vincken KL et al: Overlapping neurologic and cognitive phenotypes in patients with TSC1 or TSC2 mutations. Neurology 2008; 70: Lee-Jones L, Aligianis I, Davies PA et al: Sacrococcygeal chordomas in patients with tuberous sclerosis complex show somatic loss of TSC1 or TSC2. Genes Chromosomes Cancer 2004; 41: Goedbloed MA, Nellist M, Verhaaf B et al: Analysis of TSC2 stop codon variants found in tuberous sclerosis patients. Eur J Hum Genet 2001; 9: Hodges AK, Li S, Maynard J et al: Pathological mutations in TSC1 and TSC2 disrupt the interaction between hamartin and tuberin. Hum Mol Genet 2001; 10: Inoki K, Li Y, Zu Tet al: TSC2 is phosphorylated and inhibited by Akt and suppresses mtor signalling. Nat Cell Biol 2002; 4: Young JM, Burley MW, Jeremiah SJ et al: A mutation screen of the TSC1 gene reveals 26 protein truncating and 1 splice site mutation in a panel of 79 tuberous sclerosis patients. Ann Hum Genet 1998; 62: Dabora SL, Sigalas I, Hall F et al: Comprehensive mutation analysis of TSC1 using two-dimensional electrophoresis with DGGE. Ann Hum Genet 1998; 62: Pymar LS, Platt FM, Askham JM et al: Bladder tumour-derived somatic TSC1 missense mutations cause loss of function via distinct mechanisms. Hum Mol Genet 2008; 17: Supplementary Information accompanies the paper on European Journal of Human Genetics website ( European Journal of Human Genetics
146 European Journal of Human Genetics (2009) 17, & 2009 Macmillan Publishers Limited All rights reserved /09 $ ARTICLE A reliable cell-based assay for testing unclassified TSC2 gene variants Ricardo Coevoets 1, Sermin Arican 1, Marianne Hoogeveen-Westerveld 1, Erik Simons 1, Ans van den Ouweland 1, Dicky Halley 1 and Mark Nellist*,1 1 Department of Clinical Genetics, Erasmus Medical Centre, Rotterdam, The Netherlands Tuberous sclerosis complex (TSC) is characterised by seizures, mental retardation and the development of hamartomas in a variety of organs and tissues. The disease is caused by mutations in either the TSC1 gene or the TSC2 gene. The TSC1 and TSC2 gene products, TSC1 and TSC2, form a protein complex that inhibits signal transduction to the downstream effectors of the mammalian target of rapamycin (mtor). We have developed a straightforward, semiautomated in-cell western (ICW) assay to investigate the effects of amino acid changes on the TSC1 TSC2-dependent inhibition of mtor activity. Using this assay, we have characterised 20 TSC2 variants identified in individuals with TSC or suspected of having the disease. In 12 cases, we concluded that the identified variant was. The ICW is a rapid, reproducible assay, which can be applied to the characterisation of the effects of novel TSC2 variants on the activity of the TSC1 TSC2 complex. European Journal of Human Genetics (2009) 17, ; doi: /ejhg ; published online 15 October 2008 Keywords: tuberous sclerosis complex; in-cell western; unclassified variants Introduction Tuberous sclerosis complex (TSC) is an autosomal dominant disorder characterised by seizures, mental retardation and the development of hamartomas in a variety of organs and tissues. 1 The disease is caused by mutations in either the TSC1 gene on chromosome 9q34 2 or the TSC2 gene on chromosome 16p The TSC1 and TSC2 gene products, TSC1 and TSC2, form a protein complex that acts as a GTPase-activating protein (GAP) for the rheb GTPase, preventing the rheb-gtp-dependent stimulation of the mammalian target of rapamycin (mtor). 4 In cells lacking either TSC1 or TSC2, the downstream targets of mtor, including p70 S6 kinase (S6K) and ribosomal protein S6, are constitutively phosphorylated. 5,6 The identification of the role of the TSC1 TSC2 complex in regulating mtor *Correspondence: Dr M Nellist, Department of Clinical Genetics, Erasmus Medical Centre, Dr Molewaterplein 50, 3015 GE Rotterdam, The Netherlands. Tel: þ ; Fax: þ ; m.nellist@erasmusmc.nl Received 15 April 2008; revised 9 July 2008; accepted 4 September 2008; published online 15 October 2008 has made it possible to compare the activity of different TSC1 and TSC2 variants. The effects of amino acid changes on TSC1 TSC2 complex formation, on the activation of rheb GTPase activity, and on the phosphorylation status of the downstream effectors of mtor, can be determined. 7 Comprehensive screens for mutations at the TSC1 and TSC2 loci have been performed in large cohorts of TSC patients In most studies B20% of the identified mutations are either missense changes or small, in-frame insertions/deletions, predominantly in the TSC2 gene. In some cases, when a missense change cosegregates with TSC, or when key relatives are not available for testing, it is difficult to establish whether the identified nucleotide change is a mutation or a neutral variant. We identified a number of variants where it was not clear from the genetic data whether the identified variant was or not. 10 Toresolvesomeofthese cases we tested the activity of the variant TSC1 TSC2 complexes using a variety of biochemical assays. 12 To simplify and standardise the testing of TSC2 variants we have developed and tested an in-cell western (ICW) assay to determine whether specific TSC2 sequence variants identified in individuals with, or suspected of having, TSC are disease
147 302 In-cell western analysis of TSC2 variants R Coevoets et al causing. The ICW assay utilises secondary antibodies conjugated with near infrared fluorophores in combination with an infrared scanner enabling two distinct antibody signals to be detected simultaneously and quantified in fixed cells. The advantage of the ICW assay over immunoblot-based techniques is that no blotting step is required and the analysis and quantification can be performed directly in high-throughput multiwell plate formats. Therefore, the ICW assay streamlines both the experimental procedure and data analysis. In-cell western assays to assess protein phosphorylation have been described previously. 13 However, in most reports, the effects of different pharmacological reagents have been monitored. 14 Here, we describe a transfection-based ICW assay to facilitate the characterisation of the effects of genetic changes in the TSC2 gene on the activity of the TSC1 TSC2 complex and the mtor signalling pathway. We have used this assay to characterise 20 TSC2 variants. Twelve variants (60%) didnotinhibitmtoractivityineithertheicwassayorina conventional immunoblot assay, and could therefore be classified as mutations. Furthermore, we show that the ICW assay of TSC1 TSC2 function is amenable to the development of high-throughput, semiautomated protocols. Materials and methods Detection of TSC2 variants in TSC patients Mutation analysis was performed as described previously 10 or by direct sequence analysis of all TSC1 and TSC2 coding exons and exon/intron boundaries. In addition, both genes were analysed using the multiplex ligation-dependent probe amplification assay (MRC Holland, Amsterdam, The Netherlands). Where possible, parental DNA was collected and tested for the presence of the identified variants and, in cases of de novo changes, paternity testing was performed. To investigate whether the identified sequence changes had an effect on splicing, three splice site prediction programs were used. Materials Expression constructs encoding the 20 TSC2 variants (G62E, R98W, 275delN, Q373P, 580delASHATRVYEMLV- SHIQLHYKHSYTLP (hereafter referred to as 580del26), A607E, T1068I, T1075I, T1075T, V1199G, P1292A, S1410L, G1416D, D1512A, G1544V, 1553delTGLGR- LIELKDCQPDKVYL (hereafter referred to as 1553del19), H1617Y, V1623G, R1720Q and R1720W) were derived using the Stratagene QuikChange site-directed mutagenesis kit (Stratagene, La Jolla, CA, USA). Sequence changes were numbered according to the TSC2 cdna as originally published, as these corresponded to the cdna used for the expression studies. 3 Nomenclature according to the TSC2 mutation database 18 is given in Table 1. All variants were verified by sequencing the complete TSC2 cdna open reading frame. All the other constructs used in this study have been described previously. 7,19,20 Polyclonal rabbit antisera specific for human TSC1 and TSC2 have been described previously. 19 Other antibodies were purchased from Cell Signaling Technology (Danvers, MA, USA) (1A5, anti-t389 phospho-s6k mouse monoclonal; 9B11, anti-myc tag mouse monoclonal; anti-myc tag Table 1 Summary of the ICW-based functional characterisation of 20 TSC2 variants Nucleotide change a Amino acid change a t-test vs wild-type c t-test vs control c Pathogenicity 203G4A (185G4A) G62E Unclassified 310C4T (292C4T) R98W Unclassified 842delACA (824delACA) 275delN Pathogenic 1136A4C (1118A4C) Q373P Pathogenic b 1754del78 (1736del78) 580del Pathogenic 1838C4A (1820C4A) A607E Pathogenic 3221C4T (3203C4A) T1068I Pathogenic 3242C4T (3224C4T) T1075I Unclassified 3243C4T (3225C4T) T1075T Unclassified 3614T4G (3596T4G) V1199G Pathogenic 3892C4G (3943C4G) P1292A (P1315A) Unclassified 4247C4T (4298C4T) S1410L (S1433L) Unclassified 4265G4A (4316G4A) G1416D (G1439D) Unclassified 4553A4C (4604A4C) D1512A (D1535A) Pathogenic 4649G4T (4700G4T) G1544V (G1567V) Pathogenic 4675del57 (4726del57) 1553del19 (1576del19) Pathogenic 4867C4T (4918C4T) H1617Y (H1640Y) Pathogenic 4886T4G (4937T4G) V1623G (V1646G) Pathogenic 5177G4A (5228G4A) R1720Q (R1743Q) Pathogenic 5176C4T (5227C4T) R1720W (R1743W) Pathogenic a Nucleotide and amino acid numbering corresponding to reference. 3 Nucleotide and amino acid numbering corresponding to reference 18 are given in parentheses. b Pathogenic de novo mutation, most likely causing aberrant splicing of the TSC2 mrna; the Q373P amino acid substitution did not affect TSC1 TSC2 complex function. c P-values o0.05 are indicated in bold. European Journal of Human Genetics
148 rabbit polyclonal), Zymed laboratories (San Francisco, CA, USA) (anti-tsc1 and anti-tsc2 mouse monoclonals) and Li-Cor Biosciences (Lincoln, NE, USA) (goat anti-rabbit 680 nm and goat anti-mouse 800 nm conjugates). Chemicals were from Merck (Darmstadt, Germany), unless specified otherwise. Cell culture Human embryonal kidney (HEK) 293T cells were grown in Dulbecco s modified Eagle s medium (DMEM) (Lonza, Verviers, Belgium) supplemented with 10% fetal bovine serum, 50 U/ml penicillin and 50 mg/ml streptomycin (DMEM þ ), in a 10% CO 2 humidified incubator. Western blotting Cells were seeded onto 24-well plates and transfected with 0.2 mg TSC2, 0.4 mg TSC1 and 0.1 mg S6Kmyc expression constructs using polyethyleneimine (PEI) (Polysciences Inc., Warrington, PA, USA). A 1:4 w/w mixture of plasmid DNA and PEI was incubated in 0.2 ml DMEM for 15 min at 201C before adding to the cells. After 4 h, the DMEM/DNA/ PEI was replaced with DMEM þ. Twenty-four hours after transfection, the cells were transferred to ice, washed with phosphate-buffered saline (PBS) (41C) and harvested in 50 ml lysis buffer (50 mm Tris-HCl ph 8.0, 150 mm NaCl, 50 mm NaF, 1% Triton X-100, protease inhibitor cocktail (Complete, Roche Molecular Biochemicals, Woerden, The Netherlands)). Cells were lysed for 10 min on ice before centrifugation ( g for 10 min at 41C). The supernatants were diluted in loading buffer, separated on 6% SDS-PAGE gels and transfered to nitrocellulose membranes, as described previously. 19 Membranes were blocked for 1 h at 201C with 5% low-fat milk powder (Campina Melkunie, Eindhoven, The Netherlands) in PBS and incubated overnight at 41C with the primary antibodies: 1/ dilution of 1895 (rabbit polyclonal against TSC2 19 ), 1/5000 dilution of 2197 (rabbit polyclonal against TSC1 19 ), 1/5000 dilution of a rabbit polyclonal against the myc epitope tag and 1/ 2000 dilution of 1A5 (mouse monoclonal against p70 S6 kinase (S6K) phosphorylated at amino acid T389). Antibodies were diluted in blocking solution containing 0.1% Tween 20 (Sigma-Aldrich Fine Chemicals, Poole, UK). After washing 3 for 5 min in PBS containing 0.1% Tween 20 (PBST), the membranes were incubated for 1 h at 201C in the dark in PBST containing 1/5000 dilutions of goat antirabbit 680 nm and goat anti-mouse 800 nm secondary antibodies. After washing (3 for 5 min in PBST, 1 in PBS) the membranes were scanned using the Odysseyt Infrared Imager (169 mm resolution, medium quality with 0 mm focus offset) (Li-Cor Biosciences, Lincoln, NE, USA). The integrated intensities of the protein bands were determined using the Odysseyt software (default settings with background correction; 3 pixel width border average method). In-cell western analysis of TSC2 variants R Coevoets et al ICW assays Cells were seeded onto 96-well plates coated with 0.1 mg/ml poly-l-lysine (Sigma-Aldrich Fine Chemicals). Cells at 85 95% confluency were transfected with 0.1 mg TSC2,0.2mg TSC1 and 0.05 mg S6Kmyc expression constructs using PEI, as before. Each transfection mix was divided equally between three wells. After 4 h, the DMEM/DNA/PEI mixtures were replaced with DMEM þ. ICW assays were performed 24 h after transfection. Cells were rinsed with PBS, fixed with freshly prepared 4% paraformaldehyde for 20 min at 201C, washed 3 for 5 min with PBS containing 0.1% Triton X-100 and incubated for 90 min in blocking solution before incubation overnight at 41C with the primary antibodies. Three different primary antibody mixes were prepared: 1/200 dilution of mouse monoclonal anti-tsc2 antibody, 1/200 dilution of mouse monoclonal anti-tsc1 antibody and 1/200 dilution of 1A5 (S6K T389 phosphorylation-specific mouse monoclonal). The antibodies were diluted in blocking solution containing 0.1% Tween 20 and a 1/500 dilution of the rabbit polyclonal anti-myc antibody. Antibodies were diluted according to the manufacturer s recommendations and based on the results of calibration experiments (see Supplementary Figure 1). After washing for 3 for 5 min in PBST, the cells were incubated for 1 h at 201C in the dark with a 1/500 dilution of goat anti-rabbit 680 nm and 1/500 dilution of goat anti-mouse 800 nm in PBST. After washing (4 for 5 min in PBST) the plates were scanned using the Odyssey Infrared Imager (169 mm resolution, medium quality with 3 mm focus offset). The integrated intensities of the protein signals were determined using the Odyssey software (8.5 mm quantification grid with background correction; 3 pixel width border average method). ICW assay automation In-cell western assays were performed using a Tecan EVO200 liquid handling station (Tecan Benelux, Giessen, The Netherlands). Transfected cells were fixed as before, washed 3 for 5 min with PBS containing 0.1% Triton X-100 and placed in the station for the subsequent incubation and wash steps. After aspiration of the wash buffer, the cells were incubated with blocking solution for 90 min followed by the primary antibody mixes for 8.5 h. After washing (3 for 5 min with PBST), the cells were incubated for 5 h with the secondary antibodies and washed (3 for 5 min with PBST; 1 for 5 min with PBS). Finally the PBS was aspirated, and the plate removed for scanning on the Odyssey Infrared Imager, as before. All incubation steps were performed at 41C in the dark. Results ICW assay for the analysis of TSC1-TSC2-mTOR signalling To determine whether the ICW assay was suitable for the analysis of transfected HEK 293T cells, we compared S6K 303 European Journal of Human Genetics
149 304 In-cell western analysis of TSC2 variants R Coevoets et al T389 phosphorylation in cells expressing TSC1, S6K and either wild-type TSC2 or the TSC2 R611Q mutant. Control cells were transfected with the pcdna3 expression vector alone (no TSC2, TSC1 or S6K cdna inserts) or were cotransfected with the TSC1 and S6K expression constructs only. A schematic of the 96-well plate is shown in Figure 1a, and the resulting scans are shown in Figure 1b. After subtraction of the background signals, the ratio of the TSC2, TSC1 or T389-phosphorylated S6K (T389) signal (green) to the total S6K signal (red) was determined (Figure 1c). S6K-T389 phosphorylation was reduced B2- fold in cells expressing wild-type TSC2, compared to either cells expressing the R611Q mutant or to cells without TSC2 expression. A similar reduction in S6K-T389 phosphorylation was observed when the protocol was modified for the Tecan EVO200 liquid handling station (Figure 1d). ICW analysis of TSC2 variants Next, we tested 20 TSC2 variants identified in our patient cohort, including three in-frame deletions (275delN, 580del26 and 1553del19), 17 missense changes (G62E, R98W, Q373P, A607E, T1068I, T1075I, V1199G, P1292A, S1410L, G1416D, D1512A, G1544V, H1617Y, V1623G, R1720Q and R1720W) and one silent change (T1075T). Two of the variants, R1720Q and R1720W, had previously been shown to be de novo changes occurring in sporadic TSC patients and, on this basis, were assumed to be mutations. 10,18 In the other 18 cases, essential genetic and/or clinical data were unavailable and the identified variants could not be classified as either or non-. The positions of the variant amino acids are indicated in Figure 2. All variants were analysed using the ICW assay in three independent experiments. The integrated intensities of the fluorescent signals were quantified using the Odyssey software and the signals for each TSC2 variant, and for TSC1 and T389-phosphorylated S6K in the presence of the different variants were determined relative to the total S6K signal in the same well. Subsequently, the degree of S6K- T389 phosphorylation in the presence of the different TSC2 variants, relative to wild-type TSC2, was determined. A representative scan is shown in Figure 3b. The total S6K signal was relatively constant across the different wells, indicating that inter-well differences in transfection efficiency and cell number were small. The signals for the different TSC2 variants were also relatively constant. None of the amino acid changes had a dramatic effect on the TSC2 signal, although a slight decrease was noted for the R611Q, 275delN, 580del26, A607E and V1623G variants. Similarly, the TSC1 signal was relatively constant, with only slight reductions in the presence of the TSC2 R611Q, 275delN, 580del26 and A607E variants. The T389 phosphorylation status of S6K was clearly dependent on the presence of the different TSC2 variants. TSC2-dependent inhibition of S6K-T389 phosphorylation was significantly reduced (ie, specific S6K T389 phosphorylation signal was increased compared to wild-type TSC2) in the presence of the R98W, 275delN, 580del26, A607E, T1068I, V1199G, D1512A, G1544V, 1553del19, H1617Y, V1623G, R1720Q and R1720W variants. As shown in Table 1, the T389/S6K ratio in the presence of these TSC2 variants was significantly different to the T389/S6K ratio in the presence of wild-type TSC2 (unpaired t-test Po0.05). Furthermore, in the presence of these variants, S6K T389 phosphorylation was comparable to T389 phosphorylation in the absence of TSC2 or in the presence of the TSC2 R611Q mutant (T389/ S6K ratio was not significantly different from control: unpaired t-test P40.05; Table 1). Only the R98W variant was significantly different from both the positive and negative controls (Figure 3 and Table 1). The G62E, Q373P, T1075I, T1075T, P1292A, S1410L and G1416D variants were as effective as wild-type TSC2 at inhibiting S6K T389 phosphorylation (T389/S6K ratio was not significantly different from wild-type TSC2: unpaired t-test P40.05; T389/S6K ratio was significantly different from the T389/ S6K ratio in the absence of TSC2: unpaired t-test Po0.05; Table 1). Immunoblot analysis of the TSC2 variants We analysed the effects of the TSC2 variants on mtor activity by immunoblotting. In three independent experiments, the expression of TSC1 and the TSC2 variants, and the expression and T389 phosphorylation status of S6K Figure 1 Optimisation of the ICW assay for analysis of TSC2 variants. (a) Schematic showing part of a 96-well cell culture plate. Cells in wells A1 A3 (row A) were transfected with expression constructs for wild-type TSC2, TSC1 and myc-tagged S6K (S6K); B1 B3 (row B) were transfected with expression constructs for the TSC2 R611Q variant, TSC1 and S6Kmyc; C1 C3 (row C) with vector only and D1 D3 (row D) with expression constructs for TSC1 and S6Kmyc only. A1 D1 (column 1) were probed with a monoclonal antibody specific for TSC2 (Zymed laboratories; green); A2 D2 (column 2) were probed with a monoclonal antibody specific for TSC1 (Zymed laboratories; green) and A3 D3 (column 3) were probed with a monoclonal antibody specific for T389-phosphorylated S6K (Cell Signaling Technology; green). All wells were probed with a polyclonal antibody specific for the S6K myc tag (Cell Signaling Technology; red). (b) Odyssey scans of the wells are shown in A, showing the 800 nm (green) channel (left), the 680 nm (red) channel (centre) and the merged image (right). The transfections in rows A, B and C are indicated on the right, the antibody signals revealed in columns 1, 2 and 3 are indicated below the scans. (c) Graphical representation of the scans is shown in B. The integrated intensities of the green and red fluorescent signals were determined using the Odyssey software. After subtraction of the background values (wells C1 C3; row C), the green:red ratio was calculated. (d) ICW assay using the Tecan EVO200 liquid handling station. Integrated intensities were determined and the green:red signal ratios calculated as in C for four separate transfection experiments. The mean TSC2/S6K, TSC1/S6K and T389/S6K ratios, and standard deviations are indicated. The mean T389/S6K ratio in the presence of wild-type TSC2 was significantly reduced compared to the TSC2 R611Q variant (P ¼ 0.03) and TSC1 only control (P ¼ 0.004). European Journal of Human Genetics

150 a 2 3 In-cell western analysis of TSC2 variants R Coevoets et al 305 TSC21TSC1/S6K TSC21TSC1/S6K TSC2/TSC1/S6K ~ transfected DNA A vs. vs. vs. TSC2/S6K TSC1/S6K T389/S6K ~ antibodies R611QITSC1/S6K R611 QITSC1/S6K R611QITSC1/S6K B vs. vs. vs. TSC2/S6K TSC1/S6K T389/S6K control control control c vs. vs. vs. TSC2/S6K TSC1/S6K T389/S6K 0 TSC1/S6K only TSC1/S6K only TSC1/S6K only vs. vs. vs. TSC2/S6K TSC1/S6K T389/S6K b A TSC2 B R611Q c control D TSC1 TSC2 TSC1 T389 S6K S6K S6K TSC2/ TSC1/ T389/ S6K S6K S6K C TSC2/S6K TSC1/S6K T3$9/S6K $ TSC2 R611Q control TSCI TSC2 R611Q control TSC1 TSC2 R611Q control TSC1 d 10 TSC2JS6K TSCIIS6K T3891S6K p = 0.03 p = u TSC2 R611Q eon trot TSCI TSC2 R611Q control TSC1 TSC2 R611Q control TSC1 European Journal of Human Genetics
151 306 In-cell western analysis of TSC2 variants R Coevoets et al Figure 2 Schematic diagram of TSC2, showing the TSC1-binding and GAP domains, prominent sites of PKB, GSK3 and AMPK phosphorylation, and the positions of the variant amino acids tested in this study. were determined (Figure 4). The results of the immunoblotting experiments were consistent with the ICW assays. Compared to wild-type TSC2 and the G62E, Q373P, T1075I, T1075T, P1292A, S1410L and G1416D variants, S6K T389 phosphorylation was increased in the presence of the R98W, 275delN, 580del26, A607E, T1068I, V1199G, D1512A, G1544V, 1553del19, H1617Y, V1623G, R1720Q and R1720W variants. The immunoblot data differed from the ICW data in that larger differences were detected in the signals of the different TSC2 variants, and in the TSC1 signal in the presence of the different TSC2 variants. The S6K signal was relatively constant, indicating that the observed differences were unlikely to be due to differences in cell number and transfection efficiency between the variants. Compared to wild-type TSC2, the signal for the R611Q variant was consistently reduced. In addition, the TSC1 signal was also reduced in the presence of the R611Q variant. Previous studies have demonstrated that the R611Q mutation disrupts the TSC1 TSC2 interaction, reducing the levels of TSC1 and TSC2 in cytosolic fractions. 20 A similar pattern was observed for the R98W, 275delN, 580del26 and A607E variants, indicating that these variants also have a reduced ability to interact with TSC1. The amino acids affected in these variants all map to regions of TSC2 that have previously been shown to be important for the TSC1 TSC2 interaction. Wild-type TSC2 was detected as a broad band on the immunoblots, consisting of 2 3 isoforms with slightly different migration characteristics. In contrast, some of the TSC2 variants appeared to migrate as a single band. This is most likely due to differences in the post-translational modification of the different variants. 7 We compared the phosphorylation status of the different variants using an antibody specific for TSC2 phosphorylated at the T1439 position. However, using this antibody, we did not observe any clear differences in TSC2-T1439 phosphorylation between wild-type TSC2 and the TSC2 variants (see Supplementary Figure 2). Although the immunoblotting experiments supported the ICW data, the differences averaged over three independent experiments were not always significant (unpaired t-test; Figure 4). Therefore, the ICW gave more consistent and reproducible data, and allowed us to classify the 20 variants as or not in a relatively short period of time. The ICW required fewer manipulations than the immunoblot analysis and was always performed using the same 96-well grid. Variables such as the cell harvest and fractionation steps and the gel and buffer characteristics most likely resulted in more inter-experiment differences in the immunoblot assays. A comparison of the steps involved in the two techniques is shown in Figure 5. The ICW assay indicated that the TSC2 275delN, 580del26, A607E, T1068I, V1199G, D1512A, G1544V, 1553del19, H1617Y, V1623G, R1720Q and R1720W variants were likely to be, as they all disrupted the ability of the TSC1 TSC2 complex to inhibit mtor activity. Immunoblot analysis confirmed that these 12 variants are inactive and therefore disease causing. The G62E, Q373P, T1075I, T1075T, P1292A, S1410L and G1416D variants were indistinguishable from wild-type TSC2 in both the ICW and immunoblot assays. However, it was possible that the corresponding nucleotide changes could still be through effects on TSC2 mrna splicing. We analysed the nucleotide changes using three splice site prediction programs Only the 1136A4C (Q373P, TSC2 exon 10) substitution was predicted to affect splicing. Codon 373 is encoded by the last three nucleotides of TSC2 exon 10, and according to all three prediction programs, the 1136A4C substitution disrupts the exon 10 donor sequence, resulting in an aberrantly spliced TSC2 mrna. We concluded that the 1136A4C (Q373P) variant was a splice site mutation, and not a missense mutation. Subsequent genetic analysis of the parents of the TSC patient with the TSC2 1136A4C (Q373P) variant demonstrated that this was a de novo change. Paternity was also confirmed in this case (data not shown). In contrast to the TSC2 variants discussed above, the R98W variant could not be classified as either or non-. This variant was able to inhibit S6K T389 phosphorylation in both the ICW and immunoblot European Journal of Human Genetics
, B1 B3 (row B), C1 C3 (row C) and D1 D3 (row D) were transfected as before (see Figure 1).")
152 In-cell western analysis of TSC2 variants R Coevoets et al 307 Figure 3 Characterisation of 20 TSC2 variants using the ICW assay. (a) Schematic showing part of a 96-well cell culture plate. Cells in wells A1 A3 (row A), B1 B3 (row B), C1 C3 (row C) and D1 D3 (row D) were transfected as before (see Figure 1). Cell in the remaining sets of three wells were transfected with expression constructs for the different TSC2 variants, TSC1 and S6Kmyc. All wells were probed with a polyclonal antibody specific for the S6K myc tag (red). Wells in columns 1, 4 and 7 were probed with a monoclonal antibody specific for TSC2 (green); wells in columns 2, 5 and 8 were probed with a monoclonal antibody specific for TSC1 (green) and wells in columns 3, 6 and 9 were probed with a monoclonal antibody specific for T389-phosphorylated S6K (green). (b) Odyssey scans of the wells are shown in (a). (c) Graphical representation of the results of three independent ICW assays. The integrated intensities of the green and red fluorescent signals were determined using the Odyssey software. In each case the background values, measured in wells C1 C3 (control), were subtracted from the integrated intensity. In the top graphic, the mean integrated intensity values for S6K are shown. In the three lower graphics, the expression of TSC2 and TSC1, and the T389 phosphorylation of S6K are indicated. To correct for inter-well differences in cell number and transfection efficiency, values are expressed relative to the total S6K signal. Standard deviations are indicated. TSC2 variants with a significantly different T389/S6K ratio than wild type (Po0.05) are indicated with an asterisk. European Journal of Human Genetics

153 308 In-cell western analysis of TSC2 variants R Coevoets et al Figure 4 Characterisation of 20 TSC2 variants by immunoblot analysis. Cells co-transfected with expression constructs encoding TSC1, S6Kmyc and either wild-type TSC2 or one of the 20 TSC2 variants were harvested and cytosolic fractions separated on a 6% SDS-PAGE gel before transfer. Blots were probed with rabbit polyclonal antisera against TSC2, TSC1 and the myc epitope tag, and a mouse monoclonal against T389-phosphorylated S6K, followed by the Li-Cor goat anti-rabbit 800 and goat anti-mouse 680 secondary antibodies. (a) Representative scan of an immunoblot. Expression of the TSC2 variants, TSC1 and S6K (all red) and the T389 phosphorylation of S6K (green) are indicated. (b) Graphical representation of the results of three independent immunoblots. The integrated intensities of the green and red fluorescent signals were determined using the Odyssey software with background correction. In the top graphic, the mean values for S6K are shown. In the three lower graphics, the expression of TSC2 and TSC1, and the T389 phosphorylation of S6K are indicated. To correct for differences in cell number and transfection efficiency, values are expressed relative to the total S6K signal per lane. Standard deviations are indicated. TSC2 variants with a significantly different T389/S6K ratio than wild type (Po0.05) are indicated with an asterisk. European Journal of Human Genetics
154 In-cell western analysis of TSC2 variants R Coevoets et al 309 Figure 6 Pedigree showing inheritance of the TSC2 310 C4T (R98W) variant. Open symbols indicate no signs or symptoms of TSC; black symbol indicates definite TSC (diagnosed post-mortem). Genotypes, where known, are indicated. caused TSC in the fetus. We could not rule out the possibility that the TSC2 R98W substitution modifies the phenotype in this family. Figure 5 Flow diagram to show the steps involved in the ICW assay, compared to immunoblotting. assays, but was less effective than wild-type TSC2. On the immunoblots, the expression of the R98W variant was reduced compared to wild-type TSC2, and the expression of TSC1 was also consistently reduced in the presence of this variant. This suggests that the R98W substitution affects the TSC1 TSC2 interaction, and therefore reduces the ability of the complex to inhibit mtor signalling. As shown in Figure 6, the TSC2 310C4T (R98W) substitution was detected in a mother and a fetus. The fetus did not survive to term and was diagnosed with TSC post-mortem. No signs of TSC were reported in either parent. The mother was heterozygous for the TSC2 310C4T (R98W) variant, whereas the fetus appeared to be hemizygous for this variant as the wild-type allele was not detected and MLPA analysis of the fetal DNA indicated that there was a deletion of TSC2 exons 1 8. MLPA analysis of the TSC1 locus in the fetus suggested that there was also a duplication of the entire TSC1 coding region. However, due to a lack of material, we were unable to confirm the MLPA data. Therefore, the clinical, genetic and functional data for this variant were all problematic and we were unable to determine for certain whether the R98W substitution disrupts the TSC1 TSC2 complex sufficiently to cause TSC. TSC2 missense mutations with apparently mild phenotypic effects have been described previously, and have been shown to affect TSC1 TSC2 function in vitro. 24,25 In the family shown in Figure 6, it seems most likely that the deletion of exons 1 8 at the TSC2 locus Discussion Mutation analysis of individuals with, or suspected of having, a genetic disease facilitates the diagnosis, treatment and genetic counselling of those individuals and their families. However, in some cases, it is not possible to determine from the genetic data whether an identified nucleotide change is disease causing. Functional analysis of the predicted protein variants provides an additional method for determining whether specific changes are. Here, we show that the ICW assay is a robust and reproducible assay for the analysis of unclassified TSC2 variants and can complement standard DNA-based molecular diagnostics. We tested the activity of 20 different TSC2 variants and identified 12 changes (275delN, 580del26, A607E, T1068I, V1199G, D1512A, G1544V, 1553del19, H1617Y, V1623G, R1720Q and R1720W), 7 neutral variants (G62E, Q373P, T1075I, T1075T, P1292A, S1410L and G1416D), and one variant (R98W) where the functional significance of the substitution was not clear. Characterisation of the effects of different TSC2 amino acid changes on the TSC1 TSC2 complex will help provide insight into the structure and function of the complex. The N-terminal 769 amino acids of TSC2 are important for the TSC1 TSC2 interaction. 19,22 Four changes mapping to this domain (R98W, 275delN, 580del26 and A607E) reduced the levels of both TSC1 and TSC2 in cytosolic fractions. We did not observe any effect of either the G62E or Q373P substitutions, indicating that these residues are not critical for the TSC1 TSC2 interaction. We analysed seven TSC2 European Journal of Human Genetics
155 310 In-cell western analysis of TSC2 variants R Coevoets et al variants affecting amino acids close to the TSC2 GAP domain (amino acids ) 3 (Figure 2). All of these changes prevented the TSC1 TSC2-dependent inhibition of mtor signaling, indicating that residues within and flanking the reported GAP domain are essential for TSC2 activity. The TSC is one of several diseases that are caused by mutations in genes involved in the mtor signalling pathway. 26 The application of similar ICW assays to analyse unclassified variants in individuals with these diseases may also prove to be a useful adjunct to standard molecular genetic analysis. Acknowledgements Financial support was provided by the US Department of Defense Congressionally-Directed Medical Research Program (grant no. TS060052), and the Michelle Foundation. The authors report no conflicts of interest. References 1 Gomez M, Sampson J, Whittemore V (eds): The Tuberous Sclerosis Complex. Oxford, UK: Oxford University Press, 1999, pp van Slegtenhorst M, de Hoogt R, Hermans C et al: Identification of the tuberous sclerosis gene TSC1 on chromosome 9q34. Science 1997; 277: The European Chromosome 16 Tuberous Sclerosis Consortium: Identification and characterization of the tuberous sclerosis gene on chromosome 16. Cell 1993; 75: Li Y, Corradetti MN, Inoki K, Guan K-L: TSC2: filling the GAP in the mtor signaling pathway. Trends Biochem Sci 2004; 29: Zhang H, Cicchetti G, Onda H et al: Loss of Tsc1/Tsc2 activates mtor and disrupts PI3K-Akt signaling through downregulation of PDGFR. J Clin Invest 2003; 112: Kwiatkowski DJ, Zhang H, Bandura JL et al: A mouse model of TSC1 reveals sex-dependent lethality from liver hemangiomas, and up-regulation of p70s6 kinase activity in Tsc1 null cells. Hum Mol Genet 2001; 11: Nellist M, Sancak O, Goedbloed MA et al: Distinct effects of single amino acid changes to tuberin on the function of the tuberinhamartin complex. Eur J Hum Genet 2005; 13: Jones AC, Shyamsundar MM, Thomas MW et al: Comprehensive mutation analysis of TSC1 and TSC2, and phenotypic correlations in 150 families with tuberous sclerosis. Am J Hum Genet 1999; 64: Dabora SL, Jozwiak S, Franz DN et al: Mutational analysis in a cohort of 224 tuberous sclerosis patients indicates increased severity of TSC2, compared with TSC1, disease in multiple organs. Am J Hum Genet 2001; 68: Sancak O, Nellist M, Goedbloed M et al: Mutational analysis of the TSC1 and TSC2 genes in a diagnostic setting: genotypephenotype correlations and comparison of diagnostic DNA techniques in tuberous sclerosis complex. Eur J Hum Genet 2005; 13: Au K-S, Williams AT, Roach ES et al: Genotype/phenotype correlation in 325 individuals referred for a diagnosis of tuberous sclerosis complex in the United States. Genet Med 2007; 9: Nellist M, Sancak O, Goedbloed M et al: Functional characterisation of the TSC1-TSC2 complex to assess multiple TSC2 variants identified in single families affected by tuberous sclerosis complex. BMC Med Genet 2008; 9: Wong SK: A 384-well cell-based phospho-erk assay for dopamine D2 and D3 receptors. Anal Biochem 2004; 333: Selkirk JV, Nottebaum LM, Ford IC et al: A novel cell-based assay for G-protein-coupled receptor-mediated cyclic adenosine monophosphate response element binding protein phosphorylation. J Biomol Screen 2006; 11: NetGene2 Server. [ 16 SpliceSiteFinder. [ html]. 17 BDGP. Splice Site Prediction by Neural Network [ seq_tools/splice.html]. 18 Tuberous sclerosis databasefleiden Open Variation Database. [ ¼ TSC2 ]. 19 van Slegtenhorst M, Nellist M, Nagelkerken B et al: Interaction between hamartin and tuberin, the TSC1 and TSC2 gene products. Hum Mol Genet 1998; 7: Nellist M, Verhaaf B, Goedbloed MA, Reuser AJJ, van den Ouweland AMW, Halley DJJ: TSC2 missense mutations inhibit tuberin phosphorylation and prevent formation of the tuberinhamartin complex. Hum Mol Genet 2001; 10: Hodges A, Li S, Maynard J et al: Pathological mutations in TSC1 and TSC2 disrupt the interaction between hamartin and tuberin. Hum Mol Genet 2001; 10: Li Y, Inoki K, Guan K-L: Biochemical and functional characterizations of small GTPase rheb and TSC2 GAP activity. Mol Cell Biol 2004; 24: O Conner SE, Kwiatkowski DJ, Roberts PS, Wollmann RL, Huttenlocher PR: A family with seizures and minor features of tuberous sclerosis and a novel TSC2 mutation. Neurology 2003; 61: Mayer K, Goedbloed M, van Zijl K, Nellist M, Rott HD: Characterisation of a novel TSC2 missense mutation in the GAP related domain associated with minimal clinical manifestations of tuberous sclerosis. J Med Genet 2004; 41: e Jansen A, Sancak O, D Agostino D et al: Mild form of tuberous sclerosis complex is associated with TSC2 R905Q mutation. Ann Neurol 2006; 60: Inoki K, Corradetti MN, Guan K-L: Dysregulation of the TSC-mTOR pathway in human disease. Nat Genet 2005; 37: Supplementary Information accompanies the paper on European Journal of Human Genetics website ( European Journal of Human Genetics
156 BMC Medical Genetics BioMed Central Research article Identification of a region required for TSC1 stability by functional analysis of TSC1 missense mutations found in individuals with tuberous sclerosis complex Melika Mozaffari 1, Marianne Hoogeveen-Westerveld 1, David Kwiatkowski 2, Julian Sampson 3, Rosemary Ekong 4, Sue Povey 4, Johan T den Dunnen 5, Ans van den Ouweland 1, Dicky Halley 1 and Mark Nellist* 1 Open Access Address: 1 Department of Clinical Genetics, Erasmus Medical Centre, 3015 GE Rotterdam, The Netherlands, 2 Division of Experimental Medicine and Medical Oncology, Brigham and Womens Hospital, Boston MA 02115, USA, 3 Institute of Medical Genetics, University of Wales College of Medicine, Heath Park, Cardiff CF4 4XN, UK, 4 Research Department of Genetics, Evolution and Environment, University College London Wolfson House, 4 Stephenson Way, London, NW1 2HE, UK and 5 Department of Human and Clinical Genetics, Leiden University Medical Centre, 2333ZC Leiden, The Netherlands Melika Mozaffari - m.mozaffari@erasmusmc.nl; Marianne Hoogeveen-Westerveld - m.hoogeveen-westerveld@erasmusmc.nl; David Kwiatkowski - dk@rics.bwh.harvard.edu; Julian Sampson - Sampson@Cardiff.ac.uk; Rosemary Ekong - r.ekong@ucl.ac.uk; Sue Povey - s.povey@ucl.ac.uk; Johan T den Dunnen - ddunnen@humgen.nl; Ans van den Ouweland - a.vandenouweland@erasmusmc.nl; Dicky Halley - d.halley@erasmusmc.nl; Mark Nellist* - m.nellist@erasmusmc.nl * Corresponding author Published: 11 September 2009 BMC Medical Genetics 2009, 10:88 doi: / This article is available from: Received: 9 March 2009 Accepted: 11 September Mozaffari et al; licensee BioMed Central Ltd. This is an Open Access article distributed under the terms of the Creative Commons Attribution License ( which permits unrestricted use, distribution, and reproduction in any medium, provided the original work is properly cited. Abstract Background: Tuberous sclerosis complex (TSC) is an autosomal dominant disorder characterised by the development of hamartomas in a variety of organs and tissues. The disease is caused by mutations in either the TSC1 gene on chromosome 9q34, or the TSC2 gene on chromosome 16p13.3. The TSC1 and TSC2 gene products, TSC1 and TSC2, form a protein complex that inhibits signal transduction to the downstream effectors of the mammalian target of rapamycin (mtor). Recently it has been shown that missense mutations to the TSC1 gene can cause TSC. Methods: We have used in vitro biochemical assays to investigate the effects on TSC1 function of TSC1 missense variants submitted to the Leiden Open Variation Database. Results: We identified specific substitutions between amino acids 50 and 190 in the N-terminal region of TSC1 that result in reduced steady state levels of the protein and lead to increased mtor signalling. Conclusion: Our results suggest that amino acid residues within the N-terminal region of TSC1 are important for TSC1 function and for maintaining the activity of the TSC1-TSC2 complex. Background Tuberous sclerosis complex (TSC) is an autosomal dominant disorder characterised by the development of hamartomas in a variety of organs and tissues, including the brain, skin and kidneys [1,2]. Mutations in either the TSC1 gene on chromosome 9q34 [3], or the TSC2 gene on Page 1 of 12 (page number not for citation purposes)
157 BMC Medical Genetics 2009, 10:88 chromosome 16p13.3 [4] cause TSC. In most studies, 75-85% of individuals with TSC have been shown to carry a germ-line TSC1 or TSC2 mutation [5-9] and a further 5-10% carry TSC1 or TSC2 variants where it is not absolutely clear from the genetic data whether the change is disease-causing (a variant), or not (a neutral variant). To determine whether these unclassified variants are disease-causing, the effect of the changes on protein function can be investigated [10,11]. The TSC1 and TSC2 gene products, TSC1 and TSC2, interact to form a protein complex [12]. TSC2 contains a GTPase activating protein (GAP) domain and acts on the rheb GTPase to inhibit rheb-gtp-dependent stimulation of the mammalian target of rapamycin (mtor) [13]. The exact role of TSC1 in the TSC1-TSC2 complex is less clear, but it appears to be required for maintaining the stability, activity and correct intracellular localisation of the complex [14]. Inactivation of the TSC1-TSC2 complex results in activation of mtor and phosphorylation of the mtor targets p70 S6 kinase (S6K), ribosomal protein S6 and 4E- BP1 [15]. The effects of amino acid changes to TSC1 or TSC2 on TSC1-TSC2 complex formation, on the activation of rheb GTPase activity by the complex, and on the phosphorylation status of S6K and S6 can be determined [10,11,16]. Pathogenic missense changes towards the N- terminus of TSC2 prevent formation of the TSC1-TSC2 complex, while missense changes towards the C-terminus do not prevent TSC1-TSC2 binding but disrupt the rheb- GAP activity of TSC2 directly [10]. Pathogenic TSC1 missense changes are rare [5-9]. However, recent studies of TSC1 missense variants identified in bladder cancers [17] and in patients with TSC [11] have shown that TSC1 amino acid substitutions can be, reducing steady state levels of TSC1 and leading to increased mtor activity. Here, we test 13 TSC1 variants identified during mutation screening of individuals with TSC. Our analysis confirms that TSC1 missense mutations reduce steady state levels of TSC1, and result in increased mtor signalling. Furthermore, we find that the intracellular localisation of and neutral TSC1 variants is distinct. The TSC1 amino acid substitutions are clustered within the conserved, hydrophobic N-terminal region of TSC1, indicating that this region plays an important role in TSC1 function. Methods Comparative analysis of TSC1 amino acid substitutions TSC1 missense variants identified in individuals with TSC, or suspected of having TSC, and submitted to the LOVD TSC1 mutation database [18,19] were chosen for analysis. To predict whether the variants were likely to be, the amino acid substitutions were evaluated using the BLOSUM 62 and Grantham matrices [20,21], and a multiple sequence alignment analysis was performed using SIFT software [22,23]. Hydrophobicity plots and secondary structure predictions were generated using DNAMAN (Lynnon BioSoft), SABLE [24] and PSIPRED [25] software. To determine whether the identified changes were likely to have an effect on splicing, 3 different splice-site prediction programs were used [26-28]. Generation of constructs and antisera Expression constructs encoding myc-tagged TSC1 variants were derived using the QuikChange site-directed mutagenesis kit (Stratagene, La Jolla, CA, U.S.A.). In each case the complete open reading frame of the mutated construct was verified by sequence analysis. Other constructs used in this study have been described previously [10,11]. Antibodies were described previously [12] or purchased from Cell Signaling Technology (Danvers, MA, U.S.A.), except for a mouse monoclonal antibody against TSC2 which was purchased from Zymed Laboratories (San Francisco, CA, U.S.A.) and a rabbit polyclonal antibody against ubiquitin which was purchased from DAKO (Glostrup, Denmark). Effects of TSC1 variants on S6K T389 phosphorylation Immunoblot analysis of S6K T389 phosphorylation in cells over-expressing TSC1 variants was performed as described previously [11]. Briefly, 80% confluent HEK 293T cells in 24-well cell culture dishes were transfected with a 4:2:1 mixture of the TSC1, TSC2 and S6K expression constructs (0.7 μg DNA total) in 50 μl Dulbecco's modified Eagle medium (DMEM) containing 2.1 μg polyethyleneimine (Polysciences, Warrington, PA, U.S.A.). Where necessary, an empty expression vector (pcdna3; Invitrogen, Carlsbad, CA, U.S.A.) was added to make up the total amount of DNA. Twenty-four hours after transfection the cells were washed with cold PBS and lysed in 75 μl 50 mm Tris-HCl ph 8.0, 150 mm NaCl, 50 mm NaF and 1% Triton X100 containing protease inhibitors (Complete, Roche Molecular Biochemicals, Woerden, The Netherlands). After centrifugation ( g, 10 minutes, 4 C), the supernatant and pellet fractions were recovered for immunoblot analysis. The pellet fractions were resuspended in 100 μl 62.5 mm Tris-HCl ph 6.8, 10% glycerol, 300 mm 2-mercaptoethanol, 2% SDS and sonicated (8 μm, 15 seconds, 4 C) prior to gel electrophoresis. Samples were run on 4-12% SDS-PAGE Criterion gradient gels (BioRad, Hercules, CA, U.S.A.) and blotted onto nitrocellulose. Blots were analysed using near infra-red fluorescent detection on an Odyssey Infrared Imager (169 μm resolution, medium quality with 0 mm focus offset) (Li- Cor Biosciences, Lincoln, NE, U.S.A.). The integrated intensities of the protein bands relative to the wild-type TSC1 values were determined in at least 3 separate experiments using the Odyssey software (default settings with Page 2 of 12 (page number not for citation purposes)
158 BMC Medical Genetics 2009, 10:88 background correction; 3 pixel width border average method). Signal intensities were compared as described previously [29]. Proteosome-mediated degradation of TSC1 variants HEK 293T cells were transfected with expression constructs encoding TSC2, S6K and the different TSC1 variants. Twenty-four hours after transfection the culture medium was replaced with DMEM containing either 42 μm MG-132 (Sigma-Aldrich, St. Louis, MO, U.S.A.) or vehicle control. After 4 hours, insulin (200 nm; Sigma- Aldrich) or vehicle control was added to the culture medium and, after a further 30 minute incubation, the cells were harvested and analysed by immunoblotting, as before. Immunofluorescent detection of TSC1 variants HEK 293T cells were seeded onto glass coverslips coated with poly-l-lysine (Sigma-Aldrich), transfected with expression constructs encoding the TSC1 variants and processed for immunofluorescent microscopy as described previously [12]. Fixed, permeabilised cells were incubated with a rabbit polyclonal antibody specific for TSC2 [12] and a mouse monoclonal antibody specific for the TSC1 C-terminal myc epitope tag (9B11, Cell Signaling Technology), followed by fluorescein isothiocyanateand Cy3-coupled secondary antibodies against mouse and rabbit immunoglobulins (DAKO) respectively. Cells were studied using a Leica DM RXA microscope and Image Pro-Plus version 6 image analysis software. Results Comparative analysis of TSC1 amino acid substitutions We selected 13 TSC1 amino acid substitutions (TSC1 c.149t>c (p.l50p), c.153a>c (p.e51d), c.182t>c (p.l61p), c.278t>g (p.l93r), c.397g>t (p.v133f), c.568c>t (p.r190c), c.569g>c (p.r190p), c.1001c>t (p.s334l), c.1433a>g (p.e478g), c.1648c>g (p.q550e), c.1974c>g (p.d658e), c.1976c>t (p.a659v) and c.2420t>c (p.i807t)) that were either possible changes, or could not be excluded as neutral variants [18] (Table 1). In this group there was one confirmed de novo change, TSC1 c.182t>c (p.l61p), that was very likely to be. In one individual with TSC, 2 TSC1 missense changes, c.149t>c (p.l50p) and c.2420t>c (p.i807t), were reported. To establish whether either of these changes was responsible for TSC, or whether the combination of both changes was required to inactivate TSC1, we tested a L50P-I807T double variant as well as the L50P and I807T single variants. To predict whether the amino acid substitutions were likely to be, we determined the scores of the BLOSUM 62 [20] and Grantham [21] amino acid substitution matrices for all the missense variants in the LOVD TSC1 database (Figure 1A and 1B). These scores give an indication of the differences between amino acid pairs based on amino acid composition, polarity and molecular volume, as well as substitution frequencies. Both matrices indicated that the amino acid substitutions listed in the LOVD TSC1 database in general become more conservative towards the C-terminal of TSC1. We also performed a SIFT analysis [23] using a multiple sequence alignment of TSC1 derived from 14 different species (human, chimpanzee, maccaca, cow, dog, horse, mouse, rat, chicken, pufferfish, honey bee, fruitfly, mosquito and fission yeast). The SIFT algorithm combines information from both the chemical structure of the individual amino acids and the evolutionary conservation of the protein to predict for each amino acid residue which substitutions can be tolerated by the protein. The results of the SIFT analysis are shown in Figure 1C and Table 1. Overall, the N-terminal (amino acids 1-270) and C-terminal (amino acids ) regions of TSC1 did not tolerate amino acid substitutions while the central region (amino acids ) was predicted to be more tolerant (Figure 1C). Of the 13 Table 1: Summary of the functional analysis of TSC1 missense variants from the LOVD TSC1 mutation database Nucleotide change Exon Amino acid substitution SIFT prediction Effect on TSC1 function? (t-test) Conclusion c.149t>c 4 p.l50p not tolerated yes (p = 0.03) c.153a>c 4 p.e51d tolerated no (p = 0.3) neutral variant c.182t>c 4 p.l61p not tolerated yes (p = 0.002) c.278t>g 5 p.l93r not tolerated yes (p = 0.03) c.397g>t 6 p.v133f not tolerated yes (p = 0.005) c.569g>c 7 p.r190p not tolerated yes (p = 0.004) c.568c>t 7 p.r190c not tolerated no (p = 0.19) neutral variant c.1001c>t 10 p.s334l tolerated no (p = 0.19) neutral variant c.1433a>g 14 p.e478g tolerated no (p = 0.6) possible splice mutation c.1648c>g 15 p.q550e tolerated no (p = 0.9) neutral variant c.1974c>g 15 p.d658e tolerated no (p = 0.13) neutral variant c.1976c>t 15 p.a659v tolerated no (p = 0.1) neutral variant c.2420t>c 19 p.i807t tolerated no (p = 0.18) neutral variant Page 3 of 12 (page number not for citation purposes)
159 BMC Medical Genetics 2009, 10:88 Predicted effects of amino acid substitutions on TSC1 Figure 1 Predicted effects of amino acid substitutions on TSC1. (A) Plot of BLOSUM 62 scores for substitutions in the LOVD TSC1 mutation database. Positive values represent conservative substitutions, negative values represent non-conservative substitutions. Substitutions investigated in this study are indicated. (B) Plot of Grantham scores for substitutions in the LOVD TSC1 mutation database. The higher the Grantham score, the less conservative the substitution. Substitutions investigated in this study are indicated. (C) SIFT analysis of TSC1. Each amino acid is represented by a box. Solid green boxes represent positions that are completely tolerant (all substitutions possible); open green boxes represent positions where 1 or 2 substitutions are not tolerated. Solid red boxes represent intolerant positions (no substitutions tolerated); open red boxes represent positions where 3 or fewer substitutions are tolerated. Empty boxes represent positions where between 3 and 17 substitutions are tolerated. The positions of substitutions tested in this study are indicated in blue. (D) Comparative hydrophobicity profile of wild-type TSC1 with variants predicted by SIFT analysis to be tolerated. Hydrophobicity values were calculated for each amino acid using DNAMAN software (default parameters). Differences in the predicted hydrophobicity per amino acid were plotted. Values > 0 indicate an increase in hydrophobicity of the variant relative to wild-type; values < 0 indicate a decrease. Variants analysed as part of this study are indicated. (E). Comparative hydrophobicity profile of wild-type TSC1 with variants predicted by SIFT analysis not to be tolerated. substitutions selected for this study, 7 were predicted to be tolerated and therefore unlikely to be (Table 1). Of these, 5 were located in the central, substitutiontolerant region of TSC1 (amino acids ). Six substitutions were predicted not to be tolerated and therefore likely to be. All of these changes were located in the substitution-intolerant N-terminal region (amino acids 1-270). Finally, we investigated the effect of the substitutions on the hydrophobicity of TSC1 (Figure 1D and 1E). Three substitutions, p.e51d, p.q550e and p.d658e, had no significant effect. These were all predicted by the SIFT algorithm to be tolerated changes. Of the remaining tolerated changes, p.s334l, p.e478g and p.a659v increased the hydrophobicity, while the p.i807t substitution had the opposite effect (Figure 1D). In the group of changes not tolerated by the SIFT analysis, the p.l50p, p.l61p, p.l93r and p.v133f substitutions decreased the hydrophobicity while the p.r190c and p.r190p substitutions increased the hydrophobicity (Figure 1E). Page 4 of 12 (page number not for citation purposes)
160 BMC Medical Genetics 2009, 10:88 Splice site prediction analysis of the TSC1 nucleotide changes was performed using 3 independent splice site prediction programs. Neither NetGene2 [26] nor Human Splicing Finder [28] predicted any splicing defects for any of the 13 changes. In contrast, NNSPLICE 0.9 [27] predicted that the TSC1 c.1433a>g (p.e478g) change would result in the creation of an alternative splice donor site 6 nucleotides downstream of the wild-type exon 14 donor site. Furthermore, the wild-type site was no longer recognised as a splice donor site by the NNSPLICE 0.9 algorithm. If this prediction is correct, the new splice donor site created by the TSC1 c.1433a>g change would result in the insertion of 2 extra codons (encoding amino acids GN) between codons 479 and 480, in addition to the p.e478g substitution. Functional analysis of TSC1 amino acid substitutions We characterised the effects of the 13 TSC1 single missense variants and the L50P/I807T double variant on the activity of the TSC1-TSC2 complex. We compared the 14 variants to wild-type TSC1 and the TSC1-L117P variant [11]. As shown in Figure 2, the L50P, L61P, L93R, V133F and R190P amino acid substitutions all resulted in reduced levels of TSC1 (Figure 2A and 2B) and increased mtor activity, as estimated by the T389 phosphorylation status of S6K (Figure 2A and 2D). These substitutions all had the same effect on TSC1 as the previously-characterised L117P substitution [11]. In each case, the T389/S6K ratio was significantly different from wild-type TSC1 (unpaired t-test p values all < 0.05; Table 1). We did not observe any differences between the L50P variant and the L50P/I807T double variant. Both variants were detected at low levels and did not inhibit S6K phosphorylation as effectively as wild-type TSC1. The E51D, R190C, S334L, E478G, Q550E, D658E, A659V and I807T variants were detected at comparable levels to wild-type TSC1 (Figure 2A and 2B) and S6K T389 phosphorylation was reduced to the same levels as in the presence of wild-type TSC1 (Figure 2A and 2D). In each case, there was no significance difference in the T389/S6K ratio compared to wild-type TSC1 (unpaired t-test p values > 0.05; Table 1). TSC1 variants are degraded by the proteosome We considered two possible reasons for why the TSC1 L50P, L61P, L93R, V133F, R190P and L50P/I807T variants were detected at low levels. One possibility was that the variants were insoluble and therefore not present in the cell lysate fraction analysed by immunoblotting. We analysed the insoluble post cell lysis pellet fractions, but did not detect any of the TSC1 variants in these fractions (data not shown). The second possibility was that the L50P, L61P, L93R, V133F, R190P and L50P/I807T variants were subject to rapid turn-over and degradation. Therefore, we treated cells expressing wild-type TSC1 or the L50P, L61P, L93R, V133F, R190P, L50P/I807T or L117P variants with the proteosome-inhibitor MG-132 [30]. After 4 hours treatment we observed an increase in the L50P, L61P, L93R, V133F, R190P, L50P/I807T and L117P signals when cells were treated with MG-132 (Figure 3A). We estimated mtor activity in MG-132-treated cells by measuring the T389 phosphorylation status of S6K in cells expressing the L50P or L117P variants and treated with MG-132 and/or insulin (Figure 3B-3D). The L50P and L117P signals were increased relative to the TSC1 wildtype signals in unstimulated cells treated with MG-132 as well as in cells treated with MG-132 and stimulated with 200 nm insulin for 30 minutes (Figure 3B and 3C). In (unstimulated and insulin stimulated) cells not treated with MG-132, wild-type TSC1 was detected at higher levels than the L50P and L117P variants, consistent with the analysis shown in Figure 2. In untreated cells, S6K T389 phosphorylation was increased in cells expressing the L50P and L117P variants, compared to cells expressing wild-type TSC1, consistent with the analysis shown in Figure 2. MG-132 treatment did not affect the detected levels of total S6K (Figure 3A), but in cells expressing the L50P and L117P variants, S6K T389 phosphorylation was increased compared to cells expressing wild-type TSC1, in both insulin-stimulated and unstimulated cells (Figure 3B and 3D). Intracellular localisation of the TSC1 variants Exogenous expression of the TSC1 E51D variant resulted in the formation of large, cytoplasmic TSC1 protein aggregates (Figure 4A), consistent with previous results with wild-type TSC1 [31]. Coexpression of TSC2 resulted in a dramatic reduction in the number of aggregates, and both TSC2 and the TSC1 E51D variant were detected throughout the cytoplasm (Figure 4C and 4D). We observed the same expression pattern for the TSC1 R190C, S334L, E478G, Q550E, D658E, A659V and I807T variants (data not shown). In contrast to wild-type TSC1 and the E51D, R190C, S334L, E478G, Q550E, D658E, A659V and I807T variants, the L50P variant did not form large cytoplasmic aggregates when over-expressed in HEK 293T cells. Instead, the variant was expressed relatively uniformly throughout the cytoplasm (Figure 4F). This localisation was unaffected by coexpression of TSC2 (Figure 4H and 4I) or by MG-132 treatment (Figure 4K). The intracellular localisation patterns of the L61P, L93R, V133F and R190P variants were indistinguishable from the L50P variant (data not shown). Page 5 of 12 (page number not for citation purposes)
161 (page number not for citation purposes) Page 6 of 12 Figure 2 (see legend on next page) L SOP E51D L61P L93R L117P V1 33F R190P R190C S334L E478G Q550E 0 658E A 659V 1807T L50P/1807T T SC1 T SC2/S6K only S6K only contro LSOP E51D L61P L93R L 117P V1 33F R190P R1 90C S334L E478G Q550E D658E A659V 1807T L50P~80 7T TSC1 TSC2/S6K only S6K only control 0 ;, 0 :.. ~ -, ~ ~ ---j ----j :.. Oo 0 ;, -t en (") N "' en en " m LSOP E510 L61P L93R L 117P V1 33F R190P R190C S334L E478G Q550E D658E A659V 1807T L 50P~8 0 7T TSC1 T SC2/S6K only S6K on ty control V1 33F "' R1 90C,..., S334L A659V.., "' "' ;:; * * * * i * 1807T ~. TSC1.,E... <only 1 * S6Konly * cont rol ~ :;: ~ * 0:.. Cil ~ "' 0 -t w CD!e en en " aj c ' I I I I I "' ;>; I I I I I I I I I I I I I -i "' -i "' ~ 1 I I I I I I I I I I I I I I ' I -i (") "' "' <.,-0-<> ~"')'<> <6')'-<> <s.,i> )> <)')' t-)' "'-<>.r.,~ 1>)'.9. "-<> 1>)'.9..s-.,"" u'~ ~"> d'q o.,.~ <:>~ ()6' "'6'~ '16'~ s~,- 1s>o>r + <.,-0-<> -i "ld! (") )-. 0>)' "' ~ <!'")' )'~ "' ;>; "~ <1'6'1- il'6'1" (\0 0-')1- ~<I-, 0/ BMC Medical Genetics 2009, 10:88
162 BMC Medical Genetics 2009, 10:88 Immunoblot analysis of TSC1 variants Figure 2 (see previous page) Immunoblot analysis of TSC1 variants. (A) Cells expressing the TSC1 variants and control cells expressing wild-type TSC1 and S6K only (TSC1/S6K), TSC2 and S6K only (TSC2/S6K), S6K only (S6K) or empty vector only (control) were analysed by immunoblotting. (B) Quantification of the immunoblot signals for the TSC1 variants. The integrated intensities of the signals for each variant, relative to wild-type TSC1, were determined in 3 independent experiments. Standard deviations are indicated. Signals significantly reduced compared to wild-type (unpaired t-test, p values < 0.05) are indicated with asterisks. (C) Quantification of the TSC2 signals. The TSC2 signals in the presence of the different TSC1 variants were not significantly different from the signal in the presence of wild-type TSC1 (unpaired t-test, p values >0.05). (D) Inhibition of S6K T389 phosphorylation in the presence of the TSC1 variants. The ratio of the S6K T389 phosphorylation signal to the total S6K signal (T389/ S6K) was determined relative to wild-type TSC1 (wild-type TSC1 T389/S6K ratio = 1). Standard deviations are indicated. Variants with a significantly increased T389/S6K ratio (unpaired t-test p values < 0.05) are indicated with asterisks. (E) Quantification of the total S6K signals. The total S6K signals in the presence of the different variants were not significantly different to wild-type TSC1 (unpaired t-test, p values >0.05). Discussion We investigated the effects of 13 putative amino acid substitutions on TSC1 function. Our findings are summarised in Table 1. The TSC1 c.149t>c (p.l50p), c.182t>c (p.l61p), c.278t>g (p.l93r), c.397g>t (p.v133f) and c.569g>c (p.r190p) changes resulted in reduced levels of TSC1, a reduction in the TSC1-TSC2- dependent inhibition of mtor activity and a distinct intracellular expression pattern compared to wild-type TSC1. We conclude that these changes are. According to the LOVD TSC1 mutation database the p.l61p and p.l93r substitutions are probably [18]. Our functional analysis supports this conclusion. The p.l50p, p.v133f and p.r190p substitutions are classified as being of unknown ity in the database. Our data indicates that these changes are. Several studies indicate that TSC1 mutations are associated with a less severe clinical presentation in TSC patients [7-9] and further study is required to determine whether patients with a TSC1 missense mutation follow this pattern, or have a distinct phenotypic spectrum compared to other TSC patient groups. The c.153a>c (p.e51d), c.568c>t (p.r190c), c.1001c>t (p.s334l), c.1648c>g (p.q550e), c.1974c>g (p.d658e), c.1976c>t (p.a659v) and c.2420t>c (p.i807t) substitutions did not affect TSC1 in our assays and were predicted to have no effect on TSC1 mrna splicing. The LOVD TSC1 mutation database lists the c.153a>c (p.e51d), c.568c>t (p.r190c) and c.1001c>t (p.s334l) variants as probably not, and our functional analysis indicates that they are neutral variants. Furthermore, mutation screening in additional individuals with TSC resulted in the identification of definite TSC2 mutations in patients carrying the c.153a>c (p.e51d), c.568c>t (p.r190c) and c.1001c>t (p.s334l) substitutions, confirming the classification of these variants as non- (data not shown). The LOVD TSC1 mutation database lists the c.1648c>g (p.q550e) and c.2420t>c (p.i807t) variants as being of unknown ity. Our analysis indicates that these variants are not, although we could not confirm experimentally that they do not affect TSC1 mrna splicing. The c.1433a>g (E478G) substitution is listed as being of unknown ity and did not affect TSC1 function in our assays. However, one of three splice site prediction programs identified a potential effect of this substitution on splicing. We did not have access to RNA from this particular individual so we compared the activity of the protein product of the predicted splice isoform to wild-type TSC1, the E478G variant and the L117P variant. We did not observe any differences between the predicted TSC1 E478GinsGN variant and either wild-type TSC1 or the E478G [see Additional Files 1 and 2]. Therefore, we did not find any evidence that the c.1433a>g substitution was. All of the amino acid substitutions that affected TSC1 function in our assays were in the N-terminal region of TSC1 that was shown by our SIFT analysis to be relatively intolerant of amino acid changes (amino acids 1-270; see Figure 1). Two amino acid substitutions from this region, p.e51d and p.r190c, did not affect TSC1 function in our assays. Aspartate (E) and glutamate (D) are acidic amino acids. The BLOSUM 62 and Grantham matrices classify this substitution as conservative (Figure 1A and 1B) and our SIFT analysis predicted that the p.e51d substitution should be tolerated (Table 1). Therefore, in this case, the experimental data were in agreement with the in silico predictions. In contrast, the p.r190c substitution was nonconservative according to the BLOSUM 62 and Grantham matrices and was not tolerated according to our SIFT analysis. The predictions were therefore inaccurate for this particular amino acid substitution since the functional analysis did not reveal an effect on TSC1 function, and genetic analysis indicated that the substitution was not. This result demonstrates that a conclusion Page 7 of 12 (page number not for citation purposes)
163 BMC Medical Genetics 2009, 10:88 A ~~.._q ~~ 4 ~ "ro..j.::."" ~"._OJ ~~... ~<:> -._q ~ 'V v" "~ MG TSC2 --- TSC _,_ _.. - -,_., Ub 8 + insulin/mg MG-132.,~...::.q.-,v" 'V 'V -<:...::.q.-,v".,<:>q 'V 'V -<: TSC S6K insulin.,~...::.q.-,v" 'V 'V -<: r ~ basal.,~...::.q.-,v" 'V 'V -<: TSC2 TSC1 T389 S6K c TSC1 D LSOP D L117P + insulin/mg MG-132 +insulin basal D TSC1 D LSOP D L117P Figure 3 (see legend on next page) Page 8 of 12 (page number not for citation purposes)
164 BMC Medical Genetics 2009, 10:88 Proteosome-mediated degradation of TSC1 variants Figure 3 (see previous page) Proteosome-mediated degradation of TSC1 variants. (A) Immunoblot showing levels of TSC2, wild-type TSC1 and TSC1 variants in cells treated with 42 μm MG-132 for 4 hours, or left untreated. The blot was incubated with an antibody against ubiquitin (Ub) to show the effect of the MG-132 treatment. (B) Immunoblot showing levels of TSC2, wild-type TSC1 and the L50P and L117P variants, S6K and T389-phosphorylated S6K (T389) in cells treated with 42 μm MG- 132 and 200 nm insulin (+ insulin/mg-132), 42 μm MG-132 only (+ MG-132), 200 nm insulin only (+ insulin), or left untreated (basal). (C) Quantification of the immunoblot signals, showing MG-132-dependent inhibition of proteosome-mediated degradation of the TSC1 L50P and L117P variants. The mean integrated intensities (arbitrary units) of the signals for wild-type TSC1 (black), and the L50P (grey) and L117P (white) variants are shown. MG-132 treatment resulted in a relative increase in the signals for the L50P and L117P variants compared to wild-type TSC1 in both insulin stimulated and unstimulated cells. (D) Quantification of the immunoblot signals showing increased S6K T389 phosphorylation in MG-132 treated cells expressing the L50P or L117P variants. S6K T389 phosphorylation was determined as in Figure 2. (T389/S6K ratio). Compared to MG-132-treated cells expressing wild-type TSC1, MG-132 treatment of cells expressing the L50P and L117P variants increased the T389/S6K ratio. with respect to ity based on in silico analysis only should be made with caution. To provide clinicians and researchers with the maximum amount of information, gene variant databases should move towards incorporating both in vitro and in silico data [32]. We will add the functional and in silico results on the variants described here to the LOVD TSC1 database as part of the individual entries. We will include the BLOSUM 62, Grantham and SIFT scores as well as the potential splice effects of the different variants. However, for all apparent missense variants, conclusions with regard to ity will continue to rely on clinical, family and functional data. As the above example shows, although in silico analysis is a valuable research tool, it is not yet reliable enough to inform clinical decisions. All the TSC1 amino acid substitutions identified to date map between residues 50 and 224 (this study and [11]). One explanation for the apparent clustering of amino acid substitutions to this region is that it is critical for TSC1 function. Alternatively, these substitutions may simply be less conservative than the neutral variants we tested. Although the substitutions between amino acids 50 and 190 identified in this study were not conservative, there was no clear distinction between these changes and other neutral substitutions. For example, as shown in Figure 1, the neutral p.r190c variant is a non-conservative, non-tolerated substitution that is predicted to have a large effect on TSC1 hydrophobicity, while the p.r190p variant is a more conservative substitution and has a less dramatic effect on TSC1 hydrophobicity. Similarly, the p.v133f substitution is more conservative than the p.r190c substitution and has a relatively mild effect on TSC1 hydrophobicity, yet still has a dramatic effect on TSC1 function in our assays. In addition to the p.e51d and p.r190c substitutions, 6 other TSC1 amino acid substitutions did not affect TSC1 function in our assays. The neutral p.s334l and p.e478g substitutions are non-conservative changes located within the substitution-tolerant central region of TSC1 defined by the SIFT analysis (amino acids ; see Figure 1). The neutral, non-conservative p.i807t substitution lies outside this central region, but was also predicted by the SIFT algorithm to be tolerated (Table 1). The neutral p.q550e, p.a659v and p.d658e substitutions are all conservative, tolerated changes. The results of the in silico and functional analyses are consistent with the N-terminal of TSC1 being a conserved, substitution-intolerant region that has an important role in maintaining TSC1 expression and activity in the cell. The L50P, L61P, L93R, V133F and R190P variants were detected at lower levels compared to wild-type TSC1 and the E51D, R190C, S334L, Q550E, D658E, A659V and I807T variants. Inhibition of proteosome-mediated degradation resulted in increased levels of the L50P and L117P variants, indicating that the TSC1 variants are normally rapidly degraded by the proteosome. Interestingly, increasing the levels of the TSC1 L50P and L117P variants by inhibiting proteosome activity resulted in an increase in mtor activity, as estimated by the extent of S6K T389 phosphorylation. Therefore, increased expression of the L50P and L117P variants had a dominant negative effect on mtor signalling. One possible explanation for this effect is that the mutant variants sequester TSC2 in inactive TSC1-TSC2 complexes, thereby reducing the capacity of the cells to inhibit mtor activity. Therefore, MG-132 treatment may help distinguish more clearly between and non- TSC1 variants. It is unlikely that this dominant negative effect is significant in vivo in TSC patients because, as our studies indicate, the L50P and L117P variants are rapidly degraded compared to wild-type TSC1 (Figure 2A). However, it could provide an explanation for the relative scarcity of TSC1 missense mutations. It is possible that other missense variants are stable and do have a dominant negative Page 9 of 12 (page number not for citation purposes)
 Page 10 of 12 (page number")
165 BMC Medical Genetics 2009, 10:88 Figure 4 (see legend on next page) Page 10 of 12 (page number not for citation purposes)
166 BMC Medical Genetics 2009, 10:88 Intracellular localisation of TSC1 variants detected by immunofluorescence microscopy Figure 4 (see previous page) Intracellular localisation of TSC1 variants detected by immunofluorescence microscopy. (A - B) Immunofluorescence microscopy of cells expressing the TSC1 E51D variant. (A) Punctate cytoplasmic localisation of the E51D variant; (B) DAPI nuclear stain. White scale bar: 5 μm.(c - E) Immunofluorescence microscopy of cells coexpressing TSC2 and the E51D variant. (C) Diffuse cytoplasmic localisation of the E51D variant in the presence of TSC2; (D) Diffuse cytoplasmic localisation of TSC2; (E) DAPI nuclear stain. White scale bar: 5 μm. (F - G) Immunofluorescence microscopy of cells expressing the TSC1 L50P variant. (F) Diffuse cytoplasmic localisation of the L50P variant; (G) DAPI nuclear stain. White scale bar: 5 μm. (H - J) Immunofluorescence microscopy of cells coexpressing TSC2 and the L50P variant. (H) Diffuse cytoplasmic localisation of the L50P variant in the presence of TSC2; (I) Diffuse cytoplasmic localisation of TSC2; (J) DAPI nuclear stain. White scale bar: 5 μm. (K - L) Immunofluorescence microscopy of cells expressing the TSC1 L50P variant and treated with MG-132. (K) Diffuse cytoplasmic localisation of the L50P variant after MG-132 treatment; (L) DAPI nuclear stain. White scale bar: 5 μm effect on TSC1-TSC2 function in vivo that is incompatible with embryonic survival. Further study is required to explore in more detail how amino acids close to the N-terminal (residues ) are important for TSC1 function. One possibility is that they are necessary for the proposed membrane localisation of TSC1 [33]. Alternatively, they may mediate other inter- or intramolecular interactions. Our observation that amino acid substitutions prevent the formation of large TSC1-containing aggregate structures suggests that amino acids may help mediate TSC1 homodimerisation. Conclusion We have analysed 13 TSC1 variants identified in TSC patients that cause missense changes to the TSC1 protein, and identified 5 substitutions. Our data confirm that functional assays can be used to differentiate between neutral and variants, facilitating the identification of mutations in individuals with TSC and providing insight into how specific amino acid residues contribute to protein function. Amino acids close to the N-terminal of TSC1 (amino acids ) are essential for TSC1 function. Amino acid changes to this region prevent the formation of large TSC1 aggregates and promote proteosome-mediated degradation of the protein, thereby reducing steady state levels of TSC1 and resulting in increased signalling through mtor. Rapid degradation of the mutant TSC1 isoforms in vivo most likely prevents the possible dominant negative effects of these variants on TSC1-TSC2-dependent inhibition of mtor signalling. Abbreviations TSC: tuberous sclerosis complex; GAP: GTPase activating protein; mtor: mammalian target of rapamycin; S6K: p70 S6 kinase. Competing interests The authors declare that they have no competing interests. Authors' contributions MM, MHW and MN performed the practical work; mutation information was provided by DK, JS, AvdO and DH; RE, SP and JdD are responsible for curation of the LOVD TSC1 mutation database. The manuscript was drafted by MN and read and approved by all authors. Additional material Additional file 1 Additional Figure 1: Inhibition of S6K-T389 phosphorylation by the TSC1 E478GinsGN variant. Figure showing the inhibition of S6K-T389 phosphorylation by the TSC1. E478GinsGN predicted splice variant Click here for file [ Additional file 2 Figure Legend Additional Figure 1: Inhibition of S6K-T389 phosphorylation by the TSC1 E478GinsGN variant. Figure legend to Additional Figure 1. Click here for file [ Acknowledgements Financial support was provided by the U.S. Department of Defense Congressionally-Directed Medical Research Program (grant #TS060052), NIH NINDS NS31535 and the Tuberous Sclerosis Alliance. The authors report no conflicts of interest. References 1. Gomez M, Sampson J, Whittemore V, eds: The tuberous sclerosis complex Oxford, UK: Oxford University Press; Roach ES, DiMario FJ, Kandt RS: Tuberous sclerosis consensus conference: recommendations for diagnostic evaluation. National Tuberous Sclerosis Association. J Child Neurol 1999, 14: van Slegtenhorst M, de Hoogt R, Hermans C: Identification of the tuberous sclerosis gene TSC1 on chromosome 9q34. Science 1997, 277: The European Chromosome 16 Tuberous Sclerosis Consortium: Identification and characterization of the tuberous sclerosis gene on chromosome 16. Cell 1993, 75: Jones AC, Shyamsundar MM, Thomas MW: Comprehensive mutation analysis of TSC1 and TSC2, and phenotypic correlations Page 11 of 12 (page number not for citation purposes)
167 BMC Medical Genetics 2009, 10:88 in 150 families with tuberous sclerosis. Am J Hum Genet 1999, 64: Dabora SL, Jozwiak S, Franz DN: Mutational analysis in a cohort of 224 tuberous sclerosis patients indicates increased severity of TSC2, compared with TSC1, disease in multiple organs. Am J Hum Genet 2001, 68: Sancak O, Nellist M, Goedbloed M: Mutational analysis of the TSC1 and TSC2 genes in a diagnostic setting: genotype-phenotype correlations and comparison of diagnostic DNA techniques in tuberous sclerosis complex. Eur J Hum Genet 2005, 13: Niida Y, Lawrence-Smith N, Banwell A: Analysis of both TSC1 and TSC2 for germline mutations in 126 unrelated patients with tuberous sclerosis. Hum Mutat 1999, 14: Au K-S, Williams AT, Roach ES: Genotype/phenotype correlation in 325 individuals referred for a diagnosis of tuberous sclerosis complex in the United States. Genet Med 2007, 9: Nellist M, Sancak O, Goedbloed MA: Distinct effects of single amino acid changes to tuberin on the function of the tuberinhamartin complex. Eur J Hum Genet 2005, 13: Nellist M, Heuvel D van den, Schluep D: Missense mutations to the TSC1 gene cause tuberous sclerosis complex. Eur J Hum Genet 2009, 17: van Slegtenhorst M, Nellist M, Nagelkerken B: Interaction between hamartin and tuberin, the TSC1 and TSC2 gene products. Hum Mol Genet 1998, 7: Li Y, Corradetti MN, Inoki K: TSC2: filling the GAP in the mtor signaling pathway. Trends Biochem Sci 2003, 29: Rosner M, Hanneder M, Siegel N: The tuberous sclerosis gene products hamartin and tuberin are multifunctional proteins with a wide spectrum of interacting partners. Mut Res 2008, 658: Huang J, Manning BD: The TSC1-TSC2 complex: a molecular switchboard controlling cell growth. Biochem J 2008, 412: Nellist M, Sancak O, Goedbloed MA: Functional characterisation of the TSC1-TSC2 complex to assess multiple TSC2 variants identified in single families affected by tuberous sclerosis complex. BMC Med Genet 2008, 9: Pymar LS, Platt FM, Askham JM: Bladder tumour-derived somatic TSC1 missense mutations cause loss of function via distinct mechanisms. Hum Mol Genet 2008, 17: Tuberous sclerosis database - Leiden Open Variation Database [ 19. Fokkema IF, den Dunnen JT, Taschner PE: LOVD: easy creation of a locus-specific sequence variation database using an "LSDBin-a-box" approach. Hum Mutat 2005, 26: Henikoff S, Henikoff JG: Amino acid substitution matrices from protein blocks. Proc Natl Acad Sci USA 1992, 89: Grantham R: Amino acid difference formula to help explain protein evolution. Science 1973, 185: Ng PC, Henikoff S: Predicting the effects of amino acid substitutions on protein function. Annu Rev Genomics Hum Genet 2006, 7: Ng PC, Henikoff S: Accounting for human polymorphisms predicted to affect protein function. Genome Res 2002, 12: Adamczak R, Porollo A, Meller J: Accurate Prediction of Solvent Accessibility Using Neural Networks Based Regression. Proteins: Structure, Function and Bioinformatics 2004, 56: Jones DT: Protein secondary structure prediction based on position-specific scoring matrices. J Mol Biol 1999, 292: NetGene2 Server [ 27. BDGP: Splice Site Prediction by Neural Network [ Human Splicing Finder [ 29. Coevoets R, Arican S, Hoogeveen-Westerveld M: A reliable cellbased assay for testing unclassified TSC2 gene variants. Eur J Hum Genet 2009, 17(3): Lee DH, Goldberg AL: Proteasome inhibitors: valuable new tools for cell biologists. Trends Cell Biol 1998, 8: Nellist M, van Slegtenhorst MA, Goedbloed M: Characterization of the cytosolic tuberin-hamartin complex: tuberin is a cytosolic chaperone for hamartin. J Biol Chem 1999, 274: Cotton RG, Auerbach AD, Axton M: Genetics. The Human Variome Project. Science 2008, 322: Cai SL, Tee AR, Short D: Activity of TSC2 is inhibited by AKTmediated phosphorylation and membrane partitioning. J Cell Biol 2006, 173: Pre-publication history The pre-publication history for this paper can be accessed here: pub Publish with BioMed Central and every scientist can read your work free of charge "BioMed Central will be the most significant development for disseminating the results of biomedical research in our lifetime." Sir Paul Nurse, Cancer Research UK Your research papers will be: available free of charge to the entire biomedical community peer reviewed and published immediately upon acceptance cited in PubMed and archived on PubMed Central yours you keep the copyright Submit your manuscript here: BioMedcentral Page 12 of 12 (page number not for citation purposes)
168 J Neuropathol Exp Neurol Copyright Ó 2009 by the American Association of Neuropathologists, Inc. Vol. 68, No. 10 October 2009 pp. 1136Y1146 ORIGINAL ARTICLE Hamartin Variants That Are Frequent in Focal Dysplasias and Cortical Tubers Have Reduced Tuberin Binding and Aberrant Subcellular Distribution In Vitro Céline Lugnier, MS, Michael Majores, MD, Jana Fassunke, PhD, Katharina Pernhorst, MSc, Pitt Niehusmann, MD, Matthias Simon, MD, Mark Nellist, PhD, Susanne Schoch, PhD, and Albert Becker, MD Abstract Focal cortical dysplasia type IIb is characterized by epilepsyassociated malformations that are often composed of balloon cells and dysplastic neurons. There are many histopathologic similarities between focal cortical dysplasia type IIb and cortical tubers in tuberous sclerosis complex (TSC), an autosomal-dominant phakomatosis caused by mutations in the TSC1 or TSC2 genes that encode hamartin and tuberin. We previously found that an allelic variant of TSC1 (hamartin H732Y ) is increased in focal cortical dysplasia type IIb. Here, we investigated the subcellular localization of hamartin H732Y and its interaction with tuberin in vitro. Coimmunoprecipitation assays with tuberin revealed reduced tuberin binding of hamartin H732Y compared with wild-type hamartin. Tuberin binding was also reduced for 2 TSC1 stop mutants (hamartin R692X and hamartin R786X ) that are present in brain lesions of TSC patients. Colocalization assays of hamartin and tuberin were performed in HEK293T cells, and the subcellular localization of the hamartin variants were studied using immunocytochemistry. There was an impairment of tuberin binding of hamartin H732Y and aberrant nuclear distribution of hamartin H732Y in these cells, whereas hamartin R692X and hamartin R786X were, like wild-type tuberin, localized in the cytoplasm. These data suggest a fundamental functional impairment of hamartin H732Y and the 2 TSC1 stop mutants hamartin R692X and From the Departments of Neuropathology (CL, MM, JF, KP, PN, SS, AB), Pathology (MM, JF), Epileptology (PN), and Neurosurgery (MS), University of Bonn Medical Center, Bonn, Germany; and Department of Clinical Genetics, Erasmus Medical Centre, Rotterdam, The Netherlands (MN). Send correspondence and reprint requests to: Albert J. Becker, MD, Department of Neuropathology, University of Bonn Medical Center, Sigmund- Freud-Str. 25, D Bonn, Germany; albert_becker@uni-bonn.de Céline Lugnier and Michael Majores contributed equally to the work. This work is supported by Deutsche Forschungsgemeinschaft (SFB TR3, C6, B8, Albert Becker, Susanne Schoch; KForG BInnate Immunity[ TP2, Albert Becker; Emmy Noether program: Susanne Schoch; SFB-645: Susanne Schoch), Deutsche Krebshilfe (Jana Fassunke, Michael Majores, Albert Becker), Bundesministerium für Bildung und Forschung (NGFNplus, 01GS08122; Albert Becker, Susanne Schoch), European Union EPICURE (Albert Becker), and the BONFOR program of the University of Bonn Medical Center (Albert Becker, Michael Majores, Susanne Schoch). Online-only color figures are available at hamartin R786X in vitro. Future studies will be needed to characterize the roles of these TSC1 sequence variants in the genesis of dysplastic epileptogenic developmental brain lesions. Key Words: Amino acid exchange, Hamartin, Insulin receptor signaling pathway, mtor, Subcellular distribution, Tuberin. INTRODUCTION Tuberous sclerosis complex (TSC) is an autosomaldominant multiorgan disorder characterized by benign tumors and dysplastic lesions in many organs, including skin, kidney, lungs, heart, and brain (1, 2). Cerebral cortical tubers are frequently composed of large dysmorphic neurons and giant cells. Cortical dysplasias associated with focal epilepsies consist of dysplastic cytomegalic neurons and balloon cells (focal cortical dysplasia type IIb [FCD IIb ] according to the so-called Palmini classification [3]; Fig. 1). Thus, they resemble cortical tubers. Patients with FCD IIb generally lack additional features of a neurocutaneous phakomatosis (4). Tuberous sclerosis complex is caused by mutations in TSC1 on chromosome 9q34 (5) or TSC2 on chromosome 16p13.3 (6, 7). Remarkably, TSC1/TSC2 mutations are only detected in approximately 85% of TSC patients (8). Hamartin and tuberin, the corresponding gene products, form a heterodimer operating as a tumor suppressor in the phosphatidylinositol 3-kinase pathway (5, 9, 10). Consistent with the Knudson 2-hit hypothesis, extracerebral neoplasms in TSC patients frequently harbor loss of heterozygosity (11). In contrast, loss of heterozygosity has been rarely found in TSC brain lesions (12). Recent data suggest that the TSC pathway in neurons is highly sensitive to gene dosage effects, including the observation that TSC1 haploinsufficiency impairs neuronal morphology (13). Furthermore, only little is known about a potentially impaired subcellular distribution of TSC1 sequence variants, that is, aberrant nuclear localization of hamartin in a tuber was demonstrated in a case study (14). It has also been shown that oligomerization of the hamartin carboxyl-terminal coiled coil domain was inhibited in the presence of tuberin (15). The presence of hamartin aggregates in FCD IIb components (Fig. 1) may suggest that aberrant 1136 J Neuropathol Exp Neurol Volume 68, Number 10, October by the American Association of Neuropathologists, Inc. Unauthorized reproduction of this article is prohibited.
 impair this interaction and lead to aberrant subcellular")
169 J Neuropathol Exp Neurol Volume 68, Number 10, October 2009 Functional Analysis of TSC1 Allelic Variant interactions between hamartin and tuberin also occur in these epilepsy-associated lesions. Here, we used in vitro approaches to analyze whether TSC1 coding allele variants in the predicted tuberin-binding domain of hamartin (5) impair this interaction and lead to aberrant subcellular distribution of the resulting hamartin protein variants. Therefore, we focused on the allelic variant known to be increased in FCD IIb patients, that is, a base exchange from C to G in exon 17 of TSC1 at nucleotide 2415 that results in an amino acid exchange from the basic histidine to the neutral tyrosine at codon 732 (hamartin H732Y [16]). This variant is also present at lower frequencies in TSC patients and unaffected individuals (17Y19). We also analyzed hamartin R692X and hamartin R786X, that is, truncations in the hamartin-tuberin interaction domain that are frequently observed in TSC-associated cortical tubers (18Y20). Our data suggest strikingly impaired tuberin binding as well as divergent subcellular distribution patterns of these hamartin variants and provide novel insights into their pathogenetic role in FCD and TSC. Ó 2009 American Association of Neuropathologists, Inc by the American Association of Neuropathologists, Inc. Unauthorized reproduction of this article is prohibited.
170 Lugnier et al J Neuropathol Exp Neurol Volume 68, Number 10, October 2009 MATERIALS AND METHODS Surgical Specimens and Immunohistochemistry Tissue specimens were obtained from FCD IIb (n = 12 patients), cortical tubers (n = 2 patients), and subependymal giant cell astrocytomas (SEGAs, n = 3 patients) (Table). Biopsy samples were collected from patients with chronic pharmacoresistent focal epilepsies in the Epilepsy Surgery Program at the University of Bonn. One patient with SEGA did not have epilepsy. In all epileptic patients (n = 16), surgical removal of the lesion was necessary to achieve seizure control after presurgical evaluation, as previously described (21). Only patients with cortical tubers and SEGAs had additional features characteristic of TSC (5, 8). In a patient with a SEGA (ID 17), neurosurgical intervention was carried out under tumor-surgical considerations. The clinical characteristics of the patients are summarized in the Table. Written informed consent was obtained from all patients concerning the use of brain tissue. All procedures were conducted in accordance with the Declaration of Helsinki and approved by the ethics committee of the University of Bonn Medical Center. Surgical specimens were fixed in formaldehyde overnight and embedded in paraffin. The FCD IIb specimens were reviewed by experienced neuropathologists and classified according to international classification schemes (3). Hematoxylin and eosin (H&E) and NisslYLuxol fast blue stains and immunohistochemistry with antibodies against vimentin and neurofilament protein were carried out according to standard procedures (22). Immunohistochemical staining of hamartin in paraffin sections was performed using a monoclonal antibody (Cell Signaling, Frankfurt, Germany; Clone 1B2, diluted 1:200) according standard procedures (22). Negative control reactions replacing the primary specific antibody by nonspecific immunoglobulin were performed to assure specific binding affinity (data not shown). Generation of Plasmid Constructs To generate pmcherry-tsc1, we first amplified the human TSC1 cdna coding sequence from pcdna3.1myca- TSC1 and subcloned the amplicon into the pcdna3.1 V5 HIS TOPO vector (Invitrogen, Munich, Germany) using the primer pair TSC1 forward (5 -GCG GCT AGC ATG GCC CAA CAA GCA AAT G-3 ) and TSC1 reverse (5 -GCG GGT ACC TTA GCT GTG TTC ATG AGT CTC-3 ). Subsequently, an mcherry tag was inserted N-terminally in pcdna3.1-tsc1 to generate pmcherry-tsc1. Therefore, mcherry was amplified from the pbks-mcherry plasmid (a generous gift from Dr T. Südhof, Stanford, CA) using the primer pair mcherry forward (5 -GCG TCT AGA ACC ATG GTG AGC AAG GGC GA-3 ) and mcherry reverse (5 -GCG GCT AGC CTT GTA CAG CTC GTC CAT GCC-3 ). The resulting polymerase chain reaction product was digested with NheI and XbaI (Fermentas, Burlington, Canada) and pcdna3.1-tsc1 with NheI. DNA sequencing was performed to verify that all sequences were correct (BigDye Terminator v3.1 Cycle Sequencing Kit; Applied Biosystems, Foster City, CA). Truncated and mutated hamartin proteins were generated by site-directed mutagenesis of the pcdnamcherry-tsc1 plasmids (QuickChange II SiteYdirected mutagenesis kit, Stratagene, Cedar Creek, TX) following the manufacturer s manual with the following primers: TSC1 R786X forward: 5 -CAG ATC AGA CAG CTA CAG CAT GAC TGA GAG GAG TTC TAC-3 ; TSC1 R786X reverse: 5 -GTA GAA TTC CTC TCA GTC ATG CTG TAG CTG TCT GAT CTG-3. By base exchange from C to T in codon 786 of TSC1, a stop codon is created, resulting in a truncated TSC1 protein. For rapid screening of mutant clones, a silent base exchange from G to A was generated, which resulted in the deletion of a PstI restriction site (CTGCA/G). For another truncated TSC1 variant, we used the primers: TSC1 R692X forward: 5 -GAT GAG ATC CGC ACC CTC TGA GAC CAG CTG CTT TTA CTG CAC AAC-3 ; TSC1 R692X reverse: 5 -GTT GTG CAG TAA AAG CAG CTG GTC TCA GAG GGT GCG GAT CTC ATC-3. The base exchange from C to T creates a stop codon at position 692 of TSC1, whereas the silent mutation from T to C resulted in the creation of a new PvuII restriction site (CAG/CTG). We further used the primers: TSC1 H732Y forward: 5 -GTG ATC AAA GCA GCA GCT CTC GAG GAA TAT AAT GCT GCC ATG-3 ; TSC1 H732Y reverse: 5 - CAT GGC AGC ATT ATA TTC CTC GAG AGC TGC FIGURE 1. Neuropathologic and immunohistochemical characteristics of focal cortical dysplasia type IIb (FCD IIb ), cortical tubers, and subependymal giant cell astrocytoma (SEGA). (A, B) The co-occurrence of large dysplastic neurons (black arrow) with aggregates of Nissl substance (A, H&E; B, NisslYLuxol fast blue) and Taylor-type balloon cells (gray arrow) are typical neuropathologic findings in FCD IIb. (CYH) Immunohistochemical (IHC) characteristics of FCD IIb include expression of neurofilament in dysmorphic neurons and axonal congestion (C) and prominent expression of vimentin in balloon cells (D). IHC with an antibody against hamartin reveals granular aggregates of hamartin in the cytoplasm of balloon cells that are characterized by a round eccentric nucleus (E, gray arrows) and dysmorphic neurons with a central nucleus and prominent nucleolus ([F] black arrow). In contrast, regularly oriented neurons in normal cerebral cortex show homogeneous cytoplasmic distribution of hamartin; astroglia are devoid of hamartin expression (G). In a higher magnification of the field in (G), there is homogeneous expression of hamartin in the somata, axons, and dendrites of regularly shaped neurons ([H] black arrows). (IYL) Cortical tubers. Similar to FCD IIb, cortical tubers are characterized by an admixture of large dysmorphic neurons (black arrow) and giant cells (gray arrow [I]). Dysmorphic neurons show perisomatic strong expression of synaptophysin, whereas giant cells contrast negative (J). Glial fibrillary acidic protein is present in giant cells (K). Granular aggregates of hamartin are present in the cytoplasm of giant cells ([L] upper part, gray arrow) and in dysmorphic neurons ([L] lower part, black arrow). (MYP) SEGA. These lesions are composed of densely packed giant cells ([M] H&E) that have substantial expression of neuronal specific enolase (N) and low proliferative activity ([O] gray arrow, IHC with an antibody against Ki67 [MiB1]). Giant cells such as the binucleated example (gray arrow) show distinct cytoplasmic granular aggregation of hamartin (P). Scale bars = (AYD, G) 100 Km; (E, F, and HYP) 50 Km Ó 2009 American Association of Neuropathologists, Inc by the American Association of Neuropathologists, Inc. Unauthorized reproduction of this article is prohibited.
171 J Neuropathol Exp Neurol Volume 68, Number 10, October 2009 Functional Analysis of TSC1 Allelic Variant TABLE. Clinical Features and Diagnoses of Patients Case No. Neuropathologic Diagnosis Main Clinical Features Age at Surgery, years, Sex Age at Epilepsy Onset, years Seizure Frequency Medication at the Time of Surgery 1 FCD IIb CPS, sgtcs 23, F 14 4/month LTG, PGB 2 FCD IIb CPS 9, M G1 15/day LTG, PB 3 FCD IIb SPS, CPS, sgtcs 28, F 2 7/day PHT, LTG 4 FCD IIb SPS, CPS, sgtcs 18, F 3 6/day OXC, LEV 5 FCD IIb SPS 21, M 7 ND PHT, LEV, ZON 6 FCD IIb SPS, CPS, sgtcs 29, F 3 10/day LTG 7 FCD IIb SPS, CPS, sgtcs 34, F 3 5/month LEV, LTG, CBZ 8 FCD IIb SPS, sgtcs 28, M 2 ND CBZ, LEV 9 FCD IIb SPS, CPS 2, F 2 3/day OXC 10 FCD IIb SPS, CPS, sgtcs 24, M 3 11/month LEV, OXC, PGB, PHT 11 FCD IIb CPS 36, M 26 6/day ZON, PB, LEV, OXC 12 FCD IIb CPS, sgtcs 20, M 4 2/month OXC, PHT 13* Cortical tuber SPS, CPS, sgtcs 12, M 2 1/day PHT, VPA 14* Cortical tuber SPS, CPS 0.8, F 0.5 5/day OXC, VPA 15* SEGA CPS 8, M G1 7/day TPM, VPA 16* SEGA Hydrocephalus occlusus, 38, M ND ND CBZ CPS, sgtcs 17* SEGA Intraventricular tumor 21, F V V V *Cases with tuberous sclerosis complex. Seizure frequency, events per month or day. CBZ, carbamazepine; CPS, complex partial seizure; F, female; FCD, focal cortical dysplasia of indicated types; LEV, levetiracetam; LTG, lamotrigine; M, male; ND, not determined (the age at onset of epileptic seizures of Patient 16 and the exact seizure frequency of Patients 5, 8, and 16 are not known. Patient 17 did not have clinically apparent seizures); OXC, oxcarbazepine; PB, phenobarbital; PGB, pregabalin; PHT, phenytoin; SEGA, subependymal giant cell astrocytoma; sgtcs, secondary generalized tonic clonic seizures; SPS, simple partial seizure; TPM, topiramate; VPA, valproate; ZON, zonisamide. TGC TTT GAT CAC-3. This base exchange from C to T results in an amino acid exchange from histidine to tyrosine, screened by the detection of an additional restriction site of XhoI (C/TCGAG) generated by a silent base exchange from G to C. Mutagenesis was verified by restriction digest and sequencing. Cell Culture and Transfection Procedures HEK293T cells were cultured in Dulbecco modified Eagle medium (Invitrogen, Carlsbad, CA) supplemented with 10% fetal calf serum and 1% penicillin/streptomycin at 37-C in 5% carbon dioxide. Transfection of HEK293T cells was performed using Lipofectamine 2000 (Invitrogen) following the manufacturer s protocol. Colocalization Assay HEK293T cells were cultured on coverslips and transfected with TSC2-enhanced green fluorescence protein and the different mcherry-tsc1 expression plasmids, at a confluence of approximately 25%, as previously described. After 48 hours, cells were fixed in 4% paraformaldehyde and analyzed by confocal fluorescence microscopy (Olympus, Munich, Germany). Micrographs were examined using a colocalization assay plug-in on ImageJ. Western Blot Analysis For Western blot experiments, HEKT293 cells were transfected with the mcherry-tsc1 plasmid at about 80% confluence and cultured for 2 more days. Cell pellets were resuspended in PBS and 6 loading dye (4 Tris-Cl/sodium dodecyl sulfate [SDS] ph 6.8, 30% glycerol, 10% SDS, 5%- mercaptoethanol, 0.012% bromphenol blue) and then lysed by sonification. Equal amounts of cell lysate were separated by electrophoresis on an 8% SDSYpolyacrylamide gel and transferred to nitrocellulose membranes (Protran Whatman, Kent, UK) overnight at 4-C. After blocking the membrane for 1 hour with PBS/1% cold water fish gelatin (Sigma- Aldrich, St Louis, MO), it was incubated overnight with a monoclonal hamartin antibody (dilution 1:1000) (Hamartin 1B2 Mouse mab, Cell Signaling, Boston, MA) in PBS, 0.1% TWEEN. IrDye fluorescent secondary antibodies (LI-COR, Lincoln, NE) were diluted 1:20,000 in PBS, 0.1% TWEEN, 0.01% SDS, and incubated for 1 hour. Immunoblots were visualized using the LI-COR Odyssey system (LI-COR). Immunoprecipitation Assays For immunoprecipitation analyses, HEK293T cells were harvested 2 days after cotransfection with the various cherry-tagged TSC1 expression plasmids and the green fluorescence protein-tagged TSC2 expression plasmid. Cell pellets were resuspended in lysis buffer (150 mmol/l NaCl, 40 mmol/l Tris-HCl ph 7.4, 1 mmol/l EDTA, 0.5% Nonidet P-40, 1 mmol/l phenylmethanesulfonyl fluoride, protease inhibitor cocktail; Roche, Indianapolis, IN) and incubated for 1 hour at 4-C. Meanwhile, 30 KL of protein A/G plus agarose (Santa Cruz Biotechnology, Santa Cruz, CA) slurry were conjugated with 1 Kg of an antibody against hamartin (sc-12082) or tuberin (sc-893) (both from Santa Ó 2009 American Association of Neuropathologists, Inc by the American Association of Neuropathologists, Inc. Unauthorized reproduction of this article is prohibited.

172 Lugnier et al J Neuropathol Exp Neurol Volume 68, Number 10, October 2009 Cruz Biotechnology) in 500 KL lysis buffer at 4-C. After centrifugation of the cell lysate for 10 minutes at 14,000 rpm at 4-C, the supernatant was precleared with 50 KL of protein A/G plus agarose slurry and 1 Kg of normal mouse IgG (Santa Cruz Biotechnology) for 1 hour at 4-C. Subsequently, the lysate was added to the conjugated primary antibodies and incubated for 2 hours, rotating at 4-C. The immunoprecipitated complexes were washed 5 times with lysis buffer and analyzed by electrophoresis on a 6% SDS polyacrylamide gel followed by immunoblotting, as previously described. Immunocytochemistry and Phase-Contrast Microscopy For immunofluorescence analysis, HEK293T cells were cultured on coverslips for 2 days after transfection and then fixed in 4% paraformaldehyde for 15 minutes at room temperature. After 3 rounds of washing with ice-cold PBS, cells were permeabilized with 0.1% Triton X-100/PBS for 15 minutes and then blocked for 1 hour at room temperature (blocking buffer: 10% normal goat serum, 1% bovine serum albumin in PBS). Cells were incubated overnight with primary antibodies anti-lamp1 and anti-ergic-53/p58 (Sigma-Aldrich) at 4-C and diluted in blocking buffer to a concentration of 1:200. After washing with PBS, secondary antibody was added in a dilution of 1:400 in blocking buffer for 1 hour. The labeling was analyzed by confocal fluorescence microscopy as previously described. Cultured cells were photographed by phase-contrast microscopy (Observer A1; Zeiss, Jena, Germany) in the culture plate. Statistical Analysis Two-sided Student t-test was used for statistical analysis of the data. RESULTS We have observed that the lesions of FCD IIb, that is, common epilepsy-associated malformations that resemble cortical tubers in TSC (Figs. 1AYD, IYK), show strikingly aberrant cytoplasmic granular aggregation of hamartin in balloon cells and in dysmorphic neurons (Figs. 1E, F). By contrast, regularly shaped neurons in normal cerebral cortex have a homogeneous cytoplasmic distribution of hamartin (Figs. 1G, H). Moreover, aberrant hamartin aggregation in FCD IIb is also observed in dysmorphic neuronal and giant cell elements of cortical tubers (Figs. 1L) and in highly differentiated subependymal SEGAs (Figs. 1MYP). Both cortical tubers and SEGAs are frequently associated with TSC. These observations prompted us to determine whether sequence variants of TSC1 that are frequent in FCD IIb and TSC-associated brain lesions are associated with aberrant subcellular distribution or impaired tuberin binding of the resulting hamartin variants. Because numerous components of the phosphatidylinositol 3-kinase cascade operate abnormally in FCD IIb and cortical tubers (23), we used a highly controlled in vitro approach for this analysis. We first generated various plasmids that express TSC1 fused to the fluorescent reporter mcherry. In addition to wild-type (WT) TSC1, we derived TSC1 constructs carrying the amino acid exchanges H732Y, R786X, and R692X (Fig. 2). Mutations in codons 786 and 692 result in truncated hamartin variants that are frequently detected in TSC patients (18Y20) and are localized at different sites within the tuberin interaction domain of hamartin (Fig. 2). Next, we tested for protein expression and stability of the TSC1 fusion proteins by transfection of HEK293T cells and immunoblotting. HEK293T cells are a widely used cell line for protein interaction experiments. All proteins were expressed at high levels and migrated at the expected calculated molecular weights (Fig. 3). FIGURE 2. Generation of mutant hamartin proteins. A Cherry tag was inserted N-terminally to the tuberous sclerosis complex (TSC1) cdna (numbered boxes indicating exons); 3 different mutations were introduced into the coding sequence of TSC1 by site-directed mutagenesis (highlighted on gray background); 2 of the sequence alterations resulted in truncating mutations, the generation of stop codons at positions R786X and R692X. The resulting proteins are referred to as hamartin R786X and hamartin R692X. Hamartin R692X terminates in the beginning of exon 17; hamartin R786X comprises the amino acids encoded by the entire exon 17 and terminates in the middle of exon 18. The protein parts that are missing as result of introducing the truncating mutations are indicated. A third sequence alteration in the TSC1 cdna (i.e. a C to G base exchange in exon 17 of TSC1) results in an amino acid exchange at codon 732 of hamartin, from the basic histidine to neutral tyrosine (hamartin H732Y ). Importantly, this latter alteration does not result in a truncated hamartin protein variant Ó 2009 American Association of Neuropathologists, Inc by the American Association of Neuropathologists, Inc. Unauthorized reproduction of this article is prohibited.

 hamartin fused to cherry is detected at approximately 158 kd (endogenous tuberous sclerosis complex (TSC1) 130 kd, cherry 28 kd).")
173 J Neuropathol Exp Neurol Volume 68, Number 10, October 2009 Functional Analysis of TSC1 Allelic Variant FIGURE 3. Hamartin cherry fusion proteins are expressed in HEK293T cells. To analyze the subcellular distribution of the various hamartin variants, plasmids coding for fusion proteins of hamartin with the fluorescent marker mcherry were generated. The sizes of the fusion proteins were determined by immunoblotting of transfected HEK293T whole cell lysates. As expected, wild-type (WT) hamartin fused to cherry is detected at approximately 158 kd (endogenous tuberous sclerosis complex (TSC1) 130 kd, cherry 28 kd). Hamartin H732Y fused to cherry is the same size as hamartin WT fused to cherry. Hamartin R692X fused to cherry represents the smallest protein (100 kd); hamartin R786X fused to cherry is of intermediate size (110 kd). The arrow marks the HEK293T-endogenous hamartin at 130 kd. To assess the binding efficiency of WT and mutant TSC1 proteins to tuberin in vitro, we performed immunoprecipitation experiments from extracts of transiently transfected HEK293T cells using an antibody directed against an epitope present in all mutant hamartin protein variants and then probed the precipitates with an antibody against tuberin. As shown in Figures 4A and B, tuberin was efficiently precipitated when coexpressed with hamartin WT, but there was reduction in tuberin-binding affinity for hamartin R692X. Because this protein variant contains an aberrant stop codon positioned most N-terminal in the tuberin interaction domain, the resulting hamartin product lacks large portions of the coiledcoil domain responsible for tuberin binding (Figs. 4A, B); 5.1-fold binding reduction, for hamartin R692X n = 3 replicates, hamartin WT for all n = 9 replicates, t-test, p G Correspondingly, the hamartin R786X variant also showed a significantly reduced binding affinity to tuberin (Figs. 4A, B); 3.3-fold binding reduction, for hamartin R786X n = 4 replicates, t-test, p G In the hamartin R786X protein, however, a larger part of the tuberin binding coiled-coil domain is present than in hamartin R692X. Strikingly, also a hamartin protein variant (hamartin H732Y ), which is found in normal individuals, TSC patients with cortical tubers, as well as in FCD IIb, and in which the tuberin binding domain only exhibits a single amino acid exchange, showed a significant reduction in tuberin binding (Figs. 4A, B); 2.3-fold binding reduction, for hamartin H732Y n = 9 replicates, t-test, p G Identical results were obtained if the immunoprecipitations were performed vice versa using an antibody against tuberin (data not shown). Together, these experiments show that mutations found in the tuberin-binding domain of hamartin in cortical tubers and in FCD IIb directly affect the interaction of these 2 proteins. We next characterized the subcellular distribution of the different hamartin protein variants. Hamartin WT showed a cytoplasmic localization mostly concentrated in close vicinity to the cellular membrane (Fig. 5). The expression pattern of hamartin WT seemed homogeneous. Hamartin R692X and hamartin R768X were more dispersed in the cytoplasm and accumulated in granular-like patterns that are distinct from that of hamartin WT (white arrows, Fig. 5). The granular masses of hamartin R692X and hamartin R768X suggest selfaggregation, a phenomenon that has been previously described (15). Intriguingly, hamartin H732Y revealed a completely different subcellular distribution as it was almost completely localized in the nucleus without any significant cytoplasmic expression. This observation was confirmed by 4,6-diamidino-2-phenylindole, dihydrochloride (DAPI) staining (Fig. 5). We next examined the consequences of the H732Y allelic variant on the interaction of hamartin and tuberin in live cells. We overexpressed both proteins in HEK293T cells FIGURE 4. Immunoprecipitation of hamartin and tuberin. (A) Hamartin-cherry variants were immunoprecipitated using a hamartin antibody. Subsequently, immunoblots were probed with an antibody against tuberin. The probes were normalized to the whole lysates. Only the tuberin band of the wild-type (WT) hamartin probe can be detected with certainty. This assay was also performed in the reverse order with identical results (data not shown). (B) To examine the binding efficiency between hamartin, WT, and mutant variants and tuberin in vitro, the amount of tuberin that was immunoprecipitated by the different hamartin variants was quantitated after immunoblotting using AIDA software. All 3 hamartin variants show a substantially decreased binding to tuberin compared with that of hamartin WT. Hamartin WT, n = 9; hamartin H732Y, n = 9; hamartin R786X, n = 4; hamartin R692X, n=3;t-test, *p e Ó 2009 American Association of Neuropathologists, Inc by the American Association of Neuropathologists, Inc. Unauthorized reproduction of this article is prohibited.
YmCherry expression plasmids (red view figure in color online-only); nuclei were labeled with DAPI (blue view figure in color")

174 Lugnier et al J Neuropathol Exp Neurol Volume 68, Number 10, October 2009 FIGURE 5. Subcellular distribution of hamartin variants in HEK293T cells. HEK293T cells were transfected with tuberous sclerosis complex (TSC1)YmCherry expression plasmids (red view figure in color online-only); nuclei were labeled with DAPI (blue view figure in color online-only). Cells only stained with DAPI are nontransfected cells. The different hamartin mutants and the wildtype (WT) were analyzed by confocal fluorescence microscopy. Hamartin WT showed cytoplasmic localization mostly concentrated near the cellular membrane. In contrast, the hamartin R786X and hamartin R692X variants were more disseminated throughout the cytoplasm and accumulated in granular aggregates (white arrows). Hamartin H732Y exhibited a completely different subcellular distribution compared with that of the other proteins as it was almost completely transferred to the nucleus. The exclusively nuclear localization of hamartin H732Y was confirmed by colocalization with DAPI staining. Scale bars = 10 Km. FIGURE 6. Colocalization assay of tuberin and hamartin in HEK293T cells. (A) HEK293T cells were cotransfected with plasmids coding for mcherry-hamartin (red view figure in color online-only) and enhanced green fluorescence proteinytuberin (green view figure in color online-only) fusion proteins. Cells were analyzed by confocal fluorescence microscopy. Wild-type (WT) hamartin shows nearly 100% colocalization with tuberin. Cotransfection of hamartin H786X and tuberin and of hamartin R692X and tuberin, respectively, resulted in a redistribution of the granular pattern observed for hamartin WT into a diffuse pattern, which colocalized with tuberin. Hamartin H732Y showed no redistribution when cotransfected with tuberin but stayed strictly in the nucleus indicating reduced colocalization with tuberin (red, cherry fluorescent protein; blue, DAPI; Scale bars = 10 Km. View figure in color online-only). (B) Semiquantitative analysis of the colocalized area of hamartin and tuberin in relation to the entire area of single cells by an ImageJ plug-in developed for the examination of colocalization assays (t-test, p G 0.001; for hamartin H732Y, n = 48 cells counted; for hamartin WT, n = 46 cells counted; for hamartin R786Y, n = 50 cells counted; for hamartin R692X, n = 45 cells counted) Ó 2009 American Association of Neuropathologists, Inc by the American Association of Neuropathologists, Inc. Unauthorized reproduction of this article is prohibited.

175 J Neuropathol Exp Neurol Volume 68, Number 10, October 2009 Functional Analysis of TSC1 Allelic Variant and analyzed their colocalization pattern by confocal fluorescence microscopy. The data corroborated the observation that hamartin H732Y was translocated to the nucleus even in the presence of increased levels of tuberin. Interestingly, tuberin showed a diffuse cytoplasmic distribution pattern (Fig. 6A). Using the ImagJ plug-in, we analyzed the colocalization of hamartin and tuberin semiquantitatively and detected significantly reduced colocalization of hamartin H732Y with tuberin compared with that of WT (t-test, p G 0.001; for hamartin H732Y, n = 48 cells counted; for hamartin WT, n = 46 cells counted; for hamartin R786Y,n=50 cells counted; for hamartin R692X, n = 45 cells counted; Fig. 6B). Hamartin WT showed colocalization with tuberin in a largely cytoplasmic distribution (Figs. 6A, B). Interestingly, in these experiments, both truncation mutants exhibited a strong cytoplasmic colocalization with tuberin highly similar FIGURE 7. Analysis of potential colocalization of hamartin in different subcellular compartments. (A) Cells were transfected with various mcherry-hamartin fusion proteins. Immunocytochemistry was performed with anti-lamp1, which marks lysosomes, and anti-ergic-53/p58, which marks endoplasmic reticulum and Golgi apparatus components. These primary antibodies were detected with a green fluorescent secondary antibody. For colocalization of hamartin with mitochondria, HEK293T cells were cotransfected with the hamartin variants fused to mcherry and a plasmid exclusively expressed in mitochondria, pmitoygreen fluorescence protein (a generous gift from W. Altrock; IFN, Magdeburg, Germany). Results were analyzed by confocal fluorescence microscopy. Hamartin R692X was present in nuclei; the other variants were located in the cytoplasm in different distribution patterns. There was no reproducible or substantial colocalization of hamartin with any of these compartment-specific markers. (B) Different growth patterns of untransfected HEK293T cells were visualized by phase-contrast microscopy. The panels demonstrate the high degree of density-dependent diversity of sizes and shapes of the HEK293T cells grown in culture. Cell contacts were associated with more rounded shapes (black arrows [B1]), whereas isolated cells exhibit a more spindle-like morphology (white arrows [B2]). At higher magnification, clustered HEK293T cells (black arrow [B3]) reveal round to ovoid shapes, whereas isolated cellular components seem more elongated with the formation of small processes (white arrow [B3]). Scale bars = (A) 10 Km; (B) 100 Km. WT, wild-type. Ó 2009 American Association of Neuropathologists, Inc by the American Association of Neuropathologists, Inc. Unauthorized reproduction of this article is prohibited.
176 Lugnier et al J Neuropathol Exp Neurol Volume 68, Number 10, October 2009 to the distribution pattern of hamartin WT (Figs. 6A, B). None of the cotransfected hamartin protein variants resulted in an altered distribution of tuberin in the cells. We performed further immunocytochemistry of transfected HEK293T cells with probes of proteins localized specifically at the Golgi apparatus, the endoplasmic reticulum and lysosomes, and mitochondria to determine whether the individual hamartin variants had different colocalization patterns within these subcellular compartments (Fig. 7A). We did not observe distinct or specific colocalization patterns of the individual hamartin protein variants with these compartments, however. Importantly, the distribution patterns of the distinct hamartin variants were independent of the variable morphology of the HEK293T cells (Fig. 7B). Generally, clustered cells in close contact exhibit a round to ovoid appearance (Figs. 7B1, B3). In contrast, individual cells in more isolated localization reveal a rather spindle-like shape (Figs. 7B2, B3). The variability of HEK293T cellular shape distribution was independent of transfection of cells with the different TSC1 variants. DISCUSSION We observed strikingly aberrant subcellular distribution patterns of hamartin in various epilepsy- and TSC-associated lesions. In contrast to neurons in normal cortex that have diffuse cytoplasmic expression of hamartin FCD IIb, cortical tubers and SEGAs exhibit cytoplasmic granular aggregates of hamartin (Fig. 1); these are similar to previously reported findings (24). Our present in vitro results also reveal striking differences in tuberin binding and subcellular distribution among hamartin variants that are frequently observed in epilepsy-associated cortical dysplasias and cortical tubers (17Y20). Both hamartin variants with a truncated tuberinbinding domain exhibited significantly reduced binding affinity to tuberin. This observation is surprising for hamartin R786X, which still encompasses a substantial part of this domain. Interestingly, hamartin H732Y, an allelic variant of TSC1 present in healthy individuals (17), is highly abundant in FCD IIb (16) and is present in TSC patients who lack TSC1, and TSC2 mutations (18) also showed a substantially reduced ability to interact with tuberin. Indeed, the affinities of hamartin H732Y and hamartin R786X to tuberin were similar (Fig. 3). This result was rather surprising because 1) in contrast to hamartin H732Y, the hamartin R786X variant has been reported to cause manifest TSC and 2) the hamartin H732Y variant differs from hamartin WT by only a single amino acid exchange from the basic amino acid histidine to the neutral tyrosine within the interaction domain to tuberin. This sequence alteration at codon 732 may alter the 3-dimensional structure of hamartin at the predicted binding domain with tuberin (5). Aberrant interaction of hamartin H732Y with tuberin is compatible with downstream activation of the phosphatidylinositol 3-kinase cascade recently described in FCD IIb (9, 25, 26). An important aspect for understanding the pathophysiological relevance of TSC1 allelic variants relates to potentially aberrant subcellular localization of the corre sponding hamartin variants compared with tuberin. Factors such as cell type-specific differences and low abundance or antibody limitations may account for previous findings that hamartin and tuberin are localized to different cellular compartments (10, 15, 27Y29). It has been demonstrated, however, that tuberin and hamartin associate physically in vivo (10, 30); all of these studies provide evidence for a cytosolic tuberin-hamartin complex. Hamartin has been localized to the membrane/particulate (P100) fraction of cultured cells (30, 31). Recently, nuclear localization of hamartin in pancreatic acinar tissues and individual cell components in the cerebellar granular layer of the cerebellum were also reported (32). Because of its subcellular localization, hamartin may transmit information about changes in cell adhesion to the nucleus; its involvement in normal cell death may accompany cell detachment or provide an additional potential indirect mechanism through which the cell cycle could be affected. Indeed, it has been suggested that hamartin is a nuclear shuttling protein that accumulates in the nucleus upon inhibition of nuclear export with leptomycin B, which itself inhibits Exportin 1, a protein required for nuclear export of proteins containing a nuclear export sequence (1). Intriguingly, our finding of hamartin H732Y accumulation in the nucleus (in contrast to hamartin WT, hamartin R786X, and hamartin R692X, which are cytoplasmic) implies the following scenarios for allelic variants in contrast to hamartin WT, which is tightly bound to tuberin in a protein complex. Because of the conserved nuclear localization sequence (BRQQHALRNRR[ sequence at 708 of hamartin), hamartin H732Y has a reduced binding affinity to tuberin and is shuttled into the nucleus. In view of the relevance of hamartin for cell cycle regulation, this aberrant cytoplasmicnuclear shuttling of hamartin disrupts the cycling of affected cells. In contrast, hamartin R786X and hamartin R692X are not transported to the nucleus. Accordingly, hamartin R692X lacks the nuclear localization sequence at 708, whereas for hamartin R786X, another mechanism, such as protein misfolding of the truncated protein, may account for its localization. Aberrant nuclear accumulation of hamartin H732Y might impair cell cycling, although the specific effects of this phenomenon were not addressed by the experimental approaches of the present study. It has been shown, however, that hamartin and tuberin influence the activity of molecules critically involved in cell cycle regulation such as CDK1 (33). On the other hand, this aberrant protein variant might also perturb regular nuclear functions in a manner similar to what is known for aberrant protein aggregates in neurodegenerative conditions such as spinocerebellar ataxia type 3 (34). Recent data demonstrated that appropriate phosphorylation, sequestration, and turnover of the TSC protein complex represent critical issues for proper cellular function (35Y37). Particularly, the aberrant cytoplasmic aggregates of hamartin we demonstrated in FCD IIb, cortical tuber and SEGA patient tissues, as well as our in vitro findings for the hamartin stop variants may imply impairment of protein sequestration. However, we did not observe increased association of the hamartin stop variants, such as with lysosomes (Fig. 7). Ó 2009 American Association of Neuropathologists, Inc by the American Association of Neuropathologists, Inc. Unauthorized reproduction of this article is prohibited.
177 J Neuropathol Exp Neurol Volume 68, Number 10, October 2009 Functional Analysis of TSC1 Allelic Variant The hamartin H732Y allele is also detected in the normal population, with a frequency of 0.5%. Therefore, this sequence alteration cannot be sufficient to cause TSC or FCD. Intriguingly, it has been recently shown that the TSC pathway is sensitive to gene dosage effects, such that loss of a single copy of TSC1, as it is manifest in all neurons of TSC patients, is sufficient to disturb dendritic spine structure (13). Furthermore, loss of heterozygosity has been shown in FCD IIb components of individuals carrying the hamartin H732Y allele (16). Our present data suggest that hamartin H732Y may constitute a predisposing germline variant with low penetrance and a strongly restricted manifestation pattern, which only in individual cells (or e.g. restricted neural precursor clones) overcomes a virtual pathological threshold. This concept is compatible with the remarkable notion that surgical resection of FCD IIb is curative with respect to seizure events in most patients (38), whereas TSC patients with cortical tubers frequently develop secondary seizure foci after removal of epileptogenic tubers/foci. It was suggested recently that hamartin could have discrete and specialized functions besides its role in the TSC1/TSC2 complex because of its nuclear localization (39). In line with this idea, hamartin is capable of attenuating the proliferation of mammalian cells (40). Aberrant cellular accumulation of hamartin allelic variants may therefore account for reduced proliferation and cellular densities in cortical dysplasias (41) and the characteristic enlarged and dysplastic cellular phenotype of FCD IIb elements. Based on these considerations, our data suggest that hamartin, which has mainly been regarded as an interaction partner in the tumor suppressor complex with tuberin, has a pronounced independent functional relevance in the pathogenetic context of TSC and cortical dysplasias. ACKNOWLEDGMENT The authors thank Christiane Esch for valuable technical support. REFERENCES 1. Hengstschlager M, Rodman DM, Miloloza A, et al. Tuberous sclerosis gene products in proliferation control. Mutat Res 2001;488:233Y39 2. Gomez MR. Varieties of expression of tuberous sclerosis. Neurofibromatosis 1988;1:330Y38 3. Palmini A, Najm I, Avanzini G, et al. Terminology and classification of the cortical dysplasias. Neurology 2004;62:S2YS8 4. Taylor DC, Falconer MA, Bruton CJ, et al. Focal dysplasia of the cerebral cortex in epilepsy. J Neurol Neurosurg Psychiatry 1971;34: 369Y87 5. van Slegtenhorst M, de Hoogt R, Hermans C, et al. Identification of the tuberous sclerosis gene TSC1 on chromosome 9q34. Science 1997;277: 805Y8 6. Sampson JR, Harris PC. The molecular genetics of tuberous sclerosis. Hum Mol Genet 1994;3:1477Y80 7. Carbonara C, Longa L, Grosso E, et al. 9q34 loss of heterozygosity in a tuberous sclerosis astrocytoma suggests a growth suppressor-like activity also for the TSC1 gene. Hum Mol Genet 1994;3:1829Y32 8. Kwiatkowski DJ. Tuberous sclerosis: From tubers to mtor. Ann Hum Genet 2003;67:87Y96 9. Baybis M, Yu J, Lee A, et al. mtor cascade activation distinguishes tubers from focal cortical dysplasia. Ann Neurol 2004;56:478Y van Slegtenhorst M, Nellist M, Nagelkerken B, et al. Interaction between hamartin and tuberin, the TSC1 and TSC2 gene products. Hum Mol Genet 1998;7:1053Y Green AJ, Johnson PH, Yates JR. The tuberous sclerosis gene on chromosome 9q34 acts as a growth suppressor. Hum Mol Genet 1994;3: 1833Y Henske EP, Scheithauer BW, Short MP, et al. Allelic loss is frequent in tuberous sclerosis kidney lesions but rare in brain lesions. Am J Hum Genet 1996;59:400Y6 13. Tavazoie SF, Alvarez VA, Ridenour DA, et al. Regulation of neuronal morphology and function by the tumor suppressors Tsc1 and Tsc2. Nat Neurosci 2005;8:1727Y Jansen FE, Notenboom RG, Nellist M, et al. Differential localization of hamartin and tuberin and increased S6 phosphorylation in a tuber. Neurology 2004;63:1293Y Nellist M, van Slegtenhorst MA, Goedbloed M, et al. Characterization of the cytosolic tuberin-hamartin complex. Tuberin is a cytosolic chaperone for hamartin. J Biol Chem 1999;274:35647Y Becker AJ, Urbach H, Scheffler B, et al. Focal cortical dysplasia of Taylor s balloon cell type: Mutational analysis of the TSC1 gene indicates a relationship to tuberous sclerosis. Ann Neurol 2002;52:29Y Jones AC, Daniells CE, Snell RG, et al. Molecular genetic and phenotypic analysis reveals differences between TSC1 and TSC2 associated familial and sporadic tuberous sclerosis. Hum Mol Genet 1997;6:2155Y van Slegtenhorst M, Verhoef S, Tempelaars A, et al. Mutational spectrum of the TSC1 gene in a cohort of 225 tuberous sclerosis complex patients: No evidence for genotype-phenotype correlation. J Med Genet 1999;36:285Y Dabora SL, Jozwiak S, Franz DN, et al. Mutational analysis in a cohort of 224 tuberous sclerosis patients indicates increased severity of TSC2, compared with TSC1, disease in multiple organs. Am J Hum Genet 2001;68:64Y Hung CC, Su YN, Chien SC, et al. Molecular and clinical analyses of 84 patients with tuberous sclerosis complex. BMC Med Genet 2006;7: Kral T, Clusmann H, Urbach J, et al. Preoperative evaluation for epilepsy surgery (Bonn Algorithm). Zentralbl Neurochir 2002;63: 106Y Fassunke J, Majores M, Tresch A, et al. Array analysis of epilepsyassociated gangliogliomas reveals expression patterns related to aberrant development of neuronal precursors. Brain 2008;131:3034Y Becker AJ, Blümcke I, Urbach H, et al. Molecular neuropathology of epilepsy-associated glioneuronal malformations. J Neuropathol Exp Neurol 2006;65:99Y Gutmann DH, Zhang Y, Hasbani MJ, et al. Expression of the tuberous sclerosis complex gene products, hamartin and tuberin, in central nervous system tissues. Acta Neuropathol 2000;99:223Y Schick V, Majores M, Engels G, et al. Differential Pi3K-pathway activation in cortical tubers and focal cortical dysplasias with balloon cells. Brain Pathol 2007;17:165Y Miyata H, Chiang AC, Vinters HV. Insulin signaling pathways in cortical dysplasia and TSC-tubers: Tissue microarray analysis. Ann Neurol 2004;56:510Y Lamb RF, Roy C, Diefenbach TJ, et al. The TSC1 tumour suppressor hamartin regulates cell adhesion through ERM proteins and the GTPase Rho. Nat Cell Biol 2000;2:281Y Wienecke R, Maize JC Jr, Shoarinejad F, et al. Co-localization of the TSC2 product tuberin with its target Rap1 in the Golgi apparatus. Oncogene 1996;13:913Y Murthy V, Haddad LA, Smith N, et al. Similarities and differences in the subcellular localization of hamartin and tuberin in the kidney. Am J Physiol Renal Physiol 2000;278:F737Y Plank TL, Yeung RS, Henske EP. Hamartin, the product of the tuberous sclerosis 1 (TSC1) gene, interacts with tuberin and appears to be localized to cytoplasmic vesicles. Cancer Res 1998;58:4766Y Yamamoto Y, Jones KA, Mak BC, et al. Multicompartmental distribution of the tuberous sclerosis gene products, hamartin and tuberin. Arch Biochem Biophys 2002;404:210Y Fukuda T, Kobayashi T, Momose S, et al. Distribution of Tsc1 protein detected by immunohistochemistry in various normal rat tissues and the renal carcinomas of Eker rat: Detection of limited colocalization with Tsc1 and Tsc2 gene products in vivo. Lab Invest 2000;80:1347Y Catania MG, Mischel PS, Vinters HV. Hamartin and tuberin interaction with the G2/M cyclin-dependent kinase CDK1 and its regulatory cyclins A and B. J Neuropathol Exp Neurol 2001;60:711Y23 Ó 2009 American Association of Neuropathologists, Inc by the American Association of Neuropathologists, Inc. Unauthorized reproduction of this article is prohibited.
178 Lugnier et al J Neuropathol Exp Neurol Volume 68, Number 10, October Bichelmeier U, Schmidt T, Hubener J, et al. Nuclear localization of ataxin-3 is required for the manifestation of symptoms in SCA3: In vivo evidence. J Neurosci 2007;27:7418Y Habib SL, Michel D, Masliah E, et al. Role of tuberin in neuronal degeneration. Neurochem Res 2008;33:1113Y Chong-Kopera H, Inoki K, Li Y, et al. TSC1 stabilizes TSC2 by inhibiting the interaction between TSC2 and the HERC1 ubiquitin ligase. J Biol Chem 2006;281:8313Y Hu J, Zacharek S, He YJ, et al. WD40 protein FBW5 promotes ubiquitination of tumor suppressor TSC2 by DDB1-CUL4-ROC1 ligase. Genes Dev 2008;22:866Y Becker AJ, Klein H, Baden T, et al. Mutational and expression analysis of the reelin pathway components CDK5 and doublecortin in gangliogliomas. Acta Neuropathol 2002;104:403Y8 39. Johnson MW, Kerfoot C, Bushnell T, et al. Hamartin and tuberin expression in human tissues. Mod Pathol 2001;14:202Y Miloloza A, Rosner M, Nellist M, et al. The TSC1 gene product, hamartin, negatively regulates cell proliferation. Hum Mol Genet 2000; 9:1721Y Thom M, Martinian L, Sen A, et al. Cortical neuronal densities and lamination in focal cortical dysplasia. Acta Neuropathol (Berl) 2005;110: 383Y Ó 2009 American Association of Neuropathologists, Inc by the American Association of Neuropathologists, Inc. Unauthorized reproduction of this article is prohibited.


179 Biochimica et Biophysica Acta 1802 (2010) Contents lists available at ScienceDirect Biochimica et Biophysica Acta journal homepage: Analysis of TSC1 truncations defines regions involved in TSC1 stability, aggregation and interaction Marianne Hoogeveen-Westerveld, Carla Exalto, Anneke Maat-Kievit, Ans van den Ouweland, Dicky Halley, Mark Nellist Department of Clinical Genetics, Erasmus Medical Centre, Dr. Molewaterplein 50, 3015 GE Rotterdam, The Netherlands article info abstract Article history: Received 4 May 2010 Received in revised form 7 June 2010 Accepted 8 June 2010 Available online 12 June 2010 Keywords: Tuberous sclerosis complex TSC1 TSC2 TORC1 Tuberous sclerosis complex (TSC) is an autosomal dominant disorder characterised by the development of hamartomas in a variety of organs and tissues. The disease is caused by mutations in either the TSC1 gene on chromosome 9q34, or the TSC2 gene on chromosome 16p13.3. The TSC1 and TSC2 gene products, TSC1 and TSC2, interact to form a protein complex that inhibits signal transduction to the downstream effectors of the target of rapamycin complex 1 (TORC1). Here we investigate TSC1 structure and function by analysing a series of truncated TSC1 proteins. We identify specific regions of the protein that are important for TSC1 stability, localisation, interactions and function Elsevier B.V. All rights reserved. 1. Introduction Tuberous sclerosis complex (TSC) is an autosomal dominant disorder characterised by the development of hamartomas in a variety of organs and tissues, including the brain, skin and kidneys [1]. Mutations in either the TSC1 gene on chromosome 9q34 [2], or the TSC2 gene on chromosome 16p13.3 [3] cause TSC. The TSC1 and TSC2 gene products, TSC1 and TSC2, interact to form a protein complex [4]. TSC2 contains a GTPase activating protein (GAP) domain, and the TSC1 TSC2 complex has been shown to have GAP activity for a GTPase called ras homolog expressed in brain (RHEB). The TSC1 TSC2 complex stimulates the hydrolysis of RHEB-bound GTP to GDP, thereby inhibiting the RHEB-GTP-dependent stimulation of the target of rapamycin complex 1 (TORC1) [5]. TORC1 regulates a wide array of cellular processes, including transcription, translation and autophagy [6]. Inactivation of the TSC1 TSC2 complex results in the phosphorylation of TORC1 targets, including p70 S6 kinase (S6K) and elongation factor 4E binding protein 1 and, consequently, increased protein synthesis and cell growth [6]. TSC1 has limited homology with other proteins [2] and the exact role of TSC1 in the TSC1 TSC2 complex is not completely clear. Some studies have shown that TSC1 is required for TSC2 GAP activity [7 9], while others suggest Abbreviations: TSC, tuberous sclerosis complex; RHEB, ras homolog expressed in brain; TORC1, target of rapamycin complex 1; S6K, p70 S6 kinase; GAP, GTPase activating protein Corresponding author. Tel.: ; fax: address: m.nellist@erasmusmc.nl (M. Nellist). that TSC1 is not essential for GAP activity but is necessary to maintain the stability, activity and correct intracellular localisation of the TSC1 TSC2 complex [10,11]. TSC1 has been shown to be involved in recruitment of the TSC1 TSC2 complex to cell membranes [12] and may integrate multiple inputs to help regulate TORC1 activity, or perform other, independent functions [13]. In the absence of TSC2, over-expressed TSC1 forms Triton X100- insoluble aggregates or inclusions due to interactions between the coiled coil regions (amino acids ) of different TSC1 molecules [14]. Coexpression of TSC2 prevents the formation of these inclusions, resulting in a shift of TSC1 to Triton X100-soluble cell lysate fractions [15]. Stable TSC1 TSC2 complexes can be immunoprecipitated from these cell fractions, demonstrating that TSC2 acts as a molecular chaperone, maintaining TSC1 in a stable cytosolic form [14]. Recently, we identified TSC1 amino acid substitutions in TSC patients that prevented TSC1 inclusion formation in vitro [16,17]. Surprisingly, none of these changes mapped to the coiled coil region, indicating that other regions of TSC1 are also important for the expression and localisation of the protein. To gain additional insight into the structure and function of TSC1, we compared full-length TSC1 to a series of TSC1 N- and C-terminal truncation proteins. Our in vitro analysis demonstrates that the N- terminal region is important for TSC1 stability and that both the N- terminal and coiled coil regions are required for TSC1 aggregation. Furthermore, we show that multiple regions of TSC1 are required for binding TSC2 and that some TSC1 truncations can co-operate with TSC2 to inhibit TORC1 activity. This information will be useful for the functional characterisation of unclassified TSC1 variants identified in individuals with TSC /$ see front matter 2010 Elsevier B.V. All rights reserved. doi: /j.bbadis
180 M. Hoogeveen-Westerveld et al. / Biochimica et Biophysica Acta 1802 (2010) Materials and methods 2.1. Generation of constructs and antisera To derive expression constructs encoding myc-tagged TSC1 C- terminal truncations a KpnI site was introduced into a full-length myc-tagged TSC1 expression construct by site-directed mutagenesis (QuikChange, Stratagene, La Jolla, CA, U.S.A.). After digestion with KpnI to excise the 3 portion of the TSC1 open reading frame (ORF), the vector and remaining ORF was re-circularised so that the epitope tag remained in-frame with the last codon of the truncated TSC1 ORF. N- terminal truncations were derived in a similar way. A NheI site was introduced to allow excision of the 5 portion of the TSC1 ORF. In each case the complete open reading frame of the new construct was verified by sequence analysis. Expression constructs were derived for 4 C-terminal truncation proteins: Q900 (TSC1 amino acids 1 900, molecular mass 100 kda), R692 (amino acids 1 692, 80 kda), R509 (amino acids 1 509, 60 kda) and T339 (amino acids 1 339, 35 kda); one N-terminal truncation protein, M351 (amino acids , 100 kda), and one truncation protein, M351-Q900, lacking both termini (amino acids , 65 kda). The L117P and M224R missense changes were introduced by site-directed mutagenesis, as described previously [15]. An overview of the expressed TSC1 truncation proteins is shown in Fig. 1. Other constructs used in this study have been described elsewhere [4,15,18]. Antibodies were purchased from Cell Signaling Technology (Danvers, MA, U.S.A.), except for a mouse monoclonal antibody against TSC2 which was purchased from Zymed Laboratories (San Francisco, CA, U.S.A.), or were described previously [4]. Secondary antibodies for infra-red detection proteins on immunoblots were obtained from Li-Cor Biosciences (Lincoln, NE, U.S.A.) Immunoblot analysis of cells over-expressing TSC1 truncations HEK 293T cells in 3.5 cm dishes were transfected with expression constructs using polyethylenimine (Polysciences Inc., Warrington, PA, U.S.A.)[19]. Twenty-four hours after transfection the cells were washed with cold phosphate buffered saline (PBS) and lysed in 0.15 ml lysis buffer (50 mm Tris HCl (ph 7.5), 100 mm NaCl, 50 mm NaF, 1% Triton X100 and a protease inhibitor cocktail (Complete, Roche Molecular Biochemicals)) for 10 min on ice. The cell lysates were cleared by centrifugation (10,000 g for 10 min at 4 C) and the supernatant (Triton X100-soluble) and pellet (Triton X100-insoluble) fractions were recovered. The pellet fractions were resuspended in 0.15 ml lysis buffer and sonicated at 12 μm for 15 s prior to immunoblot analysis using the Criterion SDS-PAGE system (BioRad, Hercules, CA, U.S.A.). Protein expression levels were estimated by near infra-red detection and quantification of the blotted proteins on an Odyssey scanner (Li-Cor Biosciences). To estimate the effect of the TSC1 truncation proteins on S6K T389 phosphorylation HEK 293T cells were transfected with a 4:2:1 mixture of the TSC1, TSC2 and S6K expression constructs and harvested as above. The Triton X100-soluble fractions were analysed by immunoblotting, as described previously [16,17] Immunofluorescent detection of TSC1 truncations HEK 293T cells were seeded onto glass cover slides coated with poly-l-lysine (Sigma-Aldrich, Carlsbad, CA, U.S.A.), transfected and processed for immunofluorescent microscopy as described previously [16]. Fixed, permeabilised cells were incubated with a primary mouse monoclonal antibody specific for the myc epitope tag, followed by a cyanine (Cy2)-coupled secondary antibody (DAKO, Fig. 1. TSC1 truncation proteins. Schematic diagram illustrating the TSC1 truncation proteins used as part of this study. The positions of the predicted transmembrane domain (amino acids ), coiled coil region (amino acids ), and the L117P and M224R missense mutations identified in individuals with TSC are indicated. Numbers indicate the positions of the first and last amino acids, relative to the full-length protein (top).
181 776 M. Hoogeveen-Westerveld et al. / Biochimica et Biophysica Acta 1802 (2010) Carpinteria, CA, U.S.A.). Cells were mounted in Mowiol (Calbiochem, La Jolla, CA, U.S.A.) and studied using a Leica DM RXA microscope and Image Pro-Plus version 6 image analysis software Coimmunoprecipitation of TSC2 with the TSC1 truncations Immunoprecipitations were performed using the Triton X100- soluble cell lysate fractions. EZ Red anti-myc affinity beads (Sigma- Aldrich) were pre-equilibrated in lysis buffer prior to incubation with the cell lysates for 3 h at 4 C with gentle rotation. The beads were washed at least 3 times with N20-fold excess of lysis buffer per wash step. Beads were recovered by gentle centrifugation (1000 g for 15 s at 4 C) between each wash step, and resuspended in sample buffer prior to immunoblot analysis. 3. Results 3.1. TSC1 truncation proteins -insoluble fractions by immunoblotting. Full-length TSC1 and the Q900 truncation were detected predominantly in the Triton X100-insoluble fraction, while the remaining truncation proteins were detected predominantly in the soluble fraction (Fig. 2A,C) TSC1 truncation prevents aggregate formation The Q900 truncation protein localised to cytoplasmic punctate inclusions or aggregates in HEK 293 T cells (Fig. 3A) and was detected predominantly in Triton X100-insoluble cell lysate fractions, similar to full-length TSC1 (Fig. 2A,C). In contrast, truncation proteins R692, R509 and T339 that lack the entire coiled coil region, and the M351 truncation protein, that contains the coiled coil region but lacks the TSC1 N- terminal, were detected predominantly in Triton X100-soluble cell lysate fractions (Fig. 2A,C) and did not form cytoplasmic inclusions (Fig. 3C,D, and data not shown) We concluded that the coiled coil region was necessary but not sufficient for aggregate formation. We derived expression constructs for 4 C-terminal TSC1 truncations that we called: Q900, R692, R509 and T339. The Q900 truncation consists of TSC1 amino acids and corresponds to a TSC1 c.2919c NT (p.q900x) mutation, the most distal TSC1 mutation identified in our patient cohort [20]. We identified this mutation in 2 unrelated cases of TSC. Clinical data was available for one of these individuals (Table 1). The R692 and R509 truncations consist of amino acids and respectively, and correspond to the TSC1 c.2295cnt and c.1746cnt mutations. Together these 2 mutations account for N5% of the TSC1 variants listed in the Leiden Open Tuberous Sclerosis Complex Variation Database [21]. We identified the TSC1 c.2295cnt mutation in 6 families in our cohort, and in 5 cases had clinical data on one or more individuals (Table 1). We identified 6 cases with the TSC1 c.1746cnt mutation in our cohort. Clinical data was available for one individual (Table 1). The T339 truncation corresponds to a TSC1 c.1015dupa mutation identified in an individual with very mild peripheral features of TSC, epilepsy and cognitive disturbances (Table 1) (P. de Vries, personal communication). In addition to the C-terminal truncations, we expressed 2 proteins lacking 350 amino acids from the N-terminus of TSC1. Truncation protein M351 consisted of TSC1 amino acids , and truncation protein M351-Q900 consisted of amino acids A schematic overview of the truncation proteins is shown in Fig. 1. Full-length TSC1 and the TSC1 truncation proteins were expressed as fusion proteins containing a C-terminal myc epitope tag. This tag did not interfere with either the TSC1 TSC2 interaction, or with the function of the TSC1 TSC2 complex [15 19]. We compared the relative expression levels of the truncation proteins in the Triton X100-soluble and Table 1 Clinical findings in individuals with the TSC1 c.2919cnt (p.q900x), TSC1 c.2295cnt (p. R692X) and TSC1 c.1015dupa (p.t339x) mutations. Case Mutation Renal Other Skin Neurological Brain 1 c.2919c NT RC HM, FA, SP E, MR, BD SEN, CT 2 c.2295c NT CR HM E, MR SEN, CT 3 c.2295c NT HM E SEN, CT 4.1 c.2295c NT FA, HM E SEGA 4.2 c.2295c NT UF E SEN 5 c.2295c NT CR HM, SP E, BD 6 c.2295c NT DP, RP FA, UF E, BD SEN, CT 7 c.1746c NT RC CR SEN, CT 8 c.1015dupa WPW HM E, BD Key:, not present, or not recorded; RC, renal cysts; CR, cardiac rhabdomyoma; DP, dental pit; RP, retinal phakoma; WPW, Wolff Parkinson White syndrome; HM, hypomelanotic macule; SP, shagreen patch; UF, ungual fibroma; FA, facial angiofibroma; E, epilepsy; MR, mental retardation; BD, behavioural disturbance; SEN, subependymal nodule; CT, cortical tuber; and SEGA, subependymal giant cell astrocytoma. Fig. 2. Immunoblot analysis of TSC1 truncation proteins. Wild-type myc-tagged TSC1 (TSC1) and the myc-tagged truncations were over-expressed in HEK 293T cells. Triton X100-soluble and -insoluble cell lysate fractions were separated on 4 12% gradient SDS-PAGE gels, blotted and incubated with a monoclonal mouse antibody against the myc epitope tag. (A) Immunoblot of Triton X100-soluble and -insoluble cell lysate fractions. Bands marked with an asterisk (*) are due to leakage of the signal from the R692 truncation. (B) Total expression of the TSC1 truncation proteins. Truncation protein levels were quantified in at least 3 separate experiments, and the mean expression levels, relative to full-length myc-tagged TSC1, were derived. Standard deviations are indicated. (C) Relative expression of the TSC1 truncations in Triton X100- soluble and -insoluble cell lysate fractions. The signal detected in the soluble fraction was divided by the total signal (soluble+insoluble) for each protein in at least 3 separate experiments. Standard deviations are indicated.

182 M. Hoogeveen-Westerveld et al. / Biochimica et Biophysica Acta 1802 (2010) Fig. 3. Immunofluorescence analysis of TSC1 truncation protein expression. Transfected HEK 293T cells expressing the different truncation proteins were fixed and incubated with an antibody against the myc epitope tag. (A) Punctate, cytoplasmic localisation of truncation protein Q900. (B) Punctate, cytoplasmic localisation of full-length TSC1. (C) Diffuse, cytoplasmic localisation of truncation protein M351. (D) Diffuse, cytoplasmic localisation of truncation protein R The N-terminal region is required for TSC1 stability Pathogenic amino acid substitutions in the N-terminal region of TSC1 prevent TSC1 aggregation and reduce expression levels in vitro [16,17]. To determine whether this destabilisation is due to effects on local protein folding, or due to long-range interactions between the N- and C- terminal regions of TSC1, a N-terminal amino acid substitution (M224R) [17] was introduced into the R692 truncation protein. that lacks the C-terminal region (amino acids ). As shown in Fig. 4, the M224R substitution reduced the amount of both fulllength TSC1 and the R692 truncation detected in the Triton X100 soluble fraction, demonstrating that the M224R substitution had the same effect irrespective of the presence or absence of amino acids We concluded that the low expression levels of TSC1 missense mutants [16,17,22] are more likely due to autonomous effects on the N-terminal region than disruption of long-range interactions with the TSC1 C- terminal, containing the predicted coiled coil regions TSC1 truncation reduces the stability of the TSC1 TSC2 complex The formation of stable, Triton X100-soluble TSC1 TSC2 complexes prevents TSC1 aggregation [14]. We coexpressed TSC2 with the TSC1 truncations in HEK 293T cells and estimated the proportions of the expressed proteins in the Triton X100-soluble fractions (Fig. 5A,C). As expected, the proportion of full-length TSC1 detected in the Triton X100- soluble fraction was increased by coexpression of TSC2, as estimated by immunoblotting (compare Figs. 2C and 5C). TSC2 coexpression had a similar effect on the Q900 truncation, increasing the proportion detected in the soluble fraction (compare Figs. 2C and 5C). To investigate whether the TSC1 truncation proteins interacted directly with TSC2, we coexpressed TSC2 with the different TSC1 truncations and immunoprecipitated the truncation proteins from the Triton X100-soluble cell lysate fractions. We determined whether TSC2 was coimmunoprecipitated by immunoblotting. As shown in Fig. 6, all the TSC1 truncation proteins were immunoprecipitated efficiently, even those that were expressed at low levels. TSC2 coimmunoprecipitated with TSC1 and with the M351 and Q900 truncations, and to a lesser extent with the R692 and R509 truncations. TSC2 was not coimmunoprecipitated with the M351-Q900 or T339 truncations or with a control protein (myc-tagged β-lactamase). The interaction detected between the Q900 truncation and TSC2 was consistent with the observed shift of the Q900 truncation from the insoluble to the soluble fraction (compare Figs. 2 and 5). However, the TSC2 Q900 interaction appeared weaker than that between TSC2 and full-length TSC1 (Fig. 6D). Similarly, TSC2 was coimmunoprecipitated with the M351 truncation, but less efficiently than with fulllength TSC1 (Fig. 6D). Therefore, we concluded that multiple regions of TSC1 are necessary for the interaction with TSC2 and to form a stable TSC1 TSC2 complex The central region of TSC1 is involved in TSC1 TSC1 interactions Interactions between the TSC1 coiled coil regions cause TSC1 aggregation [14]. We sought additional evidence for TSC1 TSC1 interactions by coimmunoprecipitation. As shown in Fig. 7, the myctagged TSC1 truncations were immunoprecipitated from Triton X100- soluble fractions. Coimmunoprecipitated full-length (untagged) TSC1 was detected by immunoblotting. TSC1 was coimmunoprecipitated with the M351 and M351-Q900 truncations that contain part or all of the coiled coil region, and, to a lesser extent, by the R509 and R692 truncations, that do not (Fig. 7A,C). TSC1 was not detected in the T339 and Q900 immunoprecipitates, or in the control immunoprecipitate. We were unable to detect stable TSC1 Q900 complexes by coimmunoprecipitation because both full-length TSC1 and the Q900 truncation localised predominantly to the Triton X100-insoluble cell lysate fractions. We concluded that in addition to the coiled coil region, the central region of TSC1 (amino acids ) is involved in the TSC1 TSC1 interaction.
, the TSC1-M224R mutant, the R692 truncation protein, and the R692-M224R mutant truncation were coexpressed with TSC2 in HEK 293T cells.")
 Immunoblot showing expression of full-length TSC1 and the R692 truncation protein compared to the TSC1- M224R and R692-M224R mutants.")
183 778 M. Hoogeveen-Westerveld et al. / Biochimica et Biophysica Acta 1802 (2010) Fig. 4. Effect of the M224R amino acid substitution on expression of the R692 truncation protein. Wild-type myc-tagged TSC1 (TSC1), the TSC1-M224R mutant, the R692 truncation protein, and the R692-M224R mutant truncation were coexpressed with TSC2 in HEK 293T cells. Triton X100-soluble and -insoluble cell lysate fractions were separated on 4 12% gradient SDS-PAGE gels, blotted and incubated with antibodies specific for TSC2 and the myc epitope tag. (A) Immunoblot showing expression of full-length TSC1 and the R692 truncation protein compared to the TSC1- M224R and R692-M224R mutants. The levels of the TSC1-M224R and R692-M224R mutants detected in the Triton X100 soluble fraction is reduced compared to wild-type TSC1 and the R692 truncation. Coexpressed TSC2 is shown as a control for transfection efficiency. (B) Total expression of the TSC1-M224R and R692-M224R mutants. Protein levels in the Triton X100 soluble and insoluble fractions were quantified and summed in at least 3 separate experiments, and the mean expression levels, relative to fulllength myc-tagged TSC1, were calculated. Standard deviations are indicated. (C) Relative expression of the TSC1-M224R and R692-M224R mutants in Triton X100- soluble and -insoluble cell lysate fractions. The signal detected in the soluble fraction was divided by the total signal (soluble+insoluble) for each protein in at least 3 separate experiments. Standard deviations are indicated TSC1 truncation proteins help TSC2 suppress TORC1 activity To determine whether the TSC1 truncations could affect the TSC2- dependent inhibition of S6K-T389 phosphorylation, TSC2, S6K and the TSC1 truncations, were expressed in HEK 293T cells and the T389 phosphorylation status of S6K was estimated by immunoblotting, as shown in Fig. 8. The R509 truncation was not included in this analysis as it comigrated with S6K, making it difficult to detect and quantify separate R509 and S6K signals. Although the expression levels of the different TSC1 truncation proteins were variable (Fig. 8B), the expression levels of TSC2 (Fig. 8C) Fig. 5. Immunoblot analysis of coexpression of TSC2 and the TSC1 truncation proteins. Wild-type myc-tagged TSC1 (TSC1) and the myc-tagged truncations were coexpressed with TSC2 in HEK 293T cells. Triton X100-soluble and -insoluble cell lysate fractions were separated on 4 12% gradient SDS-PAGE gels, blotted and incubated with antibodies specific for TSC2 and the myc epitope tag. (A) Immunoblot of Triton X100-soluble and -insoluble cell lysate fractions prepared from cells coexpressing TSC2 and the TSC1 truncation proteins. (B) Effect of TSC2 coexpression on expression levels of the TSC1 truncation proteins. Protein levels were quantified as in Fig. 2B. Standard deviations are indicated. (C) Effect of TSC2 coexpression on the relative expression levels of the TSC1 truncation proteins in Triton X100-soluble and -insoluble cell lysate fractions. Expression levels were quantified as in Fig. 2C. Standard deviations are indicated. and S6K (Fig. 8E) were relatively constant. This indicated that coexpression of the different TSC1 truncations did not affect TSC2 expression levels. In cells coexpressing TSC2 and full-length TSC1, S6K-T389 phosphorylation was reduced approximately 7-fold compared to cells expressing neither protein, or to cells expressing TSC1 only (Fig. 8D). Expression of TSC2 only (without TSC1) was less effective than coexpression of TSC1 and TSC2: S6K-T389 phosphorylation was approximately 5-fold higher in TSC2 expressing cells, than in TSC1 TSC2 expressing cells. Coexpression of the TSC1 T339 and M351-Q900 truncations did not affect the ability of TSC2 to reduce S6K-T389 phosphorylation (Fig. 8D). In contrast, coexpression of TSC2 with the TSC1-L117P variant [17] reduced S6K-T389 phosphorylation to a level approximately 3-fold higher than in the TSC1-TSC2 expressing cells, indicating that this variant can partially
184 M. Hoogeveen-Westerveld et al. / Biochimica et Biophysica Acta 1802 (2010) Fig. 6. Immunoblot analysis of TSC1 TSC2 interactions. TSC1 truncation proteins were coexpressed with TSC2 in HEK 293T cells. The truncation proteins were immunoprecipitated from Triton X100-soluble cell lysate fractions using an anti-myc epitope affinity matrix, and coimmunoprecipitated TSC2 was detected by immunoblotting. Each interaction was tested at least 3 times. (A and B) Immunoblots showing coimmunoprecipitation of TSC2 with full-length TSC1 and the M351, Q900, R692 and R509 truncations, but not with the M351-Q900 or T339 truncations, or the myc-tagged β-lactamase control protein (lac). (C) Mean total signal intensity of the immunoprecipitated truncations, relative to full-length TSC1. Standard deviations are indicated. (D) Mean total signal intensity of coimmunoprecipitated TSC2, relative to the TSC2 signal detected after coimmunoprecipitation with fulllength TSC1. Standard deviations are indicated. inhibit TORC1 activity in vitro. Interestingly, the M351, Q900 and R692 truncations had a similar effect. In each case, S6K-T389 phosphorylation was increased approximately 3-fold with respect to the TSC1 TSC2 expressing cells, but reduced with respect to cells expressing TSC2 only. Therefore, in this in vitro assay, the TSC1 R692, M351 and Q900 truncation proteins all increased the TSC2-dependent inhibition of S6K-T389 phosphorylation, albeit not as effectively as full-length TSC1. 4. Discussion TSC1 and TSC2 encode the TSC1 TSC2 protein complex, an essential regulator of TORC1 [23]. TSC2 contains the active site of the TSC1 TSC2 complex and therefore has a clearly defined functional role. In contrast, the role of TSC1 is less clear. Some studies suggest that TSC1 is required for TSC2 GAP activity, while others indicate that TSC1 does not affect the catalytic activity of the TSC1 TSC2 complex, but prevents the degradation of the complex [7 11]. To gain more insight into the structure and function of TSC1, we compared the characteristics of a series of TSC1 truncation proteins with full-length, wild-type TSC1. We found that deletion of the complete TSC1 coiled coil region (amino acids ) prevented TSC1 aggregation and that sequences close to the N-terminal were required for both stability and aggregate formation. Deletion of amino acids , containing the C-terminal part of the coiled coil region, did not prevent aggregate formation but did reduce the strength of the TSC1 TSC2 interaction and the activity of the TSC1 TSC2 complex, consistent with the identification of truncating mutations in this region of the TSC1 gene in TSC patients [20,21]. Deletion of the N-terminal region (amino acids 1 350) had the same effect on TSC1 expression levels as missense changes to this region [16,17,22]. When one of these mutations (M224R) [17] was introduced into the R692 truncation protein, the expression level of the truncation protein was reduced, indicating that the N-terminal region has an autonomous effect on TSC1 stability. It has been suggested that a putative transmembrane domain in the N-terminal region of TSC1 (amino acids ) may be important for the correct localisation of the TSC1 TSC2 complex [12]. One possibility is that recruitment of TSC1 to membranes might help stabilise the TSC1 TSC2 complex. Mutant TSC1 TSC2 complexes, that are unable to be recruited to the membrane, might therefore be degraded more rapidly. To investigate the interactions between TSC2 and the TSC1 truncation proteins we performed coimmunoprecipitation experiments. Together, deletion of the N- and C-terminal regions of TSC1 (amino acids and ) prevented TSC2 binding, while truncation at either terminal only reduced the interaction, indicating that both the N- and C- terminal regions of TSC1 are necessary for the formation of stable TSC1 TSC2 complexes. The M351 and Q900 truncations that were able to bind TSC2,werealsoabletopromotetheTSC2-mediatedinhibitionofTORC1 activity, as assayed by the phosphorylation status of the TORC1 substrate, S6K. Full-length TSC1 coimmunoprecipitated with the R509 and M351- Q900 truncations, confirming that TSC1 interacts with itself [14], and indicating that the central region of the protein (amino acids ) is required for this interaction. In these experiments we only overexpressed TSC1 and the TSC1 truncations, not TSC2. Furthermore, the M351-Q900 truncation did not interact with TSC2. Therefore, it is unlikely that the detected TSC1 TSC1 interactions are a consequence of
185 780 M. Hoogeveen-Westerveld et al. / Biochimica et Biophysica Acta 1802 (2010) may indeed have distinct effects on TSC1 TSC2 function in vivo. Only limited clinical data were available for the individuals with mutations corresponding to the truncation proteins analysed. However, we did not observe any obvious differences between the individuals with a TSC1 c.2295cnt (p.r692x), TSC1 c.2919cnt (p.q900x) or TSC1 c.1015dupa (p.t339x) mutation. More work is required to establish whether the distinct functional characteristics of truncated TSC1 isoforms influence the (neurocognitive) phenotype in TSC. 5. Conclusions The N-terminal region of TSC1 (amino acids 1 350) is required to stabilise TSC1 and maintain expression levels in the cell. The central (amino acids ) and C-terminal (amino acids ) regions are required for TSC1 TSC1 interactions. Multiple regions of TSC1, including the N- and C-terminal regions, are required for binding TSC2, and the binding between truncated TSC1 proteins and TSC2 is sufficient to promote the ability of TSC2 to inhibit TORC1 activity in vitro. This information will be useful for the detailed functional characterisation of unclassified TSC1 missense variants identified in individuals with TSC. Acknowledgements P. de Vries (University of Cambridge, U.K.) is thanked for providing information on the TSC1 c.1015dupa (p.t339x) mutation, and for useful comments on the manuscript. Financial support was provided by the U.S. Department of Defense Congressionally-Directed Medical Research Program (grant #TS060052). The authors report no conflicts of interest. The funding source had no role in the project. References Fig. 7. Immunoblot analysis of TSC1 TSC1 interactions. The myc-tagged TSC1 truncations were coexpressed with full-length TSC1 (untagged) in HEK 293T cells. The truncations were immunoprecipitated from Triton X100-soluble cell lysate fractions using an anti-myc epitope affinity matrix. Coimmunoprecipitated, untagged TSC1 was detected by immunoblotting. Each interaction was tested at least 3 times. (A) Immunoblot showing coimmunoprecipitation of full-length TSC1 with the M351-Q900, M351, R692 and R509 truncations, but not with the Q900 or T339 truncations, or the myc-tagged β-lactamase control protein (lac). (B) Mean total signal intensity of the immunoprecipitated truncations, relative to the β-lactamase control protein (lac). Standard deviations are indicated. (C) Mean total signal intensity of coimmunoprecipitated TSC1, relative to the signal detected after coimmunoprecipitation with the M351 truncation. Standard deviations are indicated. the formation of TSC1 TSC2 complexes containing multiple TSC1 and TSC2 subunits. Nevertheless, the TSC1 TSC1 interaction indicates that it is possible that TSC1 TSC2 complexes consist of multiple TSC1 and TSC2 subunits in vivo. It will be interesting to investigate whether substitutions in the central region of TSC1 (amino acids ) disrupt TSC1 TSC1 binding, and whether such changes can cause the TSC phenotype. Recently it has been proposed that different TSC1 and TSC2 mutations may result in different neurocognitive manifestations of TSC, depending on the exact effects of the mutations on the regulation of signaling by the TSC1 TSC2 complex [24]. One requirement of this hypothesis is that mutant TSC1 and TSC2 isoforms are expressed. Although all our experiments were performed in vitro on over-expressed proteins, our data suggest that if truncated TSC1 isoforms are expressed, then they [1] M. Gomez, J. Sampson, V. Whittemore (Eds.), The Tuberous Sclerosis Complex, Oxford University Press, Oxford, UK, [2] M. van Slegtenhorst, R. de Hoogt, C. Hermans, M. Nellist, L.A.J. Janssen, S. Verhoef, D. Lindhout, A.M.W. van den Ouweland, D.J.J. Halley, J. Young, M. Burley, S. Jeremiah, K. Woodward, J. Nahmias, M. Fox, R. Ekong, J. Wolfe, S. Povey, J. Osborne, R.G. Snell, J.P. Cheadle, A.C. Jones, M. Tachataki, D. Ravine, J.R. Sampson, M.P. Reeve, P. Richardson, F. Wilmer, C. Munro, T.L. Hawkins, T. Sepp, J.B.M. Ali, S. Ward, A.J. Green, J.R.W. Yates, M.P. Short, J.H. Haines, S. Jozwiak, J. Kwiatkowska, E.P. Henske, D.J. Kwiatkowski, Identification of the tuberous sclerosis gene TSC1 on chromosome 9q34, Science 277 (1997) [3] The European Chromosome 16 Tuberous Sclerosis Consortium, Identification and characterization of the tuberous sclerosis gene on chromosome 16, Cell 75 (1993) [4] M. van Slegtenhorst, M. Nellist, B. Nagelkerken, J. Cheadle, R. Snell, A. van den Ouweland, A. Reuser, J.R. Sampson, D. Halley, P. van der Sluijs, Interaction between hamartin and tuberin, the TSC1 and TSC2 gene products, Hum. Mol. Genet. 7 (1998) [5] Y. Li, M.N. Corradetti, K. Inoki, K.-L. Guan, TSC2: filling the GAP in the mtor signaling pathway, Trends Biochem. Sci. 28 (2003) [6] D.A. Guertin, D.M. Sabatini, Defining the role of mtor in cancer, Cancer Cell 12 (2007) [7] Y. Zhang, X. Gao, L.J. Saucedo, B. Ru, B.A. Edgar, D. Pan, Rheb is a direct target of the tuberous sclerosis tumour suppressor proteins, Nat. Cell Biol. 5 (2003) [8] A. Garami, F.J. Zwartkruis, T. Nobukuni, M. Joaquin, M. Roccio, H. Stocker, S.C. Kozma, E. Hafen, J.L. Bos, G. Thomas, Insulin activation of Rheb, a mediator of mtor/s6k/4e- BP signaling, is inhibited by TSC1 and 2, Mol. Cell 11 (2003) [9] A.R. Tee, B.D. Manning, P.P. Roux, L.C. Cantley, J. Blenis, Tuberous sclerosis complex gene products, tuberin and hamartin, control mtor signaling by acting as a GTPaseactivating protein complex toward Rheb, Curr. Biol. 13 (2003) [10] A.F. Castro, J.F. Rebhun, G.J. Clark, L.A. Quilliam, Rheb binds tuberous sclerosis complex 2 (TSC2) and promotes S6 kinase activation in a rapamycin- and farnesylation-dependent manner, J. Biol. Chem. 278 (2003) [11] K. Inoki, Y. Li, T. Xu, K.-L. Guan, Rheb GTPase is a direct target of TSC2 GAP activity and regulates mtor signaling, Genes Dev. 17 (2003) [12] S.L. Cai, A.R. Tee, J.D. Short, J.M. Bergeron, J. Kim, J. Shen, R. Guo, C.L. Johnson, K. Kiguchi, C.L. Walker, Activity of TSC2 is inhibited by AKT-mediated phosphorylation and membrane partitioning, J. Cell Biol. 173 (2006) [13] M. Rosner, M. Hanneder, N. Siegel, N. Valli, M. Hengstschlager, The tuberous sclerosis gene products hamartin and tuberin are multifunctional proteins with a wide spectrum of interacting partners, Mutat. Res. 658 (2008) [14] M. Nellist, M.A. van Slegtenhorst, M. Goedbloed, A.M.W. van den Ouweland, D.J.J. Halley, P. van der Sluijs, Characterization of the cytosolic tuberin-hamartin
 Immunoblot analysis of cells expressing S6K, TSC2 and either wild-type TSC1 (TSC1), mutant TSC1 (L117P), or the TSC1 truncation proteins (Q900, M351, R692, T339 and M351-Q900).")
186 M. Hoogeveen-Westerveld et al. / Biochimica et Biophysica Acta 1802 (2010) Fig. 8. Inhibition of S6K-T389 phosphorylation by the TSC1 proteins truncations. (A) Immunoblot analysis of cells expressing S6K, TSC2 and either wild-type TSC1 (TSC1), mutant TSC1 (L117P), or the TSC1 truncation proteins (Q900, M351, R692, T339 and M351-Q900). Cells transfected with vector only were included as a control (control). (B) Expression of the TSC1 truncation proteins. The signals for each truncation protein, relative to wild-type TSC1, were determined in 3 independent experiments. Standard deviations are indicated. (C) Expression of TSC2 in the presence of the TSC1 truncation proteins. The TSC2 signals in the presence of the different TSC1 truncations, relative to the TSC2 signal in the presence of wild-type TSC1 were compared. No large differences were observed. (D) Inhibition of S6K T389 phosphorylation in the presence of different TSC1 truncations. The ratio of the T389 S6K phosphorylation signal intensity to the total S6K signal intensity (T389/S6K), relative to the wild-type TSC1 (wild-type TSC1 T389/S6K ratio=1) was determined for each truncation. Standard deviations are indicated. (E) Expression of S6K in the presence of the TSC1 truncations. The total S6K signal in the presence of each of the different truncations, relative to the signal in the presence of wild-type TSC1 (TSC1), was determined for each truncation. Standard deviations are indicated. The total S6K signals in the presence of the different truncations were similar, indicating that transfection efficiency and gel-loading were consistent between samples. complex: tuberin is a cytosolic chaperone for hamartin, J. Biol. Chem. 274 (1999) [15] M. Nellist, B. Verhaaf, M.A. Goedbloed, A.J.J. Reuser, A.M.W. van den Ouweland, D.J.J. Halley, TSC2 missense mutations inhibit tuberin phosphorylation and prevent formation of thetuberin hamartincomplex, Hum. Mol. Genet. 10 (2001) [16] M. Mozaffari, M. Hoogeveen-Westerveld, D. Kwiatkowski, J. Sampson, R. Ekong, S. Povey, J.T. den Dunnen, A. van den Ouweland, D. Halley, M. Nellist, Identification of a region required for TSC1 stability by functional analysis of TSC1 missense mutations foundin individuals with tuberous sclerosis complex, BMC Med. Genet. 10 (2009) e88. [17] M. Nellist, D. van den Heuvel, D. Schluep, C. Exalto, M. Goedbloed, A. Maat-Kievit, T. van Essen, K. van Spaendonck-Zwarts, F. Jansen, P. Helderman, G. Bartalini, O. Vierimaa, M. Penttinen, J. van den Ende, A. van den Ouweland, D. Halley, Missense mutations to the TSC1 gene cause tuberous sclerosis complex, Eur. J. Hum. Genet. 17 (2009) [18] M. Nellist, O. Sancak, M.A. Goedbloed, C. Rohe, D. van Netten, K. Mayer, A. Tucker- Williams, A.M.W. van den Ouweland, D.J.J. Halley, Distinct effects of single amino acid changes to tuberin on the function of the tuberin hamartin complex, Eur. J. Hum. Genet. 13 (2005) [19] R. Coevoets, S. Arican, M. Hoogeveen-Westerveld, E. Simons, A. van den Ouweland, D. Halley, M. Nellist, A reliable cell-based assay for testing unclassified TSC2 gene variants, Eur. J. Hum. Genet. 17 (2009) [20] O. Sancak, M. Nellist, M. Goedbloed, P. Elfferich, C. Wouters, A. Maat-Kievit, B. Zonnenberg, S. Verhoef, D. Halley, A. van den Ouweland, Mutational analysis of the TSC1 and TSC2 genes in a diagnostic setting: genotype phenotype correlations and comparison of diagnostic DNA techniques in tuberous sclerosis complex, Eur. J. Hum. Genet. 13 (2005) [21] Tuberous sclerosis database Leiden Open Variation Database [ chromium.liacs.nl/lovd/index.php?select_db=tsc1]. [22] L.S. Pymar, F.M. Platt, J.M. Askham, E.E. Morrison, M.A. Knowles, Bladder tumourderived somatic TSC1 missense mutations cause loss of function via distinct mechanisms, Hum. Mol. Genet. 17 (2008) [23] K. Inoki, K.-L. Guan, Tuberous sclerosis complex, implication from a rare genetic disease to common cancer treatment, Hum. Mol. Genet. 18 (2009) [24] P. de Vries, C.J. Howe, The tuberous sclerosis complex proteins a GRIPP on cognition and neurodevelopment, Trends Mol. Med. 13 (2007)
TITLE: The Role of hcdc4 as a Tumor Suppressor Gene in Genomic Instability Underlying Prostate Cancer
 AD Award Number: TITLE: The Role of hcdc4 as a Tumor Suppressor Gene in Genomic Instability Underlying Prostate Cancer PRINCIPAL INVESTIGATOR: Audrey van Drogen, Ph.D. CONTRACTING ORGANIZATION: Sidney
PREPARED FOR: U.S. Army Medical Research and Materiel Command Fort Detrick, Maryland
 AD Award Number: W81XWH-09-1-0279 TITLE: Regulation of mtor by Nutrients PRINCIPAL INVESTIGATOR: Kun-Liang Guan CONTRACTING ORGANIZATION: University of San Diego La Jolla, CA 92093 REPORT DATE: July 2010
PREPARED FOR: U.S. Army Medical Research and Materiel Command Fort Detrick, Maryland
 AD Award Number: W81XWH-06-1-0524 TITLE: Elucidating and Modeling Irradiation Effects on Centrosomal and Chromosomal Stability within Breast Cancer PRINCIPAL INVESTIGATOR: Christopher A. Maxwell, Ph.D.
CONTRACTING ORGANIZATION: University of California Lawrence Berkeley National Laboratory Berkeley, CA 94720
 AD Award Number: W81XWH-05-1-0526 TITLE: Effects of Extracellular Matix on DNA Repair in Vivo PRINCIPAL INVESTIGATOR: Aylin Rizki, Ph.D. CONTRACTING ORGANIZATION: University of California Lawrence Berkeley
TITLE: Identification of New Serum Biomarkers for Early Breast Cancer Diagnosis and Prognosis Using Lipid Microarrays.
 AD Award Number: W81XWH-06-1-0690 TITLE: Identification of New Serum Biomarkers for Early Breast Cancer Diagnosis and Prognosis Using Lipid Microarrays. PRINCIPAL INVESTIGATOR: Guangwei Du, Ph.D. CONTRACTING
PREPARED FOR: U.S. Army Medical Research and Materiel Command Fort Detrick, Maryland
 AD Award Number: W81XWH-12-1-0225 TITLE: Epstein Barr virus and blood brain barrier in Multiple Sclerosis PRINCIPAL INVESTIGATOR: Luwen Zhang CONTRACTING ORGANIZATION: University of Nebraska Lincoln, NE
PREPARED FOR: U.S. Army Medical Research and Materiel Command Fort Detrick, Maryland
 AD Award Number: W81XWH-05-1-0045 TITLE: MT 2A Phosphorylation by PKC Mu/PKD Influences Chemosensitivity to Cisplatin in Prostate Cancer PRINCIPAL INVESTIGATOR: Kethandapatti Balaji, M.D. CONTRACTING ORGANIZATION:
TITLE: Neural Protein Synuclein (SNCG) in Breast Cancer Progression
 in Breast Cancer Progression") AD AWARD NUMBER: DAMD17-01-1-0352 TITLE: Neural Protein Synuclein (SNCG) in Breast Cancer Progression PRINCIPAL INVESTIGATOR: Yangfu Jiang, M.D., Ph.D. CONTRACTING ORGANIZATION: Long Island Jewish Medical
AD AWARD NUMBER: DAMD17-01-1-0352 TITLE: Neural Protein Synuclein (SNCG) in Breast Cancer Progression PRINCIPAL INVESTIGATOR: Yangfu Jiang, M.D., Ph.D. CONTRACTING ORGANIZATION: Long Island Jewish Medical
CONTRACTING ORGANIZATION: North Eastern Ohio Universities Rootstown OH 44202
 AD Award Number: DAMD17-03-1-0082 TITLE: Prevalence and Outcomes of Restless Legs Syndrome among Veterans PRINCIPAL INVESTIGATOR: Claire C. Bourguet, Ph.D. CONTRACTING ORGANIZATION: North Eastern Ohio
TITLE: Inhibitors of Histone Deacetylases for Radiosensitization of Prostate Cancer
 AD Award Number: W81XWH-04-1-0170 TITLE: Inhibitors of Histone Deacetylases for Radiosensitization of Prostate Cancer PRINCIPAL INVESTIGATOR: Mira O. Jung, Ph.D. CONTRACTING ORGANIZATION: Georgetown University
TITLE: Evaluation of DNA Methylation as a Target for Intraductal Therapy for Ductal Carcinoma in Situ of the Breast
 AD AWARD NUMBER: DAMD17-02-1-0569 TITLE: Evaluation of DNA Methylation as a Target for Intraductal Therapy for Ductal Carcinoma in Situ of the Breast PRINCIPAL INVESTIGATOR: Kristin A. Skinner, M.D. CONTRACTING
TITLE: The Role Of Alternative Splicing In Breast Cancer Progression
 AD Award Number: W81XWH-06-1-0598 TITLE: The Role Of Alternative Splicing In Breast Cancer Progression PRINCIPAL INVESTIGATOR: Klemens J. Hertel, Ph.D. CONTRACTING ORGANIZATION: University of California,
TITLE: New Advanced Technology to Improve Prediction and Prevention of Type 1 Diabetes
 AD Award Number: DAMD17-01-1-0009 TITLE: New Advanced Technology to Improve Prediction and Prevention of Type 1 Diabetes PRINCIPAL INVESTIGATOR: Robert A. Vigersky CONTRACTING ORGANIZATION: Children s
TITLE: Selective Oncolytic Therapy for Hypoxic Breast Cancer Cells. CONTRACTING ORGANIZATION: Ordway Research Institute Albany, New York 12208
 AD Award Number: W81XWH-06-1-0586 TITLE: Selective Oncolytic Therapy for Hypoxic Breast Cancer Cells PRINCIPAL INVESTIGATOR: Michael T. Fasullo, Ph.D. CONTRACTING ORGANIZATION: Ordway Research Institute
AD (Leave blank) Award Number: W81XWH TITLE: Targeting Autophagy for the Treatment of TSC and LAM. PRINCIPAL INVESTIGATOR: Elizabeth Henske
 Award Number: W81XWH TITLE: Targeting Autophagy for the Treatment of TSC and LAM. PRINCIPAL INVESTIGATOR: Elizabeth Henske") AD (Leave blank) Award Number: W81XWH-12-1-0578 TITLE: Targeting Autophagy for the Treatment of TSC and LAM PRINCIPAL INVESTIGATOR: Elizabeth Henske CONTRACTING ORGANIZATION: Brigham and Women s Hospital
AD (Leave blank) Award Number: W81XWH-12-1-0578 TITLE: Targeting Autophagy for the Treatment of TSC and LAM PRINCIPAL INVESTIGATOR: Elizabeth Henske CONTRACTING ORGANIZATION: Brigham and Women s Hospital
Differential localisation of hamartin and tuberin and increased S6 phosphorylation in a tuber
 Differential localisation of hamartin and tuberin in a tuber 10 Differential localisation of hamartin and tuberin and increased S6 phosphorylation in a tuber Floor Jansen*, Robbert Notenboom*, Mark Nellist*,
TITLE: Overcoming Resistance to Inhibitors of the Akt Protein Kinase by Modulation of the Pim Kinase Pathway
 AWARD NUMBER: W81XWH-12-1-0560 TITLE: Overcoming Resistance to Inhibitors of the Akt Protein Kinase by Modulation of the Pim Kinase Pathway PRINCIPAL INVESTIGATOR: Andrew S. Kraft, MD CONTRACTING ORGANIZATION:
Fort Detrick, Maryland
 Award Number: W81XWH-15-1-0636 TITLE: Effect of Diet on Gulf War Illness: A Pilot Study PRINCIPAL INVESTIGATOR: Ashok Tuteja, M.D. M.P.H CONTRACTING ORGANIZATION: Western Institute for Biomedical Research
Award Number: W81XWH TITLE: Dietary Fish Oil in Reducing Bone Metastasis of Breast Cancer
 AD Award Number: W81XWH-04-1-0693 TITLE: Dietary Fish Oil in Reducing Bone Metastasis of Breast Cancer PRINCIPAL INVESTIGATOR: Nandini Ghosh-Choudhury, Ph.D. CONTRACTING ORGANIZATION: University of Texas
TITLE: CYP1B1 Polymorphism as a Risk Factor for Race-Related Prostate Cancer
 AD Award Number: W81XWH-04-1-0579 TITLE: CYP1B1 Polymorphism as a Risk Factor for Race-Related Prostate Cancer PRINCIPAL INVESTIGATOR: Yuichiro Tanaka, Ph.D. CONTRACTING ORGANIZATION: Northern California
PREPARED FOR: U.S. Army Medical Research and Materiel Command Fort Detrick, Maryland
 AD Award Number: W81XWH-06-1-0093 TITLE: An Epigenetic Link to Prostate Cancer PRINCIPAL INVESTIGATOR: Raphael F Margueron, Ph.D. CONTRACTING ORGANIZATION: University of Medicine and Dentistry of New Jersey
AD (Leave blank) TITLE: Proteomic analyses of nipple fluid for early detection of breast cancer
 TITLE: Proteomic analyses of nipple fluid for early detection of breast cancer") AD (Leave blank) Award Number: DAMD17-03-1-0575 TITLE: Proteomic analyses of nipple fluid for early detection of breast cancer PRINCIPAL INVESTIGATOR: Judy Garber CONTRACTING ORGANIZATION: Dana-Farber
AD (Leave blank) Award Number: DAMD17-03-1-0575 TITLE: Proteomic analyses of nipple fluid for early detection of breast cancer PRINCIPAL INVESTIGATOR: Judy Garber CONTRACTING ORGANIZATION: Dana-Farber
TITLE: Role of ADAM15 in Tumor/Endothelial Interactions Prostate Cancer Regression
 AD Award Number: W81XWH-07-1-0030 TITLE: Role of ADAM15 in Tumor/Endothelial Interactions Prostate Cancer Regression PRINCIPAL INVESTIGATOR: Mark L. Day CONTRACTING ORGANIZATION: University of Michigan
CONTRACTING ORGANIZATION: University of Mississippi Medical Center Jackson, MS 39216
 AD Award Number: W81XWH-12-1-0201 TITLE: Role of long non-coding RNAs in prostate cancer PRINCIPAL INVESTIGATOR: Yin-Yuan Mo CONTRACTING ORGANIZATION: University of Mississippi Medical Center Jackson,
TITLE: Oxidative Stress, DNA Repair and Prostate Cancer Risk. PRINCIPAL INVESTIGATOR: Hua Zhao, Ph.D.
 AD Award Number: W81XWH-08-1-0416 TITLE: Oxidative Stress, DNA Repair and Prostate Cancer Risk PRINCIPAL INVESTIGATOR: Hua Zhao, Ph.D. CONTRACTING ORGANIZATION: Health Research Inc Buffalo, NY 14263 REPORT
PREPARED FOR: U.S. Army Medical Research and Materiel Command Fort Detrick, Maryland
 Award Number: W81XWH-10-1-0593 TITLE: Probiotic (VSL#3) for Gulf War Illness PRINCIPAL INVESTIGATOR: Ashok Tuteja, M.D. M.P.H. CONTRACTING ORGANIZATION: Western Institute for Biomedical Research Salt Lake
Award Number: W81XWH TITLE: Characterizing an EMT Signature in Breast Cancer. PRINCIPAL INVESTIGATOR: Melanie C.
 AD Award Number: W81XWH-08-1-0306 TITLE: Characterizing an EMT Signature in Breast Cancer PRINCIPAL INVESTIGATOR: Melanie C. Bocanegra CONTRACTING ORGANIZATION: Leland Stanford Junior University Stanford,
PREPARED FOR: U.S. Army Medical Research and Materiel Command Fort Detrick, Maryland
 AD Award Number: TITLE: Suppression of Breast Cancer Progression by Tissue Factor PRINCIPAL INVESTIGATOR: Wolfram Ruf, M.D. CONTRACTING ORGANIZATION: The Scripps Research Institute La Jolla, CA 92037 REPORT
TITLE: Dietary Genistein and Prostate Cancer Chemoprevention
 AD AWARD NUMBER: DAMD17-02-1-0662 TITLE: Dietary Genistein and Prostate Cancer Chemoprevention PRINCIPAL INVESTIGATOR: Coral A. Lamartiniere, Ph.D. CONTRACTING ORGANIZATION: The University of Alabama at
PREPARED FOR: U.S. Army Medical Research and Materiel Command Fort Detrick, Maryland
 AWARD NUMBER: W81XWH-11-1-0626 TITLE: Treatment of Fragile X Syndrome with a Neuroactive Steroid PRINCIPAL INVESTIGATOR: Randi Hagerman, M.D. CONTRACTING ORGANIZATION: University of California, Davis Sacramento,
CONTRACTING ORGANIZATION: University of Illinois Chicago, IL
 AD Award Number: W81XWH-05-1-0009 TITLE: Selenoproteins and Prostate Cancer PRINCIPAL INVESTIGATOR: Veda Navsariwala, Ph.D. CONTRACTING ORGANIZATION: University of Illinois Chicago, IL 60612-7205 REPORT
TITLE: Investigation of the Akt/PKB Kinase in the Development of Hormone-Independent Prostate Cancer
 AD Award Number: TITLE: Investigation of the Akt/PKB Kinase in the Development of Hormone-Independent Prostate Cancer PRINCIPAL INVESTIGATOR: Linda A. degraffenried, Ph.D. CONTRACTING ORGANIZATION: The
TITLE: Interchromosomal Associations that Alter NF1 Gene Expression Can Modify Clinical Manifestations of Neurofibromatosis 1. Palo Alto, CA 94304
 AD AWARD NUMBER: W81XWH-06-1-0695 TITLE: Interchromosomal Associations that Alter NF1 Gene Expression Can Modify Clinical Manifestations of Neurofibromatosis 1 PRINCIPAL INVESTIGATOR: Andrew R. Hoffman,
Award Number: W81XWH TITLE: Global Positioning Systems (GPS) Technology to Study Vector-Pathogen-Host Interactions
 Technology to Study Vector-Pathogen-Host Interactions") Award Number: W81XWH-11-2-0175 TITLE: Global Positioning Systems (GPS) Technology to Study Vector-Pathogen-Host Interactions PRINCIPAL INVESTIGATOR: Timothy P. Endy MD, MPH CONTRACTING ORGANIZATION: SUNY
Award Number: W81XWH-11-2-0175 TITLE: Global Positioning Systems (GPS) Technology to Study Vector-Pathogen-Host Interactions PRINCIPAL INVESTIGATOR: Timothy P. Endy MD, MPH CONTRACTING ORGANIZATION: SUNY
TITLE: Effect of COX-2 (PGE2) and IL-6 on Prostate Cancer Bone Mets
 and IL-6 on Prostate Cancer Bone Mets") AD Award Number: W81XWH-05-1-0166 TITLE: Effect of COX-2 (PGE2) and IL-6 on Prostate Cancer Bone Mets PRINCIPAL INVESTIGATOR: Alice C. Levine, M.D. CONTRACTING ORGANIZATION: Mount Sinai School of Medicine
AD Award Number: W81XWH-05-1-0166 TITLE: Effect of COX-2 (PGE2) and IL-6 on Prostate Cancer Bone Mets PRINCIPAL INVESTIGATOR: Alice C. Levine, M.D. CONTRACTING ORGANIZATION: Mount Sinai School of Medicine
CONTRACTING ORGANIZATION: Mount Sinai School of Medicine New York, New York
 AD AWARD NUMBER: W81XWH-05-1-0475 TITLE: Restoration of Epithelial Polarity in Metastatic Tumors PRINCIPAL INVESTIGATOR: Sergei Sokol, Ph.D. CONTRACTING ORGANIZATION: Mount Sinai School of Medicine New
PREPARED FOR: U.S. Army Medical Research and Materiel Command Fort Detrick, Maryland
 AWARD NUMBER: W81XWH-14-1-0546 TITLE: Assessing EphA2 and Ephrin-A as Novel Diagnostic and Prognostic Biomarkers of Prostate Cancer PRINCIPAL INVESTIGATOR: Carvell Tran Nguyen, MD PhD CONTRACTING ORGANIZATION:
PREPARED FOR: U.S. Army Medical Research and Materiel Command Fort Detrick, Maryland
 AD Award Number: DAMD17-01-1-0112 TITLE: Genetic Epidemiology of Prostate Cancer PRINCIPAL INVESTIGATOR: Susan L. Neuhausen, Ph.D. CONTRACTING ORGANIZATION: University of California, Irvine Irvine, California
CONTRACTING ORGANIZATION: Rutgers, the State University of New Jersey New Brunswick, NJ 08901
 AWARD NUMBER: W81XWH-16-1-0415 TITLE: Cell Type-Specific Contributions to the TSC Neuropathology PRINCIPAL INVESTIGATOR: Gabriella D Arcangelo CONTRACTING ORGANIZATION: Rutgers, the State University of
CONTRACTING ORGANIZATION: Oregon Health & Science University Portland OR 97239
 AWARD NUMBER: W81XWH-16-1-0300 TITLE: Metformin Therapy for Fanconis Anemia PRINCIPAL INVESTIGATOR: Markus Grompe CONTRACTING ORGANIZATION: Oregon Health & Science University Portland OR 97239 REPORT DATE:
CONTRACTING ORGANIZATION: Cold Spring Harbor Laboratory Cold Spring Harbor, NY 11724
 AD Award Number: W81XWH-10-1-0450 TITLE: The role of NF1 in memory retrieval PRINCIPAL INVESTIGATOR: Yi Zhong, Ph.D. CONTRACTING ORGANIZATION: Cold Spring Harbor Laboratory Cold Spring Harbor, NY 11724
CONTRACTING ORGANIZATION: Rush University Medical Center Chicago, IL 60612
 AD Award Number: W81XWH-11-1-0302 TITLE: Yin and Yang of Heparanase in breast Tumor Initiation PRINCIPAL INVESTIGATOR: Xiulong Xu, Ph.D. CONTRACTING ORGANIZATION: Rush University Medical Center Chicago,
Award Number: W81XWH TITLE: A Novel Membrane-Permeable, Breast-Targeting, Pro-Apoptotic Peptide for Treatment of Breast Cancer
 AD Award Number: W81XWH-04-1-0705 TITLE: A Novel Membrane-Permeable, Breast-Targeting, Pro-Apoptotic Peptide for Treatment of Breast Cancer PRINCIPAL INVESTIGATOR: Bin Guo, Ph.D. CONTRACTING ORGANIZATION:
AD (Leave blank) PREPARED FOR: U.S. Army Medical Research and Materiel Command Fort Detrick, Maryland
 PREPARED FOR: U.S. Army Medical Research and Materiel Command Fort Detrick, Maryland") AD (Leave blank) Award Number: W81XWH-06-2-0038 TITLE:T Cell Lipid rafts and complement Ligands for Diagnosis and Monitoring PRINCIPAL INVESTIGATOR: George C. Tsokos, MD CONTRACTING ORGANIZATION: Beth
AD (Leave blank) Award Number: W81XWH-06-2-0038 TITLE:T Cell Lipid rafts and complement Ligands for Diagnosis and Monitoring PRINCIPAL INVESTIGATOR: George C. Tsokos, MD CONTRACTING ORGANIZATION: Beth
TITLE: Proteomic Mapping of the Immune Response to Gluten in Children with Autism
 AWARD NUMBER: W81XWH-14-1-0293 TITLE: Proteomic Mapping of the Immune Response to Gluten in Children with Autism PRINCIPAL INVESTIGATOR: Armin Alaedini, PhD CONTRACTING ORGANIZATION: Trustees of Columbia
CONTRACTING ORGANIZATION: Western Institute For Biomedical Research Salt Lake City, UT
 AD Award Number: W81XWH-10-1-0593 TITLE: Probiotic (VSL#3) for Gulf War Illness PRINCIPAL INVESTIGATOR: Ashok Tuteja, M.D., M.P.H. CONTRACTING ORGANIZATION: Western Institute For Biomedical Research Salt
TITLE: Genes Associated with Food Allergy and Eosinophilic Esophagitis
 AD Award Number: W81XWH-1-1-75 TITLE: Genes Associated with Food Allergy and Eosinophilic Esophagitis PRINCIPAL INVESTIGATOR: Dr. David Broide CONTRACTING ORGANIZATION: University of California, San Diego
PREPARED FOR: U.S. Army Medical Research and Materiel Command Fort Detrick, Maryland
 AD Award Number: W81XWH- TITLE: PRINCIPAL INVESTIGATOR: CONTRACTING ORGANIZATION: REPORT DATE: TYPE OF REPORT: PREPARED FOR: U.S. Army Medical Research and Materiel Command Fort Detrick, Maryland 21702-5012
Award Number: W81XWH TITLE: CYP1B1 Polymorphism as a Risk Factor for Race-Related Prostate Cancer
 AD Award Number: W81XWH-04-1-0579 TITLE: CYP1B1 Polymorphism as a Risk Factor for Race-Related Prostate Cancer PRINCIPAL INVESTIGATOR: Yuichiro Tanaka, Ph.D. Rajvir Dahiya, Ph.D. CONTRACTING ORGANIZATION:
La Jolla, CA Approved for Public Release; Distribution Unlimited
 AD Award Number: TITLE: Suppression of Breast Cancer Progression by Tissue Factor PRINCIPAL INVESTIGATOR: Wolfram Ruf, M.D. CONTRACTING ORGANIZATION: The Scripps Research Institute La Jolla, CA 92037 REPORT
Award Number: W81XWH
 Award Number: W81XWH-14-2-0193 TITLE: Prevention of Bone Loss after Acute SCI by Zoledronic Acid: Durability, Effect on Bone Strength, and Use of Biomarkers to Guide Therapy PRINCIPAL INVESTIGATOR: Thomas
CONTRACTING ORGANIZATION: Regents of the University of Michigan Ann Arbor, MI 48109
 AWARD NUMBER: W81XWH-13-1-0463 TITLE: The Ketogenic Diet and Potassium Channel Function PRINCIPAL INVESTIGATOR: Dr. Geoffrey Murphy CONTRACTING ORGANIZATION: Regents of the University of Michigan Ann Arbor,
PREPARED FOR: U.S. Army Medical Research and Materiel Command Fort Detrick, Maryland
 AD Award Number: DAMD17-03-1-0392 TITLE: The Role of Notch Signaling Pathway in Breast Cancer Pathogenesis PRINCIPAL INVESTIGATOR: Annapoorni Rangarajan, Ph.D. CONTRACTING ORGANIZATION: Indian Institute
U.S. Army Medical Research and Materiel Command Fort Detrick, Maryland
 AWARD NUMBER: W81XWH-14-1-0503 TITLE: Effect of Diabetes and Obesity on Disparities in Prostate Cancer Outcomes PRINCIPAL INVESTIGATOR: Bettina F. Drake, MPH, PhD CONTRACTING ORGANIZATION: Washington University
PREPARED FOR: U.S. Army Medical Research and Materiel Command Fort Detrick, Maryland
 AWARD NUMBER: W81XWH-15-1-0112 TITLE: Molecular Mechanisms Underlying the Epileptogenesis and Seizure Progression in Tuberous Sclerosis Complex 1 Deficient Mouse Models PRINCIPAL INVESTIGATOR: James E.
Award Number: W81XWH
 AD Award Number: W81XWH-08-2-0050 TITLE: PT073853: Mild TBI Following Exposure to Explosive Devices: Device Characteristics, Neuropsychological Functioning, and Symptoms of Post-Traumatic Stress Disorder
PREPARED FOR: U.S. Army Medical Research and Materiel Command Fort Detrick, Maryland
 AD Award Number: W81XWH-12-1-0248 TITLE: Targeted Inhibition of Tyrosine Kinase-Mediated Epigenetic Alterations to Prevent Resurgence of Castration-Resistant Prostate Cancer PRINCIPAL INVESTIGATOR: Dr.
PREPARED FOR: U.S. Army Medical Research and Materiel Command Fort Detrick, Maryland
 AD Award Number: W81XWH- TITLE: PRINCIPAL INVESTIGATOR: CONTRACTING ORGANIZATION: REPORT DATE: TYPE OF REPORT: Annual PREPARED FOR: U.S. Army Medical Research and Materiel Command Fort Detrick, Maryland
TITLE: Properties of Leukemia Stem Cells in a Novel Model of CML Progression to Lymphoid Blast Crisis
 AD Award Number: W81XWH-05-1-0608 TITLE: Properties of Leukemia Stem Cells in a Novel Model of CML Progression to Lymphoid Blast Crisis PRINCIPAL INVESTIGATOR: Craig T. Jordan, Ph.D. CONTRACTING ORGANIZATION:
CONTRACTING ORGANIZATION: University of Texas M.D. Anderson Cancer Center Houston, TX 77030
 AD Award Number: W81XWH-7-1-345 TITLE: Second-Generation Therapeutic DNA Lymphoma Vaccines PRINCIPAL INVESTIGATOR: Larry W. Kwak, M.D., Ph.D. CONTRACTING ORGANIZATION: University of Texas M.D. Anderson
TITLE: The Role of Constitutively Active Prolactin Receptors in the Natural History of Breast Cancer
 AD Award Number: W81XWH-06-1-0448 TITLE: The Role of Constitutively Active Prolactin Receptors in the Natural History of Breast Cancer PRINCIPAL INVESTIGATOR: Kuang-tzu Huang CONTRACTING ORGANIZATION:
TITLE: MiR-146-SIAH2-AR Signaling in Castration-Resistant Prostate Cancer
 AWARD NUMBER: W81XWH-14-1-0387 TITLE: MiR-146-SIAH2-AR Signaling in Castration-Resistant Prostate Cancer PRINCIPAL INVESTIGATOR: Dr. Goberdhan Dimri, PhD CONTRACTING ORGANIZATION: George Washington University,
CONTRACTING ORGANIZATION: Vanderbilt University Medical Center Nashville, TN
 AD Award Number: W81XWH-04-1-0867 TITLE: A Myc-Driven in Vivo Model of Human Prostate Cancer PRINCIPAL INVESTIGATOR: Simon W. Hayward, Ph.D. CONTRACTING ORGANIZATION: Vanderbilt University Medical Center
TITLE: Induction of Ephs/Ephrins-Mediated Tumor Cells-Endothelial Cells Repulsion as an Anti-Cancer Therapeutic Approach
 AD Award Number: W81XWH-04-1-0661 TITLE: Induction of Ephs/Ephrins-Mediated Tumor Cells-Endothelial Cells Repulsion as an Anti-Cancer Therapeutic Approach PRINCIPAL INVESTIGATOR: Gerald Batist, M.D. CONTRACTING
TITLE: A Role of Plasminogen in Promoting the Immune Escape in Small Cell Lung Cancer. PRINCIPAL INVESTIGATOR: Vera Levina, PhD. Pittsburgh, PA 15213
 AWARD NUMBER: W81XWH-15-1-0295 TITLE: A Role of Plasminogen in Promoting the Immune Escape in Small Cell Lung Cancer PRINCIPAL INVESTIGATOR: Vera Levina, PhD CONTRACTING ORGANIZATION: University of Pittsburgh
CONTRACTING ORGANIZATION: Johns Hopkins Bloomberg School of Public Health
 AD Award Number: W81XWH-12-1-0170 TITLE: Prospective Evaluation of Intraprostatic Inflammation and Focal Atrophy as a Predictor of Risk of High-Grade Prostate Cancer and Recurrence after Prostatectomy
Roles of microrna-mediated Drug Resistance in Tumor Stem Cells of Small Cell Lung Carcinoma
 AD Award Number: W81XWH-12-1-0479 TITLE: Roles of microrna-mediated Drug Resistance in Tumor Stem Cells of Small Cell Lung Carcinoma PRINCIPAL INVESTIGATOR: Kounosuke Watabe, Ph.D. CONTRACTING ORGANIZATION:
CONTRACTING ORGANIZATION: Fred Hutchinson Cancer Research Center Seattle, WA 98109
 AWARD NUMBER: W81XWH-10-1-0711 TITLE: Transgenerational Radiation Epigenetics PRINCIPAL INVESTIGATOR: Christopher J. Kemp, Ph.D. CONTRACTING ORGANIZATION: Fred Hutchinson Cancer Research Center Seattle,
TITLE: Investigating the Role of TBX2 in the Inhibition of Senescence in Prostate Cancer
 AD Award Number: W81XWH-07-1-0155 TITLE: Investigating the Role of TBX2 in the Inhibition of Senescence in Prostate Cancer PRINCIPAL INVESTIGATOR: Srinivas Nandana CONTRACTING ORGANIZATION: Vanderbilt
PREPARED FOR: U.S. Army Medical Research and Materiel Command Fort Detrick, Maryland
 AWARD NUMBER: W81XWH-13-1-0421 TITLE: The Fanconi Anemia BRCA Pathway as a Predictor of Benefit from Bevacizumab in a Large Phase III Clinical Trial in Ovarian Cancer PRINCIPAL INVESTIGATOR: Elizabeth
TITLE: 64Cu-DOTA-trastuzumab PET imaging in women with HER2 overexpressing breast cancer
 AD Award Number: W81XWH-10-1-0824 TITLE: 64Cu-DOTA-trastuzumab PET imaging in women with HER2 overexpressing breast cancer PRINCIPAL INVESTIGATOR: Joanne Mortimer, M.D. CONTRACTING ORGANIZATION: City of
TITLE: Development of Antigen Presenting Cells for adoptive immunotherapy in prostate cancer
 AD Award Number: W8XWH-5-- TITLE: Development of Antigen Presenting Cells for adoptive immunotherapy in prostate cancer PRINCIPAL INVESTIGATOR: Mathias Oelke Ph.D. CONTRACTING ORGANIZATION: Johns Hopkins
TITLE: Estrogen-DNA Adducts as Novel Biomarkers for Ovarian Cancer Risk and for Use in Prevention
 AD (Leave blank) Award Number: W81XWH-10-1-0175 TITLE: Estrogen-DNA Adducts as Novel Biomarkers for Ovarian Cancer Risk and for Use in Prevention PRINCIPAL INVESTIGATOR: Eleanor G. Rogan, Ph.D. CONTRACTING
ARTICLE. Keywords: TSC1 and TSC2; tuberous sclerosis complex; genotype phenotype correlation
 (2005) 13, 731 741 & 2005 Nature Publishing Group All rights reserved 1018-4813/05 $30.00 www.nature.com/ejhg ARTICLE Mutational analysis of the TSC1 and TSC2 genes in a diagnostic setting: genotype phenotype
U.S. Army Medical Research and Materiel Command Fort Detrick, Maryland
 AWARD NUMBER: W81XWH-14-1-0503 TITLE: Effect of Diabetes and Obesity on Disparities in Prostate Cancer Outcomes PRINCIPAL INVESTIGATOR: Bettina F. Drake, MPH, PhD CONTRACTING ORGANIZATION: Washington University
PREPARED FOR: U.S. Army Medical Research and Materiel Command Fort Detrick, MD
 AD Award Number: W81XWH-11-1-0126 TITLE: Chemical strategy to translate genetic/epigenetic mechanisms to breast cancer therapeutics PRINCIPAL INVESTIGATOR: Xiang-Dong Fu, PhD CONTRACTING ORGANIZATION:
AWARD NUMBER: W81XWH TITLE: Gulf War Illness as a Brain Autoimmune Disorder. PRINCIPAL INVESTIGATOR: Apostolos Georgopoulos, MD, PhD
 AWARD NUMBER: W81XWH-15-1-0520 TITLE: Gulf War Illness as a Brain Autoimmune Disorder PRINCIPAL INVESTIGATOR: Apostolos Georgopoulos, MD, PhD CONTRACTING ORGANIZATION: Regents University of Minnesota Minneapolis,
TITLE: Effect of Reminder Telephone Calls on Mammography Compliance in High Risk
 AD Award Number: W81XWH-04-1-0465 TITLE: Effect of Reminder Telephone Calls on Mammography Compliance in High Risk PRINCIPAL INVESTIGATOR: Carrie Snyder CONTRACTING ORGANIZATION: Creighton University Omaha,
TITLE: Adipose Estrogen and Increased Breast Cancer Risk in Obesity: Regulation by Leptin and Insulin
 AD Award Number: W81XWH-05-1-0497 TITLE: Adipose Estrogen and Increased Breast Cancer Risk in Obesity: Regulation by Leptin and Insulin PRINCIPAL INVESTIGATOR: Fahumiya Samad CONTRACTING ORGANIZATION:
PREPARED FOR: U.S. Army Medical Research and Materiel Command Fort Detrick, Maryland
 AWARD NUMBER: W81XWH-13-1-0479 TITLE: Sleep-Disordered Breathing in Chronic SCI: A Randomized Controlled Trial of Treatment Impact on Cognition, Quality of Life, and Cardiovascular Disease PRINCIPAL INVESTIGATOR:
AD (Leave blank) TITLE: Trial of Naltrexone and Dextromethorphan for Gulf War Veterans Illnesses
 TITLE: Trial of Naltrexone and Dextromethorphan for Gulf War Veterans Illnesses") AD (Leave blank) Award Number: W81XWH-09-2-0065 TITLE: Trial of Naltrexone and Dextromethorphan for Gulf War Veterans Illnesses PRINCIPAL INVESTIGATOR: William J. Meggs, MD, PhD CONTRACTING ORGANIZATION:
AD (Leave blank) Award Number: W81XWH-09-2-0065 TITLE: Trial of Naltrexone and Dextromethorphan for Gulf War Veterans Illnesses PRINCIPAL INVESTIGATOR: William J. Meggs, MD, PhD CONTRACTING ORGANIZATION:
TITLE: Gulf War Illness Evaluation of an innovative detoxification program
 Award Number: W81XWH-10-1-1004 TITLE: Gulf War Illness Evaluation of an innovative detoxification program PRINCIPAL INVESTIGATOR: David O. Carpenter, MD CONTRACTING ORGANIZATION: State University of New
CONTRACTING ORGANIZATION: Sloan-Kettering Institute for Cancer Research New York, NY 10021
 AD Award Number: DAMD17-94-J-4376 TITLE: Position Emitter I124 Iododeoxyuridine as a Tracer to Follow DNA Metabolism on Scans and in Tumor Samples in Advanced Breast Cancer: Comparison of 18F 2-Fluror-2-Deoxy-(D)-Glucose,
STUDIES ON MUSTARD-STIMULATED PROTEASES AND INHIBITORS IN HUMAN EPIDERMAL KERATINOCYTES (HEK): DEVELOPMENT OF ANTIVESICANT DRUGS
: DEVELOPMENT OF ANTIVESICANT DRUGS") STUDIES ON MUSTARD-STIMULATED PROTEASES AND INHIBITORS IN HUMAN EPIDERMAL KERATINOCYTES (HEK): DEVELOPMENT OF ANTIVESICANT DRUGS Xiannu Jin 1, Radharaman Ray 2, Guang Xu 1 and Prabhati Ray 1 1 Department
STUDIES ON MUSTARD-STIMULATED PROTEASES AND INHIBITORS IN HUMAN EPIDERMAL KERATINOCYTES (HEK): DEVELOPMENT OF ANTIVESICANT DRUGS Xiannu Jin 1, Radharaman Ray 2, Guang Xu 1 and Prabhati Ray 1 1 Department
CONTRACTING ORGANIZATION: The Chancellor, Masters and Scholars of the University of Cambridge, Clara East, The Old Schools, Cambridge CB2 1TN
 AWARD NUMBER: W81XWH-14-1-0110 TITLE: A Molecular Framework for Understanding DCIS PRINCIPAL INVESTIGATOR: Gregory Hannon CONTRACTING ORGANIZATION: The Chancellor, Masters and Scholars of the University
TITLE: Effect of MUC1 Expression on EGFR Endocytosis and Degradation in Human Breast Cancer Cell Lines
 AD AWARD NUMBER: W81XWH-06-1-0464 TITLE: Effect of MUC1 Expression on EGFR Endocytosis and Degradation in Human Breast Cancer Cell Lines PRINCIPAL INVESTIGATOR: Rachid M El Bejjani CONTRACTING ORGANIZATION:
TITLE: Unique Genomic Alterations in Prostate Cancers in African American Men
 AD Award Number: W81XWH-12-1-0046 TITLE: Unique Genomic Alterations in Prostate Cancers in African American Men PRINCIPAL INVESTIGATOR: Michael Ittmann, M.D., Ph.D. CONTRACTING ORGANIZATION: Baylor College
Detection of Prostate Cancer Progression by Serum DNA Integrity
 AD Award Number: TITLE: Detection of Prostate Cancer Progression by Serum DNA Integrity PRINCIPAL INVESTIGATOR: Dave S.B. Hoon, Ph.D. CONTRACTING ORGANIZATION: John Wayne Cancer Institute Santa Monica,
TITLE: Functional Genetics for Predisposition to Development of Type 2 Diabetes in Obese Individuals. PRINCIPAL INVESTIGATOR: Assia Shisheva
 AWARD NUMBER: W81XWH-17-1-0060 TITLE: Functional Genetics for Predisposition to Development of Type 2 Diabetes in Obese Individuals PRINCIPAL INVESTIGATOR: Assia Shisheva CONTRACTING ORGANIZATION: Wayne
TITLE: The Role of HOX Proteins in Androgen-Independent Prostate Cancer
 AD Award Number: W81XWH-6-1-64 TITLE: The Role of HOX Proteins in Androgen-Independent Prostate Cancer PRINCIPAL INVESTIGATOR: Sunshine Daddario, B.A. CONTRACTING ORGANIZATION: University of Colorado Health
PREPARED FOR: U.S. Army Medical Research and Materiel Command Fort Detrick, Maryland
 AWARD NUMBER: W81XWH-15-1-0154 TITLE: Efficacy of the Direct Instruction Language for Learning (DI-LL) Program to Promote Expressive and Receptive Language in Children with Autism Spectrum Disorder PRINCIPAL
CONTRACTING ORGANIZATION: University of Southern California Los Angeles, CA 90033
 AD Award Number: W81XWH-07-01-0264 TITLE: Function of Klotho and is MicroRNA in Prostate Cancer and Aging PRINCIPAL INVESTIGATOR: Shao-Yao Ying, Ph.D. CONTRACTING ORGANIZATION: University of Southern California
AD (Leave blank) TITLE: Genomic Characterization of Brain Metastasis in Non-Small Cell Lung Cancer Patients
 TITLE: Genomic Characterization of Brain Metastasis in Non-Small Cell Lung Cancer Patients") AD (Leave blank) Award Number: W81XWH-12-1-0444 TITLE: Genomic Characterization of Brain Metastasis in Non-Small Cell Lung Cancer Patients PRINCIPAL INVESTIGATOR: Mark A. Watson, MD PhD CONTRACTING ORGANIZATION:
AD (Leave blank) Award Number: W81XWH-12-1-0444 TITLE: Genomic Characterization of Brain Metastasis in Non-Small Cell Lung Cancer Patients PRINCIPAL INVESTIGATOR: Mark A. Watson, MD PhD CONTRACTING ORGANIZATION:
PREPARED FOR: U.S. Army Medical Research and Materiel Command Fort Detrick, Maryland
 AD Award Number: W81XWH-13-2-0032 TITLE: Increasing Treatment Seeking Among At-Risk Service Members Returning from Warzones PRINCIPAL INVESTIGATOR: Tracy Stecker, PhD CONTRACTING ORGANIZATION: Dartmouth
PREPARED FOR: U.S. Army Medical Research and Materiel Command Fort Detrick, Maryland
 AD Award Number: TITLE: PRINCIPAL INVESTIGATOR: Jeremy Chien, PhD CONTRACTING ORGANIZATION: Mayo Clinic, REPORT DATE: September 2012 TYPE OF REPORT: Annual PREPARED FOR: U.S. Army Medical Research and
The Chancellor, Masters and Scholars of the University of Cambridge, Clara East, The Old Schools, Cambridge CB2 1TN
 AWARD NUMBER: W81XWH-14-1-0110 TITLE: A Molecular Framework for Understanding DCIS PRINCIPAL INVESTIGATOR: Gregory Hannon CONTRACTING ORGANIZATION: The Chancellor, Masters and Scholars of the University
AWARD NUMBER: W81XWH TITLE: Androgen Deprivation Therapy and Cognitive Impairment. PRINCIPAL INVESTIGATOR: Robert N. Pechnick, Ph.D.
 AWARD NUMBER: W81XWH-16-1-0429 TITLE: Androgen Deprivation Therapy and Cognitive Impairment PRINCIPAL INVESTIGATOR: Robert N. Pechnick, Ph.D. CONTRACTING ORGANIZATION: Western University of Health Sciences
TITLE: MicroRNA in Prostate Cancer Racial Disparities and Aggressiveness
 AWARD NUMBER: W81XWH-13-1-0477 TITLE: MicroRNA in Prostate Cancer Racial Disparities and Aggressiveness PRINCIPAL INVESTIGATOR: Cathryn Bock CONTRACTING ORGANIZATION: Wayne State University REPORT DATE:
TITLE: Mission Connect Mild TBI Translational Research Consortium. U.S. Army Medical Research and Materiel Command Fort Detrick, Maryland
 Award Number: W81XWH-08-2-0138 TITLE: Mission Connect Mild TBI Translational Research Consortium PRINCIPAL INVESTIGATOR: Brent Masel. M.D. CONTRACTING ORGANIZATION: Transitional Learning Center at Galveston
TITLE: A Tissue Engineering Approach to Study the Progression of Breast Tumor Metastasis in Bone
 AD AWARD NUMBER: W81XWH-04-1-0749 TITLE: A Tissue Engineering Approach to Study the Progression of Breast Tumor Metastasis in Bone PRINCIPAL INVESTIGATOR: Mingxin Che, M.D., Ph.D. Daotai Nie, Ph.D. CONTRACTING