2002 Annual Report on Blood Lead Levels in Michigan
|
|
|
- Bryce Bell
- 6 years ago
- Views:
Transcription
1 2002 Annual Report on Blood Lead Levels in Michigan
2 2002 Annual Report on Blood Lead Levels in Michigan A Joint Report of Michigan State University Department of Medicine 117 West Fee Hall East Lansing, Michigan (517) Kenneth D. Rosenman, M.D., Professor of Medicine Amy S. Sims, B.S., ABLES Program Coordinator and the Michigan Department of Consumer and Industry Services Occupational Health Division P.O. Box Lansing, Michigan (517) Douglas J. Kalinowski, M.S., C.I.H., Director Bureau of Safety and Regulation and Michigan Department of Community Health Division of Family and Community Health Childhood Lead Poisoning Prevention Project 3423 North M.L.King, Jr. Blvd. P.O. Box Lansing, Michigan (517) Douglas M. Paterson, Project Director Mary A. Scoblic, R.N., M.N., Project Unit Director Sharon Hudson, R.N., M.S.N., C.N.M., Project Coordinator May 8, 2003
3 Part I Blood Lead Levels Among Adults in Michigan
4 Summary: This is the fifth annual report on surveillance of blood lead levels in Michigan citizens. It is based on regulations that went into effect on October 11, 1997 that require laboratories to report all blood lead levels analyzed. The 2001 report included an expanded section on elevated blood lead levels in children. We continue that inclusion for the 2002 report. See Part II about the results of blood lead tests in children under the age of six. In 2002, 11,994 reports were received for 10,860 individuals >16 years of age. Nine hundred eighty-two (9.0%) individuals had blood lead levels greater than or equal to 10 µg/dl; 197 of those 982 had lead levels greater than or equal to 25 µg/dl and 7 of the 197 had blood lead levels greater than or equal to 50 µg/dl. There were 767 more reports (on 532 individuals) received in 2002 compared to Both the total number and percent of individuals with blood lead levels greater than or equal to 10 µg/dl increased from 837 (8.1%) in 2001 to 982 (9.0%) in The number and percent of individuals with blood lead levels greater than or equal to 25 µg/dl decreased, from 208 (2.0%) in 2001 to 197 (1.8%) in The number of individuals with blood lead levels greater than or equal to 50 µg/dl decreased while the percent was unchanged, 10 (0.1%) in 2001 and 7 (0.1%) in This is the fourth year in a row that blood lead levels greater than or equal to 25 µg/dl decreased from the previous year. Individuals with blood lead levels greater than or equal to 10 µg/dl were likely to be men (96.1%) and white (88.6%). Their mean age was 42. They were most likely to live in Wayne (21.8%), St. Clair (9.8%) and Clinton (7.2%) counties. This past year there were two articles in the medical literature highlighting the hazard of lead at levels below the allowable workplace standard of 50 µg/dl. One study reported increased mortality among individuals with blood leads levels µg/dl (1) and a second reported improvement in kidney function in patients with chronic renal disease treated for low level lead accumulation (2). In addition analysis of symptom data from individuals in Michigan with elevated blood lead levels showed nervous system related symptoms beginning at µg/dl, gastrointestinal symptoms at µg/dl and musculoskeletal symptoms at µg/dl (3). Occupational exposure remains the predominant source of lead exposure in Michigan adults (91% of all cases). These exposures typically occurred where individuals were casting brass or bronze fixtures, performing abrasive blasting on outdoor metal structures such as bridges, overpasses or water towers or exposed to lead fumes from guns at shooting ranges. Individuals with elevated blood lead from exposure at shooting ranges were exposed not only as part of work, but also from their involvement in the activity as recreation. This included individuals using commercial ranges and members of private clubs. This is the most common cause of non-occupational exposure (5.4% of all cases). In 2002, inspection reports were finalized on seven companies where employees had blood lead levels greater than or equal to 25 µg/dl. These reports showed that 5 of 7 (71%) were in violation of the lead standard. Evaluation of these inspections has shown them to be effective relative to other types of workplace enforcement inspections and suggests that they play a role in helping to reduce blood lead levels(4). We will continue to evaluate and follow this trend to determine if the initial findings remain over a more prolonged period of time after a greater number of inspections have been completed. 1
5 The fifth year of operation of an adult blood lead surveillance system in Michigan proved successful in continuing to identify a large number of individuals with elevated blood lead levels and sources of workplace exposures that could be remediated to reduce lead exposure. Outreach activities were expanded this past year. The radiator repair facilities thought to be using lead, but who were not conducting blood lead testing were contacted. Also health care providers with patients with elevated blood lead levels were provided resources to better care for these patients. Ongoing surveillance in future years will determine if the favorable trend in lower blood lead levels found from will continue. Background: This is the fifth annual report on surveillance of blood lead levels in Michigan citizens. Blood lead levels of Michigan residents, including children, have been monitored by the state since From 1992 to 1995, laboratories performing analyses of blood lead levels, primarily of children, had been voluntarily submitting reports to the Michigan Department of Public Health and then beginning in 1996 to the Michigan Department of Community Health (MDCH). The Michigan Department of Community Health promulgated regulations effective October 11, 1997 that require laboratories to submit reports of both children and adults to the MDCH for any blood testing for lead. Coincident with this, the Occupational Health Division within the Michigan Department of Consumer and Industry Services (MDCIS; which formerly had been part of the Michigan Department of Public Health) received federal funding in 1997 from the Centers for Disease Control and Prevention (CDC) to monitor adult blood lead levels, as part of the Adult Blood Lead Epidemiology and Surveillance (ABLES) Program. Currently 35 states have established lead registries through the ABLES Program for surveillance of adult lead absorption, primarily based on reports of elevated blood lead levels (BLL) from clinical laboratories. Eight of the 35 states began reporting for the first time starting January The Michigan Adult Blood Lead Registry: Reporting Regulations and Mechanism Since 1978, Michigan has required clinics, labs, hospitals and employers to report any patient with a known or suspected work-related disease including lead poisoning to the MDCIS, under Part 56 of Public Act 368 of Since October 11, 1997, laboratories performing blood lead analyses of Michigan residents are required to report the results of all blood lead level tests (BLLs) to the Michigan Department of Community Health (R ). Prior to these new regulations, few reports of elevated lead levels among adults were received. The laboratories are required to report blood sample analysis results, patient demographics, and employer information on a standard Michigan Department of Community Health Lead Reporting Form (Appendix I). The physician or health provider ordering the blood lead analysis is responsible for completing the patient information (section I), the physician/provider information (section II) and the specimen collection information (section IIa). Upon receipt of the blood sample for lead analysis, the clinical laboratory is responsible for completion of the laboratory information (section III). All clinical laboratories conducting business in Michigan that analyze blood samples for lead must report all adult and child blood lead results to the Michigan Department of Community Health, Childhood Lead Poisoning Prevention Program (MDCH/CLPPP) within five working days. 2
6 All blood lead results on individuals 16 years or older are forwarded to the Michigan Department of Consumer and Industry Services for potential follow-up. A summary of blood lead results from 2002 on children less than six years old is in Part II of this report. Laboratories Employers providing blood lead analysis on their employees as required by the Michigan Occupational Safety and Health Act (MIOSHA) are required to use a laboratory approved by OSHA to be in compliance with the lead standard. Appendix II lists the approved laboratories in Michigan. Data Management When BLL reports are received at the MDCH they are reviewed for completeness. For those reports where information is missing, copies are returned to the physician/provider to complete. Lead Registry staff code the information on the lead reporting form using a standard coding scheme and enter this information into a computerized database. Each record entered into the database is visually checked for any data entry errors, duplicate entries, missing data, and illogical data. These quality control checks are performed monthly. Case Follow Up Adults whose BLL is 25 µg/dl or higher are routinely contacted for an interview. We continued interviewing approximately 5% of individuals with blood lead levels ranging from 10 to 24 µg/dl. A letter is sent to the individual explaining Michigan s lead surveillance program and inviting them to answer a minute telephone questionnaire about their exposures to lead and any symptoms they may be experiencing. The questionnaire collects patient demographic data, work exposure and history information, symptoms related to lead exposure, information on potential lead-using hobbies and non-work related activities, and the presence of young children in the household to assess possible take-home lead exposures among these children. Trained medical interviewers administer the questionnaire. Michigan OSHA (MIOSHA) Requirements for Medical Monitoring and Medical Removal MIOSHA requirements for medical surveillance (i.e. biological monitoring) and medical removal are identical to Federal OSHA s. The requirements for medical removal differ for general industry and construction. For general industry, an individual must have two consecutive blood lead levels above 60 µg/dl or an average of three blood lead levels greater than 50 µg/dl before being removed (i.e. taken pursuant to the standard or the average of all blood tests conducted over the previous six months, which ever is longer). For construction, an individual needs to have only two consecutive blood lead level measurements taken pursuant to the standard above 50 µg/dl. However, an employee shall not be required to be removed if the last blood-sampling test indicates a blood lead level at or below 40 µg/dl. See Appendix III for a more detailed description of the requirements. In the absence of a specific exposure to lead, blood lead levels in the general population are typically below 10 µg/dl (5). Dissemination of Surveillance Data Quarterly data summaries, without personal identifiers, are forwarded to the Program s funding agency, the National Institute for Occupational Safety and Health (NIOSH). NIOSH compiles quarterly reports from all states that require reporting of BLLs and publishes them in the Morbidity and Mortality Weekly Report (MMWR). See Appendix IV for most recent publication. 3
7 Results: 2002 is the fifth year with complete laboratory reporting in Michigan since the lead regulations became effective on October 11, Accordingly, this report provides a summary of all the reports of adult blood lead levels received in 2002 as well as more detailed information from interviews of those adults with BLLs 25 µg/dl and greater and the sample of individuals interviewed who had blood lead levels ranging µg/dl. It also describes the Michigan Occupational Safety and Health Act (MIOSHA) inspections at the work sites where these individuals were exposed to lead. Blood Lead Levels Reported in 2002 Number of Reports and Individuals Between January 1 and December 31, 2002, the State of Michigan received 11,994 blood lead level reports for individuals 16 years of age or older. Because an individual may be tested more than once each year, the 11,994 reports received were for 10,860 individuals (Table 1). The following descriptive statistics are based on the 10,860 individuals reported in 2002, and are based on the highest BLL reported for each of these adults. Distribution of Blood Lead Levels In 2002, 982 (9.0%) of the 10,860 adults reported had blood lead levels greater than or equal to 10 µg/dl; 197 of those 982 had blood lead levels greater than or equal to 25 µg/dl and 7 of those 197 had blood lead levels greater than or equal to 50 µg/dl (Table 1). A total of 9,878 (91.0%) of the adults reported in 2002 had BLLs less than 10 µg/dl. Gender and Age Distribution All Blood Lead Levels Sixty seven percent of the adults reported to the Registry were male, with females representing thirty-three percent of the reports. Gender was unknown for two adults reported (Table 2). The age distribution is shown in Table 3. The mean age was 43. Blood Lead Levels 10 µg/dl For the 982 adults reported to the Registry with blood lead levels greater than or equal to 10 µg/dl, 944 (96.1%) were men and 38 (3.9%) were women (Table 2). The age distribution for these adults was similar to the reports of all BLLs (Table 3). The mean age was 42. 4
8 Race Distribution All Blood Lead Levels Although laboratories are required to report the patients race, this information is frequently not completed. Race was missing for 6,146 (56.6%) of the 10,860 adults reported. Where race was known, 3,895 (82.6%) were reported as white, 686 (14.6%) were reported as African American, 81 (1.7%) were reported as Native American, 28 (0.6%) were reported as Asian/Pacific Islander, and 24 (0.5%) were reported as multiracial/other (Table 4). Blood Lead Levels 10 µg/dl For adults with blood lead levels greater than or equal to 10 µg/dl where race was indicated, 558 (88.6%) were reported as white, 48 (7.6%) were reported as African American, 11 (1.7%) were reported as Native American, 2 (0.3%) were reported as Asian/Pacific Islander, and 11 (1.7%) were reported as multiracial/other (Table 4). Although the percentage of African-Americans with blood leads levels > 10µg/dL decreased as compared to all blood lead levels, African Americans had a greater percentage of the extremely high blood leads > 60µg/dL (Table 14). Geographic Distribution County of residence was determined for 9,190 of the 10,860 adults reported to the Registry. They lived in all of Michigan s 83 counties. The largest number of adults reported in 2002 lived in Wayne County (2,025, 22.0%), followed by Oakland (686, 7.5%) and Macomb (533, 5.8%). County was unknown for 1,670 adults (Figure 1 and Table 5). Figure 2 and Table 5 show the county of residence of the 911 adults with blood lead levels greater than or equal to 10 µg/dl where county of residence could be determined. The largest number of adults reported with a BLL of 10 µg/dl and greater were from Wayne County (199, 21.8%), followed by St. Clair (89, 9.8%) and Clinton (66, 7.2%). County was unknown for 71 adults. Figure 3 and Table 5 show the county of residence for the 181 adults with blood lead levels greater than or equal to 25 µg/dl where county of residence could be determined. The largest number of adults reported with a BLL of 25 µg/dl and above were from Wayne County (34, 18.8%), followed by St. Clair (17, 9.4%) and Muskegon (15, 8.3%). County was unknown for 16 adults. Figure 4 and Table 6 show the percentage of adults tested for blood lead within each county with BLLs of 10 µg/dl or greater. Montcalm (63, 48.8%), Ionia (33, 44.0%) and Clinton (66, 43.7%) counties had the highest percentages of adults with BLLs of 10 µg/dl or greater. Figure 5 and Table 6 show the percentage of adults tested for blood lead within each county with BLLs of 25 µg/dl or greater. Lake (1, 16.7%), Cass (1, 10.0%) and Leelanau (1, 10.0%) counties had the highest percentage of adults with BLLs of 25 µg/dl or greater. Figure 6 and Table 7 show the incidence rates of BLLs of 10 µg/dl and above, by county, for women. There were 38 women reported in 2002 with a BLL of 10 µg/dl or greater. Arenac (15/100,000), Clinton (12/100,000), and Mason (9/100,000) had the three highest incidence rates. Women with elevated blood lead 5
9 had their exposure from work mostly in manufacturing radiators (13.2%), fabricated metal products (7.9%), special trade construction (5.3%), and transportation, electric, gas and sanitary services (5.3%). Women with elevated blood leads also had non-work exposures mostly from household remodeling (10.5%), ceramics (2.6%), and firearms (2.6%). Figure 7 and Table 8 show the incidence rates of BLLs of 10 µg/dl and above, by county, for men. There were 873 men reported in 2002 with a BLL of 10 µg/dl or greater. Clinton (264/100,000), Montcalm (262/100,000) and St. Clair (144/100,000) had the three highest incidence rates. The elevated rates in these counties were secondary to individuals exposed to lead while working in brass/bronze foundries. The overall incidence rate for men was 24 times higher than that for women (24/100,000 vs 1/100,000). Source of Exposure Table 9 shows the source of exposure of lead for individuals with blood lead levels greater than 10 µg/dl reported in For 690 (92.4%) individuals, work was the identified source, for the other 8% a hobby, mainly related to guns 41 (5.5%) was the source. Home remodeling was the source in 10 individuals (1.3%), making stained glass or ceramics was the source in 4 (0.5%) of the individuals. For one individual retained bullet fragments and the other ingestion of lead was the source. For the remaining 216 individuals, we are still investigating the source. Table 10 shows the occupational sources of lead for individuals reported in The most frequent reports were on individuals in the manufacturing sector (58%), then construction (27%) and then public utilities and incinerators (10%). Less common sources were government (5.4%), services (4.9%) and wholesale and retail trade (2.8%). Figure 8 shows the distribution of non-construction companies that reported at least one adult with a BLL of 25 µg/dl or greater in Michigan during These companies included brass/bronze casting operations, performing radiator repair activities, and a print shop still utilizing the historic lead type. Summary of All Industrial Hygiene Inspections Since the 2001 report, the statewide surveillance system identified 21 companies where MIOSHA had not performed an inspection for lead in at least three years (Table 11). Seven of these companies have now been inspected. Inspections are planned for the other 12 companies. No inspections are planned at two companies because one company had no employees and the other facility had no follow up for other reasons. Inspections of these seven companies resulted in 5 of the 7 (71%) companies receiving citations for a violation of an occupational health standard (Table 12). Five of the 7 (71%) companies were issued citations for violations of the lead standard. Violations of the lead standard by industry type is shown in Table 13. Of the 21 companies identified nine were identified by elevated blood lead reports collected because of a company s medical surveillance program and five from an individual having the test performed by their personal health care provider. For seven we are unable to determine at this time why the blood lead sample was collected. One of the five companies identified because an individual had the blood lead test performed by their personal health care provider was inspected and was cited for a lead violation. 6
10 Interviews of Adults with Blood Lead Levels of 10 µg/dl or Greater Between October 15, 1997 and January 31, 2003, there were 675 reports received on adults with blood lead levels >10 µg/dl that completed an interview by telephone. The following summary of interview data is based on the 675 questionnaires completed by telephone. These 675 adults were reported to the Registry from October 15, 1997 to December 31, Table 14 lists the demographic characteristics of the 675 adults with completed questionnaires by highest lead level reported. Most of the completed questionnaires were of males (92.9%), which parallels the gender distribution of the number of lead level reports > 10 µg/dl submitted for adults in There was no difference in gender by highest blood lead level. The percentage of African-Americans was greater among adults with higher blood lead levels. The percentage of ever or current smokers was higher among adults with the higher blood lead levels. The group with the highest lead levels had the youngest mean age. Table 15 presents the types of lead-related symptoms reported during the interviews, by lead level. Only individuals who had daily or weekly symptoms were included in this table. Loss of 10+ pounds without dieting, continued loss of appetite, frequent pain/soreness, muscle weakness, headache, dizziness, feeling depressed, being tired, feeling nervous, waking up at night, and being irritable were associated with a statistically significant increasingly higher levels of blood lead. Having any gastro-intestinal, muscloskeletal, nervous, reproductive system symptom or any symptom was associated with a statistically significant increasingly higher levels of blood lead. Table 16 shows the reporting of anemia, kidney disease and high blood pressure by lead level category. Table 17 presents the type of industry by lead level reported among those interviewed. Overall, 30.9% worked in special trade construction, followed by 30.0% working in the primary metals industry. Among individuals with the highest blood leads ( 40 µg/dl), the most common exposure was the same as for all elevated blood lead levels with construction followed by the primary metals industry (foundries). Table 18 presents the number of years worked by highest lead level reported for the adults who completed a questionnaire. Higher blood lead level results were more likely to occur in shorter-term workers (i.e. worked in a lead exposed job for 5 or fewer years). Table 19 lists the types of working conditions reported by the interviewed adults, again by highest lead level reported. Workers with lower lead levels were more likely to report having their work clothing laundered at work, having a showering facility and having a separate lunch room. They also were more likely to report eating in the lunch room. As expected, workers with higher blood lead levels were more likely to have been removed from the job. The questionnaire also asks about children in the household, in order to document the potential for and extent of take-home lead. One-third of the adults interviewed reported children age 6 and younger living or spending time in the home (Table 20). Children from only 46 of the 208 (31.1%) households where an adult had an elevated lead level and young children lived or frequently visited were tested for blood lead. Among the 46 households where we know the childs blood test results, 20 (47.6%) households had a child with an elevated blood lead level. A letter was sent to all adults with young children encouraging them to test the children for lead. 7
11 Outreach Activities This past year we used the National Automotive Radiator Service Association (NARSA) to identify 28 radiator repair shops in the state. A letter on the potential hazards of lead was sent to these facilities. Included with the letter was a short survey on lead use and medical testing which was to be returned on a postage paid postcard. Of the surveys sent out, 1 company was out of business, 26 were returned and we are still recontacting 1 to get a response. Of the 26 returned 11(42.3%) indicated they were not above the action lead level requiring blood testing, 7 (26.9%) indicated they were conducting medical monitoring, 4 (15.4%) indicated they were unaware of the requirement to test, 2 (7.7%) said no lead was used in their facility and 2 (7.7%) had other responses (one requested additional information and one said they had no employees). Also this past year we began to identified the health care provider who ordered the blood lead test. A letter was then sent to the physician and/or health system which ordered the test. This letter contained resources on lead poisoning in adults: To date twenty-two letters have been sent. Annual Report on Blood Lead Levels in Michigan ATSDR Toxicological Profile: Lead Lead Hazards at Indoor Firing Ranges (Fact Sheet) MIOSHA Standard: Lead in General Industry (Part 310) MIOSHA Standard: Lead in Construction (Part 603) Morbidity and Mortality Weekly Report (Appendix IV) PS News: Normal Values for Blood Lead (Volume 12 Number 2) Discussion: An individual may have a blood lead test performed as part of an employer medical-screening program or as part of a diagnostic evaluation by their personal physician. Whatever the reason for testing, the results are then sent by the testing laboratories to the MDCH as required by law. If the individual reported is an adult, the report is then forwarded to the MDCIS and maintained in the ABLES Program Lead Registry. Individuals with a blood lead level of 25 µg/dl or greater, and a sample of individuals with blood lead levels of µg/dl, are interviewed by a trained medical interviewer by telephone. The interview details demographic information, exposure history and the presence and nature of lead related symptoms. A MIOSHA enforcement inspection is conducted to document current exposures to lead at work and the company s compliance with the lead standard when an individual from the company is identified with a blood lead value of 25 µg/dl or greater. Michigan is one of 35 states conducting surveillance of elevated blood lead levels. Michigan requires the reporting of all blood lead level results. Major benefits for reporting all blood lead levels are: the ability to calculate the rates of elevated blood lead levels in specific groups of interest; the ability to monitor compliance with the testing requirements of the lead standard; and facilitating the tracking of reports from particular employers to monitor their progress in reducing workers exposures to lead. Data from the state surveillance systems shows that elevated lead levels from occupational exposures are an important public health problem in the United States (6). It is well-documented that exposure to lead may 8
12 cause serious health effects in adults, including injury to the nervous system, kidneys, and blood-forming and reproductive systems in men and women. The level of lead in the blood is a direct index of a worker s recent exposure to lead as well as an indication of the potential for adverse effects from that exposure (7). A further problem is that workers can bring lead home on their clothes and expose children to lead. Forty-eight percent of households with children under the age of 6 where the adult had an elevated blood lead level and the child was tested had an elevated blood level (Table 20). Children can experience serious adverse effects on neurological and intellectual development from lead exposure. Average blood lead levels in the United States general population range from 2.1 to 3.4 µg/dl with 1.5 to 4.6% of adults tested for blood lead having blood lead levels greater than or equal to 10 µg/dl (5). On the average, blood lead levels are higher in the elderly, in men, and in African-Americans and Hispanics. Despite these differences, the mean blood lead levels and the percentage greater than 10 µg/dl for these sub populations are not clinically significantly different (5). A blood lead level greater than or equal to 10 µg/dl is an indication of exposure and increased absorption of lead regardless of age, race and gender. Values above 9 µg/dl indicate exposure to lead beyond that found in the background environment. An effort was made in the previous years to get all laboratories to use the same normal ranges. All but one of the labs now used 10 µg/dl as the upper limit for a "normal" blood lead level. Symptoms involving the gastrointestinal, musculoskeletal and nervous systems occurred at levels within the allowable MIOSHA and OSHA standards (Table 13). The presence of these symptoms supports the need to lower the blood lead level which mandates medical removal. The current allowable level is up to 50 µ g/dl. Seventy percent of individuals had daily or weekly symptoms with blood lead below this level. We recently completed analysis of the symptom data and found that nervous system symptoms began to increase at µg/dl, gastrointestinal symptoms at µg/dl and musculoskeletal symptoms at µg/dl (3). Other recent studies also support the inadequacy of the current occupational standard of 50 µg/dl to protect workers health. Significant increases in all-cause, circulatory and cardiovascular mortality were reported in the United States among individuals followed up until 1992 who were identified with blood lead levels of µg/dl during the years 1976 to 1980 (1). A further study from Taiwan among individuals with chronic renal disease without increased body burdens of lead and blood leads of only 5.3 µg/dl showed that treatment to increase lead excretion improved kidney function and decreased progression to end state renal disease (2). All these studies provide added weight to the inadequacy of the current occupational standard of 50 µg/dl. The American Conference of Governmental Industrial Hygienists has recommended a maximum blood lead of 30 µg/dl. In addition to suggesting the need for a new occupational standard, this data indicates the need to update health care providers of the latest information about the hazards of lead. In 2002, there were 982 adults reported in Michigan with blood lead levels greater than or equal to 10 µg/dl. Ninety-six percent were men. The mean age was 42. They were predominately white (88.6%). They predominately resided in a band of counties stretching across the state from Muskegon and Oceana to Wayne and Macomb. The counties with the highest percentage of elevated blood leads were counties with brass/bronze foundries (Figure 8). The exposure was predominately occupational in origin, occurring during the casting of brass/bronze parts or among abrasive blasters removing paint from outdoor metal structures, among workers repairing car radiators or individuals who work in indoor firing ranges. Individuals with the highest blood leads were more likely to be younger (Table 14). We attribute this finding to a higher percentage of younger workers in construction doing abrasive blasting on metal structures. Also younger, less experienced workers maybe given the dirtier less desirable tasks. 9
13 Based on the experience in other states we presume that the number of reports of elevated blood lead levels we receive is an underestimate of the true number of Michigan citizens with elevated blood leads (8,9). For example, in a study in California while 95% of lead battery employees had blood leads performed by their employers only 8% of employees from radiator repair facilities and 34% of employees from secondary smelters of non-ferrous metal had blood leads performed by their employer (9). Overall it was estimated that less than 3% of employees in California exposed to lead were provided blood lead testing by their employer (9). On a national basis it was estimated that less than 12% of companies using lead provided blood lead testing for their employees (8). Our survey this past year of 28 Michigan radiator repair facilities identified that 27% of the companies were providing blood lead testing to their employees. This is better than the 8% reported during the late 1980 s in California. Fifteen percent indicated they were unaware of the requirement, and 42% indicated air lead levels in their facilities were below levels where such blood lead testing is required. Further follow-up is needed to determine the reliability of these self-reports. Seven adults had blood lead levels above 50 µg/dl, which is the maximum blood lead level allowed in the work place. Three of the 7 adults were exposed to lead from blasting/painting, one from firearm sales, one from radiator repair, one from cutting iron at a scrap yard, and one from a household remodeling project. One from radiator repair is still being investigated. An inspection was conducted at seven companies where a worker was reported with a blood lead level > 25 µg/dl. Five of seven (71%) of these companies were cited for violations of the lead standard (Table 13). In its fifth year of operation the surveillance system for lead proved successful in continuing to identify large numbers of adults with elevated lead levels and sources of exposure that could be remediated to reduce exposures. Further outreach work to encourage industries using lead to better monitor its use is planned. Similarly, further outreach is planned to the medical community on the recognition and management of individuals with potential lead-related medical problems. Reevaluation of the current occupational lead standard should also be considered. Finally, we are encouraged both by the increased compliance of the reporting law and by the reduction in blood lead levels greater than or equal to 10 and to 25 µg/dl (Figure 9). We will continue to monitor for this trend in the year
14 References 1. Lustberg M, Silbergeld E. Blood Lead Levels and Mortality. Archives of Internal Medicine 2002; 162: Lin JL, Lin-Tan DT, Hsu KH, Yu CC. Environmental Lead Exposure and Progression of Chronic Renal Diseases in Patients without Diabetes. New England Journal of Medicine 2003; 348: Rosenman KD, Sims AS, Luo Z, Gardiner J. Occurrence of Lead-Related Symptoms Below Current Occupational Safety and Health Allowable Blood Lead Levels. Journal of Occupational and Environmental Medicine. 2003; 45: (in press). 4. Rosenman KD, Sims AS, Hogan A, Fialkowski J, Gardiner J. Evaluation of the Effectiveness of Following Up Laboratory Reports of Elevated Blood Leads in Adults. AIHA 2001; 62: Pirkle JL, Kaufmann RB, Brody DJ, Hickman T, Gunter EW, Paschal DC. Exposure of the US Population to Lead, Environmental Health Perspectives 1998; 106: Adult Blood Lead Epidemiology and Surveillance. Morbidity and Mortality Weekly Report. MMWR. 2002; 51: ATSDR. Toxicological Profile for Lead. US Department of Health Human Services. Agency for Toxic Substances and Disease Registry. August Baser ME. The Development of Registries for Surveillance of Adult Lead Exposure, 1981 to American Journal of Public Health. 1992; 82: Rudolph L, Sharp DS, Samuels S, Perkins C, Rosenberg J. Environmental and Biological Monitoring for Lead Exposure in California Workplaces. American Journal of Public Health 1990; 80:
15 Appendices Appendix I Appendix II Appendix III Appendix IV Blood Lead Analysis Reporting OSHA Blood Lead Laboratories Summary of Michigan s Lead Standards Morbidity and Mortality Weekly Report (MMWR): Adult Blood Lead Epidemiology and Surveillance-United States,
16 Table 1. Distribution of Highest Blood Lead Levels (BLLs) Among Adults in Michigan: 2002 BLLs (ug/dl) Number Percent <10 9, > TOTAL 10,860 * *In 2002, 11,994 BLL reports were received for 10,860 individuals. 13
17 Table 2. Distribution of Gender Among Adults Tested for Blood Lead in Michigan: 2002 All Blood Lead Level Tests Blood Lead Levels > 10 ug/dl Gender Number Percent Number Percent Male 7, Female 3, Total 10,858 * *Gender was unknown for 2 additional individuals. 14
18 Table 3. Distribution of Age Among Adults Tested for Blood Lead in Michigan: 2002 All Blood Lead Level Tests Blood Lead Levels > 10 ug/dl Age Range Number Percent Number Percent , , , , TOTAL 10,
19 Table 4. Distribution of Race Among Adults Tested for Blood Lead in Michigan: 2002 All Blood Lead Level Tests Blood Lead Levels > 10 ug/dl Race Number Percent Number Percent Caucasian 3, African American Native American Asian/Pacific Islander Multiracial/Other TOTAL 4,714 * ** *Race was unknown for 6,146 additional individuals. **Race was unknown for 352 additional individuals. 16
20 Table 5. Distribution of Adults with All Blood Lead Levels (BLLs), BLLs >10 ug/dl, and BLLs >25 ug/dl, Michigan by County of Residence: 2002 All BLLs BLLs >10 ug/dl BLLs >25 ug/dl County Number Percent Number Percent Number Percent Alcona Alger Allegan Alpena Antrim Arenac Baraga Barry Bay Benzie Berrien Branch Calhoun Cass Charlevoix Cheboygan Chippewa Clare Clinton Crawford Delta Dickinson Eaton Emmet Genesee Gladwin Gogebic Grand Traverse Gratiot Hillsdale Houghton Huron Ingham Ionia Iosco Iron Isabella Jackson Kalamazoo Kalkaska Kent Keweenaw Lake Lapeer Continued
21 Table 5. Distribution of Adults with All Blood Lead Levels (BLLs), BLLs >10 ug/dl, and BLLs >25 ug/dl, Michigan by County of Residence: 2002 All BLLs BLLs >10 ug/dl BLLs >25 ug/dl County Number Percent Number Percent Number Percent Leelanau Lenawee Livingston Luce Mackinac Macomb Manistee Marquette Mason Mecosta Menominee Midland Missaukee Monroe Montcalm Montmorency Muskegon Newaygo Oakland Oceana Ogemaw Ontonagon Osceola Oscoda Otsego Ottawa Presque Isle Roscommon Saginaw Saint Clair Saint Joseph Sanilac Schoolcraft Shiawassee Tuscola Van Buren Washtenaw Wayne 2, Wexford TOTAL 9,190 * ** *** *County was unknown for 1,670 additional adults. **County was unknown for 71 additional adults. ***County was unknown for 16 additional adults. 18
22 Table 6. Percentage of Adults with Blood Lead Levels (BLLs) >10 ug/dl and >25 ug/dl, Michigan by County of Residence: 2002 All BLLs BLLs >10 ug/dl BLLs >25 ug/dl County Number Percent Number Percent Number Percent Alcona Alger Allegan Alpena Antrim Arenac Baraga Barry Bay Benzie Berrien Branch Calhoun Cass Charlevoix Cheboygan Chippewa Clare Clinton Crawford Delta Dickinson Eaton Emmet Genesee Gladwin Gogebic Grand Traverse Gratiot Hillsdale Houghton Huron Ingham Ionia Iosco Iron Isabella Jackson Kalamazoo Kalkaska Kent Keweenaw Lake Lapeer Continued
23 Table 6. Percentage of Adults with Blood Lead Levels (BLLs) >10 ug/dl and >25 ug/dl, Michigan by County of Residence: 2002 All BLLs BLLs >10 ug/dl BLLs >25 ug/dl County Number Percent Number Percent Number Percent Leelanau Lenawee Livingston Luce Mackinac Macomb Manistee Marquette Mason Mecosta Menominee Midland Missaukee Monroe Montcalm Montmorency Muskegon Newaygo Oakland Oceana Ogemaw Ontonagon Osceola Oscoda Otsego Ottawa Presque Isle Roscommon Saginaw Saint Clair Saint Joseph Sanilac Schoolcraft Shiawassee Tuscola Van Buren Washtenaw Wayne 2, Wexford TOTAL 9,190 * ** *** *County was unknown for 1,670 additional adults. **County was unknown for 71 additional adults. ***County was unknown for 16 additional adults. 20
24 Table 7. Annual Incidence of Blood Lead Levels (BLLs) >10 ug/dl Among Women in Michigan by County of Residence: 2002 Number Michigan Rate per County Reported Population Women 100,000 women Alpena 1 12,900 8 Arenac 1 6, Calhoun 1 55,391 2 Clinton 3 24, Genesee 3 174,273 2 Ingham 1 116,096 1 Kalamazoo 2 98,198 2 Lenawee 1 38,493 3 Macomb 3 320,054 1 Mason 1 11,415 9 Monroe 1 56,520 2 Muskegon 2 65,667 3 Oakland 1 479,049 0 Ottawa 2 91,080 2 St Clair 1 64,248 2 Wayne ,907 2 Wexford 1 11,999 8 TOTAL 38 3,939,649 * 1 ** *Total number of women in all 83 counties of Michigan age 16+ years; 2000 US. Census population data. **Rate per 100,000 women, age 16+ years. 21
25 Table 8. Annual Incidence of Blood Lead Levels (BLLs) >10 ug/dl Among Men in Michigan by County of Residence: 2002 Number Michigan Rate per Number Michigan Rate per County Reported Population Men 100,000 Men County Reported Population Men 100,000 Men Alcona 0 4,897 0 Keweenaw 0 1,015 0 Alger 1 4, Lake 1 4, Allegan 3 38,907 8 Lapeer 4 33, Alpena 4 11, Leelanau 1 8, Antrim 1 8, Lenawee 8 37, Arenac 2 7, Livingston 4 58,520 7 Baraga 0 3,728 0 Luce 0 3,267 0 Barry 3 21, Mackinac 0 4,768 0 Bay 8 41, Macomb , Benzie 1 6, Manistee 1 9, Berrien 14 59, Marquette 4 26, Branch 0 17,848 0 Mason 0 10,866 0 Calhoun 2 50,858 4 Mecosta 1 16,425 6 Cass 1 19,607 5 Menominee 0 9,888 0 Charlevoix 1 9, Midland 3 30, Cheboygan 1 10, Missaukee 0 5,469 0 Chippewa 8 17, Monroe 19 54, Clare 0 12,012 0 Montcalm 63 24, Clinton 63 23, Montmorency 0 4,149 0 Crawford 0 5,651 0 Muskegon 23 62, Delta 0 14,862 0 Newaygo 4 17, Dickinson 9 10, Oakland , Eaton 5 38, Oceana 0 10,111 0 Emmet 3 11, Ogemaw 0 8,454 0 Genesee , Ontonagon 0 3,260 0 Gladwin 1 10, Osceola 0 8,660 0 Gogebic 0 7,163 0 Oscoda 0 3,668 0 Grand Traverse 2 28,998 7 Otsego 0 8,778 0 Gratiot 19 17, Ottawa 12 86, Hillsdale 0 17,632 0 Presque Isle 0 5,854 0 Houghton 1 15,630 6 Roscommon 1 10, Huron 6 13, Saginaw 20 75, Ingham , Saint Clair 88 61, Ionia 33 25, Saint Joseph 3 23, Iosco 0 10,658 0 Sanilac 3 16, Iron 0 5,317 0 Schoolcraft 0 3,540 0 Isabella 2 24,492 8 Shiawassee 14 26, Jackson 8 62, Tuscola 1 22,068 5 Kalamazoo 10 89, Van Buren 4 28, Kalkaska 0 6,391 0 Washtenaw 3 127,697 2 Kent , Wayne , Wexford 3 11, TOTAL 873 * 3,688,521 ** 24 *** *County was unknown for 71 additional male adults. **Total number of men in all 83 counties of Michigan age 16+ years; 2000 US. Census population data. ***Rate per 100,000 men, age 16+ years. 22
26 Table 9. Source of Exposure Among Adults with BLLs >10 ug/dl in Michigan: 2002 Exposure Source Description Number Percent Work-Related Hobby: Firearms Remodeling Hobby: Reloader Food, Pottery, Ceramics Hobby: Stained Glass Gun Shot Wound Pica TOTAL 747 * * Patient interviews were attempted on 318 individuals; no patient interviews were attempted on 430 individuals, source was obtained from laboratory reporting form. For 142 additional adults source is pending an interview; 74 additional adults source is pending medical records review; 6 additional adults source was inconclusive based on interview; 13 additional adults source was inconclusive and no patient interview was attempted. 23
27 Table 10. Industries Where Individuals with BLLs >10 ug/dl Were Exposed to Lead in Michigan: 2002 Work-Exposed Individuals (BLL > 10 ug/dl) Industry (SIC Code)* Number Percent Construction (15-17) Painting (17) 182 Manufacturing (20-39) Fabricated and Primary Metals (33-34) 161 Transportation and Public Utilities (40-49) Wholesale and Retail Trade (50-59) Services (70-89) Automotive Repair Services (75) 12 Public Administration (91-97) Justice, Public Order, Safety (92) 15 TOTAL *Standard Industrial Classification. 24
28 Table 11. Inspection Status of Twenty-One New Companies that were Identified Since the 2001 Annual Analysis from a Blood Lead Report of 25 µg/dl in Michigan Inspection Status Number Percent Completed Inspections Scheduled for Inspection 12 * 57.1 No Follow-Up Planned 2 ** 9.5 Total *** * One inspection was referred to another OSHA state plan for follow up. ** One facility had no employees; one facility had no follow up for other reasons. *** Percentages do not add to 100% due to rounding. 25
29 Table 12. Results of Seven New Companies that were Inspected Since the 2001 Annual Analysis from a Blood Lead Report of 25 µg/dl in Michigan Inspection Results Number Percent Cited for Lead Standard Violation(s) Only Cited for Lead Standard and Other Violation(s) Not Cited for any Violation(s) Total * * Percentages do not add to 100% due to rounding. 26
30 Table 13. Seven New Companies Inspected Since the 2001 Annual Analysis Resulting from Michigan Adults with Blood Lead Levels (BLLs) of 25 µg/dl Cited for Violation Companies of Lead Standard Industry (SIC)* Number Number Percent Construction (15-17) Special Trade Construction (17) Manufacturing (20-39) Metal Fabrication (34) Transportation (37) Services (70-89) Recreation (79) Government (91-97) Police (92) Total 7 5 ** 71 * Standard Industrial Classification. ** Two facilities were not cited in violation of the Lead Standard. 27
31 Table 14. Demographic Characteristics of Michigan Adults with Blood Lead Levels (BLLs) of 10 µg/dl, Interviewed from to , by Highest Reported Blood Lead Level (µg/dl) Demographic µg/dl µg/dl µg/dl µg/dl µg/dl >60 µg/dl TOTAL Characteristics Number Percent Number Percent Number Percent Number Percent Number Percent Number Percent Number Percent Male 191 (88.8) 132 (93.6) 203 (95.8) 64 (92.8) 27 (96.4) 10 (100) 627 (92.9) Female 24 (11.2) 9 ( 6.4) 9 ( 4.2) 5 ( 7.2) 1 ( 3.6) ( 7.1) Hispanic Origin 9 ( 4.7) 6 ( 4.6) 3 ( 1.5) 6 ( 9.1) 1 ( 3.6) ( 4.0) White 182 (85.4) 127 (90.7) 186 (88.2) 59 (85.5) 25 (89.3) 7 (70.0) 586 (87.3) African American 20 ( 9.4) 7 ( 5.0) 15 ( 7.1) 6 ( 8.7) 3 (10.7) 3 (30.0) 54 ( 8.0) Asian/Pacific Islander 1 ( 0.5) ( 0.5) ( 0.3) Native American/Alaskan 1 ( 0.5) 1 ( 0.7) 7 ( 3.3) ( 1.3) Other 9 ( 4.2) 5 ( 3.6) 2 ( 0.9) 4 ( 5.8) ( 3.0) Average Age 45 n= n= n= n=69 48 n=28 39 n=10 46 n=675 Ever Smoked 133 (64.9) 95 (69.9) 142 (73.6) 48 (76.2) 19 (79.2) 7 (77.8) 444 (70.5)* Now Smoke 68 (50.7) 56 (58.3) 102 (70.3) 37 (77.1) 15 (78.9) 5 (71.4) 283 (63.0)* *P= < 0.05 for linear trend. 28
32 Table 15. Symptoms of Michigan Adults with Blood Lead Levels (BLLs) of 10 µg/dl, Interviewed from to , by Highest Reported Blood Lead Level (µg/dl) µg/dl µg/dl µg/dl µg/dl µg/dl >60 µg/dl TOTAL Symptoms Number Percent Number Percent Number Percent Number Percent Number Percent Number Percent Number Percent GASTRO-INTESTINAL Lost 10+ lbs without diet 24 (11.6) 11 ( 8.1) 31 (15.0) 17 (25.0) 6 (23.1) 1 (11.1) 90 (13.8)* Continued loss of appetite 25 (12.0) 16 (11.5) 34 (16.2) 15 (22.1) 7 (25.9) 2 (20.0) 99 (14.9)* Pains in belly 47 (22.4) 16 (11.6) 35 (16.9) 20 (29.0) 8 (29.6) 1 (10.0) 127 (19.2) MUSCULOSKELETAL Frequent pain/soreness 81 (39.3) 46 (33.3) 81 (38.8) 39 (58.2) 13 (48.1) 5 (50.0) 265 (40.3)* Muscle weakness 54 (26.2) 21 (15.3) 43 (20.9) 27 (39.7) 12 (44.4) 5 (50.0) 162 (24.8)* NERVOUS Headaches 37 (17.6) 17 (12.1) 48 (22.9) 21 (30.4) 8 (28.6) 3 (30.0) 134 (20.1)* Dizziness 19 ( 9.1) 10 ( 7.1) 14 ( 6.8) 12 (17.6) 4 (14.8) 3 (30.0) 62 ( 9.4)* Depressed 32 (15.5) 17 (12.5) 32 (15.6) 10 (14.9) 10 (35.7) 5 (50.0) 106 (16.2)* Tired 83 (40.1) 47 (33.8) 109 (52.2) 44 (64.7) 17 (60.7) 6 (60.0) 306 (46.3)* Nervous 29 (13.8) 14 (10.1) 32 (15.6) 16 (23.2) 10 (37.0) 4 (40.0) 105 (15.9)* Waking up at night 55 (26.6) 30 (21.6) 71 (34.1) 27 (39.7) 13 (46.4) 4 (44.4) 200 (30.3)* Nightmares 13 ( 6.3) 3 ( 2.2) 9 ( 4.4) 5 ( 7.4) 3 (11.1) 2 (20.0) 35 ( 5.4) Irritable 39 (18.7) 34 (24.8) 63 (30.4) 25 (36.8) 13 (48.1) 5 (50.0) 179 (27.2)* Unable to concentrate 37 (17.8) 19 (13.9) 42 (20.2) 13 (19.7) 8 (28.6) 3 (30.0) 122 (18.5) REPRODUCTIVE Unable to have an erection 8 (18.2) 5 ( 8.2) 10 ( 8.1) 5 (12.8) 7 (36.8) (11.9) Trouble having a child 13 ( 6.3) 7 ( 5.1) 10 ( 5.0) 1 ( 1.6) (12.5) 32 ( 5.0) Gastro-Intestinal Symptoms 58 (27.5) 27 (19.3) 60 (28.4) 28 (40.6) 13 (46.4) 4 (40.0) 190 (28.4)* Musculoskeletal Symptoms 90 (43.3) 49 (35.5) 88 (42.1) 43 (63.2) 15 (55.6) 6 (60.0) 291 (44.1)* Nervous Symptoms 120 (57.1) 71 (50.7) 142 (67.6) 49 (71.0) 21 (75.0) 6 (60.0) 409 (61.3)* Reproductive Symptoms 17 (30.9) 9 (14.1) 17 (13.3) 4 (10.0) 2 (10.5) 1 (14.3) 50 (16.0)* Any Symptoms 144 (68.2) 89 (63.6) 150 (71.1) 56 (81.2) 24 (85.7) 7 (70.0) 470 (70.3)* Average Number Symptoms 2.8 n= n= n= n= n= n= n=669 *P= < 0.05 for linear trend. 29
33 Table 16. Lead Related Health Conditions of Michigan Adults with Blood Lead Levels (BLLs) of 10 µg/dl, Interviewed from to , by Highest Reported Blood Lead Level (µg/dl) µg/dl µg/dl µg/dl µg/dl µg/dl >60 µg/dl TOTAL Lead Related Disease Number Percent Number Percent Number Percent Number Percent Number Percent Number Percent Number Percent Anemia 16 ( 7.8) 3 ( 2.2) 8 ( 3.9) 3 ( 4.6) 2 ( 7.4) ( 5.0) Kidney Disease 5 ( 2.4) 1 ( 0.7) 5 ( 2.4) 1 ( 1.4) 1 ( 3.7) ( 2.0) High Blood Pressure 17 ( 8.2) 9 ( 6.5) 26 (12.7) 12 (18.5) 4 (15.4) 1 (11.1) 69 (10.6)* *P= < 0.05 for linear trend. 30
34 Table 17. Industry of Michigan Adults with Blood Lead Levels (BLLs) of 10 µg/dl, Interviewed from to , by Highest Reported Blood Lead Level (µg/dl) µg/dl µg/dl µg/dl µg/dl µg/dl >60 µg/dl TOTAL Industry (SIC Code*) Number Percent Number Percent Number Percent Number Percent Number Percent Number Percent Number Percent Construction, Building (15) ( 0.8) ( 0.2) Construction, Heavy (16) 6 ( 4.2) 1 ( 0.8) 2 ( 1.1) ( 1.7) Special Trade Construction (17) 49 (34.5) 23 (19.3) 57 (31.1) 22 (39.3) 10 (41.7) 4 (40.0) 165 (30.9) Lumber and Wood (24) 1 ( 0.7) ( 0.2) Furniture and Fixtures (25) 1 ( 0.7) ( 0.2) Printing and Publishing (27) 1 ( 0.7) ( 0.5) ( 0.4) Stone/Clay/Glass (32) 3 ( 2.1) 2 ( 1.7) 3 ( 1.6) 2 ( 3.6) ( 1.9) Primary Metals Industry (33) 10 ( 7.0) 41 (34.5) 78 (42.6) 20 (35.7) 8 (33.3) 3 (30.0) 160 (30.0) Fabricated Metal Products (34) 5 ( 3.5) 10 ( 8.4) 14 ( 7.7) 5 ( 8.9) ( 6.4) Industrial, Commercial Machinery (35) 4 ( 2.8) 3 ( 2.5) 4 ( 2.2) 1 ( 1.8) 2 ( 8.3) 1 (10.0) 15 ( 2.8) Electronics (36) 7 ( 4.9) 1 ( 0.8) ( 1.5) Transportation Equipment (37) 7 ( 4.9) 3 ( 2.5) 3 ( 1.6) 2 ( 3.6) ( 2.8) Misc. Manufacturing Industries (39) 1 ( 0.7) 1 ( 0.8) ( 0.4) Railroad Transportation (40) 1 ( 0.7) 3 ( 2.5) 3 ( 1.6) ( 1.3) Trans., Electric, Gas & San. Svcs. (49) 4 ( 2.8) 4 ( 3.4) 2 ( 1.1) ( 1.9) Wholesale-Durable Goods (50) 2 ( 1.4) 1 ( 0.8) 1 ( 0.5) ( 0.7) Building Materials, Hardware (52) 1 ( 0.7) ( 0.2) Automotive Dealers, Gas (55) ( 2.5) ( 0.6) Other Retail Trade (59) 1 ( 0.7) ( 0.5) ( 0.4) Finance, Insurance,Real Estate (65) 1 ( 0.7) ( 0.2) Automotive Repair Services (75) 7 ( 4.9) 6 ( 5.0) 2 ( 1.1) 4 ( 7.1) 2 ( 8.3) ( 3.9) Misc. Repair Services (76) 1 ( 0.7) 1 ( 0.8) 2 ( 1.1) ( 0.7) Amusement and Recreation (79) 4 ( 2.8) 2 ( 1.7) 1 ( 0.5) ( 8.3) 2 (20.0) 11 ( 2.1) Health Services (80) 1 ( 0.7) ( 0.2) Educational Services (82) 7 ( 4.9) 3 ( 2.5) 1 ( 0.5) ( 2.1) Museum, Art Galleries (84) ( 0.8) ( 0.2) Engineering Services (87) 7 ( 4.9) 2 ( 1.7) 2 ( 1.1) ( 2.1) General Government (91) 1 ( 0.7) ( 0.2) Justice, Public Order, Safety (92) 5 ( 3.5) 6 ( 5.0) 5 ( 2.7) ( 3.0) Human Resources (94) ( 0.5) ( 0.2) Admin Of Economic Programs(96) 2 ( 1.4) 1 ( 0.8) ( 0.6) National Security, Int l Affairs (97) 2 ( 1.4) ( 0.4) TOTAL 142 (100) 119 (100) 183 (100) 56 (100) 24 (100) 10 (100) 534 (100) *Standard Industrial Classification. 31
35 Table 18. Number of Years Worked of Michigan Adults with Blood Lead Levels (BLLs) of 10 µg/dl, Interviewed from to , by Highest Reported Blood Lead Level (µg/dl) Number of µg/dl µg/dl µg/dl µg/dl µg/dl >60 µg/dl TOTAL Years Worked Number Percent Number Percent Number Percent Number Percent Number Percent Number Percent Number Percent < 5 88 (56.4) 73 (62.4) 98 (51.9) 32 (56.1) 13 (56.5) 6 (60.0) 310 (56.2) (14.1) 19 (16.2) 28 (14.8) 6 (10.5) 6 (26.1) 2 (20.0) 83 (15.0) (18.6) 17 (14.5) 32 (16.9) 10 (17.5) 2 ( 8.7) 1 (10.0) 91 (16.5) ( 7.1) 8 ( 6.8) 26 (13.8) 2 ( 3.5) 1 ( 4.3) 1 (10.0) 49 ( 8.9) > 31 6 ( 3.8) ( 2.6) 7 (12.3) 1 ( 4.3) ( 3.4) 32
36 Table 19. Working Conditions Reported by Michigan Adults with Blood Lead Levels (BLLs) of 10 µg/dl, Interviewed from to , by Highest Reported Blood Lead Level (µg/dl) µg/dl µg/dl µg/dl µg/dl µg/dl >60 µg/dl TOTAL Working Conditions Number Percent Number Percent Number Percent Number Percent Number Percent Number Percent Number Percent Separate lockers: dirty and clean* 72 (49.3) 83 (70.9) 124 (68.1) 32 (57.1) 14 (56.0) 3 (33.3) 328 (61.3) Work clothes laundered: work* 60 (41.1) 73 (62.9) 107 (57.8) 26 (46.4) 10 (40.0) 2 (22.2) 278 (51.8) Shower facility* 73 (49.0) 75 (64.7) 133 (72.3) 28 (49.1) 11 (45.8) 4 (44.4) 324 (60.1) Lunch room* 99 (66.0) 83 (72.2) 145 (78.8) 32 (56.1) 13 (52.0) 4 (44.4) 376 (69.6) Clean off dust and wash 139 (92.1) 102 (87.9) 168 (90.3) 47 (85.5) 21 (84.0) 9 (100) 486 (89.7) hands before eating* Eat in lunchroom* 73 (60.8) 67 (69.1) 99 (62.3) 26 (53.1) 8 (38.1) 3 (37.5) 276 (60.8) Wear respirator* 94 (62.3) 78 (67.2) 139 (74.7) 44 (78.6) 15 (60.0) 8 (88.9) 378 (69.6) Smoke in work area** 47 (67.1) 35 (62.5) 64 (64.0) 16 (44.4) 7 (46.7) 4 (80.0) 173 (61.3) Keep cigarettes in pocket 34 (50.7) 16 (28.1) 46 (46.5) 13 (36.1) 4 (26.7) 3 (60.0) 116 (41.6) while working** Exposed to Lead now* 85 (58.2) 68 (60.2) 123 (67.2) 29 (55.8) 16 (72.7) 2 (22.2) 323 (61.5) Removal from job* 11 ( 7.2) 11 ( 9.3) 27 (14.6) 14 (25.5) 8 (32.0) 4 (44.4) 75 (13.8) *Based on positive questionnaire responses. **Based on negative questionnaire responses. 33
37 Table 20. Number of Households with Children (6 or under) Potentially Exposed to Take-Home Lead from Michigan Adults with Blood Lead Levels (BLLs) of 10 µg/dl, Interviewed from to , by Highest Reported Blood Lead Level (µg/dl) µg/dl µg/dl µg/dl µg/dl µg/dl >60 µg/dl TOTAL Description of Households Number Percent Number Percent Number Percent Number Percent Number Percent Number Percent Number Percent Households with Children living or spending time in house Households with Children tested for Lead Households where Children had elevated Lead levels 64 (30.2)* 45 (32.1) 68 (32.2) 18 (26.5) 11 (39.3) 2 (20.0) 208 (31.1) 15 (26.3)** 7 (16.7) 11 (16.9) 8 (53.3) 4 (36.4) 1 (50.0) 46 (24.0) 8 (66.7)*** 1 (16.7) 6 (46.2) 3 (42.9) 1 (33.3) 1 (100) 20 (47.6) * Among individuals within blood lead category, percentage of their households with children living or spending time in house. ** Among individuals within blood lead category, percentage of households with children living or spending time in house where the children were tested for lead. Because of missing data the denominator may be less than the number with children living or spending time in house in the first row of the table. *** Among individuals within blood lead category, percentage of households with children living or spending time in house where children, who had blood lead tests, had blood lead levels > 10 µg/dl. Because of missing data, the denominator may be less then the number tested for lead in the second row of the table. 34
38 Figure 1. Distribution of Adults Tested for Blood Lead in Michigan by County of Residence: 2002 Number of Adults None Total number of Michigan adults: 9,190 County was unknown for 1,670 additional adults Oakland and Wayne counties had the highest number of adults reported, with 686 and 2,025, respectively. 35
39 Figure 2. Distribution of Adults with Blood Lead Levels (BLLs) >10 ug/dl in Michigan by County of Residence: 2002 Number of Adults None Total number of Michigan adults: 911 County was unknown for 71 additional adults St. Clair and Wayne counties had the highest number of adults with blood lead levels of 10 ug/dl or greater reported, with 89 and 199, respectively. 36
 >25 ug/dl in Michigan by County of Residence: 2002 Number of Adults None 1-9 10-19 20+ Total number of Michigan adults: 181 County was")
40 Figure 3. Distribution of Adults with Blood Lead Levels (BLLs) >25 ug/dl in Michigan by County of Residence: 2002 Number of Adults None Total number of Michigan adults: 181 County was unknown for 16 additional adults St. Clair and Wayne counties had the highest number of adults with blood lead levels of 25 ug/dl or greater reported, with 17 and 34 adults, respectively. 37
41 Figure 4. Percentage of Adults with Blood Lead Levels (BLLs) >10 ug/dl in Michigan by County of Residence: 2002* Percentage of Adults None 1-10% 11-20% 21+% Total number of Michigan adults: 911 County was unknown for 71 additional adults *Denominator used was the total number of adults tested for blood lead within each county. 38
42 Figure 5. Percentage of Adults with Blood Lead Levels (BLLs) >25 ug/dl in Michigan by County of Residence: 2002* Percentage of Adults None 0.5-3% 4-6% 7+% Total number of Michigan adults: 181 County was unknown for 16 additional adults *Denominator used was the total number of adults tested for blood lead within each county. 39
43 Figure 6. Annual Incidence of Blood Lead Levels (BLLs) >10 ug/dl Among Women in Michigan by County of Residence: 2002* OVERALL RATE FOR MICHIGAN WOMEN: 1 PER 100,000 Rate per 100,000 None Total reports of women: 38 *Rate per 100,000 women age 16+; denominator is the 2000 US. Census population data. 40
44 Figure 7. Annual Incidence of Blood Lead Levels (BLLs) >10 ug/dl Among Men in Michigan by County of Residence: 2002* OVERALL RATE FOR MICHIGAN MEN: 24 PER 100,000 Rate per 100,000 None Total reports of men: 873 County was unknown for 71 additional male adults *Rate per 100,000 men age 16+; denominator is the 2000 US. Census population data. 41
45 Figure 8. Geographic Distribution of Non-Construction Companies Reporting Adults with Blood Lead Levels (BLLs) >25 ug/dl in Michigan: 2002 Number of Companies None Total number of companies: 23 42
46 Figure 9. Number of Adult Blood Lead Levels > 10 ug/dl, > 25 ug/dl and > 50 ug/dl, Michigan: ,200 Number of Blood Leads 1, ,006 1, >= 10 ug/dl >= 25 ug/dl >= 50 ug/dl Reporting Year 43
47 Part II Blood Lead Levels Among Children in Michigan
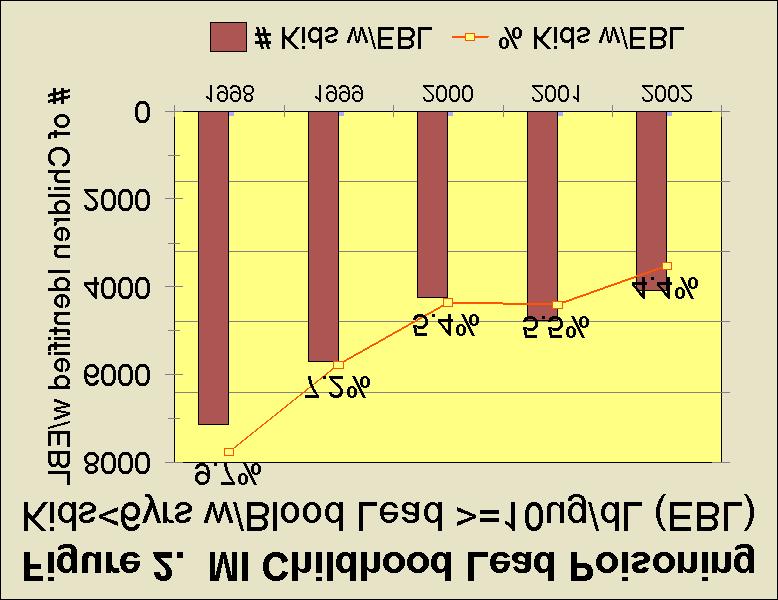
48 Michigan Department of Community Health Childhood Lead Poisoning Prevention Project Overview: The Michigan Department of Community Health (MDCH) Childhood Lead Poisoning Prevention Program (CLPPP) focuses its efforts on children less than six years of age. These efforts include: 1) implementation of, and training and advocacy for, the statewide testing plan for children; 2) maintenance of the statewide surveillance system, including collection, analysis and dissemination of testing results on the prevalence of elevated blood lead (EBL) levels, sources of lead exposure, and follow-up care for poisoned children; 3) monitoring policy development internal and external to the Department that potentially affects the lead program; 4) providing health education and materials related to lead poisoning for professional audiences as well as for the general public; 5) continuing to fund primary prevention activities in selected Michigan sites where capacity to provide lead inspection/risk assessment exists; and 6) working with housing authorities, rental property owners and other community groups to provide safe housing for children. CLPPP works on these efforts with local public health departments and other agencies with shared interest (Department of Education, Department of Consumer and Industry Services, Department of Environmental Quality, WIC, Head Start and Early Head Start, Early On, etc.) throughout the state. CLPPP also provides funding (through a grant from the Centers of Disease Control and Prevention) for lead-related activities in several local health departments: Delta/Menominee District Health Department, Detroit Health Department, District #10 Health Department (an agency for ten counties in western Michigan), Genesee County Health Department, Ingham County Health Department, Kent County Health Department, Oakland County Health Department, Wayne County Health Department, and Field Neurosciences Institute of Saginaw County. The primary source of lead exposure for Michigan children is lead-based paint in pre-1978 housing. Deteriorating lead paint (chipping, peeling, moisture damaged, multiple coats of intact paint on friction surfaces) creates a fine dust that is invisible to the eye, and falls on windowsills, floors, porches and driplines around the outside of a home. Young children ingest lead dust through normal hand-to-mouth activity. Because the central nervous system has a period of rapid and important growth in early childhood, the effects on the nervous system, hearing, vision, cognitive development and behavior can be devastatingcand, for the most part, irreversible. Long-term effects of lead poisoning reduce a child=s potential in school, work, health, and human relationships. 2002: For the year 2002, 4,083 Michigan children less than six years of age had confirmed elevated blood lead levels (> 10 ug/dl). Once again, only 11% of children in that age group were tested, and that represents less than 25% of those at highest risk for childhood lead poisoning. The number of children less than six years of age tested statewide (92,767) increased by 5.6% over testing in calendar year 2001 (87,875). Four percent (4.4%) of the tested children had elevated blood lead levels (EBLLs). That represents a 20% decrease from 2001 (5.5%) in the number of children with EBLL. 1
49 However, Michigan=s prevalence rate of EBL among children remains greater than that of the U.S. as a whole. The percentage of children with blood lead levels of 20 ug/dl or greater decreased 17% from 0.82% in 2001 to 0.68% in The Center for Medicaid and Medicare Services (CMS; previously called Health Care Financing Administration) requires blood lead testing of all Medicaid-eligible children at ages one and two years, or, if the child is aged three to six years and has never been tested, a blood test during those years. The CDC has noted, through their Childhood Blood Lead Surveillance (CBLS), a compelling association between Medicaid-eligible children and elevated blood lead levels. Most recently, they have reported that 83% of children with EBLL are Medicaid-eligible children. MDCH CLPPP continues close monitoring of the numbers of children enrolled in Medicaid who are tested for EBLL. The schedule for the required testing (see Statewide Screening/Testing Plan) has been distributed to Medicaid providers and other providers of pediatric care on several occasions, and continues to be a part of the communication with them. A January 1, 2003 Medicaid bulletin, signed by Mr. Haveman on his last day in his position as Director of the Department of Community Health, requires local health departments which test children=s blood lead level at other childhood health visits (WIC, immunizations) to bill the child=s qualified health plan for the testing rather than bill Medicaid. It remains to be seen what this policy change will do to testing rates and to the willingness/ability of local public health agencies to participate in testing. A ZIP code (the geographical unit used in this year=s data collection) is called >high risk= if in 2001 there was a 12% or greater incidence of lead poisoning among children aged 12 to 36 months; or when a combination of percentage of pre-1950 housing, number of children less than six years of age and percentage of children less than six years of age living in poverty ranks high; or 27% or greater pre-1950 housing. MDCH CLPPP in this year (2002) has begun the shift to a screening/testing plan that designates high-risk areas by census tracts. It is anticipated that the accuracy added will target testing as well as primary prevention activities and resources even more acutely. Statewide, the level of cooperation with testing recommendations and requirements by health providers continues to be a challenge. In 2002, the City of Detroit continued their remarkable improvement in testing numbers. During this year, 32,540 (35%) of children less than six years of age (total number of children less than six years of age: 93,365) received testing and 2,830 (8.9%) had blood lead levels of 10 ug/dl or greater. With 56% pre-1950 housing in the city, it can be predicted that a large portion of lead-poisoned Michigan children will be found in this and other older, urban areas (Flint, Saginaw, Kalamazoo, Battle Creek, Benton Harbor, Pontiac). Detroit children represented 70% of lead-poisoned children, statewide. It can be seen in the Childhood Lead Poisoning Data Fact sheet for all Michigan counties, however, that only 11% of children less than six years of age were tested, in spite of Medicaid requirements and MDCH recommendations; consequently, MDCH CLPPP estimates that there are as many as 16,000 lead-poisoned children who remain unidentified. During 2002, MDCH CLPPP: $ Saw another year of increased numbers of children tested (2001: 87,875; 2002:92,767). $ Observed a 20% decrease in number of children with EBLL (2001: 4771; 2002: 4083); percent with EBL is 4.4%, which is still greater than the U.S. average. 2
50 $ Using demographic data collected with each blood lead test, assisted local health departments (LHDs) in measuring progress toward the lead program objectives: 1) total number of children tested; 2) number of children less than 36 months of age who were tested; 3) number of children in high risk ZIP codes tested; 4) number of children with elevated capillary test results subsequently confirmed with venous sampling; 5) percentage of premises receiving timely inspections for lead hazard identification; 6) percentage of open cases receiving hazard inspections; 7) percentage of premises where at least one lead hazard control was performed; 8) percentage of cases in which public health nurses (PHNs) made home visits to the family with a lead poisoned child; and 9) percentage of children with EBLLs that have declined. All of these items were tracked and calculated, using data collected with each blood lead test and stored in the lead surveillance database. $ In cooperation with the Lead Hazard Remediation Program (LHRP) presented four to six-hour training sessions at multiple locations; the session is designed for both professional and general audiences. It includes power-point presentations, four different speakers, and has been well received by participants. It offers continuing education units for nursing re-licensure. $ Provided specimen collection training sessions statewide for laboratory personnel and others who collect blood lead specimens in order to maintain high quality specimens. $ Networked with, supported and encouraged community-based lead programs (AGet the Lead Out!@ in Grand Rapids, Detroit Lead Partnership). $ Supported Detroit production of the play Jimmy s Getting Better, a one-act play dramatizing the roadblocks to resolution of multiple problems experienced by families with lead-poisoned children. It was performed several times in southeast Michigan. $ Assisted in the development of child-centered lead awareness issue papers and questions for candidates for public office in both local and statewide political races. $ CLPPP data analyst participated in development of childhood lead component of a Data Warehouse; participation will make it possible for us to determine the rates of testing and elevated blood lead levels among Medicaid-eligible children. $ Began the process of evolving our testing recommendations, geographical areas of risk, and primary prevention activities from the larger less specific ZIP code areas to the smaller more specific census tract and block group identification. $ Provided many standard as well as specialized reports for various audiences, displaying and comparing data from the CLPPP surveillance database. $ MDCH CLPPP has continued quarterly CLPPP Advisory Committee and Subcommittee meetings at the Department, with quarterly meetings of the subgrantees scheduled on the same day. $ Site visits were made to all nine subgrantees during the year. $ Michigan CLPPP has continued its focus on eliminating childhood lead poisoning in our state by In 2003, the CLPPP will write a new competitive grant proposal for submission to CDC that is responsive to the Center=s goals for their grantees. 3
51 %Pre-1950 Housing* Children Ages 1 & 2* Table 1. CHILDHOOD LEAD POISONING DATA FACTS -- ALL MICHIGAN COUNTIES Children Ages One & Two - Calendar Year 2002 Children Ages 1 & 2, Tested for Lead Number of Children Tested Children w/elevated blood lead (EBL) Number of Children w/ebl ug/dl ug/dl 20+ ug/dl Children w/elevated capillary tests, not confirmed by venous %Pre-1950 Housing* Children Ages 1 & 2* Children Ages 1 & 2, Tested for Lead Number of Children Tested Children w/elevated blood lead (EBL) Number of Children w/ebl ug/dl ug/dl 20+ ug/dl Children w/elevated capillary tests, not confirmed by venous County % Tested % EBL** County % Tested % EBL** Alcona 21% % 0 0.0% Lake 15% % 2 3.4% Alger 33% % 0 0.0% Lapeer 22% 2, % 1 1.2% Allegan 27% 2, % 2 0.7% Leelanau 22% % 0 0.0% Alpena 29% % 1 0.8% Lenawee 39% 2, % 9 3.3% Antrim 23% % 0 0.0% Livingston 14% 2, % 1 1.4% Arenac 21% % 0 0.0% Luce 30% % 1 1.8% Baraga 35% % 0 0.0% Mackinac 28% % 0 0.0% Barry 29% 1, % 1 0.2% Macomb 11% 20,271 2,274 11% % Bay 37% 2, % 4 0.9% Manistee 36% % 1 2.3% Benzie 27% % 0 0.0% Marquette 33% 1, % 0 0.0% Berrien 33% 4, % % Mason 31% % 1 2.9% Branch 37% 1, % 1 1.7% Mecosta 22% % 1 0.6% Calhoun 36% 3, % % Menominee 38% % 2 0.9% Cass 30% 1, % 0 0.0% Midland 17% 2, % 2 1.5% Charlevoix 26% % 0 0.0% Missaukee 21% % 0 0.0% Cheboygan 22% % 0 0.0% Monroe 28% 3, % 3 0.5% Chippewa 28% % 1 0.5% Montcalm 28% 1, % 3 1.3% Clare 13% % 0 0.0% Montmorency 18% % 0 0.0% Clinton 29% 1, % 1 1.0% Muskegon 30% 4,670 1,116 24% % Crawford 20% % 0 0.0% Newaygo 23% 1, % 2 0.8% Delta 38% % 3 0.9% Oakland 16% 31,861 3,216 10% % Dickinson 42% % 0 0.0% Oceana 27% % 1 0.7% Eaton 23% 2, % 3 0.4% Ogemaw 18% % 1 1.6% Emmet 28% % 0 0.0% Ontonagon 43% % 0 0.0% Genesee 23% 12,624 1,739 14% % Osceola 24% % 1 1.3% Gladwin 14% % 1 2.6% Oscoda 18% % 0 0.0% Gogebic 54% % 0 0.0% Otsego 13% % 0 0.0% Grand Trav 18% 1, % 0 0.0% Ottawa 18% 7, % 7 1.0% Gratiot 40% 1, % 0 0.0% Presque Isle 28% % 0 0.0% Hillsdale 39% 1, % 1 0.6% Roscommon 16% % 0 0.0% Houghton 55% % 0 0.0% Saginaw 29% 5, % % Huron 33% % 0 0.0% St Clair 30% 4, % 4 1.3% Ingham 26% 7,137 1,296 18% % St Joseph 35% 1, % % Ionia 38% 1, % 6 1.9% Sanilac 35% 1, % 2 2.7% Iosco 20% % 0 0.0% Schoolcraft 33% % 0 0.0% Iron 44% % 0 0.0% Shiawassee 36% 1, % 3 1.5% Isabella 19% 1, % 0 0.0% Tuscola 33% 1, % 0 0.0% Jackson 36% 4, % 7 4.3% Van Buren 29% 2, % 5 1.9% Kalamazoo 25% 6, % % Washtenaw 19% 8, % 2 0.4% Kalkaska 15% % % Wayne ex Det 24% 30,284 3,792 13% % Kent 27% 17,768 6,441 36% % Wexford 26% % 1 2.7% Keweenaw 55% % 0 0.0% Detroit, City of 56% 30,307 14,385 47% 1, % * U.S. Census Bureau, Census 2000 MICHIGAN 27% 267,412 47,288 18% 2, % 1, ** %EBL is calculated as follows: Number of Children w/ebl divided by (Number of Children Tested minus Children w/elevated capillary tests, not confirmed by venous) Note: Counts of children tested and blood lead levels are reported from Michigan Department of Community Health, Childhood Lead Poisoning Prevention Project statewide database. Note: Column for "Children Tested" reflects capillary and venous blood tests. Columns for "Children w/elevated blood lead" reflect venous tests only. February 2003
52 %Pre-1950 Housing* Children Under Age 6* Table 2. CHILDHOOD LEAD POISONING DATA FACTS -- ALL MICHIGAN COUNTIES Children Younger than Age Six - Calendar Year 2002 Children < Age 6, Tested for Lead Children w/elevated blood lead (EBL) Number of Children Tested Number of Children w/ebl ug/dl ug/dl 20+ ug/dl Children w/elevated capillary tests, not confirmed by venous %Pre-1950 Housing* Children Under Age 6* Children < Age 6, Tested for Lead Number of Children Tested Children w/elevated blood lead (EBL) Number of Children w/ebl ug/dl ug/dl 20+ ug/dl Children w/elevated capillary tests, not confirmed by venous County % Tested % EBL** County % Tested % EBL** Alcona 21% % 0 0.0% Lake 15% % 5 4.8% Alger 33% % 0 0.0% Lapeer 22% 7, % 2 1.1% Allegan 27% 9, % 5 0.8% Leelanau 22% 1, % 0 0.0% Alpena 29% 2, % 0 0.0% Lenawee 39% 7, % % Antrim 23% 1, % 0 0.0% Livingston 14% 13, % 1 0.4% Arenac 21% 1, % 0 0.0% Luce 30% % 1 1.2% Baraga 35% % 0 0.0% Mackinac 28% % 0 0.0% Barry 29% 4, % 3 0.4% Macomb 11% 61,805 3,568 6% % Bay 37% 8, % 7 1.0% Manistee 36% 1, % 1 1.1% Benzie 27% 1, % 0 0.0% Marquette 33% 3, % 0 0.0% Berrien 33% 12,820 1,891 15% % Mason 31% 1, % 2 2.6% Branch 37% 3, % 4 3.6% Mecosta 22% 2, % 1 0.3% Calhoun 36% 10,945 1,295 12% % Menominee 38% 1, % 2 0.7% Cass 30% 3, % 4 1.3% Midland 17% 6, % 4 1.8% Charlevoix 26% 2, % 0 0.0% Missaukee 21% 1, % 0 0.0% Cheboygan 22% 1, % 0 0.0% Monroe 28% 11,757 1,141 10% 4 0.4% Chippewa 28% 2, % 1 0.3% Montcalm 28% 4, % 5 1.3% Clare 13% 2, % 1 0.6% Montmorency 18% % 0 0.0% Clinton 29% 5, % 2 1.0% Muskegon 30% 14,215 2,006 14% % Crawford 20% % 0 0.0% Newaygo 23% 4, % 4 0.9% Delta 38% 2, % 4 1.0% Oakland 16% 97,281 6,122 6% % Dickinson 42% 1, % 0 0.0% Oceana 27% 2, % 1 0.3% Eaton 23% 7,980 1,190 15% 3 0.3% Ogemaw 18% 1, % 1 0.8% Emmet 28% 2, % 0 0.0% Ontonagon 43% % 0 0.0% Genesee 23% 38,236 3,420 9% % Osceola 24% 1, % 4 2.8% Gladwin 14% 1, % 1 1.0% Oscoda 18% % 0 0.0% Gogebic 54% % 0 0.0% Otsego 13% 1, % 0 0.0% Grand Trav 18% 5, % 0 0.0% Ottawa 18% 21,940 1,066 5% 9 0.8% Gratiot 40% 3, % 0 0.0% Presque Isle 28% % 0 0.0% Hillsdale 39% 3, % 2 0.7% Roscommon 16% 1, % 0 0.0% Houghton 55% 2, % 0 0.0% Saginaw 29% 17,275 2,113 12% % Huron 33% 2, % 1 0.6% St Clair 30% 13, % 4 0.8% Ingham 26% 21,259 2,435 11% % St Joseph 35% 5, % % Ionia 38% 5, % 9 1.6% Sanilac 35% 3, % 3 1.6% Iosco 20% 1, % 0 0.0% Schoolcraft 33% % 0 0.0% Iron 44% % 0 0.0% Shiawassee 36% 5, % 3 0.6% Isabella 19% 3, % 0 0.0% Tuscola 33% 4, % 1 0.4% Jackson 36% 12, % % Van Buren 29% 6, % 7 1.2% Kalamazoo 25% 18,597 1,093 6% % Washtenaw 19% 24, % 4 0.5% Kalkaska 15% 1, % 1 1.9% Wayne ex Det 24% 92,253 7,874 9% % Kent 27% 53,436 9,807 18% % Wexford 26% 2, % 3 1.9% Keweenaw 55% % 0 0.0% Detroit, City of 56% 93,365 32,540 35% 2, % 1, * U.S. Census Bureau, Census 2000 MICHIGAN 27% 814,505 92,767 11% 4, % 2, ** %EBL is calculated as follows: Number of Children w/ebl divided by (Number of Children Tested minus Children w/elevated capillary tests, not confirmed by venous) Note: Counts of children tested and blood lead levels are reported from Michigan Department of Community Health, Childhood Lead Poisoning Prevention Project statewide database. February 2003 Note: Column for "Children Tested" reflects capillary and venous blood tests. Columns for "Children w/elevated blood lead" reflect venous tests only. DCH-0706

53
54
2001 Annual Report on Blood Lead Levels in Michigan
 2001 Annual Report on Blood Lead Levels in Michigan 2001 Annual Report on Blood Lead Levels in Michigan A Joint Report of Michigan State University Department of Medicine 117 West Fee Hall East Lansing,
Epidemiology of Asthma in Michigan Chapter 8: Hospitalization for Asthma
 Contributors: Elizabeth Wasilevich, PhD, MPH Sarah Lyon-Callo, MA, MS Marcus Wasilevich, PhD Introduction: Asthma hospitalizations are particularly useful in understanding the asthma burden for a population
Report Adult Blood Lead Epidemiology Surveillance (ABLES) Program
 Program") 2015-2016 Report Adult Blood Lead Epidemiology Surveillance (ABLES) Program January 15, 2018 2015-2016 Report Adult Blood Lead Epidemiology and Surveillance (ABLES) Program Michigan State University Department
2015-2016 Report Adult Blood Lead Epidemiology Surveillance (ABLES) Program January 15, 2018 2015-2016 Report Adult Blood Lead Epidemiology and Surveillance (ABLES) Program Michigan State University Department
Epidemiology of Asthma in Michigan Chapter 10: Asthma Mortality
 Chapter 1: Asthma Mortality Contributors: Elizabeth Wasilevich, PhD, MPH Sarah Lyon-Callo, MA, MS Kenneth Rosenman, MD Elizabeth Hanna, RN Marcus Wasilevich, PhD Introduction: Death due to asthma is a
Providers: How to Generate & Retrieve Adolescent AFIX Reports in Michigan
 This document provides general information on how to generate and retrieve adolescent AFIX reports using the Michigan Care Improvement Registry (MCIR). Specific questions about how to utilize the AFIX
Annual Report on Blood Lead Levels on Adults in Michigan. July 12, 2016
 2014 Annual Report on Blood Lead Levels on Adults in Michigan July 12, 2016 2014 Lead Annual Report 2014 ANNUAL REPORT Adult Blood Lead Epidemiology Surveillance (ABLES) Program TABLE OF CONTENTS Executive
Michigan Donated Dental Services (DDS) Program
 Program") Michigan Donated Dental Services (DDS) Program Fiscal Year 2015-2016 2 nd Quarter Report (1/1/16 3/31/16) Patient Impact Description FY 2015-2016 1 st Quarter Number of Patients Treated 97 111 Number of
Michigan Donated Dental Services (DDS) Program Fiscal Year 2015-2016 2 nd Quarter Report (1/1/16 3/31/16) Patient Impact Description FY 2015-2016 1 st Quarter Number of Patients Treated 97 111 Number of
Oral health is intricately linked to overall
 Maintaining Oral Health is Crucial for Child Well-Being Oral health is intricately linked to overall physical health. Poor oral health affects diet and nutrition by making it difficult to bite, chew or
Annual Report on Blood Lead Levels Among Adults in Michigan
 2000 Annual Report on Blood Lead Levels Among Adults in Michigan Table 1. Distribution of Highest Blood Lead Levels (BLLs) Among Adults Reported During 2000 BLLs (µg/dl) Number Percent
2012 Rankings Michigan
 2012 Rankings Michigan Introduction Where we live matters to our health. The health of a community depends on many different factors, including the environment, education and jobs, access to and quality
United States: 10.4%
 Policy Options for Enhancing the Oral Health Workforce James J. Crall, DDS, ScD Professor & Chair, Public Health & Community Dentistry UCLA School of Dentistry 2011 NCSL Legislative Summit San Antonio,
Check-Up on Oral Health A Call to Action
 Check-Up on Oral Health A Call to Action 2015 WHY ORAL HEALTH MATTERS Oral diseases affect what we eat, how we look, the way we communicate, and how we feel about ourselves. They can also affect academic
2015 County Health Rankings. Michigan
 2015 County Health Rankings Michigan INTRODUCTION The County Health Rankings & Roadmaps program helps communities identify and implement solutions that make it easier for people to be healthy in their
MCIR Web Guide. Updated September
 MCIR Web Guide Updated September 2012 www.mcir.org Contents User ID and Password/Single Sign On 2 Searching for a Person in MCIR 3 Person Found/Not Found. 3 Adding a Person. 6 Adding Immunizations.. 7
2006 Annual Report on Blood Lead Levels on Adults and Children in Michigan
 2006 Annual Report on Blood Lead Levels on Adults and Children in Michigan 2006 Annual Report on Blood Lead Levels in Adults and Children in Michigan A Joint Report of Michigan State University Department
Asthma Utilization among Children in Michigan Medicaid Programs
 Asthma Utilization among Children in Michigan Medicaid Programs 2005-2010 May 2012 update Why Medicaid data? High risk population important for MDCH activities Complete utilization data for individual
Oral Health Directory
 Oral Health Directory This directory was prepared to assist in the development and expansion of oral health programs in Michigan. There is a wealth of experience across the state and through sharing, many
Building a World Class Cancer Center at Henry Ford: Cancer Surgery
 Building a World Class Cancer Center at Henry Ford: Cancer Surgery Steven N. Kalkanis MD Henry Ford Medical Group Jubilee Reunion October 9, 2015 Surgical Oncology plays a leading role in our Out-State
*P roject S E.N.S.O.R.
 *P roject S E.N.S.O.R. Volume 10, No. 3 Summer 1999 Highlights from the 1998 Annual Reports on Occupational Diseases in Michigan Five annual reports were released this Spring: Occupational Noise-Induced
Colorectal Cancer Screening in Michigan: Medicare Data Mapping & Coverage Information
 Colorectal Cancer Screening in Michigan: Medicare Data Mapping & Coverage Information Angela Vanker, MPH Elizabeth Venettis, MPH 22670 Haggerty Road, Suite 100, Farmington Hills, MI 48335 www.mpro.org
Annual Report on Work-Related Asthma in Michigan
 2005 Annual Report on Work-Related Asthma in Michigan 2005 Annual Report on Work-Related Asthma in Michigan A Joint Report of the Michigan State University Department of Medicine 117 West Fee Hall East
1997 Annual Report on Work-Related Asthma in Michigan
 1997 Annual Report on Work-Related Asthma in Michigan A Joint Report of the Michigan State University Department of Medicine 117 West Fee Hall East Lansing, Michigan 48824-1316 (517) 353-1846 Kenneth D.
MARCH 10, ANNUAL REPORT TRACKING SILICOSIS & OTHER WORK-RELATED LUNG DISEASES IN MICHIGAN
 MARCH 10, 2015 2013 ANNUAL REPORT TRACKING SILICOSIS & OTHER WORK-RELATED LUNG DISEASES IN MICHIGAN 2013 Annual Report Tracking Silicosis & Other Work-Related Lung Diseases in Michigan March 10, 2015 TRACKING
Managed DentalGuard Family Plan For Plan Years Beginning in 2016
 Guardian s DHMO Plan The Guardian DentalGuard DHMO plans allow you to choose to receive care from any participating licensed dentist in the network, and pay a set co-pay for your office visit. Under this
The Michigan Child Collaborative Care Program (MC3): Telepsychiatry for Children of Rural Michigan. Why Rural Michigan?
: Telepsychiatry for Children of Rural Michigan. Why Rural Michigan?") The Michigan Child Collaborative Care Program (MC3): Telepsychiatry for Children of Rural Michigan Dayna LePlatte MD Sheila Marcus MD Why Rural Michigan? 1 Up to 20% of children have a mental health disorder
The Michigan Child Collaborative Care Program (MC3): Telepsychiatry for Children of Rural Michigan Dayna LePlatte MD Sheila Marcus MD Why Rural Michigan? 1 Up to 20% of children have a mental health disorder
Characterization of Lower Blood Lead Levels Reported for New Hampshire Adults from
 University of New Hampshire University of New Hampshire Scholars' Repository Institute on Disability College of Health & Human Services (CHHS) 2-1-2016 Characterization of Lower Blood Lead Levels Reported
2002 Annual Report on Occupational Noise-Induced Hearing Loss in Michigan
 2002 Annual Report on Occupational Noise-Induced Hearing Loss in Michigan 2002 Annual Report on Occupational Noise Induced Hearing Loss in Michigan A Joint Report of the Michigan State University Department
Michigan s Communicable Disease Rules
 Michigan s Communicable Disease Rules Michigan s communicable disease rules are promulgated under the authority conferred on the Department of Community Health by section 5111 of Act No. 368 of the Public
Annual Report on Silicosis in Michigan
 1998 Annual Report on Silicosis in Michigan 1998 Annual Report on Silicosis in Michigan A Joint Report of the Michigan State University Department of Medicine 117 West Fee Hall East Lansing, Michigan 48824-1316
AUGUST 14TH, ANNUAL REPORT TRACKING SILICOSIS & OTHER WORK-RELATED LUNG DISEASES IN MICHIGAN
 AUGUST 14TH, 2013 2011 ANNUAL REPORT TRACKING SILICOSIS & OTHER WORK-RELATED LUNG DISEASES IN MICHIGAN 2011 Annual Report Tracking Silicosis & Other Work-Related Lung Diseases in Michigan August 14th,
Acknowledgements LOGOS
 Acknowledgements LOGOS L. BROOKS PATTERSON, OAKLAND COUNTY EXECUTIVE Kathleen Forzley, R.S., M.P.A., Manager HEALTH DIVISION Dear Community Member, On behalf of Health Division, I am pleased to provide
THE EPIDEMIOLOGY OF HEPATITIS B AND C CO-INFECTION AMONG HIV INFECTED INDIVIDUALS IN MICHIGAN. Zahid Ahmad Butt
 THE EPIDEMIOLOGY OF HEPATITIS B AND C CO-INFECTION AMONG HIV INFECTED INDIVIDUALS IN MICHIGAN By Zahid Ahmad Butt A DISSERTATION Submitted to Michigan State University in partial fulfillment of the requirements
UPDATES FOR MMDHD JENNIFER MORSE, MD 1/24/18
 UPDATES FOR MMDHD JENNIFER MORSE, MD 1/24/18 HEPATITIS A WHAT IS HEPATITIS A? Virus that causes liver disease (hepatitis) Spreads in feces (stool) (UNLIKE hepatitis B and C that are spread in blood) Contaminated
ALCONA COUNTY County Seat: Harrisville. ALPENA-ALCONA COUNTY County Seat: Alpena. ALGER COUNTY County Seat: Munising
 ALCONA COUNTY County Seat: Harrisville Refer to Alpena County Tuesdays 9:00 am 4:00 pm Art Winter 106 North 5 th St. P.O. Box 308 Harrisville, MI 48740 (989) 724-9510 Fax: (989) 724-9514 E-mail: awinter247@chartermi.net
Annual Report on Silicosis in Michigan
 1999 Annual Report on Silicosis in Michigan 1999 Annual Report on Silicosis in Michigan A Joint Report of the Michigan State University Department of Medicine 117 West Fee Hall East Lansing, Michigan 48824-1316
Blue Cross Complete of Michigan Annual Report A YEAR OF GROWTH
 Blue Cross Complete of Michigan 2016 Annual Report A YEAR OF GROWTH Table of Contents A message from our market president Introduction with regional coverage map, membership mix and enrollment State and
Pesticide Illness and Injury Surveillance in Michigan December 2009 Division of Environmental Health Michigan Department of Community Health
 Pesticide Illness and Injury Surveillance in Michigan 2008 December 2009 Division of Environmental Health Michigan Department of Community Health Pesticide Illness and Injury Surveillance in Michigan:
Health & Community Services Department. Promoting Health For All. The STD Problem in Kalamazoo County: Status Update
 Health & Community Services Department The STD Problem in Kalamazoo County: Status Update March 3, 2016 STD Incidence Rates per 100,000 (2015 End of Year) Chlamydia Gonorrhea Michigan 485 112 Region 5
MARYLAND DEPARTMENT OF THE ENVIRONMENT
 MARYLAND DEPARTMENT OF THE ENVIRONMENT Lead Poisoning Prevention Program Childhood Blood Lead Surveillance in Maryland Annual Report 2016 July 2017 MARYLAND CHILDHOOD LEAD REGISTRY ANNUAL SURVEILLANCE
MARYLAND DEPARTMENT OF THE ENVIRONMENT
 Lead Poisoning Prevention Program Childhood Blood Lead Surveillance in Maryland Annual Report 2016 July 2017 MARYLAND CHILDHOOD LEAD REGISTRY ANNUAL SURVEILLANCE REPORT 2016 Executive Summary The Maryland
2003 Annual Report on Occupational Noise-Induced Hearing Loss in Michigan
 2003 Annual Report on Occupational Noise-Induced Hearing Loss in Michigan 2003 Annual Report on Occupational Noise Induced Hearing Loss in Michigan A Joint Report of the Michigan State University Department
Building Bridges Connecting Communities
 Building Bridges Connecting Communities FROM THE DIRECTOR It is with great pride and accomplishment that I present to you the Community Health Services (CHS) Annual Report. This report highlights many
A shared mission of care and engagement
 A shared mission of care and engagement 2017 annual report Table of contents A message from the President and CEO... 1 A message from the Market President... 2 Solid relationships, steady progress... 4
HIGHLIGHTS FROM THE 1997 ANNUAL REPORTS ON OCCUPATIONAL DISEASES IN MICHIGAN
 HIGHLIGHTS FROM THE 1997 ANNUAL REPORTS ON OCCUPATIONAL DISEASES IN MICHIGAN Four annual reports were released this Spring: Occupational Noise-Induced Hearing Loss; Silicosis; WorkRelated Asthma; and Occupational
Pesticide Illness and Injury Surveillance in Michigan December 2010 Division of Environmental Health Michigan Department of Community Health
 Pesticide Illness and Injury Surveillance in Michigan 2009 December 2010 Division of Environmental Health Michigan Department of Community Health Pesticide Illness and Injury Surveillance in Michigan:
Heavy Metals Surveillance in Michigan Residents: Second Annual Report (January 2007 December 2007) MICHIGAN STATE U N I V E R S I T Y
 MICHIGAN STATE U N I V E R S I T Y") Heavy Metals Surveillance in Michigan Residents: Second Annual Report (January 2007 December 2007) MICHIGAN STATE U N I V E R S I T Y Department of Medicine 117 West Fee Hall East Lansing, MI 48823 and
Heavy Metals Surveillance in Michigan Residents: Second Annual Report (January 2007 December 2007) MICHIGAN STATE U N I V E R S I T Y Department of Medicine 117 West Fee Hall East Lansing, MI 48823 and
New Health Dangers from Lead
 WORKPLACE HAZARD ALERT New Health Dangers from Lead Levels of lead once thought harmless now shown to be toxic If you work with lead you need to: k Find out how much lead is in your blood. k Talk to your
ROOM project Addressing the Opioid Epidemic in the U.P. Presented by; Kevin L. Piggott, MD, MPH May 21, 2018
 ROOM project Addressing the Opioid Epidemic in the U.P. Presented by; Kevin L. Piggott, MD, MPH May 21, 2018 REDUCING OPIOID OVERDOSE IN MARQUETTE COUNT Y (ROOM) Funding provided by the CDC to the Michigan
ABSTRACT. To continue the local emphasis program (LEP) to reduce workplace health and safety hazards associated with auto body shops.
 to reduce workplace health and safety hazards associated with auto body shops.") U.S. DEPARTMENT OF LABOR Occupational Safety and Health Administration DIRECTIVE NUMBER: CPL 2-06-11C EFFECTIVE DATE: October 1, 2011 SUBJECT: Local Emphasis Program (LEP) for Auto Body Shops REGIONAL
U.S. DEPARTMENT OF LABOR Occupational Safety and Health Administration DIRECTIVE NUMBER: CPL 2-06-11C EFFECTIVE DATE: October 1, 2011 SUBJECT: Local Emphasis Program (LEP) for Auto Body Shops REGIONAL
2016 Annual Report Tracking work-related asthma in michigan
 DECEMBER 18, 2018 2016 Annual Report Tracking work-related asthma in michigan 2016 Annual Report Tracking Work-Related Asthma in Michigan December 18, 2018 2016 ANNUAL REPORT TRACKING WORK-RELATED ASTHMA
2016 Pharmacy Directory
 2016 Pharmacy Directory This pharmacy directory was updated on 10/1/2015. For more recent information or other questions, please contact McLaren Advantage at (888) 327-0671 or, for TTY users, 711, Monday
Epidemiology of Asthma. In the Western Michigan Counties of. Kent, Montcalm, Muskegon, Newaygo, and Ottawa
 Epidemiology of Asthma In the Western Michigan Counties of Kent, Montcalm, Muskegon, Newaygo, and Ottawa Elizabeth Wasilevich, MPH Asthma Epidemiologist Bureau of Epidemiology Michigan Department of Community
GUIDELINES TO DETERMINE THE EXISTENCE OF AN AUTISM SPECTRUM DISORDER (ASD)
") GUIDELINES TO DETERMINE THE EXISTENCE OF AN AUTISM SPECTRUM DISORDER (ASD) 2016 ACKNOWLEDGEMENTS This document reflects the effort of many professional staff members within the Livingston Educational
GUIDELINES TO DETERMINE THE EXISTENCE OF AN AUTISM SPECTRUM DISORDER (ASD) 2016 ACKNOWLEDGEMENTS This document reflects the effort of many professional staff members within the Livingston Educational
Lead in Construction (And Other Heavy Metals In Paint) Cadmium Chromium
 Cadmium Chromium") Lead Training Lead in Construction (And Other Heavy Metals In Paint) Cadmium Chromium Where Will You See It in Construction? Primarily during paint disturbance Potentially all the trades exposed 58,000
Lead Training Lead in Construction (And Other Heavy Metals In Paint) Cadmium Chromium Where Will You See It in Construction? Primarily during paint disturbance Potentially all the trades exposed 58,000
Hearing Impairment Programs Survey
 Audience: Michigan Special Education Directors Date of Survey: 12-29-11 Responses Received: 29/57 s completed the Survey Survey Questions: Hearing Impairment Programs Survey 1 Deaf and Hard of Hearing
LEAD SAFETY PROGRAM. Purpose. Scope. Responsibilities. Southern Heat Exchanger Services Safety Program
 Page: Page 1 of 5 Purpose The purpose of this procedure is to identify the controls and actions necessary to prevent adverse health effects to employees from occupational exposure to lead, and to ensure
Department of the Environment. Annual Report Lead Poisoning Prevention Program
 Department of the Environment Childhood Blood Lead Surveillance in Maryland Annual Report 2011 Lead Poisoning Prevention Program MARYLAND DEPARTMENT OF THE ENVIRONMENT 1800 Washington Boulevard Baltimore,
"WORKING WITH LEAD EXPOSURE IN CONSTRUCTION ENVIRONMENTS"
 MAJOR PROGRAM POINT "WORKING WITH LEAD EXPOSURE IN CONSTRUCTION ENVIRONMENTS" Part of the "CONSTRUCTION SAFETY KIT" Series "Quality Safety and Health Products, for Today...and Tomorrow" OUTLINE OF MAJOR
"LEAD EXPOSURE IN GENERAL INDUSTRY"
 PRESENTER'S GUIDE "LEAD EXPOSURE IN GENERAL INDUSTRY" Training For THE OSHA LEAD STANDARD Quality Safety and Health Products, for Today... and Tomorrow OUTLINE OF MAJOR PROGRAM POINTS OUTLINE OF MAJOR
Title: Public Health Reporting and National Notification for Elevated Blood Lead Levels
 09-OH-02 Submission Date: Committee: Occupational and Environmental Health Title: Public Health Reporting and National Notification for Elevated Blood Lead Levels I. Statement of the Problem CSTE position
Dental Directory Treating Vulnerable Elderly Patients
 Dental Directory Treating Vulnerable Elderly Patients *This Resource Book is provided for information purposes only and does not guarantee treatment. Please contact the dentists and dental hygienists directly
Highlights from the 1996 Annual Reports on Occupational Diseases in Michigan
 Highlights from the 1996 Annual Reports on Occupational Diseases in Michigan Four annual reports were released this summer: Occupational Noise-Induced Hearing Loss, Silicosis, Occupational Asthma, and
Now Hear This... Noise, Hearing Impairment and Work-Related Trauma. Volume 3, No. 3 Fall A New Initiative in Michigan
 Now Hear This... Volume 3, No. 3 Fall 2000 Noise, Hearing Impairment and Work-Related Trauma A New Initiative in Michigan Recently, researchers in the Department of Medicine at Michigan State University
MARYLAND DEPARTMENT OF THE ENVIRONMENT
 Lead Poisoning Prevention Program Childhood Blood Lead Surveillance in Maryland Annual Report 2009 August, 2010 MARYLAND CHILDHOOD LEAD REGISTRY ANNUAL SURVEILLANCE REPORT 2009 EXECUTIVE SUMMARY The Maryland
2006 Annual Report on Asthma Deaths Among Individuals Ages 2-34 and in Michigan
 2006 Annual Report on Asthma Deaths Among Individuals Ages 2-34 and 45-54 in Michigan An African American preteen was on his way home from a friend s house when he collapsed. His brothers carried him home
2007 Annual Report on Silicosis in Michigan
 2007 Annual Report on Silicosis in Michigan 2007 Annual Report on Silicosis in Michigan A Joint Report of the Michigan State University Department of Medicine 117 West Fee Hall East Lansing, Michigan 48824-1315
Operations Council Committee Report
 Operations Council Committee Report Smoking Policy Committee Committee Members: Tim Seguin Kathleen Fox Karen Schoen Susan Bozzer Bryan Bame Cyndi Parrelly 1 Council Charge Last fiscal year (FY16), the
CHILDHOOD LEAD POISONING
 CHILDHOOD LEAD POISONING Lead is a toxic substance and lead poisoning in children under six years of age is associated with reduced learning ability and poor school performance in later years, and other
Recovery-Oriented Services Benchmarking Report Northcare Network Consumer Survey October 2017
 Recovery-Oriented Services Benchmarking Report Northcare Network Survey October 2017 OVERVIEW: As part of Northcare s participation in the ROSE study, consumers completed the Recovery Self-Assessment (RSA),
LEAD PAINT AWARENESS FOR THE DIVISION OF OPERATIONS AND FACILITIES. February 23 & 24, 2010
 LEAD PAINT AWARENESS FOR THE DIVISION OF OPERATIONS AND FACILITIES February 23 & 24, 2010 In New Jersey: The only acceptable ways to determine if paint is Lead is to test it by: X-Ray Florescence
OPTIVIEWS. REGISTER for CONVENTION p22. Serving M O R E Youth In Our Communities VOL 39, 4 - JULY AUGUST SEPTEMBER Governor Corner p1
 VOL 39, 4 - JULY AUGUST SEPTEMBER 2018 OPTIVIEWS Serving M O R E Youth In Our Communities Governor Corner p1 Secretary-Treasurer p2 Governor-Elect p2 Hall of Fame p2 OI Foundation p3 Junior Optimist p3
Q & A SILICA - THE PROBLEM THAT WON T GO AWAY.
 Silica - the Problem that Won t Go Away! Is Silicosis Serious? Is Silicosis Still a Problem in the 2000's? How Can Silicosis Be Prevented? Why Should Your Company Worry About Silicosis? What is Air Sampling?
Department of the Environment. Annual Report Lead Poisoning Prevention Program
 Department of the Environment Childhood Blood Lead Surveillance in Maryland Annual Report 2012 Lead Poisoning Prevention Program MARYLAND DEPARTMENT OF THE ENVIRONMENT 1800 Washington Boulevard Baltimore,
Brief Update on Cancer Occurrence in East Metro Communities
 Brief Update on Cancer Occurrence in East Metro Communities FEBRUARY, 2018 Brief Update on Cancer Occurrence in East Metro Communities Minnesota Department of Health Minnesota Cancer Reporting System PO
Mahoning County Public Health. Epidemiology Response Annex
 Mahoning County Public Health Epidemiology Response Annex Created: May 2006 Updated: February 2015 Mahoning County Public Health Epidemiology Response Annex Table of Contents Epidemiology Response Document
Childhood Lead Poisoning Prevention
 Childhood Lead Poisoning Prevention Children s Environmental Health Training August 2, 2011 Lauren Jenks, MPH, CHES 1 Topics we will cover today Context of Lead Poisoning in Washington Emerging Issues
Objectives. Health Effects and Medical Treatment of Lead Poisoning. Case 1. Case 1. Lead Levels and Symptoms. Hand-to-Mouth Behavior 12/10/2012
 Objectives Health Effects and Medical Treatment of Lead Poisoning David Eldridge, MD Associate Professor Department of Pediatrics Brody School of Medicine at East Carolina University December 11, 2012
Public Health Brief March
 Public Health Brief March 27, 2013 Updated Guidelines for Childhood Blood Lead Testing Michele Kinshella, MS, CIH Donna Hite, Disease Intervention Specialist Based on a number of studies that blood lead
What s New. Don t Forget! There are 2 different influenza vaccines available. Flu Vaccine. Michigan Newsletter Fall 2009
 What s New Michigan Newsletter Fall 2009 Flu Vaccine Don t Forget! There are 2 different influenza vaccines available this year (one for seasonal flu and one for Novel H1N1 or swine flu). Both vaccines
INGHAM COUNTY. Effective January 1, 2016 as amended November 10, 2015
 INGHAM COUNTY REGULATION TO REQUIRE A LICENSE FOR THE RETAIL SALE OF ELECTROINC SMOKING DEVICES, PROHIBIT SALE OF ELECTROINC SMOKING DEVICESTO MINORS, AND TO RESTRICT LOCATION OF ELECTROINC SMOKING DEVICES
MARYLAND DEPARTMENT OF THE ENVIRONMENT
 MARYLAND DEPARTMENT OF THE ENVIRONMENT Lead Poisoning Prevention Division Childhood Blood Lead Surveillance in Maryland 1998 Annual Report January, 2000 1 MARYLAND CHILDHOOD LEAD REGISTRY 1998 ANNUAL REPORT
NOISE LEVELS IN CONSTRUCTION INDUSTRY UNREGULATED
 Volume 1, No. 3 Fall 1998 NOISE LEVELS IN CONSTRUCTION INDUSTRY UNREGULATED The National Hearing Conservation Association reports that 15-20 million workers employed in unregulated industries, in particular
Full Plate PRESS IN THIS ISSUE. Donor Snapshot, the Salls PAGE 2. Take a Stand this September PAGE 2. Local Farmers are feeding West Michigan PAGE 3
 Full Plate PRESS THE NEWSLETTER OF 2017 Fall Newsletter & 2016 Annual Report IN THIS ISSUE NEWSLETTER Take a Stand this September PAGE 2 Westminster s Pantry Provides Food, Purpose PAGE 4 ANNUAL REPORT
childhood lead Poisoning Prevention
 Child care provider training childhood lead Poisoning Prevention Childhood Lead Poisoning Prevention Branch / California childcare health program Introductions Name Job Family Day Care or Center? 2 Training
Health Consultation SUMMARY SEPTEMBER 30, 2008
 Health Consultation ANALYSIS OF LUNG CANCER INCIDENCE NEAR CHROMIUM-CONTAMINATED SITES IN NEW JERSEY (a/k/a Hudson County Chromium Sites) JERSEY CITY, HUDSON COUNTY, NEW JERSEY SUMMARY SEPTEMBER 30, 2008
January 25, Should you have any questions or concerns with the attached, please do not hesitate to contact me.
 124 West Allegan Street, Suite 1000 Lansing, Michigan 48933 T (517) 482-5800 F (517) 482-0887 www.fraserlawfirm.com Michael S. Ashton mashton@fraserlawfirm.com (517) 377-0875 January 25, 2018 Ms. Kavita
HIV Testing Survey, 2002
 Special Surveillance Report Number 5 HIV Testing Survey, 2002 DEPARTMENT OF HEALTH AND HUMAN SERVICES Public Health Service Centers for Disease Control and Prevention Atlanta, Georgia 30333 . The HIV/AIDS
Childhood Blood Lead Screening Guidelines
 Childhood Blood Lead Screening Guidelines Form Pb-120 START HERE Enrolled in Medicaid/ Texas Health Steps NO Determine if Child Resides in a Targeted Area: 1 Use the Zip Codes on pages 2-7 to determine
Tobacco Sales Compliance Regional Analysis
 ATTACHMENT 7 2012-2017 Tobacco Sales Regional Analysis LAKESHORE REGIONAL ENTITY BY REFOCUS, L.L.C. Tobacco Longitudinal Analysis, 2012-2017 The Lakeshore Regional Entity (LRE) manages Medicaid, Michigan
Lead: An Ongoing Threat to Children s Health
 Lead: An Ongoing Threat to Children s Health Jennifer D. Becker MPH Coordinator, Rochester Office Western NY Lead Poisoning Resource Center Topics of Discussion What is lead and where is it found? How
Background and Need for a Tobacco-Free Parks/Beaches Policy
 Background and Need for a Tobacco-Free Parks/Beaches Policy Background and Need for a Tobacco-Free Parks/Beaches Policy Tobacco use #1 cause of preventable death and disease Secondhand smoke (SHS) is a
Boston Public Health Commission Regulation Clean Air Works Workplace Smoking and E-Cigarette Use Restrictions. (As Amended on December 17, 2015)
") Boston Public Health Commission Regulation Clean Air Works Workplace Smoking and E-Cigarette Use Restrictions (As Amended on December 17, 2015) WHEREAS, Environmental Tobacco Smoke is a leading public
Boston Public Health Commission Regulation Clean Air Works Workplace Smoking and E-Cigarette Use Restrictions (As Amended on December 17, 2015) WHEREAS, Environmental Tobacco Smoke is a leading public
American Views on Stem Cell Research Summary of Survey Findings. Results for America
 March 2000 American Views on Stem Cell Research Summary of Survey Findings Prepared for: Results for America A Project of Civil Society Institute Prepared by OPINION RESEARCH CORPORATION February 15, 2005
FULTON COUNTY GOVERNMENT RYAN WHITE PART A PROGRAM. Atlanta Eligible Metropolitan Area HIV/AIDS Unmet Need Estimate
 FULTON COUNTY GOVERNMENT RYAN WHITE PART A PROGRAM Atlanta Eligible Metropolitan Area HIV/AIDS Unmet Need Estimate Southeast AIDS Training and Education Center Department of Family and Preventative Medicine
Culturally Competent Substance Abuse Treatment Project
 Culturally Competent Substance Abuse Treatment Project Final Report 2010 Kristin White, MA Program Evaluator Rebecca Clayton, BS Associate Director Stephan Arndt, PhD Director Iowa Consortium for Substance
REGULATORY IMPACT STATEMENT and COST-BENEFIT ANALYSIS (RISCBA)
") State Budget Office Office of Regulatory Reinvention 111 S. Capitol Avenue; 8th Floor, Romney Building Lansing, MI 48933 Phone: (517) 335-8658 FAX: (517) 335-9512 REGULATORY IMPACT STATEMENT and COST-BENEFIT
State Budget Office Office of Regulatory Reinvention 111 S. Capitol Avenue; 8th Floor, Romney Building Lansing, MI 48933 Phone: (517) 335-8658 FAX: (517) 335-9512 REGULATORY IMPACT STATEMENT and COST-BENEFIT
Epidemiology of Asthma. In Wayne County, Michigan
 Epidemiology of Asthma In Wayne County, Michigan Elizabeth Wasilevich, MPH Asthma Epidemiologist Bureau of Epidemiology Michigan Department of Community Health 517.335.8164 Publication Date: August 2005
2017 Cannabis Public Engagement Survey Report
 2017 Cannabis Public Engagement Survey Report Prepared by Yukon Bureau of Statistics for Health and Social Services Government of Yukon This report was prepared by Matthew Adaman and Rachel Westfall, Yukon
Doc No: LEAD Midland Engineering Co., Inc. Initial Issue Date 12/04/15 Safety Management System
 Revision Preparation: Safety Mgr Authority: President Issuing Dept: Safety Page: Page 1 of 17 POLICY To provide a hazard free workplace and have a Lead Protection Program to ensure the safety and health