Supplementary Figure 1. Microdialysis measurements of extracellular dopamine in ventral and dorsal striatum.
|
|
|
- Theodora Bond
- 6 years ago
- Views:
Transcription

1 Supplementary Figure 1 Microdialysis measurements of extracellular dopamine in ventral and dorsal striatum. A. Behavioural preparation. Mice are placed in an operant box where a spout containing the artificial sweetener sucralose is connected to a contact lickometer. Lick detection triggers an infusion pump that delivers either glucose or more sucralose into the stomach. Brain microdialysates were collected concomitantly to behavioural performance. B. Histological analyses of brain tissue obtained from the animals that performed the experiments described above. Representative cases for ventral (top) and dorsal (bottom) striatum are shown along with schematic representation of the location of microdialysis probes (VS in red and DS in blue). Data from the microdialysis sessions shown in Figure 1 were replotted to allow for direct comparison of the effects produced by the different stimuli within each striatal sector (in main Figure 1 comparisons were performed between sectors). As before blue stands for DS data and red for VS data. Baseline sampling was performed for 30 min prior to introduction of stimulus (green vertical arrows). C-
2 D. Mice licked sippers containing either sweet (sucralose) or bitter (sucralose + denatonium benzoate) solutions such that in both cases detected licks triggered D-glucose intra-gastric infusions. In C, VS levels were significantly higher during sweet (N=6) intake compared to bitter (N=8) intake (group effect F[1,10]=30.05, *p=0.0003) indicating that taste quality regulates dopamine efflux in VS. Comparisons against baseline levels (each condition involves Taste+Intra-gastric): Sweet+D-Glucose: two-way repeated-measures ANOVA F[9,36]=9.02 Bonferroni p=0.005; Bitter+D-Glucose: F[9,54]=4.45 Bonferroni p= In D, both sweet (N=6) and bitter (N=7) intake coupled to D-glucose intra-gastric infusions produced similar increases in dopamine release (group effect F[1,12]=0.03, p=0.86), suggesting that changes in dorsal dopamine levels respond to metabolic consequences. Comparisons against baseline levels: Sweet+D-Glucose F[9,45]=4.5 p=0.0029; Bitter+D-Glucose F[9,63]=4.6 Bonferroni p= E-F. Mice licked sucralosecontaining sippers such that detected licks triggered intra-gastric infusions of either D-glucose or L-glucose (the nonmetabolizable glucose enantiomer). In E, as expected, similar increases in VS dopamine levels were observed during both L-glucose (N=6) and D- glucose (N=5) sessions (group effect F[1,9]=0.24, p=0.88). Comparison against baseline levels: Sweet+L-Glucose F[9,45]=6.09 Bonferroni p= In F, DS dopamine levels were significantly higher during D-glucose (N=6) compared to L-glucose sessions (N=6, group effect F[1,10]=6.77, *p=0.027). Comparison against baseline levels: Sweet+L-Glucose F[9,45]=2.47 Bonferroni p= G. Correlation between dopamine release levels and corresponding lick counts during the equivalent sampling period. The data show that there was no relationship between lick counts and dopamine release levels in VS, ruling out thus the possibility that bitter-driven suppressions in licking may mediate decreased dopamine efflux (F[1,136]=3.7, p= ). H. Same analyses for DS (F[1,155]=0.49, p=0.48). I-J. Glucose or sucralose were intra-gastrically infused while animals remained in their home cages, i.e. outside any behavioral context. To mimic infusions observed during behavioral sessions, time stamps of infusions pump triggers were replayed during these sessions. The rasters indicate the time of an infusion of a 30μL bolus into the stomach. Glucose infusions produced significantly greater increases in both VS (N=5, interaction sampling time infusate F[14,56]=3.6, *p=0.0003, I) and DS (F[14,56]=5.5, *p= , J) compared to sucralose. These results show in particular that licks are not required for dopamine release during sugar intake, consistent with panels G-H above. In fact, and rather remarkably, sugar-induced dopamine effluxes in animals treated with passive infusions were statistically similar to those observed in animals exposed to the behavioral sessions: Glucose VS (N=5 both groups): group effect F[1,8]=0.8, p=0.39 Glucose DS (behavioral sessions N=6 and passive infusions N=5): group effect F[1,9]=0.02, p=0.89 Sucralose DS (behavioral sessions N=6 and passive infusions N=5): group effect F[1,9]=0.37, p=0.56. As anticipated, the only exception refers to when passive intra-gastric sucralose is compared to sucralose behavioral sessions (N=5 both groups, group effect F[1,8]=8.56, p=0.019). This is consistent with our assumption that VS dopamine efflux is stimulated by sweetness in the absence of energy intake. n.s. = non-statistically significant.

3 Supplementary Figure 2 Controls for non-specific effects produced by intra-gastric sugar administration. A. Behavioural preparation for measurements of dopamine release during sweet taste intake using microdialysis. Mice are placed in an operant box where a spout containing the artificial sweetener sucralose is connected to a contact lickometer. Lick detection triggers an infusion pump that delivers either glucose or more sucralose into the stomach. Brain microdialysates were collected concomitantly to behavioural performance. B. Dopamine measurements were performed in animals exposed to 14 consecutive days of exposure to sucralose licking associated with D-glucose infusions. Higher dorsal striatal dopamine levels were observed during sucralose licking upon intra-gastric infusions of glucose (glucose-exposed mice, N=6) compared to sucralose licking upon intra-gastric infusions of sucralose (sucralose-exposed mice, N=6, Two-way mixed model ANOVA, Sampling time group effect F[6,60]=3.2, *p=0.008). Graph displays changes in DA during the 1h intake session after 30min baseline sampling. Raster plot shows lick rates for each (sucralose vs. glucose) session. Onset of licking is shown by upward green arrow. DA = dopamine. When a direct comparison was performed between naïve and experienced animals, we found no statistical differences in terms of sugar- or sucralose-induced dopamine efflux between the two groups, as follows: Glucose-induced changes in DS DA in naïve vs. experienced groups (N=6 both groups): group effect F[1,10]=0.001, p=0.97. Sucralose-induced changes in DS DA in naïve vs. experienced groups (N=6 both groups): group effect F[1,10]=0.54, p=0.47. C. Open field tests reveal no effects of intra-gastric infusates on locomotor activity in a novel arena (number of crossings through the arena s subregions, N=5 in each group, two-sample t-test t[8]=1.34, p=0.21). D. Neither were detected differences in time spent within the illuminated central area of the arena (t[8]=1.74, p=0.12). E. Mice (N=10) were trained on a goaldirected task in which nose pokes on the active hole produce the delivery of palatable food pellets. Previous to testing on this task, animals were infused with an intra-gastric preload of either D-glucose or sucralose in a randomized within-subjects design. Mice learned reliably to poke the active vs. the inactive hole (F[1,9]=117.79, p= ). As anticipated, glucose preloads, when compared to sucralose preloads, significantly reduced the number of active pokes (F[1,9]=41.89, p= ). Post-hoc t-tests confirm that animals were significantly more active during this goal-directed task after sucralose compared to glucose preloads (Paired sample t-test, Pokes on active hole: t[9]=6.4, p=0.0001; Pokes on inactive hole: t[9]=3.3, p=0.009). F. However, overall preferences for the active vs. inactive hole were not affected by the content of the preload (paired-sample t-test, t[9]=0.37, p=0.71). G. As a consequence of greater activity after sucralose compared to glucose preloads, number of rewards obtained were greater in the former compared to the latter case (t[9]=9.0, p= ). TD=Training Day.
4
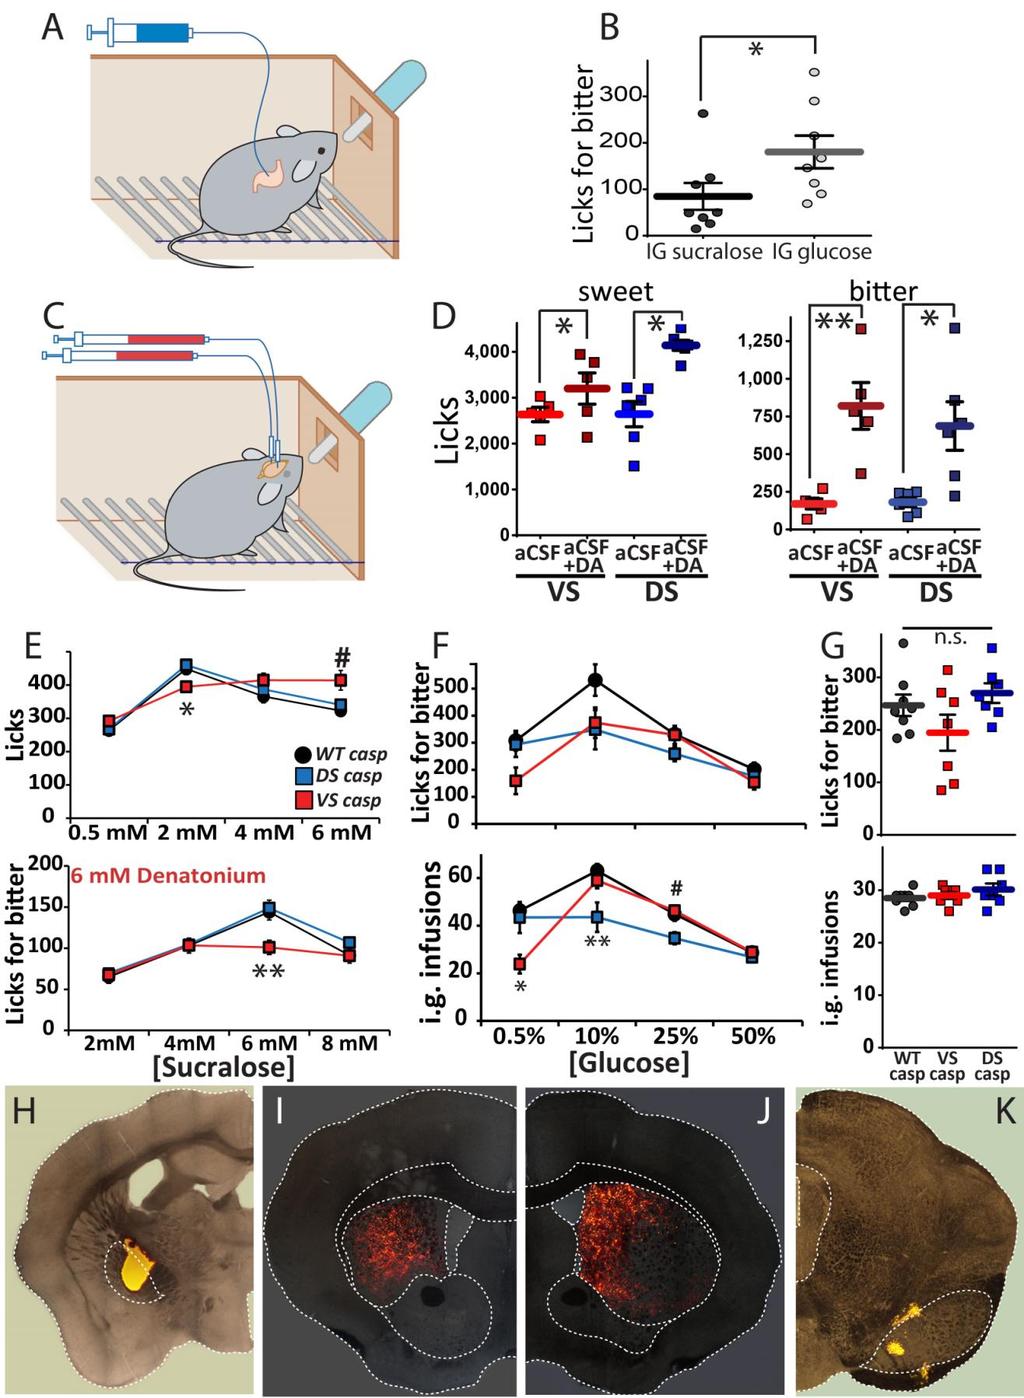
5 Supplementary Figure 3 Effects of artificially increasing dopamine levels or ablating dopamine-excitable neurons in striatum A. Schematic representation of the behavioural preparation where mice licked bitter-containing sippers such that detected licks triggered intra-gastric infusions of either glucose or sucralose. B. Hungry mice (N=8) licked the bitter solution significantly more when self-infusing glucose compared to when self-infusing sucralose (t[7]=2.62, *p=0.035), resulting in significantly larger intra-gastric glucose volumes (not shown, t[7]=3.17, p=0.016). C. Reverse microdialysis was used to perfuse DS or VS with dopamine during ingestion of sucralose or a bitter solution. D. Dopamine perfusion in DS (N=6) and VS (N=5) resulted in increases in sucralose intake when compared to acsf perfusions (Left panel; Perfusion main effect F[1,9]=16.76, p=0.003) The effect was similar in both VS and DS (Two-way RM-ANOVA, striatal region brain perfusion F[1,9]=3.43, p=0.097; dopamine vs. acsf in DS, t[5]=5.07, Bonferroni *p=0.008; in VS effect was weaker: t[4]=1.33, p=0.51). This is consistent with sweetness-driven dopamine efflux in VS but not DS. Dopamine perfusion in DS and VS resulted in robust increases in bitter intake when compared to acsf perfusions (Right panel; Perfusion main effect F[1,9]=27.55, p=0.001). Effect was similarly robust in both VS and DS (Two-way RM-ANOVA, striatal region brain perfusion F[1,9]=0.43, p=0.53; dopamine vs. acsf in DS, t[5]=3.6, Bonferroni *p=0.03; VS: t[4]=3.7, **p=0.04). E. Cell-specific ablation of D1r-neurones in DS or VS. Top panel: Brief access test for different sucralose concentrations. [Two-way RM-ANOVA, sweetness group F[6,57]=8.23, p= ; group effect F[2,19]=1.2, p=0.32; ; sweetness effect F[3,57]=95.8, p= 3x10-22 ]. Cellspecific ablation of D1r-neurones in VS, but not DS, produced a lower intake of 2 mm sucralose [One-way ANOVA group effect F[2,21]=5.95, p=0.01. Ventral lesion vs. Control, Bonferroni *p=0.04; and vs. DS lesion, Bonferroni *p=0.014], whereas at 6mM sucralose VS Casp intake was higher [One-way ANOVA group effect F[2,21]=5.94, p=0.01; ventral lesion vs. WT-Casp Bonferroni #p=0.012 and Ventral lesion vs. DS-Casp Bonferroni p=0.055]. Bottom panel: Masking bitterness. The concentration of the bitter compound denatonium was fixed at 6mM and different concentrations of sucralose were used. [Two-way RM-ANOVA, sweetener concentration group F[6,57]=5.29, p= ; group effect F[2,19]=1.95, p=0.17; sweetener concentration effect F[3,57]=67.32,, p=9.9x10⁻¹⁹ ]. Cell-specific ablation of D1r-neurones in VS, but not DS, produced a lower intake of the mixture 6mM denatonium and 6mM sucralose [One-way ANOVA group effect F[2,21]=7.55, p= Ventral lesion vs. Control, Bonferroni **p=0.012; and vs.ds lesion, Bonferroni **p=0.007]. F. Effects of cell-specific ablation of D1r-neurones in DS or VS on sugar-driven consumption of unpalatable solutions. Top panel: Licks produced during the ingestion of a bitter mixture that triggers intra-gastric infusions of different D-glucose concentrations. [Two-way RM-ANOVA, glucose concentration group F[6,57]=2.68, p=0.023; group effect F[2,19]=2.75, p=0.089; glucose concentration effect F[3,57]=25.8, p=1.3x10⁻¹⁰ ]. Bottom panel: Intra-gastric infusions observed during these sessions [Two-way RM-ANOVA, glucose concentration group F[6,57]=8.83, p=8.2x10⁻⁷ ; group effect F[2,19]=4.18, p=0.031 ; glucose concentration effect F[3,57]=45.87, p=3.3x10⁻¹⁵ ]. Concentrations: 0.5% [One-way ANOVA group effect F[2,21]=7.07, p=0.005; ventral lesion vs. Control, Bonferroni *p=0.007; and vs.ds lesion, Bonferroni *p=0.023]; : 10% [One-way ANOVA group effect F[2,21]=7.09, p=0.005; intake in dorsal lesion vs. Control, Bonferroni **p=0.007; and vs.vs lesion, Bonferroni **p=0.024]; 25% [One-way ANOVA group effect F[2,21]=5.75, p=0.011; dorsal lesion vs. Control, Bonferroni #p=0.034; and vs.vs lesion, Bonferroni #p=0.018]; 50% [Oneway ANOVA group effect F[2,21]=2.16, p=0.142]. G. Licks (top) and infusions (bottom) produced during the conditioning sessions (bitter intake paired with intra-gastric infusions of glucose) prior to the second two-bottle test. Cell-specific ablation of D1r-neurones did not alter intake. [Licks: One-way ANOVA Group Effect F[2,21]=2.27, p=0.13; Infusions: One-way ANOVA Group Effect F[2,21]=1.11, p=0.34]. H-K. Neuroanatomical analyses of the sham cell-specific lesions. When Retrobeads were injected into globus pallidus (GP, targeted by D2r-expressing neurons of DS) of DS-CTL mice (area within dotted line in H), strong labelling was observed in DS (I). Similarly, robust labelling was observed in DS (J) when Retrobeads were injected into the contralateral SNr (K), which is exclusively targeted by D1r-expressing neurons of DS (confront vs. Main Figure 2 in which lesioned case is shown). To allow visualization of the relevant anatomical landmarks, images show the Retrobead fluorescence signal overlaid on a bright field image of the same section. Abbreviations: DS-Casp: Caspase-driven D1r-dependent lesions in DS of D1r-Cre mice (N=7); VS-Casp: Caspase-driven D1r-depedent lesions in VS of D1r-Cre mice (N=7); WT-Casp: Viral delivery of Cre-dependent caspase in DS and/or VS of non-cre mice (N=8). n.s. = non-statistically significant.

6 Supplementary Figure 4 Channelrhodopsin expression in dopamine excitable D1r striatal neurons. A-C ChR2 expression in striatal D1r-neurones. A. Sagital slice showing D1r-neuronal direct pathway from DS to Substantia Nigra, pars reticulata. B. Magnification of area shown in red region containing D1r-postive EYFP labelled axonal fibres originating in DS and descending towards midbrain. C. Magnification of area shown in red region containing dense terminal fibres from DS in Substantia Nigra, pars reticulata (dotted white line). D-F Slice electrophysiological studies of two D1r-neurones types (equally found in DS and VS) after injecting the construct AAV-EF1a-DIO-hChR2(H134R)-EYFP in striatum of D1-Cre mice D. Representative traces showing one type DS D1r-neuron which responded to blue light pulses (10ms) delivered at various frequencies, as well as to continuous light. However only continuous blue light trains produced sustained increases in firing rate. E. Representative traces showing activation of another type of D1r-neurone by blue light pulses (10ms) delivered at various frequencies and by continuous light trains. Both short pulses at various frequencies and continuous light trains activated these D1r-neurones. However, continuous blue light still produced the stronger excitatory effect. F. A representative trace showing long-lasting activation of a D1r-neurone by continuous blue light activation for 1 minute.
-EYFP as visualized in a saggital diagram of the mouse brain A.")
7 Supplementary Figure 5 Optogenetic activation of striatal D2r-expressing neurons during sweetener intake. Channelrhodopsin expression in D2-Cre mice after injecting the construct AAV-EF1a-DIO-hChR2(H134R)-EYFP as visualized in a saggital diagram of the mouse brain A. The construct was injected in DS of a D2-Cre mouse. Contrast with injections performed in D1- Cre mice shown in Main Figure 3. As expected, unlike the D1-Cre case, in D2-Cre mice no terminals were visualized in Substantia Nigra reticulata (SNr), whereas they were densely expressed in the Globus Pallidus (GP), revealing thus the prototypical D2-dependent indirect pathway. B. Results of injecting the virus in VS. EYFP expression is robust yet totally contained within the nucleus accumbens (Acc) in VS. Note dense VS terminal fibres in ventral pallidum (VP), likewise the D1-Cre case. Importantly, no expression was detected in mesencephalic regions, showing that the AAV-EF1a-DIO-hChR2(H134R)-EYFP did express in striatal D2r-positive cells. C. Effects of inhibiting D2r-positive neurons in VS by injecting the construct AAV-EF1a-DIO-eArch3.0-EYFP in D2-Cre mice. Although D2r-neurone inhibition in VS slightly increased licks for sweet sucralose (N=5, paired t-test t[4]=3.43, *p=0.026), it did not attenuate the aversive effects produced by adulterating the sweet solution with a bitter toxin. D. Effects of inhibiting D2r-positive neurons in DS. Although D2rneurone inhibition in DS did not impact on the numbers of licks for sweet sucralose, it did significantly attenuate the aversive effects produced by adulterating the sweet solution with a bitter toxin (N=5, t[4]=9.14, **p=0.001). However, the intake levels remained well below those observed for the sweet solution so that, unlike stimulation of D1r-neurones, inhibition of D2r-neurones does not annul the aversive effects produced by adulterating the sweet solution with a bitter taste.
8
9 Supplementary Figure 6 Controls for non-specific effects of optogenetic stimulation. A. D1-neurone dorsal striatum (DS) stimulation had no effect on bitter taste perception, nor produced indiscriminate licking. A shortterm two-bottle preference test involving the choice between one sweet sucralose and one adulterated bitter solution was performed during D1-neurone stimulation in DS. Both groups, D1-ChR2 (N=6) and Control (N=5) strongly preferred sweet versus bitter solution (one-sample t-test against indifference ratio of 0.5 [red dashed line] both *p=0.001) and no between-group difference was detected (t[9]=1.91, p=0.09). n.s.= statistically non-significant. B. Increasing the duration of licks for sweetener-triggered optical stimulation did not alter the total amount of licks produced (N=6, F[3,15]=1.36, p=0.29). Y-axis represents the average number of licks produced while the laser source was on. C-D. The effects of D1 stimulation of either ventral (VS, N=6) or dorsal (DS, N=5) striatum on glucose selfadministration were evaluated using ChR2+ D1-cre mice. First, baseline intake (licks and volumes) was established during a Laser OFF session, such that detected licks triggered glucose intra-gastric infusions. Then, on a subsequent test session, detected licks triggered glucose intra-gastric infusions coupled to laser activation. C. Significant effects of light activation on lick rates (F[1,9]=8.95, p=0.015) were observed. D1-neurone activation in VS significantly increased licking compared to baseline light OFF (t[5]=5.99, Bonferroni *p=0.006), whereas no significant difference was observed for the D1-dorsal group (t[4]=1.25, p=0.28). D. Significant effects were also observed on volumes of glucose self-infused (F[1,9]=9.67, p=0.013). Both groups mice self-administered significantly more glucose during laser ON sessions (VS, t[5]=10.73, Bonferroni p=0.0024; DS, t[4]=9.92, Bonferroni *p=0.003); however, D1-neurone DS activation produced a more marked increase in volumes self-infused when directly compared to D1-neurone VS stimulation (t[9]=6.06, p=0.0002). The fact that DS stimulation increased volume infusions without increasing lick rates is due to the fact that, during laser/infusion activation, additional licks had no programmed consequences (see also Methods). Therefore D1-neurone DS stimulation was associated with greater gut, but not oral, stimulation. E. Intra-gastric volumes infused in sessions during which sucralose licks triggered intra-gastric infusions of either sucralose or glucose, concomitantly to optical stimulation. The graph shows the sessions in which laser source was ON. For both DS (N=7) and VS (N=6), intra-gastric infusions of glucose were associated with significantly lower number of self-infusions (two-way ANOVA, main infusate effect F[1,11]=193.21, *p= ; striatal region brain perfusion F[1,11]=3.24, p=0.099). However, D1-neurone DS optical stimulation did produce greater self-infused volumes compared to VS stimulation (two-sample t-test t[11]=5.41, p= ) although this did not hold for sucralose sessions (t[11]=0.26, p=0.79). F-H. The reinforcing properties of D1 stimulation at either VS (N=6) or DS (N=5) were assessed using a self-stimulation Nose Poke paradigm. Mice were placed in an operant box equipped with two slots for nose poking at symmetrical locations on one of the cage walls. One slot was associated with laser pulses upon poking (active slot) while poking the second slot had no programmed consequences. Two training sessions performed on two consecutive days, plus one subsequent extinction (laser off) session on a third day, were completed. F. On the first training session, D1-stimulation in both VS and DS produced significantly more responses on the active side (F[1,9]=10.8, p=0.009), with no significant differences between groups in self-stimulatory rates being detected (group effect F[1,9]=2.69, p=0.13; t-test for the active side t[9]=1.71, Bonferroni p=0.121). G. On the second day of training, as above, D1-stimulation in both VS and DS produced significantly more responses on the active side (F[1,9]=18.71, p=0.002), and no differences between these two groups was found (group effect F[1,9]=2.98, p=0.12; t-test for the active side t[9]=1.77, p=0.11). These results suggest that ventral and dorsal D1-stimulations are equally reinforcing under these self-stimulatory conditions. Interestingly, however, during the extinction session shown in H, significant effects associated with neither side (F[1,9]=4.78, p=0.057) nor group (F[1,9]=2.69, p=0.13 t-test for the active side t[9]=1.67, p=0.13) were found. Control group N=6. Note that controls produced remarkably low stimulatory rates throughout the sessions. I. Open field tests reveal no effects of DS optical stimulation on locomotor activity in a novel arena (number of crossings through the arena s subregions, N=5, two-sample t-test t[4]=0.87, p=0.43). J. Neither were detected differences in relative time spent within the illuminated central part of the arena (paired-samples t-test t[4]=2.03, p=0.11). K. No effects of non-contingent DS optical stimulation on chow intake were observed in either hungry or sated states, (N=4, two-way repeated-measures ANOVA, main effect of laser source F[1,3]=1.61, p=0.29; laser source hunger state F[1,3]=2.95, p=0.18) despite clear effects of hunger (F[1,3]=47.82, *p=0.006).
 and B. Substantia nigra, pars reticulata (SNr). C.")
10 Supplementary Figure 7 Interfering with neural activity downstream of dorsal striatum selectively suppresses sugar ingestion. A. Schematic representation of optical fibre position in ventral pallidum (VP) and B. Substantia nigra, pars reticulata (SNr). C. Optogenetic activation of VP strongly suppresses artificial sweetener intake (N=6, Laser ON vs. OFF effect, paired t-test t[5]=13.1, Boferroni *p=0.0018). D. No effects are observed upon activation of SNr (N=5, t[4]=0.58, p=0.59). E. When a novel artificial sweetener (Rebaudioside A) is paired to light, low intake levels are observed also during subsequent Laser OFF sessions (N=6, t[5]=2.75, Bonferroni p=0.1). F. Again no effects are observed upon activation of SNr (N=5, t[4]=0.96, p=0.39). Importantly note that when licks shown in E (i.e. upon optical stimulation of VP) are compared to those shown in F (i.e. upon optical stimulation of SNr), a strong reduction in Rebaudioside A intake is observed during VP compared to SNr stimulation (two-way repeated-measures ANOVA laser source brain region: F[1,9]=7.09, p=0.026; Main brain region effect F[1,9]=55.25, p= ; Comparison during laser ON sessions: two-sample t-test t[9]=5.97, p= ). G. Animals are treated with a glucose intra-gastric preload previous to access to the sucralose solution. Under these conditions optogenetic activation of VP weakly suppresses intake (N=6). t[5]=2.63, Bonferroni *p=0.046, onetailed). H. However, optogenetic activation of SNr led to suppressed intake when preceded by sugar gut infusions (N=5). t[4]=4.04, Bonferroni *p=0.032). I. When a sucralose gastric preload is used instead, VP activations leads to strong suppression (N=6). t[5]=7.57, Bonferroni *p=0.002). J. As expected, no effects upon SNr activation are observed when sucralose intra-gastric preloads are used (N=6). t[4]=0.009, p=0.99).
 was ChR2-tranfected in VS, and optical fibres placed immediately above the D1rneurone terminals in VP. B.")
11 Supplementary Figure 8 Combined optogenetic and chemogenetic activation: schematic of experimental design A. One group of animals ( VS=>VP pathway ) was ChR2-tranfected in VS, and optical fibres placed immediately above the D1rneurone terminals in VP. B. A second group of animals ( DS=>SNr pathway ) was ChR2-tranfected in DS, and optical fibres placed immediately above the D1r-neurone terminals in SNr. In both groups, hm3d(gq) was expressed in VP. C. To assess pathwayspecificity, one additional group of animals expressed hm3d(gq) in SNr instead of VP.

12 Supplementary Figure 9 Analysis of the effects in vivo of optogenetically stimulating the striatal outputs Substantia Nigra, pars reticulata (SNr) and ventral pallidum (VP). Ai32 mice, which express a channelrhodopsin-2/eyfp fusion protein following exposure to Cre recombinase, were used for ChR2 expression in VP and SNr. The construct AAV-CMV-Cre was injected bilaterally. A. EYFP expression SNr as shown on a coronal brain slice. The image shows that ChR2 expression was contained to SNr boundaries. B. To demonstrate that light pulses increased neuronal activity in vivo in SNr, mice were unilaterally stimulated with light (represented by the fibre tip in blue) whereas the other hemisphere was not stimulated. Animals were in their home cages during this protocol and stimulation side was chosen arbitrarily across animals. Mice were perfused 90 minutes after stimulation period for Fos immunohistochemical analyses. Note Fos-positive cells under blue fibre tip. C. Counts of Fos-positive (Fos+) cells through slices containing SNr regions revealed a significantly greater number of Fos+ cells in the stimulated compared to non-stimulated side (N=5 mice, paired t-test t[4]=6.2, *p=0.003). D-G. Same protocol as above, but for VP. As we show in D, unfortunately, the injections encompassed the VP and neighbouring pre-optic area (POA) in some animals. E. We then proceeded to analyse Fos expression upon unilateral stimulation in both POA and VP. Because fibre tips were localized just above the VP, unilateral light stimulation resulted in ipsilateral increases in Fos expression in VP but not POA, although some neurons expressed ChR2 in POA. F. shows that counts of Fos+ cells through slices containing VP regions revealed a significantly greater number of Fos+ cells in the stimulated compared to non-stimulated side (N=5 mice, paired t-test t[4]=6.1, Bonferroni *p=0.008). G shows that this was not the case for POA in the same animals, as the number of Fos+ counts was similar on both stimulated and non-stimulated sides (t[4]=1.19, p=0.29). n.s.= non-statistically significant. acp = posterior limb of the anterior commissure.
13 Supplementary Figure 10 Electrophysiological circuit identification of D1r-specific VS=>VP and DS=>SNr pathways, and in vivo assessment of optogenetic effects. A. Outward postsynaptic currents were evoked in VP neurones by blue light pulses (10ms) delivered at various frequencies (1,5,10,20 Hz) as well as continuous light trains, to VP neurones targeted by Chr2-expressing terminals from D1r-neurones in VS. Whole-cell voltage-clamp recording was performed at the holding potential of -40mV. The GABA A receptor antagonist bicuculine (Bic, 50μM) completely abolished the outward currents evoked by blue light, suggesting that optogenetic activation of VS D1r neurones terminals functionally act on (inhibit) VP neurones via GABAergic mechanisms. B. Representative traces showing outward GABAergic postsynaptic current evoked in SNr neurones by blue light (10ms) pulses delivered at various frequencies (1,5,10,20 Hz) to SNr neurones targeted by Chr2-expressing terminals from D1r-neurones in DS. Recordings performed as in A. C-D. Verification of the ability of optogenetic pulses to VS D1-neurones to inhibit DREADD-induced activity in VP in vivo. We proceeded to analyse Fos expression upon unilateral stimulation in VP (as shown in Figure 8 above) concomitantly to DREADD activation by intra-peritoneal infusions of designer drug CNO. C shows that counts of Fos+ cells through slices containing VP regions revealed a significantly greater number of Fos+ cells in the non-stimulated compared to the light-stimulated side (because activation of D1 GABAergic VS terminals should inhibit VP; N=5 mice, paired t-test t[4]=5.06, Bonferroni *p=0.014). D shows that this was nevertheless not the case for preoptic area (POA) in the same animals, as the number of Fos+ counts was similar on both stimulated and non-stimulated sides (t[4]=0.81, p=0.46). The results therefore suggest that POA is unlikely to have had any influence on the results associated with VP manipulation. n.s.= non-statistically significant.
-IRES-mCitrine into VP and SNr of D1-Cre mice. A. Histological sample (left hemisphere) and schematic representation (right hemisphere) of final position of microwire tips in VP.")
14 Supplementary Figure 11 Design receptor activation assessment via in vivo multielectrode array recordings. In vivo electrophysiological studies after injecting the construct AAV-hSyn-HA-hM3D(Gq)-IRES-mCitrine into VP and SNr of D1-Cre mice. A. Histological sample (left hemisphere) and schematic representation (right hemisphere) of final position of microwire tips in VP. Wires were cut at different lengths to account for non-uniform dorsal-ventral depths across mediolateral extension. B. Trace shows average of firing rate activity from a population of 38 neurons in VP before and after DREADD activation with CNO (n=2). Time t=0 (dashed line) indicates onset of CNO i.p. injection. Within pie-plot, black area represents percentage of units excited after the CNO injection, whereas white area represents the percentage of units that were inhibited. Gray area represents the percentage of units with stable firing rate throughout the experiment. C. Same as in B, but for saline injection. Percentages out of the total 29 units that were excited, inhibited and unaffected are shown. Chi-square tests reveal that relative numbers of cells changing firing rates in CNO case was significantly greater than SAL case χ2[2,n=67]=23.99, p= D. Histological sample (left hemisphere) and schematic representation (right hemisphere) of final position of microwire tips in SNr.Wires were cut at different lengths to account for non-uniform dorsal-ventral depths across mediolateral extension. E-F Same as B-C but for SNr (59/29 units for CNO/SAL respectively, χ2[2,n=88]=10.3, p=0.0058).
15 Supplementary Figure 12 Descending pathways via which nutrient sensing in basal ganglia may command feeding motor programs. Separate dorsal (blue lines) and ventral (red lines) circuits may activate a common brainstem oral-motor central pattern generator (CPG) via segregated descending pathways. This model is consistent with the animal s ability to persist licking an aversive solution whenever this solution is associated with energy gain. Connections ending as triangles represent excitatory/modulatory connections. Connections ending as simple trace represent inhibitory connections, as based on current knowledge of the chemical structure of these pathways. DA=Dopamine, DS=Dorsal striatum, LH=Lateral hypothalamic area, SNc=Substantia Nigra, pars compacta, SNr=Substantia Nigra, pars reticulata, VP=Ventral pallidum, VS=Ventral striatum.
Nature Neuroscience: doi: /nn Supplementary Figure 1. Diverse anorexigenic signals induce c-fos expression in CEl PKC-δ + neurons
 Supplementary Figure 1 Diverse anorexigenic signals induce c-fos expression in CEl PKC-δ + neurons a-c. Quantification of CEl c-fos expression in mice intraperitoneal injected with anorexigenic drugs (a),
Supplementary Figure 1
 Supplementary Figure 1 Localization of virus injections. (a) Schematic showing the approximate center of AAV-DIO-ChR2-YFP injection sites in the NAc of Dyn-cre mice (n=8 mice, 16 injections; caudate/putamen,
Hormonal gain control of a medial preoptic area social reward circuit
 CORRECTION NOTICE Nat. Neurosci. 20, 449 458 (2017) Hormonal gain control of a medial preoptic area social reward circuit Jenna A McHenry, James M Otis, Mark A Rossi, J Elliott Robinson, Oksana Kosyk,
Nature Neuroscience: doi: /nn Supplementary Figure 1
 Supplementary Figure 1 Atlas representations of the midcingulate (MCC) region targeted in this study compared against the anterior cingulate (ACC) region commonly reported. Coronal sections are shown on
Supplemental Information. Dorsal Raphe Dual Serotonin-Glutamate Neurons. Drive Reward by Establishing Excitatory Synapses
 Cell Reports, Volume 26 Supplemental Information Dorsal Raphe Dual Serotonin-Glutamate Neurons Drive Reward by Establishing Excitatory Synapses on VTA Mesoaccumbens Dopamine Neurons Hui-Ling Wang, Shiliang
Nature Neuroscience: doi: /nn Supplementary Figure 1
 Supplementary Figure 1 Drd1a-Cre driven ChR2 expression in the SCN. (a) Low-magnification image of a representative Drd1a-ChR2 coronal brain section (n = 2) showing endogenous tdtomato fluorescence (magenta).
Supplementary Figure 1
 Supplementary Figure 1 Arcuate ChIEF-tdTomato neurons expressed TH These micrographs show that TH-Cre-ChIEF-tdTomato (magenta), expressed by AAV in a TH-Cre mouse, were immunostained with TH (green) in
Nature Neuroscience: doi: /nn Supplementary Figure 1. Trial structure for go/no-go behavior
 Supplementary Figure 1 Trial structure for go/no-go behavior a, Overall timeline of experiments. Day 1: A1 mapping, injection of AAV1-SYN-GCAMP6s, cranial window and headpost implantation. Water restriction
Supplementary Figure 1 Information on transgenic mouse models and their recording and optogenetic equipment. (a) 108 (b-c) (d) (e) (f) (g)
 108 (b-c) (d) (e) (f) (g)") Supplementary Figure 1 Information on transgenic mouse models and their recording and optogenetic equipment. (a) In four mice, cre-dependent expression of the hyperpolarizing opsin Arch in pyramidal cells
Supplementary Figure 1 Information on transgenic mouse models and their recording and optogenetic equipment. (a) In four mice, cre-dependent expression of the hyperpolarizing opsin Arch in pyramidal cells
Tuning properties of individual circuit components and stimulus-specificity of experience-driven changes.
 Supplementary Figure 1 Tuning properties of individual circuit components and stimulus-specificity of experience-driven changes. (a) Left, circuit schematic with the imaged component (L2/3 excitatory neurons)
The Journal of Physiology Neuroscience
 J Physiol 591.22 (2013) pp 5727 5744 5727 The Journal of Physiology Neuroscience Glucose utilization rates regulate intake levels of artificial sweeteners Luis A. Tellez 1,2,XueyingRen 1,2,WenfeiHan 1,2,
Nature Neuroscience: doi: /nn.4642
 Supplementary Figure 1 Recording sites and example waveform clustering, as well as electrophysiological recordings of auditory CS and shock processing following overtraining. (a) Recording sites in LC
Nature Neuroscience: doi: /nn Supplementary Figure 1. Confirmation that optogenetic inhibition of dopaminergic neurons affects choice
 Supplementary Figure 1 Confirmation that optogenetic inhibition of dopaminergic neurons affects choice (a) Sample behavioral trace as in Figure 1d, but with NpHR stimulation trials depicted as green blocks
Nature Neuroscience: doi: /nn.4335
 Supplementary Figure 1 Cholinergic neurons projecting to the VTA are concentrated in the caudal mesopontine region. (a) Schematic showing the sites of retrograde tracer injections in the VTA: cholera toxin
Supplementary Figure 1. Recording sites.
 Supplementary Figure 1 Recording sites. (a, b) Schematic of recording locations for mice used in the variable-reward task (a, n = 5) and the variable-expectation task (b, n = 5). RN, red nucleus. SNc,
SUPPLEMENTARY INFORMATION
 SUPPLEMENTARY INFORMATION doi:10.1038/nature12024 entary Figure 1. Distribution of the number of earned cocaine Supplementary Figure 1. Distribution of the number of earned cocaine infusions in Shock-sensitive
Nature Neuroscience: doi: /nn Supplementary Figure 1
 Supplementary Figure 1 Reward rate affects the decision to begin work. (a) Latency distributions are bimodal, and depend on reward rate. Very short latencies (early peak) preferentially occur when a greater
Lack of GPR88 enhances medium spiny neuron activity and alters. motor- and cue- dependent behaviors
 Lack of GPR88 enhances medium spiny neuron activity and alters motor- and cue- dependent behaviors Albert Quintana, Elisenda Sanz, Wengang Wang, Granville P. Storey, Ali D. Güler Matthew J. Wanat, Bryan
SUPPLEMENTARY INFORMATION
 SUPPLEMENTARY INFORMATION doi:10.1038/nature11306 Supplementary Figures Supplementary Figure 1. Basic characterization of GFP+ RGLs in the dentate gyrus of adult nestin-gfp mice. a, Sample confocal images
Supplementary Figure 1: Steviol and stevioside potentiate TRPM5 in a cell-free environment. (a) TRPM5 currents are activated in inside-out patches
 TRPM5 currents are activated in inside-out patches") Supplementary Figure 1: Steviol and stevioside potentiate TRPM5 in a cell-free environment. (a) TRPM5 currents are activated in inside-out patches during application of 500 µm Ca 2+ at the intracellular
Supplementary Figure 1: Steviol and stevioside potentiate TRPM5 in a cell-free environment. (a) TRPM5 currents are activated in inside-out patches during application of 500 µm Ca 2+ at the intracellular
Anatomy of the basal ganglia. Dana Cohen Gonda Brain Research Center, room 410
 Anatomy of the basal ganglia Dana Cohen Gonda Brain Research Center, room 410 danacoh@gmail.com The basal ganglia The nuclei form a small minority of the brain s neuronal population. Little is known about
Teach-SHEET Basal Ganglia
 Teach-SHEET Basal Ganglia Purves D, et al. Neuroscience, 5 th Ed., Sinauer Associates, 2012 Common organizational principles Basic Circuits or Loops: Motor loop concerned with learned movements (scaling
The individual animals, the basic design of the experiments and the electrophysiological
 SUPPORTING ONLINE MATERIAL Material and Methods The individual animals, the basic design of the experiments and the electrophysiological techniques for extracellularly recording from dopamine neurons were
Nature Neuroscience: doi: /nn Supplementary Figure 1. Splenic atrophy and leucopenia caused by T3 SCI.
 Supplementary Figure 1 Splenic atrophy and leucopenia caused by T3 SCI. (a) Gross anatomy of representative spleens from control and T3 SCI mice at 28 days post-injury. (b and c) Hematoxylin and eosin
GBME graduate course. Chapter 43. The Basal Ganglia
 GBME graduate course Chapter 43. The Basal Ganglia Basal ganglia in history Parkinson s disease Huntington s disease Parkinson s disease 1817 Parkinson's disease (PD) is a degenerative disorder of the
NS219: Basal Ganglia Anatomy
 NS219: Basal Ganglia Anatomy Human basal ganglia anatomy Analagous rodent basal ganglia nuclei Basal ganglia circuits: the classical model of direct and indirect pathways + Glutamate + - GABA - Gross anatomy
Zhu et al, page 1. Supplementary Figures
 Zhu et al, page 1 Supplementary Figures Supplementary Figure 1: Visual behavior and avoidance behavioral response in EPM trials. (a) Measures of visual behavior that performed the light avoidance behavior
Nature Neuroscience: doi: /nn Supplementary Figure 1. ACx plasticity is required for fear conditioning.
 Supplementary Figure 1 ACx plasticity is required for fear conditioning. (a) Freezing time of conditioned and control mice before CS presentation and during CS presentation in a new context. Student s
Supplemental Information. A Visual-Cue-Dependent Memory Circuit. for Place Navigation
 Neuron, Volume 99 Supplemental Information A Visual-Cue-Dependent Memory Circuit for Place Navigation Han Qin, Ling Fu, Bo Hu, Xiang Liao, Jian Lu, Wenjing He, Shanshan Liang, Kuan Zhang, Ruijie Li, Jiwei
A. General features of the basal ganglia, one of our 3 major motor control centers:
 Reading: Waxman pp. 141-146 are not very helpful! Computer Resources: HyperBrain, Chapter 12 Dental Neuroanatomy Suzanne S. Stensaas, Ph.D. April 22, 2010 THE BASAL GANGLIA Objectives: 1. What are the
Nature Neuroscience doi: /nn Supplementary Figure 1. Characterization of viral injections.
 Supplementary Figure 1 Characterization of viral injections. (a) Dorsal view of a mouse brain (dashed white outline) after receiving a large, unilateral thalamic injection (~100 nl); demonstrating that
Nucleus Accumbens Subnuclei Regulate Motivated Behavior via Direct Inhibition and Disinhibition of VTA Dopamine Subpopulations
 Article Nucleus Accumbens Subnuclei Regulate Motivated Behavior via Direct Inhibition and Disinhibition of VTA Dopamine Subpopulations Highlights d Mesolimbic DA subpopulations are embedded within different
A. General features of the basal ganglia, one of our 3 major motor control centers:
 Reading: Waxman pp. 141-146 are not very helpful! Computer Resources: HyperBrain, Chapter 12 Dental Neuroanatomy Suzanne S. Stensaas, Ph.D. March 1, 2012 THE BASAL GANGLIA Objectives: 1. What are the main
Basal Ganglia General Info
 Basal Ganglia General Info Neural clusters in peripheral nervous system are ganglia. In the central nervous system, they are called nuclei. Should be called Basal Nuclei but usually called Basal Ganglia.
Supplementary Figure 1. Example of an amygdala neuron whose activity reflects value during the visual stimulus interval. This cell responded more
 1 Supplementary Figure 1. Example of an amygdala neuron whose activity reflects value during the visual stimulus interval. This cell responded more strongly when an image was negative than when the same
Supplementary Figure 1
 Supplementary Figure 1 Miniature microdrive, spike sorting and sleep stage detection. a, A movable recording probe with 8-tetrodes (32-channels). It weighs ~1g. b, A mouse implanted with 8 tetrodes in
Nature Neuroscience: doi: /nn Supplementary Figure 1. Visualization of AT1a-positive cells using AT1a lacz/+ mouse.
 Supplementary Figure 1 Visualization of AT1a-positive cells using AT1a lacz/+ mouse. (a f) Immunohistochemical detection of β-gal in the mouse brain. Coronal sections at the respective anteroposterior
COGNITIVE SCIENCE 107A. Motor Systems: Basal Ganglia. Jaime A. Pineda, Ph.D.
 COGNITIVE SCIENCE 107A Motor Systems: Basal Ganglia Jaime A. Pineda, Ph.D. Two major descending s Pyramidal vs. extrapyramidal Motor cortex Pyramidal system Pathway for voluntary movement Most fibers originate
Effects of lesions of the nucleus accumbens core and shell on response-specific Pavlovian i n s t ru mental transfer
 Effects of lesions of the nucleus accumbens core and shell on response-specific Pavlovian i n s t ru mental transfer RN Cardinal, JA Parkinson *, TW Robbins, A Dickinson, BJ Everitt Departments of Experimental
nucleus accumbens septi hier-259 Nucleus+Accumbens birnlex_727
 Nucleus accumbens From Wikipedia, the free encyclopedia Brain: Nucleus accumbens Nucleus accumbens visible in red. Latin NeuroNames MeSH NeuroLex ID nucleus accumbens septi hier-259 Nucleus+Accumbens birnlex_727
Orbitofrontal and striatal circuits dynamically encode the shift between goal-directed and habitual actions
 Received May Accepted 8 Jul Published Aug Orbitofrontal and striatal circuits dynamically encode the shift between goal-directed and habitual actions Christina M. Gremel & Rui M. Costa, DOI:.8/ncomms OPEN
Nature Neuroscience: doi: /nn Supplementary Figure 1
 Supplementary Figure 1 Bidirectional optogenetic modulation of the tonic activity of CEA PKCδ + neurons in vitro. a, Top, Cell-attached voltage recording illustrating the blue light-induced increase in
Supplementary figure 1: LII/III GIN-cells show morphological characteristics of MC
 1 2 1 3 Supplementary figure 1: LII/III GIN-cells show morphological characteristics of MC 4 5 6 7 (a) Reconstructions of LII/III GIN-cells with somato-dendritic compartments in orange and axonal arborizations
For more information about how to cite these materials visit
 Author(s): Peter Hitchcock, PH.D., 2009 License: Unless otherwise noted, this material is made available under the terms of the Creative Commons Attribution Non-commercial Share Alike 3.0 License: http://creativecommons.org/licenses/by-nc-sa/3.0/
SUPPLEMENTARY INFORMATION
 doi:1.138/nature9553 Supplementary Table 1. Overlap of neuronal marker and PKC- expression in CEl. Marker/PKC- PKC- Marker Gad65 87.4±4.7 5.3±12.6 CRH 1.2±1. 16.9±15.2 Dyn 1.9±1.2 4.5±2.9 Enk 42.8±7.4
-80 Figure 1. Identification of dopaminergic neurons in. VTA slices (a) Micrographs demonstrate the location of the VTA with
 Micrographs demonstrate the location of the VTA with") Potential (mv) A B C Potential (mv) D E F Biocytin TH Merge R 12 12 1 1 8 G 6 4 8 6 4 H 2 2-2 -2-4 -4-6 -6 Supplemental -8-8 Figure 1. Identification of dopaminergic neurons in -1 VTA slices. -1 (a) Micrographs
Potential (mv) A B C Potential (mv) D E F Biocytin TH Merge R 12 12 1 1 8 G 6 4 8 6 4 H 2 2-2 -2-4 -4-6 -6 Supplemental -8-8 Figure 1. Identification of dopaminergic neurons in -1 VTA slices. -1 (a) Micrographs
SUPPLEMENTARY INFORMATION
 Supplementary Figure 1. Normal AMPAR-mediated fepsp input-output curve in CA3-Psen cdko mice. Input-output curves, which are plotted initial slopes of the evoked fepsp as function of the amplitude of the
File name: Supplementary Information Description: Supplementary Figures, Supplementary Table and Supplementary References
 File name: Supplementary Information Description: Supplementary Figures, Supplementary Table and Supplementary References File name: Supplementary Data 1 Description: Summary datasheets showing the spatial
Damage on one side.. (Notes) Just remember: Unilateral damage to basal ganglia causes contralateral symptoms.
 Just remember: Unilateral damage to basal ganglia causes contralateral symptoms.") Lecture 20 - Basal Ganglia Basal Ganglia (Nolte 5 th Ed pp 464) Damage to the basal ganglia produces involuntary movements. Although the basal ganglia do not influence LMN directly (to cause this involuntary
Lecture 20 - Basal Ganglia Basal Ganglia (Nolte 5 th Ed pp 464) Damage to the basal ganglia produces involuntary movements. Although the basal ganglia do not influence LMN directly (to cause this involuntary
Dopamine in Ube3a m-/p+ mice. Online Supplemental Material
 Online Supplemental Material S1 Supplemental Figure 1. Schematic of rate-dependent intracranial self-stimulation (ICSS) (A) Mice implanted with monopolar stimulating electrodes to the medial forebrain
Supplementary Information
 Supplementary Information D-Serine regulates cerebellar LTD and motor coordination through the 2 glutamate receptor Wataru Kakegawa, Yurika Miyoshi, Kenji Hamase, Shinji Matsuda, Keiko Matsuda, Kazuhisa
Brain anatomy and artificial intelligence. L. Andrew Coward Australian National University, Canberra, ACT 0200, Australia
 Brain anatomy and artificial intelligence L. Andrew Coward Australian National University, Canberra, ACT 0200, Australia The Fourth Conference on Artificial General Intelligence August 2011 Architectures
SUPPLEMENTARY INFORMATION
 doi: 10.1038/nature06310 SUPPLEMENTARY INFORMATION www.nature.com/nature 1 www.nature.com/nature 2 www.nature.com/nature 3 Supplementary Figure S1 Spontaneous duration of wake, SWS and REM sleep (expressed
GABAergic Influences Increase Ingestion across All Taste Categories. Liz Miller. Molly McGinnis. Lindsey Richardson
 GABAergic Influences Increase Ingestion across All Taste Categories Liz Miller Molly McGinnis Lindsey Richardson A research thesis submitted in partial completion of PSY451 senior research thesis, at Wofford
Dynamic Nigrostriatal Dopamine Biases Action Selection
 Article Dynamic Nigrostriatal Dopamine Biases Action Selection Highlights d Nigrostriatal dopamine signaling is associated with ongoing action selection Authors Christopher D. Howard, Hao Li, Claire E.
Basal nuclei, cerebellum and movement
 Basal nuclei, cerebellum and movement MSTN121 - Neurophysiology Session 9 Department of Myotherapy Basal Nuclei (Ganglia) Basal Nuclei (Ganglia) Role: Predict the effects of various actions, then make
Nature Neuroscience: doi: /nn Supplementary Figure 1
 Supplementary Figure 1 Relative expression of K IR2.1 transcript to enos was reduced 29-fold in capillaries from knockout animals. Relative expression of K IR2.1 transcript to enos was reduced 29-fold
Basal Ganglia Anatomy, Physiology, and Function. NS201c
 Basal Ganglia Anatomy, Physiology, and Function NS201c Human Basal Ganglia Anatomy Basal Ganglia Circuits: The Classical Model of Direct and Indirect Pathway Function Motor Cortex Premotor Cortex + Glutamate
Supplementary Figure 1) GABAergic enhancement by leptin hyperpolarizes POMC neurons A) Representative recording samples showing the membrane
 GABAergic enhancement by leptin hyperpolarizes POMC neurons A) Representative recording samples showing the membrane") Supplementary Figure 1) GABAergic enhancement by leptin hyperpolarizes POMC neurons A) Representative recording samples showing the membrane potential recorded from POMC neurons following treatment with
Supplementary Figure 1) GABAergic enhancement by leptin hyperpolarizes POMC neurons A) Representative recording samples showing the membrane potential recorded from POMC neurons following treatment with
Basal Ganglia. Introduction. Basal Ganglia at a Glance. Role of the BG
 Basal Ganglia Shepherd (2004) Chapter 9 Charles J. Wilson Instructor: Yoonsuck Choe; CPSC 644 Cortical Networks Introduction A set of nuclei in the forebrain and midbrain area in mammals, birds, and reptiles.
Summary of behavioral performances for mice in imaging experiments.
 Supplementary Figure 1 Summary of behavioral performances for mice in imaging experiments. (a) Task performance for mice during M2 imaging experiments. Open triangles, individual experiments. Filled triangles,
Basal Ganglia. Steven McLoon Department of Neuroscience University of Minnesota
 Basal Ganglia Steven McLoon Department of Neuroscience University of Minnesota 1 Course News Graduate School Discussion Wednesday, Nov 1, 11:00am MoosT 2-690 with Paul Mermelstein (invite your friends)
Supplementary Figure 1
 Supplementary Figure 1 Global TeNT expression effectively impairs synaptic transmission. Injection of 100 pg tent mrna leads to a reduction of vesicle mediated synaptic transmission in the spinal cord
Supplementary Figure 1. Basic properties of compound EPSPs at
 Supplementary Figure 1. Basic properties of compound EPSPs at hippocampal CA3 CA3 cell synapses. (a) EPSPs were evoked by extracellular stimulation of the recurrent collaterals and pharmacologically isolated
The Journal of Physiology Neuroscience
 J Physiol 595.4 (217) pp 1393 1412 1393 The Journal of Physiology Neuroscience Excitation of lateral habenula neurons as a neural mechanism underlying ethanol-induced conditioned taste aversion Shashank
Nature Neuroscience: doi: /nn Supplementary Figure 1. Lick response during the delayed Go versus No-Go task.
 Supplementary Figure 1 Lick response during the delayed Go versus No-Go task. Trial-averaged lick rate was averaged across all mice used for pyramidal cell imaging (n = 9). Different colors denote different
Supplemental Information. A Labeled-Line Neural Circuit. for Pheromone-Mediated Sexual Behaviors in Mice
 Neuron, Volume Supplemental Information A Labeled-Line Neural Circuit for Pheromone-Mediated Sexual Behaviors in Mice Kentaro K. Ishii, Takuya Osakada, Hiromi Mori, Nobuhiko Miyasaka, Yoshihiro Yoshihara,
Nature Methods: doi: /nmeth Supplementary Figure 1. Activity in turtle dorsal cortex is sparse.
 Supplementary Figure 1 Activity in turtle dorsal cortex is sparse. a. Probability distribution of firing rates across the population (notice log scale) in our data. The range of firing rates is wide but
brain valuation & behavior
 brain valuation & behavior 9 Rangel, A, et al. (2008) Nature Neuroscience Reviews Vol 9 Stages in decision making process Problem is represented in the brain Brain evaluates the options Action is selected
In Vitro Analog of Operant Conditioning in Aplysia
 The Journal of Neuroscience, March 15, 1999, 19(6):2261 2272 In Vitro Analog of Operant Conditioning in Aplysia. II. Modifications of the Functional Dynamics of an Identified Neuron Contribute to Motor
Basal Ganglia George R. Leichnetz, Ph.D.
 Basal Ganglia George R. Leichnetz, Ph.D. OBJECTIVES 1. To understand the brain structures which constitute the basal ganglia, and their interconnections 2. To understand the consequences (clinical manifestations)
Role of the anterior cingulate cortex in the control over behaviour by Pavlovian conditioned stimuli
 Role of the anterior cingulate cortex in the control over behaviour by Pavlovian conditioned stimuli in rats RN Cardinal, JA Parkinson, H Djafari Marbini, AJ Toner, TW Robbins, BJ Everitt Departments of
Nature Neuroscience: doi: /nn Supplementary Figure 1. Distribution of starter cells for RV-mediated retrograde tracing.
 Supplementary Figure 1 Distribution of starter cells for RV-mediated retrograde tracing. Parcellation of cortical areas is based on Allen Mouse Brain Atlas and drawn to scale. Thick white curves, outlines
Astrocyte signaling controls spike timing-dependent depression at neocortical synapses
 Supplementary Information Astrocyte signaling controls spike timing-dependent depression at neocortical synapses Rogier Min and Thomas Nevian Department of Physiology, University of Berne, Bern, Switzerland
Brain dopamine and mild hypoxia
 Brain dopamine and mild hypoxia Denoroy L, Orset C, Parrot S, Berod A, Sauvinet V, Cottet-Emard JM, Pequignot JM. Université Claude Bernard, Lyon, France Striatum vulnerable to hypoxia ischemia necrotic
Sample Lab Report 1 from 1. Measuring and Manipulating Passive Membrane Properties
 Sample Lab Report 1 from http://www.bio365l.net 1 Abstract Measuring and Manipulating Passive Membrane Properties Biological membranes exhibit the properties of capacitance and resistance, which allow
Intravital Microscopic Interrogation of Peripheral Taste Sensation
 Supplementary Information Intravital Microscopic Interrogation of Peripheral Taste Sensation Myunghwan Choi 1, Woei Ming Lee 1,2, and Seok-Hyun Yun 1 * 1 Harvard Medical School and Wellman Center for Photomedicine,
Chemogenetic manipulation of ventral pallidal neurons impairs acquisition of sign-tracking in rats
 European Journal of Neuroscience, Vol. 42, pp. 315 3116, 215 doi:1.1111/ejn.1313 BEHAVIOURAL NEUROSCIENCE Chemogenetic manipulation of ventral pallidal neurons impairs acquisition of sign-tracking in rats
The control of spiking by synaptic input in striatal and pallidal neurons
 The control of spiking by synaptic input in striatal and pallidal neurons Dieter Jaeger Department of Biology, Emory University, Atlanta, GA 30322 Key words: Abstract: rat, slice, whole cell, dynamic current
SUPPLEMENTARY INFORMATION
 doi:10.1038/nature10776 Supplementary Information 1: Influence of inhibition among blns on STDP of KC-bLN synapses (simulations and schematics). Unconstrained STDP drives network activity to saturation
Nature Neuroscience: doi: /nn Supplementary Figure 1. MADM labeling of thalamic clones.
 Supplementary Figure 1 MADM labeling of thalamic clones. (a) Confocal images of an E12 Nestin-CreERT2;Ai9-tdTomato brain treated with TM at E10 and stained for BLBP (green), a radial glial progenitor-specific
Supplementary Figure 1
 8w Pia II/III IV V VI PV EYFP EYFP PV EYFP PV d PV EYFP Supplementary Figure a Spike probability x - PV-Cre d Spike probability x - RS RS b e Spike probability Spike probability.6......8..... FS FS c f
Figure S 1. S1. Histological evaluation of lateral hemisection.
 Dorsal Central Ventral Figure S1. Histological evaluation of lateral hemisection. Schematic Figure S1. Histological evaluation of lateral hemisection. Schematic representation of hemisection at. Dashed
Food Reward in the Absence of Taste Receptor Signaling
 Article Food Reward in the Absence of Taste Receptor Signaling Ivan E. de Araujo, 1,5,8, * Albino J. Oliveira-Maia, 1,6,7,8 Tatyana D. Sotnikova, 4 Raul R. Gainetdinov, 4 Marc G. Caron, 4 Miguel A.L. Nicolelis,
Visualization and simulated animations of pathology and symptoms of Parkinson s disease
 Visualization and simulated animations of pathology and symptoms of Parkinson s disease Prof. Yifan HAN Email: bctycan@ust.hk 1. Introduction 2. Biochemistry of Parkinson s disease 3. Course Design 4.
INTRODUCTION. Ninglei Sun 1, Steven R Laviolette*,1,2,3 and Addiction Research Group
 (2014) 39, 2799 2815 & 2014 American College of. All rights reserved 0893-133X/14 www.neuropsychopharmacology.org Dopamine Receptor Blockade Modulates the Rewarding and Aversive Properties of Nicotine
A Unique Population of Ventral Tegmental Area Neurons Inhibits the Lateral Habenula to Promote Reward
 Article A Unique Population of Ventral Tegmental Area Neurons Inhibits the Lateral Habenula to Promote Reward Alice M. Stamatakis, 1,2,3 Joshua H. Jennings, 1,2,3 Randall L. Ung, 2 Grace A. Blair, 2 Richard
Double dissociation of value computations in orbitofrontal and anterior cingulate neurons
 Supplementary Information for: Double dissociation of value computations in orbitofrontal and anterior cingulate neurons Steven W. Kennerley, Timothy E. J. Behrens & Jonathan D. Wallis Content list: Supplementary
Ghrelin mediates stressinduced. behavior in mice. Chuang et al 2011 L3: Love, Lust, Labor
 Ghrelin mediates stressinduced food-reward behavior in mice Chuang et al 2011 L3: Love, Lust, Labor Agenda Introduction What is Ghrelin? Previous Models New model Methods Results Discussion Conclusion
Dopaminergic dynamics underlying sex-specific cocaine reward
 Received Jun 6 Accepted 8 Nov 6 Published Jan 7 DOI:.8/ncomms877 OPEN Dopaminergic dynamics underlying sex-specific cocaine reward Erin S. Calipari,, Barbara Juarez,,, Carole Morel, Deena M. Walker, Michael
-51mV 30s 3mV. n=14 n=4 p=0.4. Depolarization (mv) 3
 3") Supplementary Figure 1 a optoβ 2 -AR b ChR2-51mV 30s 3mV -50mV 30s 3mV c 4 n=14 n=4 p=0.4 Depolarization (mv) 3 2 1 0 Both optogenetic actuators, optoβ 2 AR and ChR2, were effective in stimulating astrocytes
Supplementary Figure 1 a optoβ 2 -AR b ChR2-51mV 30s 3mV -50mV 30s 3mV c 4 n=14 n=4 p=0.4 Depolarization (mv) 3 2 1 0 Both optogenetic actuators, optoβ 2 AR and ChR2, were effective in stimulating astrocytes
The Contribution of the Amygdala to Reward-Related Learning and Extinction
 Chapter 14 The Contribution of the Amygdala to Reward-Related Learning and Extinction Rose Chesworth and Laura Corbit Additional information is available at the end of the chapter Abstract There has been
Binge eating is a pathological feeding pattern affecting 4.5% of Americans over their
 Abstract Binge eating is a pathological feeding pattern affecting 4.5% of Americans over their lifetime and present in a number of eating disorders, including binge eating disorder, bulimia nervosa, and
Supplementary Figure 1. Verification of drug infusions into the IPN. a. Representative
 Supplementary Figure 1. Verifiation of drug infusions into the IPN. a. Representative neutral red-stained oronal setion from a mouse with a guide annula targeting the IPN. The guide annula sar is irled
Making Things Happen 2: Motor Disorders
 Making Things Happen 2: Motor Disorders How Your Brain Works Prof. Jan Schnupp wschnupp@cityu.edu.hk HowYourBrainWorks.net On the Menu in This Lecture In the previous lecture we saw how motor cortex and
Ube3a is required for experience-dependent maturation of the neocortex
 Ube3a is required for experience-dependent maturation of the neocortex Koji Yashiro, Thorfinn T. Riday, Kathryn H. Condon, Adam C. Roberts, Danilo R. Bernardo, Rohit Prakash, Richard J. Weinberg, Michael
Distinct Roles of Parvalbumin- and Somatostatin- Expressing Interneurons in Working Memory
 Article Distinct Roles of Parvalbumin- and Somatostatin- Expressing Interneurons in Working Memory Highlights d Roles of parvalbumin and somatostatin neurons in working memory were investigated d d Somatostatin
Still at the Choice-Point
 Still at the Choice-Point Action Selection and Initiation in Instrumental Conditioning BERNARD W. BALLEINE AND SEAN B. OSTLUND Department of Psychology and the Brain Research Institute, University of California,
Unique functional properties of somatostatin-expressing GABAergic neurons in mouse barrel cortex
 Supplementary Information Unique functional properties of somatostatin-expressing GABAergic neurons in mouse barrel cortex Luc Gentet, Yves Kremer, Hiroki Taniguchi, Josh Huang, Jochen Staiger and Carl
Does nicotine alter what is learned about non-drug incentives?
 East Tennessee State University Digital Commons @ East Tennessee State University Undergraduate Honors Theses 5-2014 Does nicotine alter what is learned about non-drug incentives? Tarra L. Baker Follow