Visual Attention and the Role of Normalization
|
|
|
- Kevin Lester
- 5 years ago
- Views:
Transcription
1 Visual Attention and the Role of Normalization The Harvard community has made this article openly available. Please share how this access benefits you. Your story matters. Citation Accessed Citable Link Terms of Use Ni, Amy Visual Attention and the Role of Normalization. Doctoral dissertation, Harvard University. August 25, :59:36 AM EDT This article was downloaded from Harvard University's DASH repository, and is made available under the terms and conditions applicable to Other Posted Material, as set forth at (Article begins on next page)
2 Amy Meesun Ni All rights reserved.
3 Dissertation Advisor: Dr. John H. R. Maunsell Amy Meesun Ni Visual Attention and the Role of Normalization Abstract Visual perception can be improved by the intentional allocation of attention to specific visual components. This top-down attention can improve perception of specific locations in space, or of specific visual features at all locations in space. Both spatial and feature attention are thought to involve the feedback of attention signals from higher cortical areas to visual cortex, where it modulates the firing rates of specific sensory neurons. However, the mechanisms that determine how top-down attention signals modulate the firing rates of visual neurons are not fully understood. Recently, a sensory mechanism called normalization has been implicated in mediating neuronal modulations by attention. Normalization is a form of gain control that adjusts the dynamic range of neuronal responses, particularly when more than one stimulus lies within a neuron's receptive field. Models of attention propose that this sensory mechanism affects how attention signals modulate the firing rates of sensory neurons, but it remains unclear exactly how normalization is related to the different forms of top-down attention. Here we use single unit electrophysiological recordings from the middle temporal area (MT) of rhesus monkeys to measure the firing rates of sensory neurons. We ask the monkeys to perform a behavioral task that directs their attention to a particular location or iii
4 feature, allowing us to independently measure modulations to firing rates due to normalization, spatial attention, or feature attention. We report that variations in the strength of normalization across neurons can be explained by an extension of conventional normalization: tuned normalization. Modulation by spatial attention depends greatly on the extent to which the normalization of a neuron is tuned, explaining a neuron-by-neuron correlation between spatial attention and normalization modulation strengths. Tuned normalization also explains a pronounced asymmetry in spatial attention modulations, in which neurons are more modulated by attention to their preferred, versus their non-preferred, stimulus. However, feature attention differs from spatial attention in its relationship to the normalization mechanism. We conclude that while spatial and feature attention appear to be mediated by a common top-down attention mechanism, they are differently influenced by the sensory mechanism of normalization. iv
5 Table of Contents page Chapter 1 Introduction Chapter 2 Tuned Normalization Explains the Size of Attention Modulations. 16 Summary..17 Introduction..18 Results..21 Discussion 45 Methods...52 Chapter 3 Spatial versus Feature Attention: the Role of Normalization..59 Summary..60 Introduction..61 Results..65 Discussion 84 Methods...89 Chapter 4 Conclusion...95 Chapter 5 Bibliography...98 v
6 Table of Figures page Figure 1 Experimental design to measure normalization and attention modulations of firing rates Figure 2 Different MT neurons show different degrees of normalization and attention modulation Figure 3 Correlation between normalization and attention Figure 4 Tuned normalization can account for an asymmetry in attention effects between attending-preferred and attending-null Figure 5 Model fits of the data Figure 6 Explanatory power of the tuned normalization parameter Figure 7 Task design to measure normalization and attention modulations Figure 8 Spatial and feature attention effects are correlated across neurons with two stimuli in the receptive field Figure 9 Spatial and feature attention effects are correlated across neurons with one stimulus in the receptive field Figure 10 Spatial but not feature attention is correlated with normalization...80 Figure 11 Spatial but not feature attention effects are stronger with multiple stimuli vi
7 Acknowledgements Chapter 2 was written in collaboration with Supratim Ray and John H. R. Maunsell. Chapter 3 was written in collaboration with John H. R. Maunsell. We thank Marlene Cohen, Kaushik Ghose, Mark Histed, Incheol Kang, and Patrick Mayo for helpful comments and discussions. We also thank Vivian Imamura, Jon Hendry, Steven Sleboda, and Anna Chambers for technical assistance. This work was supported by National Institutes of Health R01EY and the Howard Hughes Medical Institute. vii
8 Chapter 1: Introduction A visual scene is full of sensory information, only some of which is relevant to an observer s behavior. The cognitive process of visual attention allows an observer to select a limited portion of a visual image for concentrated processing (Maunsell, 1995; Kastner and Ungerleider, 2000; Treue, 2003). Here we study how the allocation of visual attention interacts with automatic sensory processes to produce perception (Posner and Petersen, 1990). We do so by controlling the allocation of attention while measuring the effect of this cognitive process on the responses of cortical neurons to visual stimuli. Behavioral effects of attention Attention is a powerful process that limits the visual system s intensive processing to the analysis of selected sensory signals. This operation can have strong and measurable effects on the detection or discrimination of visual stimuli. While many psychophysical studies have demonstrated how the allocation of attention can improve the perception of visual stimuli, the selection of certain visual components for further processing can have negative effects, as well (for review, see Carrasco, 2006; Carrasco, 2011; Chun et al., 2011). For example, Simons and Chabris (1999) demonstrated that when observers viewed a video of people playing catch and were instructed to attend to the number of passes between the people in the video, a substantial proportion of the observers failed to report the presence of a person dressed in a gorilla costume walking amongst the people playing catch. One type of visual attention that has been studied extensively is spatial attention, the allocation of attention to a specific location in visual space (for review, see Treue, 1
9 2001; Yantis and Serences, 2003; Reynolds and Chelazzi, 2004). Spatial attention improves the perception of stimuli at that location (Posner, 1980; Posner and Petersen, 1990; Rensink, 2002). For example, Posner and colleagues (1980) determined that a cue that directed a subject s attention to a specific location in the visual field improved the speed and accuracy with which that subject could detect visual stimuli at that location. Another type of visual attention is feature attention, the directing of attention to a specific visual feature, such as a specific color or a direction of motion (for review, see Treue, 2001; Maunsell and Treue, 2006). Feature attention improves the perception of a specific feature at all locations in space (Saenz et al., 2002; Saenz et al., 2003; Melcher et al., 2005; Boynton et al., 2006; Kanai et al., 2006; Serences and Boynton, 2007). For example, Rossi and Paradiso (1995) reported that when an observer was discriminating the orientation of a stimulus at the center of that observer s gaze, the observer was better at detecting the presence of a peripheral stimulus only if that stimulus had the same orientation being discriminated at the fovea. Both spatial and feature attention can be allocated covertly, meaning that a subject can attend to a location or stimulus without directing his or her gaze toward it (Carrasco, 2006; Carrasco, 2011). Covert attention is an important visual function that allows an observer to monitor the environment without large and obvious eye movements (Carrasco, 2011). In the following experiments, we will manipulate covert spatial or feature attention to determine the effects of these covert forms of attention on neuronal activity. Neuronal correlates of attention in sensory cortex 2
10 The behavioral improvements associated with visual attention have been linked to a variety of neural correlates in visual cortex, which have been measured using multiple electrophysiological and neuroimaging techniques (for review, see Treue, 2001; Carrasco, 2011). In these experiments, we will use single unit electrophysiology in awake, behaving monkeys to measure the effects of covert visual attention on the firing rates of sensory neurons. The recording of neuronal activity in behaving monkeys has provided much insight into the neuronal mechanisms of visual attention, over decades of research (Maunsell, 1995). Single unit electrophysiological studies of attention have reported that directing attention to a visual stimulus or feature that matches the receptive field properties of a sensory neuron can modulate the activity of that neuron (Moran and Desimone, 1985; Motter, 1993; Motter, 1994; Desimone and Duncan, 1995; Connor et al., 1997; Treue and Martinez-Trujillo, 1999; McAdams and Maunsell, 2000; Treue, 2001; Maunsell and Cook, 2002; Martinez-Trujillo and Treue, 2004; Reynolds and Chelazzi, 2004; Maunsell and Treue, 2006; Patzwahl and Treue, 2009). For example, McAdams and Maunsell (2000) presented stimuli at two different locations on a video monitor while a monkey performed a task that directed its attention to one or the other stimulus. While the animal performed the behavioral task, the authors recorded the activity of individual neurons in visual area V4. When the monkey s attention was directed to the receptive field location of the recorded neuron, the neuron s activity increased an average of 31% over when attention was directed away from the receptive field. As the stimuli presented to the monkey were constant across attention conditions, the change in response of the recorded neuron reflected the spatial allocation of attention to the receptive field of that neuron. 3
11 For these experiments, we will record the activity of individual neurons in the middle temporal area (MT) of macaque monkeys. Many neurons in area MT, as well as in the medial superior temporal area (MST), are selective for the direction of moving stimuli within their receptive fields, and many experiments in these two visual areas have demonstrated the neuronal correlates of attention (for review, see Assad, 2003). For example, Treue and Maunsell (1996) reported that the activity of direction-selective neurons in area MT of macaque monkeys was significantly modulated by attention. When the visual stimuli presented to the monkeys were constant across different attention conditions, directing attention to the receptive field of an MT neuron instead of away from the receptive field increased the neuron s activity by an average of 19%. Top-down attention Covert spatial and feature attention are often described as forms of top-down attention, because both types of attention involve the volitional allocation of attention to specific visual components (Kinchla, 1992; Corbetta and Shulman, 2002; Baluch and Itti, 2011). The term top-down implies that the subject is in voluntary control of the allocation of attention (Baluch and Itti, 2011), an allocation that might depend on factors such as prior knowledge, expectations, or current behavioral goals (Corbetta and Shulman, 2002). Top-down attention is generally thought to involve the feedback of attentionrelated signals from higher cortical areas (Wojciulik and Kanwisher, 1999; Kastner and Ungerleider, 2000; Corbetta and Shulman, 2002; Assad, 2003; Liu et al., 2003; Treue, 2003; Yantis and Serences, 2003; Knudsen, 2007; Egner et al., 2008; Bisley and 4
12 Goldberg, 2010; Greenberg et al., 2010; Noudoost et al., 2010; Baluch and Itti, 2011; Bisley, 2011; Liu et al., 2011; Noudoost and Moore, 2011; Schafer and Moore, 2011). In particular, the frontal and parietal cortices have been implicated in the top-down control of attention (for review, see Corbetta and Shulman, 2002). For example, Moore and Fallah (2001) found that when they used intracortical microstimulation to activate sites within the frontal eye field (FEF) of monkeys, currents that were too low to evoke eye movements could still enhance a monkey s performance on a spatial attention task. While there is much support for the hypothesis that frontal-parietal areas provide the feedback of top-down, attention-related signals (for review, see Yantis and Serences, 2003; Noudoost et al., 2010) to the sensory neurons with receptive field properties that overlap with the spatial location or visual feature of interest (Treue and Martinez-Trujillo, 1999; Patzwahl and Treue, 2009), the exact mechanism by which attention signals modulate the firing rates of sensory neurons remains unclear. Many studies have investigated the mechanism of attention, proposing models to explain the way in which attention modulates the responses of sensory neurons. A brief history of these proposed models of attention will be outlined here. Models of attention: tuning curves To begin, microelectrode recordings of the action potentials of individual neurons in trained, behaving monkeys had demonstrated that the response of a cortical neuron could depend on whether or not attention was allocated to the receptive field of that neuron (for review, see Maunsell, 1995). To decipher the mechanism by which attention modulates the firing rates of sensory neurons, studies aimed to answer the question of 5
13 whether the effect of attention was to amplify the neuronal response in a multiplicative manner, or to increase the effective strength of the attended stimulus. To answer this question, studies investigated the effect of attention on various stimulus-response functions: orientation tuning curves, direction tuning curves, and contrast strength curves. If attention amplified the neuronal response in a multiplicative manner, attention would amplify the entire stimulus-response function (multiplying each point of the plot proportionately), but if attention increased the effective strength of the attended stimulus, attention would increase the selectivity of the stimulus-response function (narrowing the width of the curve). Orientation and directing tuning curves plot stimulus responses as a function of a defined visual feature, and describe how selective neurons are for that feature. Spitzer and colleagues (1988) recorded the activity of single neurons in area V4 of monkeys that were performing orientation discrimination tasks of varying difficulty. When the stimulus to be discriminated was placed in the receptive field of the recorded neuron, increasing task difficulty increased the response of the cell. The widths of the orientation tuning curves in the two different conditions of task difficulty were compared by width measurements at the half-height of the curves. The majority of the cells demonstrated a narrowing of their orientation tuning curves due to an increase in the difficulty of the task, suggesting that an increased allocation of attention during a difficult task improved the selectivity of neurons. However, the widths of the tuning curves, measured at half-height in the above study, would have been expected to change with response magnitude if there had been any response to the non-preferred orientation. This response would have caused a 6
14 nonzero asymptote of the orientation tuning curve, which would have caused measurements at half-height to yield width changes even if the firing rates at each orientation had increased proportionately. So, though it was clear from the study by Spitzer and colleagues (1988) that increasing task difficulty increased firing rates, it was unclear from the analysis whether that increase caused a proportional amplification of the tuning curve or a narrowing of the curve. McAdams and Maunsell (1999) also investigated the effect of attention on the orientation tuning curves of individual neurons in area V4, but measured the widths of the curves based on the height difference between the maximal height of the curve and the base of the curve, thus compensating for a nonzero asymptote. In this study by McAdams and Maunsell (1999), a stimulus was presented in the receptive field of the recorded neuron at various orientations to determine the orientation tuning curve of the neuron. That curve was measured with the monkey s attention directed either at the stimulus inside the receptive field of the recorded neuron, or at a stimulus outside of the receptive field. When comparing the neuron s responses in these two attention conditions, they did not find any consistent differences in the widths of the orientation tuning curves, which would have indicated a change in the neuron s orientation selectivity due to attention. Instead, they found that attention directed to the stimulus inside of the receptive field increased the neuron s response to each of the orientations. Further analysis determined that the firing rates at each orientation increased in proportions indistinguishable from one another, consistent with a multiplicative scaling of the orientation tuning curve due to attention. Furthermore, when Treue and Martinez-Trujillo (1999) performed a similar study 7
15 but with directionally selective MT neurons, they found that moving the focus of attention from a stimulus outside of the receptive field of the recorded neuron to a stimulus inside of the receptive field did not narrow the direction tuning curve of the neuron. Instead, they also found that attention increased the neuronal responses to all of the different directions of motion proportionately, causing a multiplicative amplification of the direction tuning curve. Models of attention: contrast response functions The question of how attention affects response functions become further complicated as studies turned to the question of how attention affects contrast response functions. Contrast response functions plot neuronal responses as a function of increasing stimulus contrast. These studies asked whether attention increased the neuronal responses to all contrasts in a multiplicative manner, or increased neuronal responses in a manner similar to increasing the contrast of the attended stimulus, which would cause a leftward shift of the contrast function. If attention caused a multiplicative increase in the contrast function, attention would have the greatest effect at high contrasts. If attention caused a leftward shift of the contrast function, attention would have the greatest effects at intermediate contrasts. Reynolds and colleagues (2000) investigated this question by studying the effect of attention on the contrast response function of neurons in area V4. They called a leftward shift of the contrast function a contrast gain model and a multiplicative amplification of the contrast function a response gain model. To distinguish between the two models, they presented stimuli of a range of luminance contrasts one at a time in 8
16 the receptive field of a V4 neuron and plotted the neuronal contrast function. The monkey s attention was directed either toward or away from the receptive field of the recorded neuron. While attention caused the largest increase in firing rate at a low contrast near the contrast-response threshold, the highest contrast tested did not cause any significant increase in firing rate. Though the data were not fit to either of the proposed models, the study concluded that the attention effects looked more like a contrast gain, as the effects of attention were greater in response to the lower contrasts than in response to the higher contrasts. Reynolds and colleagues (2000) did not see significant attention effects in area V4 when using high contrast stimuli, in agreement with the contrast gain model. However, other studies reported significant attention effects in response to stimuli of high contrast (Treue and Maunsell, 1996; Seidemann and Newsome, 1999; Recanzone and Wurtz, 2000; Cook and Maunsell, 2002; Cook and Maunsell, 2004; Wegener et al., 2004). For example, Treue and Maunsell (1996) presented high-contrast dot stimuli inside of the receptive fields of neurons recorded in either area MT or area MST. Directing attention to the bright stimulus inside of the receptive field increased the activity of MT neurons by an average of 19% (also described above), and increased the activity of MST neurons by an average of 40%. Seidemann and Newsome (1999) and Cook and Maunsell (2002) used bright random dot stimuli and reported significant modulations of neuronal responses due to attention in area MT and the ventral intraparietal area (VIP), respectively. It is difficult to directly compare these disparate results across multiple studies because the different studies used different behavioral tasks, visual stimuli, and methods 9
17 of analysis. For example, the above study by Seidemann and Newsome (1999) found that attention did not modulate firing rates during the initial, transient response of a neuron, but only during the sustained response of a neuron, 300 ms after stimulus onset. Reynolds and colleagues (2000) averaged the neuronal response across a 400 ms time interval post-stimulus onset, and did not report any significant attention effects at high stimulus contrasts. However, they did find a significant attention effect at high contrasts late in the neuronal response, 200 to 300 ms after stimulus onset. This 14% increase in neuronal response during the sustained portion of the response was significant, but the effect was diluted out in the final average of the response over a 400 ms time frame. It seems that stimulus presentation and analysis methods have the potential to be deciding factors in determining whether an attention effect is significant or not. To reconcile the conflicting data described above, Williford and Maunsell (2006) collected neuronal data in area V4, and unlike Reynolds and colleagues (2000), fit the contrast response function effects to each of the proposed models of attention, allowing a comparison of the fits of the data between the different models. They determined that no one model of attention effects fit the population data better than the other tested models. Their conclusion was that the attention effects seen in V4 with single stimuli were too small to give a clear indication of which model best described the effects of attention. Models of attention: multiple stimuli in the same receptive field One obvious solution to the problem of small attention effect sizes would be to test neurons in cortical areas higher up in the hierarchy of the visual system, as later visual areas tend to demonstrate stronger modulations due to attention (for review, see 10
18 Maunsell and Cook, 2002). However, neurons in later visual areas also tend to have more complex response properties, making it difficult to present optimal stimuli to these neurons. An alternate solution is to place multiple stimuli in a single receptive field. Studies have reported that attention can have larger effects when shifted between two stimuli within the same receptive field, than when shifted from outside of the receptive field to a single stimulus within the receptive field (Moran and Desimone, 1985; Treue and Maunsell, 1996; Luck et al., 1997; Reynolds et al., 1999; Treue and Maunsell, 1999). For example, in the study by Treue and Maunsell (1996) discussed earlier, directing attention to a stimulus in the receptive field of a neuron in area MT or area MST increased firing rates by averages of 19% and 40%, respectively. However, in the second portion of the study, the monkeys were instructed to attend to one of two stimuli within the same receptive field. One stimulus was moving in the preferred direction of motion of the neuron while the other stimulus was moving in the non-preferred, or null direction of motion. Attention to the preferred of the two stimuli instead of to the null stimulus increased firing rates by an average of 86% for area MT neurons and 113% for area MST neurons. Martinez-Trujillo and Treue (2002) used this method of directing attention between stimuli in the same receptive field to address the question of which model is best fit by the effects of attention on contrast response functions. In this study, two stimuli were placed in the receptive field of an MT neuron, one moving in the preferred direction of motion of the neuron and the other moving in the null direction. A similar pair of stimuli was placed outside of the receptive field for comparison. Attention was always 11
19 directed at the null stimulus of a pair, which was always presented at maximum contrast, while the contrast of the preferred stimulus of the pair was varied to determine the contrast response function. When attention was directed to the null stimulus inside of the receptive field instead of to the null stimulus outside of the receptive field, there were large attention effects at intermediate contrasts, and only negligible effects at high contrasts, indicating a contrast gain effect of attention. However, these data were also well explained when fit to a response gain model. Models of attention: sensory interactions While using multiple stimuli within the same receptive field has the advantage of resulting in stronger attention effects, the use of multiple stimuli also creates a variable that could potentially interfere with measurements of attention effects: sensory interactions. When a receptive field contains multiple stimuli, these stimuli interact even without attention. Reynolds and Desimone (2003) studied these sensory interactions in V4 neurons, placing two stimuli in the receptive field of a neuron, one preferred stimulus and one null stimulus. Attention was directed outside of the receptive field so that spatial attention could not affect the neuronal responses. A neuron responded weakly when the null stimulus was presented alone in the receptive field, and strongly when the preferred stimulus was presented alone in the receptive field. When both stimuli were presented together, the response of the neuron fell between the responses to the two stimuli individually. When the contrast of one stimulus was made to be higher than the contrast of the other stimulus, the firing rate of the neuron was weighted toward the response that neuron had exhibited when that stimulus of higher contrast had been presented alone. 12
20 Because sensory interactions occur in the absence of attention effects, a study that uses multiple stimuli in the same receptive field must consider the effects of these sensory interactions when measuring the effects of attention. For example, if sensory interactions are dependent on the contrasts of the stimuli, it could potentially be difficult to distinguish these effects from attention effects across different contrasts. While many studies have proposed qualitative descriptions of the relationship between sensory interactions and attention (for review, see Desimone and Duncan, 1995; Reynolds and Chelazzi, 2004), recent studies that have incorporated the model of divisive normalization have made considerable strides in quantifying the roles of sensory processes and top-down attention processes. These studies will be discussed next. Models of attention: normalization A study by Lee and colleagues (1999) used psychophysical data to propose that attention is related to normalization, a sensory interactions mechanism. Recent models of electrophysiological and fmri data have suggested that modulation by attention depends on normalization (Boynton, 2009; Lee and Maunsell, 2009; Reynolds and Heeger, 2009). Normalization is a form of gain control used throughout the brain, limiting the dynamic range of the responses of a neuron (Barlow, 1953; Kuffler, 1953; Baccus and Meister, 2002; Heimel et al., 2010; Olsen et al., 2010; Ohshiro et al., 2011; Papadopoulou et al., 2011). Normalization is a useful sensory mechanism because it prevents the responses of a neuron from saturating, and thus becoming less informative (Heuer and Britten, 2002). Normalization has been well documented in the visual system (Heeger, 1992; Britten and Heuer, 1999; Heuer and Britten, 2002). Because of normalization, when the 13
21 total contrast in the receptive field of a neuron increases, the response of the neuron does not keep increasing linearly (Heuer and Britten, 2002). Instead, as the contrast increases, the gain control of normalization increases, resulting in a nonlinear neuronal response across contrasts. An influential model of normalization, the divisive normalization model, hypothesizes that the response of a neuron is reduced in proportion to the pooled activity of other neurons in the neighborhood (Heeger, 1992; Carandini and Heeger, 1994; Carandini et al., 1997; Simoncelli and Heeger, 1998). The pooled activity of the neighboring neurons is contrast-dependent, which explains why normalization increases with contrast. This model also explains why normalization is particularly prominent when more than one stimulus is present in the receptive field (Lee and Maunsell, 2010). The divisive normalization model explains many response properties of neurons, in particular why the response of neuron to an preferred stimulus is suppressed by the addition of a non-preferred, yet excitatory, stimulus to the receptive field (Morrone et al., 1982; Bonds, 1989; DeAngelis et al., 1992; Britten and Heuer, 1999; Heuer and Britten, 2002). The non-preferred stimulus does not strongly excite the neuron, yet activates the hypothesized pool of neighboring neurons in a contrast-dependent manner. Thus the contrast of the non-preferred stimulus increases normalization, decreasing the overall response of the neuron to the preferred and the non-preferred stimulus together. Models of attention that incorporate normalization have been proposed to explain many of the effects of attention, including the effects of both spatial (Boynton, 2009; Lee and Maunsell, 2009; Reynolds and Heeger, 2009) and feature attention (Boynton, 2009; Reynolds and Heeger, 2009). 14
22 Summary The behavioral and neural effects of both spatial and feature attention have been well documented, but the mechanisms by which top-down attention signals modulate the firing rates of sensory neurons remain unclear. Recently, advances in our understanding of the mechanism of attention have involved the divisive normalization mechanism, a sensory mechanism. The next two chapters will describe experiments that investigate how top-down spatial attention signals are influenced by the process of normalization, and whether or not feature attention and spatial attention are related to the process of normalization in the same manner. 15
23 Chapter 2: Tuned Normalization Explains the Size of Attention Modulations Amy M. Ni 1, Supratim Ray 2, and John H.R. Maunsell 1 1 Department of Neurobiology, Harvard Medical School, 220 Longwood Avenue, Boston, MA 02115, USA 2 Centre for Neuroscience, Indian Institute of Science, Bangalore, India,
24 Summary The effect of attention on firing rates varies considerably within a single cortical area. The firing rate of some neurons is greatly modulated by attention while others are hardly affected. The reason for this variability across neurons is unknown. We found that the variability in attention modulation across neurons in area MT of macaques can be well explained by variability in the strength of tuned normalization across neurons. The presence of tuned normalization also explains a striking asymmetry in attention effects within neurons: when two stimuli are in a neuron's receptive field, directing attention to the preferred stimulus modulates firing rates more than directing attention to the nonpreferred stimulus. These findings show that much of the neuron-to-neuron variability in modulation of responses by attention depends on variability in the way the neurons process multiple stimuli, rather than differences in the influence of top-down signals related to attention. 17
25 Introduction Attention improves perception of visual stimuli (Posner, 1980; Treisman and Gelade, 1980; Posner and Petersen, 1990; Rensink, 2002; Carrasco, 2011; Chun et al., 2011) and enhances the firing rate of cortical sensory neurons that respond to attended stimuli (Desimone and Duncan, 1995; Treue, 2001; Maunsell and Cook, 2002; Yantis and Serences, 2003; Reynolds and Chelazzi, 2004). Modulations of firing rate are thought to depend on top-down feedback of attention-related signals from higher cortical areas (Corbetta and Shulman, 2002; Assad 2003; Treue, 2003; Knudsen, 2007; Bisley and Goldberg, 2010; Noudoost et al., 2010; Baluch and Itti, 2011). It has long been recognized that the amount that attention modulates neuronal responses tends to be greater in later stages of cortical processing (see Maunsell and Cook, 2002). Even within a single cortical area there is considerable variability in modulation by attention across neurons (Moran and Desimone, 1985; Treue and Maunsell, 1996; Reynolds et al., 1999; Recanzone and Wurtz, 2000; Martinez-Trujillo and Treue, 2002; Ghose and Maunsell, 2008; Lee and Maunsell, 2009; Lee and Maunsell, 2010). This variance is seen even when neurons are recorded simultaneously (Cohen and Maunsell, 2010), indicating that it does not arise from varying levels of behavioral effort. The source of this variability in modulation by attention is unknown. Recent models of electrophysiological and fmri data have suggested that modulation by attention depends on normalization (Boynton, 2009; Lee and Maunsell, 2009; Reynolds and Heeger, 2009), an idea that has also been proposed using psychophysical data (Lee et al., 1999). Normalization is a form of gain control that limits 18
26 the dynamic range of the responses of a neuron, particularly when more than one stimulus is present in the receptive field (Barlow, 1953; Kuffler, 1953; Baccus and Meister, 2002; Heimel et al., 2010; Olsen et al., 2010; Ohshiro et al., 2011; Papadopoulou et al., 2011). An influential divisive normalization model hypothesizes that the response of a neuron is reduced in proportion to the pooled activity of other neurons in the neighborhood (Heeger, 1992; Carandini and Heeger, 1994; Carandini et al., 1997; Simoncelli and Heeger, 1998). This model explains a broad range of response properties, in particular why the response of a neuron to an optimal stimulus is suppressed by the addition of a non-optimal, yet excitatory, stimulus to the receptive field (Morrone et al., 1982; Bonds, 1989; DeAngelis et al., 1992; Britten and Heuer, 1999; Heuer and Britten, 2002). Models of attention that incorporate divisive normalization explain the effects of attention across a broad range of behavioral and stimulus conditions (Boynton, 2009; Lee and Maunsell, 2009; Reynolds and Heeger, 2009; Lee and Maunsell, 2010). A relationship between normalization and modulation by attention suggests an explanation for the variability in modulation by attention across neurons. Lee and Maunsell (2009) reported that the strength of the normalization mechanism can vary between neurons in the middle temporal area (MT) of macaque monkeys, and that this variance is associated with differences in attention modulation: the more potent the normalization mechanism, the greater the attention modulation. They showed that this correlation could be explained by a normalization model in which attention modulates the contrast at which neuronal responses saturate. Neurons with the most saturated responses were the least affected by normalization and attention. However, in the current study we extended the range of conditions tested and obtained new electrophysiological data that 19
27 could not be accounted for using the prior model. Instead, we show that the covariance between the strength of the normalization and modulation by attention across all conditions is well explained by variance in the amount of tuned normalization. Tuned normalization (Rust et al., 2006, Carandini et al., 1997) is a variant of divisive normalization that does not weight all stimuli equally. Instead, non-preferred stimuli are given less weight in normalization. Prior studies describing normalization have not addressed how tuned normalization affects modulation by attention (Boynton, 2009; Lee and Maunsell, 2009; Reynolds and Heeger, 2009). We found that the strength of tuned normalization varies considerably across MT neurons, and that modulation by attention depends greatly on the extent to which the normalization of a neuron is tuned. Tuned normalization also explains a pronounced asymmetry in attention modulation that occurs when attention is directed to a preferred or non-preferred stimulus in the receptive field. These results suggest that much of the variance in attention modulation between neurons may arise from differences in the amount of tuned normalization they express, rather than differences in the strength of the top-down attention signals that they receive. 20
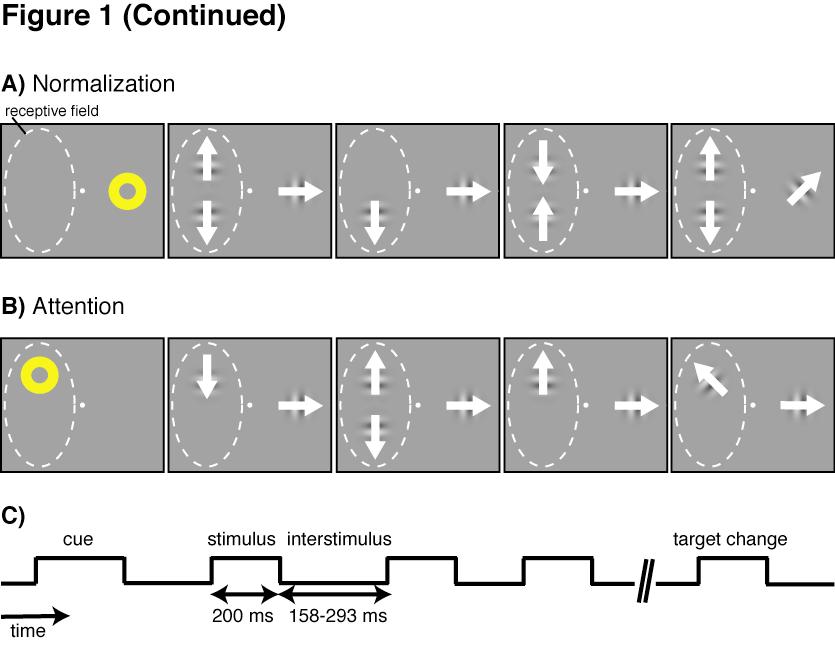
28 Results We studied how well tuned divisive normalization can explain variation in attention modulation across neurons by recording the activity of isolated neurons in the middle temporal area (MT) of two rhesus monkeys (Macaca mulatta). We measured separately the strength of modulation by attention and strength of normalization for 117 isolated neurons (68 from monkey 1, 49 from monkey 2). Monkey 1 had been used in previous experiments, but none of the data presented here have been previously reported. Measuring normalization and attention modulation strengths We trained each monkey to do a direction change-detection task (Figure 1). The animal brought its gaze to a spot at the center of a video monitor and maintained fixation there while other stimuli were presented peripherally. After the animal acquired the fixation spot, it was cued by a yellow annulus to attend to one of three locations on the monitor. Two locations were within the receptive field of the neuron being recorded. The third location was on the opposite side of the fixation point. All three stimulus locations were equidistant from the fixation point. Following the extinction of the cue, a series of drifting Gabors was presented at each of the three locations simultaneously. Each set of Gabors (one drifting Gabor per location) was presented for 200 ms with successive sets simultaneously separated by interstimulus periods that varied randomly between ms (Figure 1C). The Gabors presented at the two locations within the receptive field drifted in either the preferred or null (180 from preferred) direction of the neuron, and the Gabors presented at the location outside of the receptive field drifted in the intermediate direction. The monkey was rewarded for detecting when a Gabor appeared 21
29 Figure 1: Experimental design to measure normalization and attention modulations of firing rates During each trial, the monkey was cued to attend to one of three locations (two within and one outside the receptive field of the MT neuron being recorded) while series of drifting Gabor stimuli (each having 0%, 50%, or 100% contrast) were presented simultaneously at the three locations. The Gabors presented within the receptive field drifted in either the preferred or null (180 from preferred) direction of the neuron, and the Gabors presented outside the receptive field drifted in the intermediate direction. The monkey was rewarded for detecting when a Gabor appeared at the cued location with a slightly different (< 90 ) drift direction. A) To measure the normalization modulation strength of the neuron, attention was directed outside of the receptive field. B) To measure the attention modulation strength of a neuron, attention was directed to a location within the receptive field. C) Following the cue, stimuli were briefly presented multiple times in a trial, with blank interstimulus periods of random duration separating the presentations. 22
30 23
31 at the cued location with a slightly different (< 90 ) drift direction than the preceding stimulus at that location. Slight changes in the direction of motion occurred at all three locations, but the trial ended without reward if the animal responded to a slight change at an uncued location. Occurrences of direction changes at the cued location were exponentially distributed in time within the trials to encourage the animal to maintain a constant level of attention throughout each trial. To measure the effect of normalization for each neuron (Figure 1A), we collected data while the animal was cued to attend to the location outside of the receptive field, so that spatial attention did not modulate the neuron s rate of firing. To prevent feature attention from modulating the response, the Gabors presented at the cued location always drifted in the same direction, which was intermediate between the preferred and null directions of the neuron. While attention was directed outside the receptive field, series of Gabors were presented at the two locations within the receptive field. Whenever a pair of Gabors appeared in the receptive field, one drifted in the preferred direction for the neuron and the other drifted in the null direction, but the locations for the preferred and null stimuli were pseudorandomly selected on each presentation. Additionally, each receptive field stimulus had a pseudorandomly selected contrast of 0, 50, or 100%. Using 0% contrast meant that stimuli sometimes briefly appeared alone in the receptive field. The stimulus presentations were short (200 ms; Figure 1C) so that the animal did not have time to adjust its attention based on the contrast or number of Gabors that appeared (Williford and Maunsell, 2006; Lee and Maunsell, 2009; Lee and Maunsell, 2010). To measure the effect of spatial attention for each neuron (Figure 1B), the 24
32 animal's attention was directed to one of the two locations within the receptive field. The drifting Gabors within the receptive field were independently and pseudorandomly set to a contrast of 0 or 100% on each presentation. One Gabor within the receptive field drifted in the preferred direction and the other drifted in the null direction. For most neurons (72 of 117) drift direction was pseudorandomly assigned to the receptive field locations for each short stimulus presentation so that the animal did not have time to adjust its attention based on the direction at the attended location during the short stimulus presentation. If the animal responded to a direction change from preferred to null or vice versa (i.e., 180 direction change) the trial was terminated without reward. For the remaining neurons (45/117) the locations of the preferred and null directions were fixed, but results from those neurons were not significantly different. In either case, the animal was rewarded only for detecting a small change (< 90 ) in the drift direction at the cued location. By presenting the Gabors at 0 or 100% contrast, we could measure attention with one or two stimuli in the receptive field. Tuned normalization Different MT neurons showed different degrees of normalization. Figure 2A shows responses from a neuron with pronounced normalization. The average response to a stimulus moving in the preferred direction (in either receptive field location; thick black line) was substantially reduced when a null stimulus was added to the other receptive field location (dashed line). The response to preferred and null stimuli together was approximately the average of the responses to the preferred stimulus alone (thick black line) and the null stimulus alone (gray line). 25
33 Figure 2: Different MT neurons show different degrees of normalization and attention modulation A) Averaging neuron: for neuron 1, peristimulus time histograms (PSTH) show that the average response to the preferred and null stimuli together (dashed line) was approximately the average of the responses to the preferred stimulus alone (thick black line) and null alone (gray line). B) Winner-take-all neuron: for neuron 2, the response to the preferred stimulus alone (thick black line) was only slightly reduced when a null stimulus was added to the receptive field (dashed line), though the neuron hardly responded to the null stimulus alone (gray line). C) A histogram displaying the normalization modulation indices (MI) of the population illustrates that MT neurons span a range of normalization strengths from winner-take-all to averaging (dashed lines indicate respective ideal MI). D) Attending the preferred (red line) versus the null (green line) of two stimuli in the receptive field greatly modulates the firing rates of neuron 1 (A). E) Attention does not strongly modulate firing rates of neuron 2 (B). F) A histogram displaying attention MI of the population illustrates that MT neurons span a range of attention modulation strengths. A,B,D,E) For all PSTH: arrows indicate the two measurements (X, Y) taken to calculate an MI, (X Y) / (X + Y); thick bars along the x- axis indicate the timing of the stimulus presentation; each PSTH was smoothed by a Gaussian window (SD 10 ms); both dotted and thin black lines are plotted in each PSTH, dotted lines indicate the response to the preferred and null stimuli together with attention outside of the receptive field, thin black lines indicate the spontaneous firing rate. 26
34 27
35 An intermediate response of this sort is expected from normalization and can be described by the equation (modified from Carandini et al., 1997): R P,N = c PL P + c N L N c P + c N +, (1) where c P and c N are the contrasts of the two Gabors, L P and L N are the responses of the linear receptive field to the individual Gabors at unit contrast, and is a positive term that represents the semisaturation constant for the contrast response function of the neuron. The divisive normalization of the neuron s firing rate is mediated by the denominator, with c P and c N representing the normalization activity associated with the preferred and the null stimuli. In this equation, the neuron's preference for one direction of motion over the other is captured by L P and L N in the numerator, but the stimulusrelated terms in the denominator depend only on the contrast of the stimuli, irrespective of the direction of motion, and are therefore "untuned" in terms of the direction of stimulus motion. This equation does an excellent job of capturing the inhibition of the firing rate due to the null stimulus for neurons such as the one shown in Figure 2A, which effectively averages the responses to preferred alone and null alone when they appear together. Other MT neurons were less affected by the addition of a null stimulus to a preferred stimulus. For another neuron (Figure 2B), the average response to the preferred stimulus alone (thick black line) was only slightly reduced when a null stimulus was added to the receptive field (dashed line), although the neuron responded hardly at all to the null stimulus alone (gray line). For this neuron, the response to preferred and null 28
36 together was much closer to the response to the preferred stimulus alone than it was to the average of the responses to preferred alone and null alone. The response of this neuron was therefore more like a "winner-take-all" response, with the stronger individual response determining the response to the pair. For most MT neurons, the effect of adding a null stimulus to a preferred stimulus fell between averaging (neuron 1, Figure 2A) and winner-take-all (neuron 2, Figure 2B). To quantify the strength of normalization for each neuron, we calculated a modulation index based on responses to different stimuli, [(Preferred Null) (Both Null)] / [(Preferred Null) + (Both Null)]. When stimuli have contrasts that are well into the upper saturation of the contrast response function (c P = c N >> ), as is generally the case for contrasts of 50% and 100% in MT (Sclar et al., 1990), this index is 0.33 for averaging neurons that respond to preferred and null together with a response that is the average of the responses to preferred and null presented individually, and 0 for winnertake-all neurons that give the same response to the preferred and null together as they do to the preferred alone. Correspondingly, the normalization modulation indices for the neurons in Figures 2A and B were 0.32 and The histogram in Figure 2C plots the distribution of normalization modulation indices for all 117 MT neurons, and shows that MT neurons spanned the full range of normalization from averaging to winner-take-all, and some distance on either side. This range of behaviors from MT neurons cannot be explained by differences in selectivity for preferred over null stimuli. Neurons with winner-take-all behavior are usually highly direction selective (e.g., Figure 2B, see below), as are most MT neurons. 29
37 We found no correlation between normalization modulation index and direction selectivity modulation index [(Preferred Null) / (Preferred + Null)] across the population of MT neurons (R = 0.11, p = 0.25). Equation 1 dictates that adding a null stimulus at 100% contrast (c N = 1 >> ) to a receptive field containing a preferred stimulus also at 100% contrast (c P = 1 >> ) should always produce a response to the two stimuli together that is approximately the average of the responses to the two stimuli separately (i.e., normalization modulation index of 0.33). Consequently, Equation 1 cannot account for the range of normalization modulation indices seen among MT neurons (Figure 2C). The differences between MT neurons can be readily explained by tuned normalization, in which different stimuli contribute differentially to normalization. Tuned normalization has been described for MT before (Rust et al., 2006), and can be captured by adding a term that adjusts the contributions of different stimuli to normalization (modified from "anisotropic normalization" of Carandini et al., 1997): R P,N = c PL P + c N L N c P + c N + (2) Here scales how much the null stimulus contributes to normalization relative to the preferred stimulus. When is 1 an average response results, and when is 0 the response is winner-take-all. We will take this approach to explain the variability in the normalization of MT neurons, and show that this variability in tuned normalization accounts for much of the variability in the attention modulation of MT neurons. Normalization and attention modulation strengths are correlated 30
38 Differences in normalization between neurons were correlated with differences in the strength of modulation by attention. Figures 2D and E plot the effects of spatial attention on the responses of neurons 1 and 2 (Figures 2A and B). These neurons differed greatly in the extent to which they were modulated by attention. When both the preferred and the null stimuli were presented in the receptive field of neuron 1 (Figure 2D), responses were much stronger when attention was directed to the location containing the preferred stimulus (red) than when attention was directed to the location containing the null stimulus (green). Strong modulation from shifting spatial attention between preferred and null stimuli in the receptive field has been described many times in a variety of cortical areas (Moran and Desimone, 1985; Treue and Maunsell, 1996; Reynolds et al., 1999; Recanzone and Wurtz, 2000; Martinez-Trujillo and Treue, 2002; Ghose and Maunsell, 2008; Lee and Maunsell, 2009; Lee and Maunsell, 2010). In contrast, Figure 2E shows that attention had much less effect on the responses of neuron 2 (Figure 2B). For each neuron, we calculated an attention index, (Attend Preferred Attend Null) / (Attend Preferred + Attend Null). The attention indices for the neurons in Figures 2D and E are 0.27 and As shown in Figure 2F, the responses of some MT neurons were virtually unmodulated by attention (0) while the responses of others were modulated by a factor of three (0.5) or more. Modeling studies have suggested that modulation by attention may depend on normalization mechanisms (Boynton, 2009; Lee and Maunsell, 2009; Reynolds and Heeger, 2009) and one neurophysiological study showed that there is a neuron-to-neuron correlation between the strength of normalization of MT neurons and the strength of their modulation by spatial attention (Lee and Maunsell, 2009). The current data confirm that 31
39 neurons with pronounced normalization modulation also show pronounced modulation by attention. Figure 3 shows the relationship between normalization and attention modulations across neurons in our sample (R = 0.53, p < 10-8 ). As normalization approaches zero, modulation by attention approaches zero. It is important to recognize that a correlation between modulation by normalization and modulation by attention could depend in part on differences in direction selectivity: a neuron that did not discriminate between preferred and null directions and therefore responded equally to both would not be expected to show any normalization or any attention modulation. However, the direction selectivities (preferred:null) of the MT neurons are high (average of 9:1 in our sample), and we found no significant correlation between the normalization modulation indices for the neurons we recorded and their direction selectivity (R = 0.11, p = 0.25). Furthermore, the partial correlation between normalization and attention modulation controlling for variance in direction selectivity across neurons remains highly significant (R = 0.52, p < 10-8 ). Because tuned normalization affects how a neuron weights two different stimuli that drive that neuron with different efficacy, we hypothesize that the variance in tuned normalization is the source for the variance in attention modulation. For example, because a winner-take-all neuron largely disregards the presence of a non-preferred stimulus, attention to a non-preferred stimulus may have little effect on the response of that neuron. In contrast, an averaging neuron that gives equal weight to preferred and null stimuli may show much wider swings in response when attention modulates inputs associated with one or the other. 32
40 Figure 3: Correlation between normalization and attention The strength of normalization modulation is correlated with the strength of attention modulation across the population of MT neurons. The normalization modulation indices of ideal winner-take-all and averaging neurons are indicated by solid and dashed lines, respectively. 33
41 Asymmetry of attention modulation strengths within neurons Tuned normalization might also account for a striking asymmetry in attention effects that we observed in our data. With two stimuli in the receptive field, modulation by attention is greater with attention to the preferred versus attention to the null stimulus in the receptive field. Figure 4A shows the average population responses to different stimulus and attention conditions. As described for individual neurons above (Figure 2), when the animal's attention is directed outside the receptive field the response to the preferred and null stimuli in the receptive field (dashed line) is intermediate between the response to preferred alone (thick black line) or null alone (gray line). Attention to the preferred stimulus in the presence of the null stimulus increases the response (red), bringing it close to the response to the preferred stimulus alone (thick black line). This effective elimination of the non-preferred stimulus by attention has been described previously (Reynolds and Desimone, 1999; Reynolds et al.,1999; Recanzone and Wurtz, 1999). However, attention to the null stimulus in the presence of the preferred stimulus decreases the response relatively little (green), leaving it well above the response to the null stimulus alone (gray line). With two stimuli in the receptive field, the average attention index for attention to the preferred stimulus, (Attend Preferred Attend Out) / (Attend Preferred + Attend Out), is The average attention index for attention to the null stimulus, (Attend Out Attend Null) / (Attend Out + Attend Null), is Attention modulation with attention to the preferred stimulus is greater across the population of MT neurons (paired t-test: p < 0.01). 34
42 Figure 4: Tuned normalization can account for an asymmetry in attention effects between attending-preferred and attending-null A) Normalized population PSTH. Compared to the response to two stimuli in the receptive field when attention is directed outside of the receptive field (dashed line), the modulation of neuronal responses due to attending the preferred stimulus (red line) is greater than the modulation due to attending the null stimulus (green line) for the population. B) When both the preferred and the null stimuli are in the receptive field, attention to the preferred stimulus (y-axis) makes the firing rate of a neuron indistinguishable from the firing rate for the preferred stimulus presented alone (x-axis). C) Attending to the null of the two stimuli (y-axis) does not return the firing rate of a neuron to the firing rate for the null stimulus presented alone (x-axis). 35
43 36
44 Though attention to one of two stimuli in a receptive field has been hypothesized to almost completely eliminate the influence of the unattended stimulus, regardless of whether the attended stimulus is preferred or null (Reynolds and Desimone, 1999; Reynolds et al.,1999), the asymmetry in attention effects in MT is further illustrated in Figures 4B and C. The scatterplots show the effects of attention to the preferred and null stimuli for each MT neuron recorded. When the preferred and null stimuli are both in the receptive field, attention to the preferred stimulus makes the firing rate of the neuron indistinguishable from the firing rate for the preferred stimulus presented alone (paired t- test: p = 0.10, Figure 4B). However, attending to the null stimulus does not decrease the firing rate of the neuron to the level of the firing rate for the null stimulus presented alone (paired t-test: p < 10-21, Figure 4C). Because the preferred and the null stimuli were presented pseudorandomly and very briefly at the attended location within trials, this difference cannot be attributed to different levels of attention to the two types of stimuli. We found, however, that tuned normalization predicts a strong asymmetry in attention modulation. A tuned normalization model of attention To explore the extent to which tuned normalization can explain the range and asymmetry of attention modulations in MT, we extended Equation 2 to include modulation by attention: R P Att,N = c PL P + c N L N c P + c N + (3a) 37
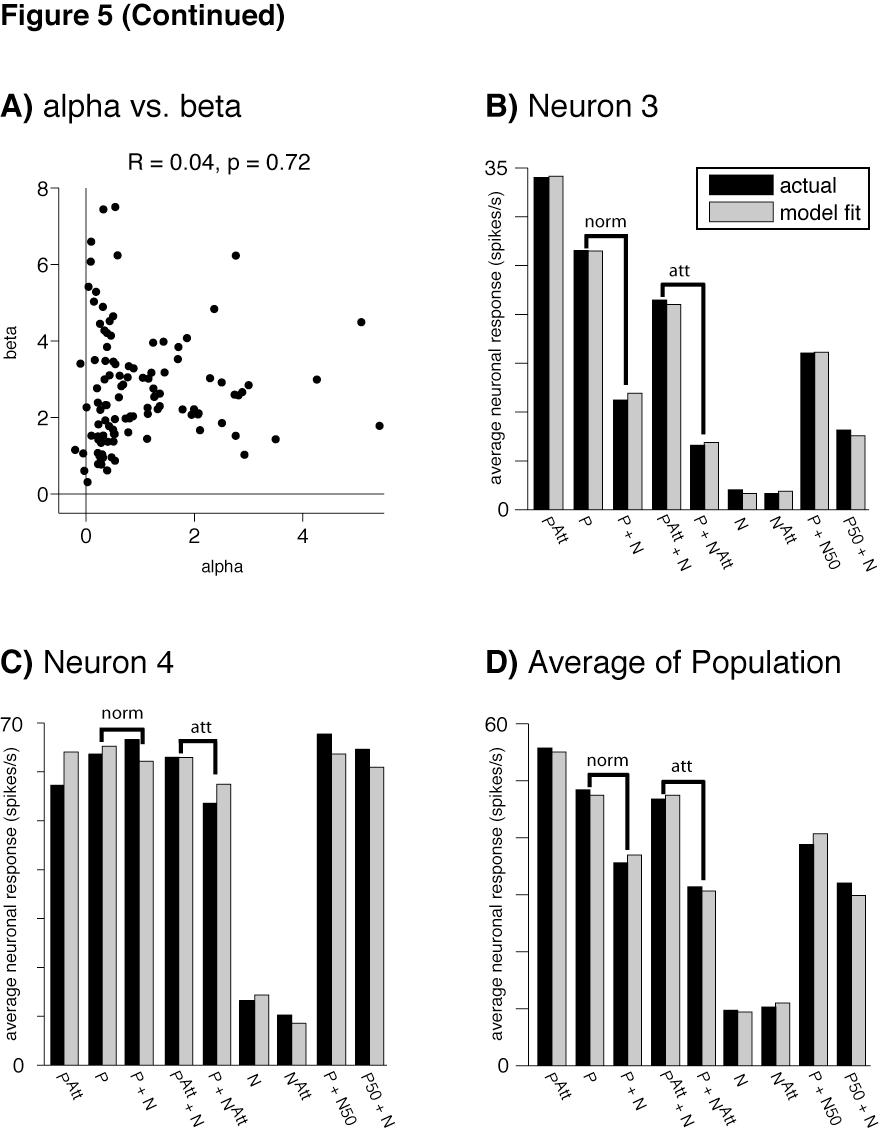
45 R P,N Att = c PL P + c N L N c P + c N + (3b) In these equations is a factor that increases the weight of the attended stimulus (the preferred stimulus in the case of 3a and the null stimulus in the case of 3b). To determine how well the model fit the neuronal data, average firing rates per neuron for nine stimulus conditions (plotted along the x-axes in Figures 5B-D) were fit to Equations 3a and 3b. Variations in the parameter correspond to neuron-to-neuron differences in the top-down attention signal. There are two hypothetical mechanisms by which attention modulations of firing rates could become correlated with the strength of normalization of the MT neurons: 1) the top-down attention signal per sensory neuron could co-vary with the normalization strength of each sensory neuron, or 2) variance in the tuned normalization mechanism alone could result in attention modulation variance across the neurons. To test the first hypothesis, we determined whether or not the top-down attention signal parameter ( ) is correlated with the tuned normalization parameter ( ) across neurons. When and are fit as free parameters in Equation 3 (along with free parameters L P, L N, and ) the value of is not significantly correlated with (Figure 5A). The attention signal ( ) did not co-vary with the normalization strength (normalization modulation index) of each sensory neuron (R = 0.06, p = 0.55). 38
46 Figure 5: Model fits of the data A) When the top-down attention signal parameter ( ) is fit as a free parameter of the model, determinations are not correlated with determinations of, the tuned normalization parameter (seven neurons were excluded due to extreme parameter fits ( or > 10), but for the remaining 110 neurons plotted here, was still not correlated with ). B) Even with fixed at 2.75, the model (gray) provided an excellent fit for the average firing rates (black) of an example averaging neuron, C) as well as for an example winner-take-all neuron. D) The model also provided an excellent fit of the population, fitting the asymmetrical attention effects of attending the preferred (P Att + N) versus the null stimulus (P + N Att ) in the receptive field, as compared to attention out of the receptive field (P + N). The indicated stimuli presented (preferred: P, null: N) were presented at 100% contrast unless otherwise noted (e.g., preferred at 100% and null at 50% contrast: P + N50), with attention ( Att ) or without attention directed to a stimulus in the receptive field. The modulations in firing rates due to normalization and attention are indicated by norm and att above the bar plots (B-D). 39
47 40
48 Therefore, in subsequent analyses we fixed at 2.75 (its mean when estimated as a free parameter) for all neurons (see Methods), to determine whether variance in the tuned normalization parameter alone could result in attention modulation variance across the neurons. Even with fixed, Equation 3 provided an excellent fit of the data based on the four remaining free parameters (, L P, L N, ). Using this approach Equation 3 explained > 99% of the variance in the mean responses for a particularly well-fit averaging neuron (neuron 3, Figure 5B), which demonstrated a strong normalization (P versus P+N) and a large attention modulation (P Att +N versus P+N Att ). Similarly, Equation 3 explained 97% of the variance in the mean responses of the particularly well-fit winner-take-all neuron (neuron 4, Figure 5C) that demonstrated minimal normalization and attention modulation. Across the entire sample of MT neurons, the average explained variance was 95% (Figure 5D). Equation 3 not only accommodates broad ranges of normalization and modulation by attention, but also accounts for the asymmetric effects of attending the preferred versus the null stimulus in the receptive field (Figure 4). Figure 5D shows that across the sample of MT neurons, attending to the preferred stimulus (P Att +N) elevated responses substantially above the responses to the same stimuli with attention directed outside the receptive field (P+N), but attending to the null stimulus (P + N Att ) caused less modulation of responses. Because the attention term ( ) was fixed for these fits, it cannot explain the difference in attention modulation between the averaging and winner-take-all 41
49 neurons shown in Figures 5B & 5C, nor the asymmetric effect of attending to preferred and null stimuli. Instead, these effects can be attributed to the tuned normalization. When neuronal responses were fit using Equation 3 (with fixed at 2.75), only the parameter associated with tuned normalization ( ) had a significant partial correlation with normalization modulation indices while controlling for the variability in attention modulation indices (Spearman's = 0.73, p < 10-19, Figure 6A) and also with attention modulation indices while controlling for the variability in normalization modulation indices (Spearman s = 0.57, p < 10-10, Figure 6B, Bonferroni correction for multiple comparisons). None of the three remaining free parameters were significantly correlated with attention modulation while controlling for the variability in normalization modulation indices (L P : R = 0.16, p = 0.10; L N : R = -0.05, p = 0.57; : R = 0.19, p = 0.04; Bonferroni corrected), nor was direction selectivity (calculated as the ratio of L P :L N, R = , p = 0.31). Correspondingly, no significant partial correlation exists between normalization and attention modulation indices when controlling for the variance in (R = 0.15, p = 0.10). The partial correlation remains significant when controlling for the variance in any other parameter (L P : R = 0.54, p < 10-9 ; L N : R = 0.50, p < 10-8 ; : R = 0.50, p < 10-8 ; L P :L N : R = 0.51, p < 10-8 ). Superficially, it might appear that attention and normalization are symmetric, and that one might equally well fix the tuned normalization term ( ) and explain variance in normalization by differences in the feedback attention signal ( ). This is not possible, however, because measurements of the strength of normalization were made in a single 42
50 Figure 6: Explanatory power of the tuned normalization parameter Only the parameter describing the strength of the tuned normalization of the neuron ( ) had a significant correlation with: A) normalization modulation indices (controlling for the variance in attention modulation indices), and (B) attention modulation indices (controlling for the variance in normalization modulation indices). 43
51 attention state with attention directed outside the receptive field. In that condition attention acts equally on both stimuli in the receptive field (Equation 2) and cannot modulate normalization. That is, attention always occurs on a background of some amount of tuned normalization, but normalization occurs in the absence of differential attention. To further ensure that the term for each neuron described tuned normalization, and not variations in the attention gain factor ( ), we also fit the firing rates for eight stimulus conditions that were recorded with attention fixed to the stimulus location outside of the receptive field (see Methods). The average explained variance for the population of neurons using these eight single and paired stimulus conditions was 97%. The terms from these fits were highly correlated with those from the fit to the normalization conditions plus the four attention conditions illustrated in Figure 4 (R = 0.81, p < ). Therefore, directing attention to the receptive field of each neuron did not strongly modulate the value of. Furthermore, when we applied = 2.75 in Equation 3 to the parameters obtained by fitting the eight normalization conditions (attention directed away from the receptive field), 94% of the variance in average responses was explained for the four attention conditions (attention directed to the receptive field). Therefore, fitting the free parameters of the model to the normalization conditions alone, then applying = 2.75 according to Equation 3, was enough to predict the firing rate effects of attention per neuron. 44
52 Discussion Relationship between attention and normalization Our results show that a significant portion of the variance in attention modulation across neurons in MT can be attributed to variance in normalization strengths across neurons. Importantly, this correlation is not dependent on the tuning of the neurons to the individual stimuli presented. Even when neurons strongly differentiate between preferred and null stimuli, different neurons respond differently when a null stimulus is added to a preferred stimulus. This variation can be attributed to differences in tuned normalization. For neurons with normalization that is not tuned ( =1) a null stimulus that does not drive a response will nevertheless be factored into normalization, causing them to respond much less when a null stimulus is paired with preferred stimulus. For neurons with highly tuned normalization ( = 0), a null stimulus not only fails to produce a response but also is effectively prevented from contributing to normalization, such that the response to the preferred stimulus is unaffected by the addition of a null stimulus to the receptive field. Several reports have shown how normalization can explain the large modulations that are seen when attention is shifted between preferred and null stimuli in the receptive field of a neuron (Boynton, 2009; Lee and Maunsell, 2009; Reynolds and Heeger, 2009). Because responses to the preferred and null stimuli contributed both to the excitatory drive and also to divisive normalization, relatively modest modulations of the inputs associated with each stimulus are effectively amplified by the normalization mechanism. Strongly tuned normalization effectively removes a null stimulus from normalization, and 45
53 therefore removes the basis for the strong modulations by attention that can occur from shifting attention between preferred and null stimuli. When tuned normalization completely negates the null stimulus, modulation by attention is reduced to the modest level seen when shifting attention between an isolated preferred stimulus and a stimulus far outside the receptive field. The wide range of modulation by attention across our neurons could be explained based on the amount of tuned normalization ( ) even when we held the signal from attention ( ) fixed across neurons, simulating the unrealistic scenario in which attention allocation remained constant despite differences in stimulus size, location, direction, and separation. Although it has been suggested that attention might modulate responses by specifically adjusting suppressive mechanisms associated with normalization (Lee and Maunsell, 2009; Sundberg et al., 2009), our analysis shows that this might not be the case. The correlation between attention and normalization strengths across neurons can arise from attention modifying the inputs associated with the attended stimulus ( of Equation 3; see also Ghose and Maunsell, 2008). Attention did not act selectively on normalization in our model, and fitting different attention conditions did not significantly change the tuned normalization parameter ( ). Other studies Previous reports have described relationships between stimulus interactions and modulation by attention based on stimulus selectivity (Reynolds, et al., 1999; Reynolds and Desimone, 2003) or stimulus location compared to the vertical meridian (Chelazzi et al., 1998), which are distinct from the relationship we describe here. The current study 46
54 describes a relationship based on tuned normalization: when a neuron's normalization is highly tuned, adding a null stimulus to a preferred stimulus has little effect on that neuron's response, and shifting attention between the preferred and null stimuli modulates the response very little. There is an alternative way in which a second stimulus may fail to affect a neuron's response, regardless of whether normalization is tuned. If a second preferred stimulus is added to a first preferred stimulus, normalization models predict no change in response, whether that normalization is tuned or not. Correspondingly, when attention is shifted between two preferred stimuli in a neuron's receptive field, the shift will cause little modulation (Lee and Maunsell, 2010). This alternative form of correlation between stimulus interactions and modulation by attention described by prior studies (Reynolds, et al., 1999; Reynolds and Desimone, 2003) depends on presenting neurons with stimuli that evoked the same response when presented individually. Neither normalization nor attention is expected to function with two equivalent stimuli. Tuned normalization is needed to explain the failure of normalization and attention modulations in the current results, where stimuli evoked markedly different responses (an average response ratio of 9:1 for preferred versus null). Several recent reports have shown that divisive normalization models can explain a variety of attention effects (Boynton, 2009; Lee and Maunsell, 2009; Reynolds and Heeger, 2009); however, none addresses the importance of tuned normalization in determining the strength of attention modulation. A previous report from our lab (Lee and Maunsell, 2009) described the same correlation between the strength of normalization and the strength of modulation by attention across neurons reported here. However, that report did not identify tuned normalization as the source of this difference. 47
55 Instead it suggested that for some neurons the normalization mechanism could saturate at low to moderate contrasts, so that manipulating contrasts or attention when using moderate to high contrast stimuli would have no effect on the responses of those neurons. That explanation, however, cannot explain why the responses of some neurons are unaffected by adding a null stimulus to a preferred stimulus (a condition that was not examined for the neuronal responses in the prior report). Nor can it account easily for the asymmetric effects of attending to preferred and null stimuli (Figure 4, also not examined in the earlier report). For these reasons we believe that tuned normalization provides a better explanation than saturated normalization for the range of effects from normalization and attention described in this study. While the effect of tuned normalization on the modulation of responses by attention has not been previously treated, tuned normalization has been described before. Carandini and colleagues (1997) address the possibility of tuned normalization in macaque V1. They found little evidence for tuned normalization when testing neurons with superimposed gratings that had different orientations, although they noted that their study was not designed to provide a strong test of the extent of tuned normalization. Rust and colleagues (2006) used a model that included tuned normalization to account for the responses of MT neurons to plaid stimuli. They found that tuned normalization was needed to model the MT responses, and more pronounced tuned normalization was needed for pattern cells than for component cells. Their results suggest that the neurons we recorded with strong tuned normalization and little attention modulation may tend to be pattern selective cells. 48
56 Hints of tuned normalization have also been seen in the responses of V4 neurons. While the responses of most V4 neurons to a preferred stimulus are reduced by the addition of a less preferred stimulus to the receptive field, for some neurons the addition of a less preferred stimulus has little or no effect (Figure 4 of Reynolds et al., 1999). Tuned normalization might be widespread in sensory cortex and perhaps throughout cortical processing. Asymmetry of attention modulation When the effects of attention with two stimuli inside a receptive field were first described by Moran and Desimone (1985), they suggested that attention gates visual processing by filtering out irrelevant stimuli from within the receptive field. Consistent with this idea, Reynolds and Desimone (1999) reported that attention almost precisely eliminates the contribution of an unattended stimulus, whether it is preferred or nonpreferred. We found a pronounced asymmetry in the effects of attending to preferred and null stimuli in the receptive fields of MT neurons. While attention to the preferred stimulus typically brought responses close to the level produced by a preferred stimulus alone (Figure 4B), attention to the null stimulus reduced responses only moderately, leaving them well above the level produced by a null stimulus alone (Figure 4C). Although this asymmetric effect of attention can be seen in previously reported data from MT (Lee and Maunsell, 2010), we are unaware of any treatment of its origins. However, some existing models of the effects of attention can account for this asymmetry (Ghose and Maunsell, 2008; Lee and Maunsell, 2009). Tuned normalization provides a ready explanation for this asymmetric effect of attention. In Equation 3B attention to a 49
57 null stimulus can be largely discounted with tuned normalization. Its effect on direct excitatory drive is small because the stimulus is not preferred (L N ~ 0), and its effect on normalization is small because it is weighted by the tuning of the normalization ( < 1). The ability of tuned normalization to account for both the range of modulation of neuronal responses when shifting attention between a preferred and null stimulus in the receptive field and for the asymmetry of this modulation gives strong support to its importance in both sensory processing and modulation by attention. While attention to the preferred stimulus when it was paired with a null stimulus brought responses close to those seen when the preferred stimulus was presented alone, this should not be viewed as an invariant outcome from attention to a preferred stimulus. The amount by which attention modulates neuronal responses depends greatly on the effort that the subject puts into the task (Spitzer et al., 1988, Boudreau et al., 2006). It is likely that if the direction change-detection task had been easier (e.g., the changes were much larger), the monkeys would have directed less attention to the cued location. In turn, attention to the preferred stimulus would have yielded responses less than the response to the preferred stimulus by itself. Conversely, if the task had been much more difficult, the animals might have paid more attention and attention to the preferred stimulus might have caused responses to exceed the response to the preferred stimulus when it appeared alone and was not attended. We expect that the asymmetry in the modulations from attention to the preferred stimulus versus attention to the null stimulus would persist as the absolute magnitude of the modulations varied, but that will need to be tested experimentally. 50
58 Closing comments We found that tuned normalization may play an important role in determining the strength of modulation by attention for different neurons under different stimulus conditions. The biophysical mechanisms underlying tuned normalization are not known. While many studies have investigated the biophysical mechanisms underlying the normalization mechanism in general (Abbott et al., 1997; Carandini et al., 1997; Shadlen and Newsome, 1998; Sherman and Guillery, 1998; Carandini et al., 2002; Chance et al., 2002; Mitchell and Silver, 2003; Prescott and De Koninck, 2003; Carandini and Heeger, 1994; Finn et al., 2007; Buia and Tiesinga, 2008, Kouh and Poggio, 2008; Priebe and Ferster, 2008, Chaisanguanthum and Lisberger, 2011), it is unclear how neurons implement this computation. Though the current study has illustrated the relationship between spatial attention modulation strengths and the normalization mechanism, it remains unclear whether all types of attention are strongly influenced by tuned normalization. Neuronal responses to visual stimuli are also influenced by attention to stimulus features (Maunsell and Treue, 2006). Measuring the relationship between feature attention and tuned normalization could provide an important test of how universal the influence of tuned normalization is in mediating modulations by attention. Prior studies suggest that spatial and feature attention rely on different neuronal mechanisms (Hayden and Gallant, 2005; Liu et al., 2007; Schenkluhn et al., 2008; Hayden and Gallant, 2009; Zhang and Luck, 2009). Future studies measuring both normalization and feature attention effects should indicate whether normalization plays a role in feature attention modulations as well. 51
59 Methods All experiments followed the protocols approved by the Harvard Medical School Institutional Animal Care and Use Committee. Animal preparation and behavioral task Two male rhesus monkeys (Macaca mulatta) weighing 8 and 12 kg were each implanted with a head post and a scleral search coil under general anesthesia. Following recovery, each animal was trained on a motion direction change-detection task. Throughout each trial, the animal maintained fixation within ±1º of a small white spot presented at the center of a monitor (44º x 34º, 1024x768 pixels, 75 Hz refresh rate, gamma-corrected) on a gray background (42 cd/m 2 ) until the change detection. On each trial, the fixation point was presented for 250 ms, and then a yellow annulus was presented for 250 ms to cue the animal to attend to one of three locations on the monitor. Two of the locations were within the receptive field of the neuron being recorded, and the third location was at a symmetric location on the opposite side of the fixation point. All three locations were the same eccentricity from the fixation point. Next, a series of drifting Gabors was presented at each of the three locations simultaneously, each set of Gabors presented for 200 ms with successive sets separated by interstimulus periods that varied randomly between ms. The two Gabors presented inside of the receptive field were presented at locations separated by at least 5 times the SD of the Gabors (mean Gabor SD 0.45º, SD of Gabor SD 0.04º, Gabor SD range º, mean separation of Gabor centers 4.2º, SD 0.86º, range º). Receptive fields in MT are large (Desimone and Ungerleider, 1986) and thus could readily accommodate two stimuli 52
60 within them. The goal of the animal was to detect when a Gabor appeared at the cued location with a slightly different (< 90º) drift direction (target). The animal indicated this detection by making a saccade directly to the Gabor with the different drift direction within ms of its presentation. The animal was rewarded for correct change detections with drops of juice. Changes in direction occurred at the two uncued locations (distractors) with the same probability as changes in drift direction at the cued location, but the trial ended without reward if the animal responded to the distractors. The timing of the appearance of the target stimulus followed an exponential distribution (a flat hazard function for direction change) to encourage the animal to maintain an attention level that was constant with time. If a trial reached 6 s without a direction change occurring at the cued location (about 20% of trials), the trial was terminated and the animal was rewarded for maintaining fixation. For each recorded neuron, normalization and attention modulations on firing rates were measured independently in blocks, and at least two complete blocks of each data type were collected for each neuron. The degree of direction change of the target was adjusted independently for each of the three stimulus locations for each neuron using an adaptive staircase procedure (QUEST, Watson and Pelli, 1983) to maintain the behavioral performance at 82% correct across all target locations. To measure the normalization strength of a neuron, the animal was cued to the stimulus location outside of the receptive field. The Gabors presented at the cued location always drifted in the intermediate direction of motion of the neuron (orthogonal 53
61 to the preferred and null directions) until the target presentation. Of the two Gabors presented in the receptive field per stimulus presentation, one drifted in the preferred direction of the neuron and the other drifted in the opposite, null (180º from preferred) direction. Each Gabor had a pseudorandomly selected contrast of 0, 50, or 100% (except for the target stimulus which had a contrast of either 50 or 100%). Spatial attention effects were measured using a similar paradigm except that the animal was cued to one of the two locations within the receptive field, and each Gabor was independently and pseudorandomly set to a contrast of 0 or 100% per stimulus presentation. For 72 of the 117 neurons the drift directions of the two Gabors in the receptive field were pseudorandomly assigned to the preferred or the null direction, so that the stimuli in one of the receptive field locations could have either the preferred or null stimulus in different presentations. If the animal responded to a direction change from preferred to null or vice versa the trial was terminated without reward. The animal was only rewarded for detecting a small change (< 90º) in the drift direction at the cued location. For the remaining 45 of the 117 neurons the locations of the preferred and null directions in the receptive field were fixed, but the results described in this paper were not significantly different for those neurons, so the data were pooled. Electrophysiological recordings After the animals were trained on the behavioral task, a recording chamber was implanted on each animal to allow a posterior approach to MT (axis ~22-40º from horizontal in a parasagittal plane). Recordings were made with glass-insulated Platinum- Iridium microelectrodes (~1 M at 1 khz). The dura was penetrated using a guide tube 54
62 and grid system (Crist et al., 1988). Extracellular signals were filtered between 250 Hz-8 khz, amplified, and digitized at 40 khz. Action potentials from individual neurons were isolated using a window discriminator, and spike times were recorded with 1 ms resolution. Once a single neuron was isolated, the receptive field location was estimated using a hand-controlled visual stimulus. Computer-controlled presentations of Gabor stimuli were then used to measure tuning for direction (8 directions) and temporal frequency (5 frequencies) while the animal performed a fixation task. The direction that produced the strongest response was used as the preferred direction, the opposite direction was used as the null direction, and a direction 90º from the preferred direction was used as the intermediate direction. The temporal frequency that produced the strongest response was used for all of the Gabors. The temporal frequency was rounded to a value that produced an integral number of cycles of drift during each stimulus presentation, so that the Gabors started and ended with odd spatial symmetry, such that the spatiotemporal integral of the luminance of each stimulus was the same as the background. Spatial frequency was set to 1 cycle per degree for all of the Gabors. The preferred Gabor was used to quantitatively map the receptive field (3 eccentricities and 5 polar angles) while the animal performed a fixation task. The two stimulus locations within the receptive field were chosen to be at equal eccentricities from the fixation point and to give approximately equal responses, and the third location was 180º from the center point between the two receptive field locations, at an equal eccentricity from the fixation point as the other locations. 55
63 Data analysis Neurons were included in the analysis if they were held for at least two blocks each of both the normalization and attention data collection, presented in alternating blocks. Approximately 13 repetitions of each stimulus condition were collected per block. Data analysis was performed on the response period of ms after the stimulus onset. Firing rates for each stimulus condition of each neuron were determined by taking the average firing rate during this analysis period across all stimulus repetitions. Stimuli presented at the same time as a target or distractor stimulus were excluded from analysis, as were stimuli that appeared after the target, and the first one or two stimulus presentations (within 400 ms) of each stimulus series to reduce variance that could arise from stronger responses to the start of a stimulus series. Modulation indices for the modulations of firing rates reported in this study were calculated using a normalization modulation index, [(Preferred Null) (Both - Null)] / [(Preferred Null) + (Both Null)], or an attention modulation index, (Attend Preferred - Attend Null) / (Attend Preferred + Attend Null). The asymmetry in attention modulation with two stimuli in the receptive field comparing attention to the preferred versus attention to the null stimulus was determined by calculating an attention index for attention to the preferred stimulus, (Attend Preferred - Attend Out) / (Attend Preferred + Attend Out), and an attention index for attention to the null stimulus, (Attend Out Attend Null) / (Attend Out + Attend Null). The modulation index for neuronal direction tuning was calculated using a tuning index, (Preferred Null) / (Preferred + Null). All indices were determined using the average firing rate responses to the indicated stimulus 56
64 conditions with the indicated stimuli at 100% contrast. Equation 3 was fit using four free parameters (L P, L N,,, see Results for definitions). A fifth parameter ( ) was fixed at 2.75 for all of the neurons. This value was determined using two methods that produced the same result: 1) a range of possible values from 0 to 4.00 in increments of 0.25 were fit to the model and the fixed value was determined as the value that allowed the best fit of the model, and 2) the fixed value was matched to the average determination when was allowed to be a free parameter. The model parameters were fit via unconstrained nonlinear optimizing that minimized the sum-of-squares error. The model parameters were constrained in the fit to be greater than 0, but there were no other constraints on the model fits. The goodness of fit of the model was calculated for each neuron as the total explained variance, which was determined by taking the square of the correlation coefficient between the estimated firing rates from the model and the firing rates of the neuron across the stimulus conditions fit by the model. For the main experiment, nine stimulus conditions were fit by the model to determine the free parameter estimations: five conditions with spatial attention directed outside of the receptive field, four conditions with spatial attention directed inside of the receptive field. As a control to ensure that the term estimations were not biased by the four stimulus conditions with spatial attention directed to the receptive field (as discussed in the Results section), eight stimulus conditions with spatial attention directed outside of the receptive field and to the intermediate direction of motion were fit to the model to determine term estimations without the influence of attention. These conditions were: 57
65 Preferred 50% contrast, Preferred 100% contrast, Null 50% contrast, Null 100% contrast, Preferred 50% contrast + Null 50% contrast, Preferred 100% contrast + Null 50% contrast, Preferred 50% contrast + Null 100% contrast, Preferred 100% contrast + Null 100% contrast. A value of = 2.75 was applied according to Equation 3 to the, L P, L N, and determinations from these eight sensory interaction conditions, to determine how well the free parameters determined by the eight stimulus interaction conditions alone fit the data collected during the attention conditions. The model provided an excellent fit of the attention conditions using a value of = 2.75 and the predetermined, L P, L N, and estimations. P-values were computed for Pearson s linear correlation coefficients using a Student s t distribution, unless it was noted that a Spearman s rho was determined instead, in which case the p-values were computed using large-sample approximations. A Bonferroni correction was applied in the case of multiple comparisons. 58
66 Chapter 3: Spatial versus Feature Attention: the Role of Normalization Amy M. Ni and John H.R. Maunsell Department of Neurobiology, Harvard Medical School, 220 Longwood Avenue, Boston, MA 02115, USA 59
67 Summary Both spatial and feature attention can improve visual perception, and both types of top-down attention modulate the firing rates of sensory neurons. However, it is unclear whether spatial and feature attention employ common or distinct neural mechanisms. The normalization model of attention hypothesizes that the sensory mechanism of normalization is related to both forms of attention. Here we use electrophysiology in area MT of behaving monkeys to measure the strengths of normalization, spatial attention, and feature attention effects for individual neurons. We find that while spatial and feature attention modulations of firing rates are correlated across neurons, this correlation is not dependent on a common relationship with the normalization mechanism. Spatial and feature attention appear to differ in their relationship to normalization. We conclude that a common top-down mechanism of attention is differentially influenced by normalization depending on the subpopulations of sensory neurons modulated by each form of attention. 60
68 Introduction Attention that is intentionally allocated to specific visual components, or, topdown attention (Kinchla, 1992; Corbetta and Shulman, 2002; Baluch and Itti, 2011), can improve visual perception in multiple ways. Spatial attention improves perception at specific locations in space (Posner, 1980; Posner and Petersen, 1990; Rensink, 2002; Carrasco, 2006; Carrasco, 2011; Chun et al., 2011), while feature attention improves the perception of specific visual features at all locations in space (Saenz et al., 2002; Saenz et al., 2003; Melcher et al., 2005; Boynton et al., 2006; Kanai et al., 2006; Maunsell and Treue, 2006; Serences and Boynton, 2007; Carrasco, 2011; Chun et al., 2011). It remains a point of contention whether spatial and feature attention employ common or distinct neural mechanisms (Maunsell and Treue, 2006; Bisley, 2011). It is generally thought that all forms of top-down attention involve the feedback of attention-related signals from higher cortical areas (Wojciulik and Kanwisher, 1999; Kastner and Ungerleider, 2000; Corbetta and Shulman, 2002; Assad, 2003; Liu et al., 2003; Treue, 2003; Yantis and Serences, 2003; Knudsen, 2007; Egner et al., 2008; Bisley and Goldberg, 2010; Greenberg et al., 2010; Noudoost et al., 2010; Baluch and Itti, 2011; Bisley, 2011; Liu et al., 2011; Noudoost and Moore, 2011; Schafer and Moore, 2011), which enhances the firing rates of sensory neurons with receptive field properties that match the attended spatial location or visual feature (Moran and Desimone, 1985; Motter, 1993; Motter, 1994; Desimone and Duncan, 1995; Connor et al., 1997; Treue and Martinez-Trujillo, 1999; McAdams and Maunsell, 2000; Treue, 2001; Maunsell and Cook, 2002; Martinez-Trujillo and Treue, 2004; Reynolds and Chelazzi, 2004; Maunsell 61
69 and Treue, 2006; Patzwahl and Treue, 2009). According to the feature similarity gain model, the effect of attention is to regulate the gain of a sensory neuron according to the similarity of the features of the attended stimulus to the sensory selectivity of the neuron along all feature dimensions (Treue and Martinez-Trujillo, 1999). Studies of this model support the hypothesis that spatial and feature attention are mediated by a common mechanism in which space is simply another feature (Treue and Martinez-Trujillo, 1999; Maunsell and Treue, 2006; Katzner et al., 2009; Patzwahl and Treue, 2009; Khayat et al., 2010). However, other studies support the hypothesis that spatial and feature attention are mediated by distinct mechanisms (Hayden and Gallant, 2005; Kanai et al., 2006; Liu et al., 2007; Schenkluhn et al., 2008; Hayden and Gallant 2009). Adding another dimension to this debate, recent studies have proposed that the sensory mechanism of normalization is involved in the processes of both spatial and feature attention (Boynton, 2009; Lee and Maunsell, 2009; Reynolds and Heeger, 2009). The normalization mechanism is used throughout the brain as a form of gain control that limits the dynamic range of a neuron s responses (Barlow, 1953; Kuffler, 1953; Baccus and Meister, 2002; Heimel et al., 2010; Olsen et al., 2010; Ohshiro et al., 2011; Papadopoulou et al., 2011). The gain control of normalization is contrast-dependent, thus normalization is more prominent with multiple stimuli in a receptive field (Morrone et al., 1982; Bonds, 1989; DeAngelis et al., 1992; Carandini et al., 1997; Britten and Heuer, 1999; Heuer and Britten, 2002). With two stimuli in a receptive field, a top-down attention signal for one or the other stimulus has the potential to be strongly influenced by the normalization mechanism (Boynton, 2009; Lee and Maunsell, 2009; Reynolds and Heeger, 2009). However, while single unit electrophysiological findings have directly 62
70 supported the hypothesis that normalization influences firing rate modulations due to spatial attention (Lee and Maunsell, 2009; Lee and Maunsell, 2010), such tests of the relationship between normalization and feature attention have not been performed. It is possible that feature attention signals do not interact with the normalization mechanism in the same manner as spatial attention. A recent study of inter-neuronal response correlations reported evidence for a common mechanism of attention that modulates distinct subgroups of sensory neurons depending on whether the attention is space- or feature-based (Cohen and Maunsell, 2011). Normalization is hypothesized to depend on spatially localized suppressive activity (Heeger, 1992; Carandini and Heeger, 1994; Carandini et al., 1997; Simoncelli and Heeger, 1998), thus the spatial makeup of the different subgroups of neurons modulated by spatial versus feature attention might determine how much influence normalization can have on the top-down attention signals. This hypothesis would help reconcile evidence for a common frontal-parietal source of top-down attention signals (Wojciulik and Kanwisher, 1999; Corbetta and Shulman, 2002; Giesbrecht et al., 2003; Slagter et al., 2007) with evidence that spatial and feature attention affect the responses of sensory neurons differently (Hayden and Gallant, 2005; Liu et al., 2007; Hayden and Gallant, 2009), as well as with evidence that spatial and feature attention affect local versus global subgroups of sensory neurons, respectively (for review, see Maunsell and Treue, 2006). Here we use single unit electrophysiology in the middle temporal area (MT) of rhesus monkeys to record the activity of neurons while the monkeys perform a behavioral task designed to measure modulations of firing rates due to spatial and feature attention 63
71 independently. We report a neuron-by-neuron correlation between spatial and feature attention firing rate modulations. However, by independently measuring the strength of normalization of each neuron, we found that spatial and feature attention differ in their relationships to the mechanism of normalization. We hypothesize that retinotopicallyorganized spatial attention signals modulate spatially localized normalization activity more effectively than global feature attention signals. We conclude that a common topdown mechanism of attention is differentially influenced by the sensory mechanism of normalization depending on the subgroups of sensory neurons modulated by each form of attention. 64
72 Results We studied the effects of spatial and feature attention on the firing rates of individual neurons recorded in area MT of two rhesus monkeys (Macaca mulatta). We measured separately the strengths of normalization, spatial attention, and feature attention modulations for 73 isolated neurons (23 from monkey 1, 50 from monkey 2) to study the relationships between these three processes. Behavioral task We trained each monkey to perform a direction change-detection task with three variations, to independently measure normalization, spatial attention, and feature attention modulation strengths for a single neuron (Figure 7). For all three variants of the task, a small cue directed the animal s attention to one of three peripheral locations. Two locations were within the receptive field of the recorded neuron, and the third location was in the opposite visual hemifield. The cue was extinguished, then a small drifting Gabor was presented at each of the three locations simultaneously and for 200 ms. Sets of Gabors (one per location) were presented for 200 ms each with successive sets separated by simultaneous interstimulus periods that varied randomly between ms (Figure 7D). The animal was rewarded for making a saccade to the cued location when a Gabor was presented at that location with a slightly different drift direction than the previously presented Gabor at that location. As a measure of the normalization strength of a neuron (Figure 7A), in one block of trials the animal was cued to attend to the location outside of the receptive field to keep the animal in a fixed state of attention. To eliminate feature attention from varying 65
73 Figure 7: Task design to measure normalization and attention modulations During a trial, the monkey was presented with a cue that directed its attention to one of three locations (two within and one outside the receptive field of the MT neuron being recorded) while series of drifting Gabor stimuli (each having 0 or 100% contrast) were presented simultaneously at the three locations. The Gabors presented inside of the receptive field drifted in either the preferred or null (180 from preferred) direction of motion of the neuron, and the Gabors presented outside of the receptive field drifted in the intermediate direction of motion. The monkey received a reward for detecting when a Gabor appeared at the cued location with a slightly different (< 90 ) drift direction. A) To measure the normalization modulation strength of the neuron, attention was directed outside of the receptive field to stimuli moving in the intermediate direction of motion. B) To measure the feature attention modulation strength of a neuron, attention was directed outside of the receptive field to stimuli moving in either the preferred or the null direction of motion. C) To measure the spatial attention modulation strength of a neuron, attention was directed to a location inside of the receptive field. D) The monkeys received a cue directing attention to one of the three locations, then stimuli were briefly presented multiple times in a trial, with blank interstimulus periods of random duration separating the presentations. 66
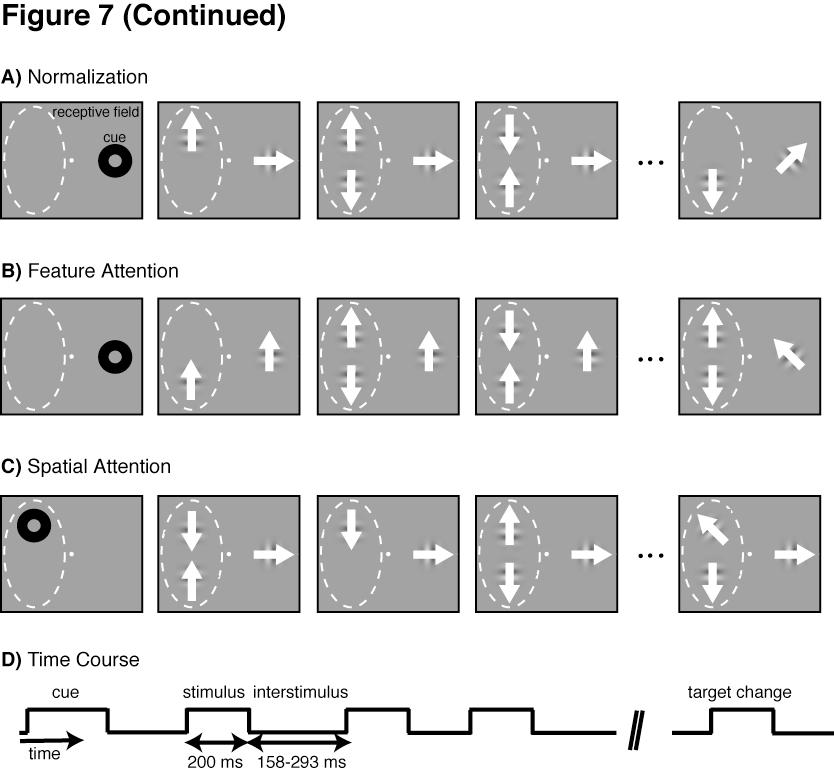
74 67
Attention March 4, 2009
 Attention March 4, 29 John Maunsell Mitchell, JF, Sundberg, KA, Reynolds, JH (27) Differential attention-dependent response modulation across cell classes in macaque visual area V4. Neuron, 55:131 141.
ATTENTIONAL MODULATION OF VISUAL PROCESSING
 Annu. Rev. Neurosci. 2004. 27:611 47 doi: 10.1146/annurev.neuro.26.041002.131039 Copyright c 2004 by Annual Reviews. All rights reserved First published online as a Review in Advance on March 24, 2004
Vision Research 49 (2009) Contents lists available at ScienceDirect. Vision Research. journal homepage:
 Contents lists available at ScienceDirect. Vision Research. journal homepage:") Vision Research 49 (29) 29 43 Contents lists available at ScienceDirect Vision Research journal homepage: www.elsevier.com/locate/visres A framework for describing the effects of attention on visual responses
Vision Research 49 (29) 29 43 Contents lists available at ScienceDirect Vision Research journal homepage: www.elsevier.com/locate/visres A framework for describing the effects of attention on visual responses
Key questions about attention
 Key questions about attention How does attention affect behavioral performance? Can attention affect the appearance of things? How does spatial and feature-based attention affect neuronal responses in
Attention: Neural Mechanisms and Attentional Control Networks Attention 2
 Attention: Neural Mechanisms and Attentional Control Networks Attention 2 Hillyard(1973) Dichotic Listening Task N1 component enhanced for attended stimuli Supports early selection Effects of Voluntary
Strength of Gamma Rhythm Depends on Normalization
 Strength of Gamma Rhythm Depends on Normalization The Harvard community has made this article openly available. Please share how this access benefits you. Your story matters Citation Ray, Supratim, Amy
Attention Response Functions: Characterizing Brain Areas Using fmri Activation during Parametric Variations of Attentional Load
 Attention Response Functions: Characterizing Brain Areas Using fmri Activation during Parametric Variations of Attentional Load Intro Examine attention response functions Compare an attention-demanding
Models of Attention. Models of Attention
 Models of Models of predictive: can we predict eye movements (bottom up attention)? [L. Itti and coll] pop out and saliency? [Z. Li] Readings: Maunsell & Cook, the role of attention in visual processing,
Effects of Attention on MT and MST Neuronal Activity During Pursuit Initiation
 Effects of Attention on MT and MST Neuronal Activity During Pursuit Initiation GREGG H. RECANZONE 1 AND ROBERT H. WURTZ 2 1 Center for Neuroscience and Section of Neurobiology, Physiology and Behavior,
Modeling the Deployment of Spatial Attention
 17 Chapter 3 Modeling the Deployment of Spatial Attention 3.1 Introduction When looking at a complex scene, our visual system is confronted with a large amount of visual information that needs to be broken
Relating normalization to neuronal populations across cortical areas
 J Neurophysiol 6: 375 386, 6. First published June 9, 6; doi:.5/jn.7.6. Relating alization to neuronal populations across cortical areas Douglas A. Ruff, Joshua J. Alberts, and Marlene R. Cohen Department
Attention improves performance primarily by reducing interneuronal correlations
 Attention improves performance primarily by reducing interneuronal correlations Marlene R Cohen & John H R Maunsell 29 Nature America, Inc. All rights reserved. Visual attention can improve behavioral
Spatial Attention Modulates Center-Surround Interactions in Macaque Visual Area V4
 Article Spatial Attention Modulates Center-Surround Interactions in Macaque Visual Area V4 Kristy A. Sundberg, 1 Jude F. Mitchell, 1 and John H. Reynolds 1, * 1 Systems Neurobiology Laboratory, The Salk
Selective Attention. Modes of Control. Domains of Selection
 The New Yorker (2/7/5) Selective Attention Perception and awareness are necessarily selective (cell phone while driving): attention gates access to awareness Selective attention is deployed via two modes
Context-Dependent Changes in Functional Circuitry in Visual Area MT
 Article Context-Dependent Changes in Functional Circuitry in Visual Area MT Marlene R. Cohen 1, * and William T. Newsome 1 1 Howard Hughes Medical Institute and Department of Neurobiology, Stanford University
Attention and normalization circuits in macaque V1
 European Journal of Neuroscience, pp. 1 16, 215 doi:1.1111/ejn.12857 Attention and normalization circuits in macaque V1 M. Sanayei, 1 J. L. Herrero, 1 C. Distler 2 and A. Thiele 1 1 Institute of Neuroscience,
Control of visuo-spatial attention. Emiliano Macaluso
 Control of visuo-spatial attention Emiliano Macaluso CB demo Attention Limited processing resources Overwhelming sensory input cannot be fully processed => SELECTIVE PROCESSING Selection via spatial orienting
A normalization model suggests that attention changes the weighting of inputs between visual areas
 A normalization model suggests that attention changes the weighting of inputs between visual areas Douglas A. Ruff a,1 and Marlene R. Cohen a a Department of Neuroscience and Center for the Neural Basis
NIH Public Access Author Manuscript Neural Netw. Author manuscript; available in PMC 2007 November 1.
 NIH Public Access Author Manuscript Published in final edited form as: Neural Netw. 2006 November ; 19(9): 1447 1449. Models of human visual attention should consider trial-by-trial variability in preparatory
A Neurally-Inspired Model for Detecting and Localizing Simple Motion Patterns in Image Sequences
 A Neurally-Inspired Model for Detecting and Localizing Simple Motion Patterns in Image Sequences Marc Pomplun 1, Yueju Liu 2, Julio Martinez-Trujillo 2, Evgueni Simine 2, and John K. Tsotsos 2 1 Department
Neuronal representations of cognitive state: reward or attention?
 Opinion TRENDS in Cognitive Sciences Vol.8 No.6 June 2004 representations of cognitive state: reward or attention? John H.R. Maunsell Howard Hughes Medical Institute & Baylor College of Medicine, Division
Time Course of Attention Reveals Different Mechanisms for Spatial and Feature-Based Attention in Area V4
 Neuron, Vol. 47, 637 643, September 1, 2005, Copyright 2005 by Elsevier Inc. DOI 10.1016/j.neuron.2005.07.020 Time Course of Attention Reveals Different Mechanisms for Spatial and Feature-Based Attention
Fundamental Components of Attention
 Annu. Rev. Neurosci. 2007. 30:57 78 First published online as a Review in Advance on April 6, 2007 The Annual Review of Neuroscience is online at neuro.annualreviews.org This article s doi: 10.1146/annurev.neuro.30.051606.094256
Introduction to Computational Neuroscience
 Introduction to Computational Neuroscience Lecture 11: Attention & Decision making Lesson Title 1 Introduction 2 Structure and Function of the NS 3 Windows to the Brain 4 Data analysis 5 Data analysis
Attentional Changes in Either Criterion or Sensitivity Are Associated with Robust Modulations in Lateral Prefrontal Cortex
 Article Attentional Changes in Either Criterion or Sensitivity Are Associated with Robust Modulations in Lateral Prefrontal Cortex Highlights d Two behavioral components of visuospatial attention were
Rules of apparent motion: The shortest-path constraint: objects will take the shortest path between flashed positions.
 Rules of apparent motion: The shortest-path constraint: objects will take the shortest path between flashed positions. The box interrupts the apparent motion. The box interrupts the apparent motion.
Attention Reshapes Center-Surround Receptive Field Structure in Macaque Cortical Area MT
 Cerebral Cortex October 2009;19:2466--2478 doi:10.1093/cercor/bhp002 Advance Access publication February 11, 2009 Attention Reshapes Center-Surround Receptive Field Structure in Macaque Cortical Area MT
Correlation between Speed Perception and Neural Activity in the Middle Temporal Visual Area
 The Journal of Neuroscience, January 19, 2005 25(3):711 722 711 Behavioral/Systems/Cognitive Correlation between Speed Perception and Neural Activity in the Middle Temporal Visual Area Jing Liu and William
Signal detection theory. Direct comparison of perception and neural activity. ? Choice probability. Visual stimulus. Behavioral judgement
 Signal detection theory yes no Visual stimulus Neurometric function Psychometric function Neuronal response? Choice probability Behavioral judgement Direct comparison oerception and neural activity Record
Is contrast just another feature for visual selective attention?
 Vision Research 44 (2004) 1403 1410 www.elsevier.com/locate/visres Is contrast just another feature for visual selective attention? Harold Pashler *, Karen Dobkins, Liqiang Huang Department of Psychology,
Report. Attention Narrows Position Tuning of Population Responses in V1
 Current Biology 19, 1356 1361, August 25, 2009 ª2009 Elsevier Ltd All rights reserved DOI 10.1016/j.cub.2009.06.059 Attention Narrows Position Tuning of Population Responses in V1 Report Jason Fischer
Visual attention: the where, what, how and why of saliency Stefan Treue
 428 Visual attention: the where, what, how and why of saliency Stefan Treue Attention influences the processing of visual information even in the earliest areas of primate visual cortex. There is converging
Nonlinear processing in LGN neurons
 Nonlinear processing in LGN neurons Vincent Bonin *, Valerio Mante and Matteo Carandini Smith-Kettlewell Eye Research Institute 2318 Fillmore Street San Francisco, CA 94115, USA Institute of Neuroinformatics
(Visual) Attention. October 3, PSY Visual Attention 1
 Attention. October 3, PSY Visual Attention 1") (Visual) Attention Perception and awareness of a visual object seems to involve attending to the object. Do we have to attend to an object to perceive it? Some tasks seem to proceed with little or no attention
(Visual) Attention Perception and awareness of a visual object seems to involve attending to the object. Do we have to attend to an object to perceive it? Some tasks seem to proceed with little or no attention
Commentary on Moran and Desimone's 'spotlight in V4
 Anne B. Sereno 1 Commentary on Moran and Desimone's 'spotlight in V4 Anne B. Sereno Harvard University 1990 Anne B. Sereno 2 Commentary on Moran and Desimone's 'spotlight in V4' Moran and Desimone's article
Covert attention increases contrast sensitivity: psychophysical, neurophysiological and neuroimaging studies
 Martinez-Conde, Macknik, Martinez, Alonso & Tse (Eds.) Progress in Brain Research, Vol. 154 ISSN 0079-6123 Copyright r 2006 Elsevier B.V. All rights reserved CHAPTER 3 Covert attention increases contrast
Competitive Mechanisms Subserve Attention in Macaque Areas V2 and V4
 The Journal of Neuroscience, March 1, 1999, 19(5):1736 1753 Competitive Mechanisms Subserve Attention in Macaque Areas V2 and V4 John H. Reynolds, 1 Leonardo Chelazzi, 2 and Robert Desimone 1 1 Laboratory
Dissociation of Response Variability from Firing Rate Effects in Frontal Eye Field Neurons during Visual Stimulation, Working Memory, and Attention
 2204 The Journal of Neuroscience, February 8, 2012 32(6):2204 2216 Behavioral/Systems/Cognitive Dissociation of Response Variability from Firing Rate Effects in Frontal Eye Field Neurons during Visual
Expansion of MT Neurons Excitatory Receptive Fields during Covert Attentive Tracking
 The Journal of Neuroscience, October 26, 2011 31(43):15499 15510 15499 Behavioral/Systems/Cognitive Expansion of MT Neurons Excitatory Receptive Fields during Covert Attentive Tracking Robert Niebergall,
NO EVIDENCE FOR ANIMATE IMPLIED MOTION PROCESSING IN MACAQUE AREAS MT AND MST
 CHAPTER 4 NO EVIDENCE FOR ANIMATE IMPLIED MOTION PROCESSING IN MACAQUE AREAS MT AND MST Abstract In this study we investigated animate implied motion processing in macaque motion sensitive cortical neurons.
Attention and Scene Perception
 Theories of attention Techniques for studying scene perception Physiological basis of attention Attention and single cells Disorders of attention Scene recognition attention any of a large set of selection
Temporal Dynamics of Direction Tuning in Motion-Sensitive Macaque Area MT
 J Neurophysiol 93: 2104 2116, 2005. First published November 10, 2004; doi:10.1152/jn.00601.2004. Temporal Dynamics of Direction Tuning in Motion-Sensitive Macaque Area MT János A. Perge, Bart G. Borghuis,
Suppression effects in feature-based attention
 Journal of Vision (2015) 15(5):15, 1 16 http://www.journalofvision.org/content/15/5/15 1 Suppression effects in feature-based attention Department of Psychology, Michigan State University, Yixue Wang East
Attention enhances feature integration
 Vision Research 43 (2003) 1793 1798 Rapid Communication Attention enhances feature integration www.elsevier.com/locate/visres Liza Paul *, Philippe G. Schyns Department of Psychology, University of Glasgow,
Area MT Neurons Respond to Visual Motion Distant From Their Receptive Fields
 J Neurophysiol 94: 4156 4167, 2005. First published August 24, 2005; doi:10.1152/jn.00505.2005. Area MT Neurons Respond to Visual Motion Distant From Their Receptive Fields Daniel Zaksas and Tatiana Pasternak
Spatial and Feature-Based Attention in a Layered Cortical Microcircuit Model
 Spatial and Feature-Based Attention in a Layered Cortical Microcircuit Model Nobuhiko Wagatsuma 1,2 *, Tobias C. Potjans 3,4,5, Markus Diesmann 2,4, Ko Sakai 6, Tomoki Fukai 2,4,7 1 Zanvyl Krieger Mind/Brain
Report. A Causal Role for V5/MT Neurons Coding Motion-Disparity Conjunctions in Resolving Perceptual Ambiguity
 Current Biology 23, 1454 1459, August 5, 2013 ª2013 The Authors. Open access under CC BY license. http://dx.doi.org/10.1016/j.cub.2013.06.023 A Causal Role for V5/MT Neurons Coding Motion-Disparity Conjunctions
Consciousness The final frontier!
 Consciousness The final frontier! How to Define it??? awareness perception - automatic and controlled memory - implicit and explicit ability to tell us about experiencing it attention. And the bottleneck
Supplementary materials for: Executive control processes underlying multi- item working memory
 Supplementary materials for: Executive control processes underlying multi- item working memory Antonio H. Lara & Jonathan D. Wallis Supplementary Figure 1 Supplementary Figure 1. Behavioral measures of
Motion Opponency in Visual Cortex
 The Journal of Neuroscience, August 15, 1999, 19(16):7162 7174 Motion Opponency in Visual Cortex David J. Heeger, 1 Geoffrey M. Boynton, 1 Jonathan B. Demb, 1 Eyal Seidemann, 2 and William T. Newsome 2
Morton-Style Factorial Coding of Color in Primary Visual Cortex
 Morton-Style Factorial Coding of Color in Primary Visual Cortex Javier R. Movellan Institute for Neural Computation University of California San Diego La Jolla, CA 92093-0515 movellan@inc.ucsd.edu Thomas
Perceptual Read-Out of Conjoined Direction and Disparity Maps in Extrastriate Area MT
 Perceptual Read-Out of Conjoined Direction and Disparity Maps in Extrastriate Area MT Gregory C. DeAngelis 1*, William T. Newsome 2 PLoS BIOLOGY 1 Department of Anatomy and Neurobiology, Washington University
Attention changes perceived size of moving visual patterns
 Journal of Vision (2007) 7(11):5, 1 9 http://journalofvision.org/7/11/5/ 1 Attention changes perceived size of moving visual patterns Katharina Anton-Erxleben Christian Henrich Stefan Treue Cognitive Neuroscience
9.S913 SYLLABUS January Understanding Visual Attention through Computation
 9.S913 SYLLABUS January 2014 Understanding Visual Attention through Computation Dept. of Brain and Cognitive Sciences Massachusetts Institute of Technology Title: Instructor: Years: Level: Prerequisites:
Substructure of Direction-Selective Receptive Fields in Macaque V1
 J Neurophysiol 89: 2743 2759, 2003; 10.1152/jn.00822.2002. Substructure of Direction-Selective Receptive Fields in Macaque V1 Margaret S. Livingstone and Bevil R. Conway Department of Neurobiology, Harvard
Neuronal responses to plaids
 Vision Research 39 (1999) 2151 2156 Neuronal responses to plaids Bernt Christian Skottun * Skottun Research, 273 Mather Street, Piedmont, CA 94611-5154, USA Received 30 June 1998; received in revised form
The Effects of Feature-Based and Memory-Driven Attention on Appearance. Jason Rajsic. A thesis submitted to the Graduate Program in Psychology
 The Effects of Feature-Based and Memory-Driven Attention on Appearance By Jason Rajsic A thesis submitted to the Graduate Program in Psychology in conformity with the requirements for the Degree of Master
A Neural Signature of Divisive Normalization at the Level of Multisensory Integration in Primate Cortex
 Article A Neural Signature of Divisive Normalization at the Level of Multisensory Integration in Primate Cortex Highlights d Many neurons in macaque area MSTd show a specific form of cross-modal suppression
Extrastriate Visual Areas February 27, 2003 A. Roe
 Extrastriate Visual Areas February 27, 2003 A. Roe How many extrastriate areas are there? LOTS!!! Macaque monkey flattened cortex Why? How do we know this? Topography Functional properties Connections
Deconstructing the Receptive Field: Information Coding in Macaque area MST
 : Information Coding in Macaque area MST Bart Krekelberg, Monica Paolini Frank Bremmer, Markus Lappe, Klaus-Peter Hoffmann Ruhr University Bochum, Dept. Zoology & Neurobiology ND7/30, 44780 Bochum, Germany
The role of perceptual load in orientation perception, visual masking and contextual integration Moritz J.K. Stolte
 The role of perceptual load in orientation perception, visual masking and contextual integration Moritz J.K. Stolte Institute of Cognitive Neuroscience University College London Submitted for the degree
Flexibility of Sensory Representations in Prefrontal Cortex Depends on Cell Type
 Article Flexibility of Sensory Representations in Prefrontal Cortex Depends on Cell Type Cory R. Hussar 1,2 and Tatiana Pasternak 1,2, * 1 Department of Neurobiology and Anatomy 2 Center for Visual Science
Reading Assignments: Lecture 5: Introduction to Vision. None. Brain Theory and Artificial Intelligence
 Brain Theory and Artificial Intelligence Lecture 5:. Reading Assignments: None 1 Projection 2 Projection 3 Convention: Visual Angle Rather than reporting two numbers (size of object and distance to observer),
M Cells. Why parallel pathways? P Cells. Where from the retina? Cortical visual processing. Announcements. Main visual pathway from retina to V1
 Announcements exam 1 this Thursday! review session: Wednesday, 5:00-6:30pm, Meliora 203 Bryce s office hours: Wednesday, 3:30-5:30pm, Gleason https://www.youtube.com/watch?v=zdw7pvgz0um M Cells M cells
Three methods for measuring perception. Magnitude estimation. Steven s power law. P = k S n
 Three methods for measuring perception 1. Magnitude estimation 2. Matching 3. Detection/discrimination Magnitude estimation Have subject rate (e.g., 1-10) some aspect of a stimulus (e.g., how bright it
Time [ms]
![Time [ms]](/thumbs/95/126316840.jpg "Time [ms]") Magazine R1051 Brief motion stimuli preferentially activate surroundsuppressed neurons in macaque visual area MT Jan Churan, Farhan A. Khawaja, James M.G. Tsui and Christopher C. Pack Intuitively one might
Magazine R1051 Brief motion stimuli preferentially activate surroundsuppressed neurons in macaque visual area MT Jan Churan, Farhan A. Khawaja, James M.G. Tsui and Christopher C. Pack Intuitively one might
Joint tuning for direction of motion and binocular disparity in macaque MT is largely separable
 J Neurophysiol 11: 286 2816, 213. First published October 2, 213; doi:1.1152/jn.573.213. Joint tuning for direction of motion and binocular disparity in macaque MT is largely separable Alexandra Smolyanskaya,*
Feature-Based Attention Modulates Orientation- Selective Responses in Human Visual Cortex
 Article Feature-Based Attention Modulates Orientation- Selective Responses in Human Visual Cortex Taosheng Liu, 1, * Jonas Larsson, 1,2 and Marisa Carrasco 1 1 Department of Psychology and Center for Neural
Dynamics of Response to Perceptual Pop-Out Stimuli in Macaque V1
 J Neurophysiol 98: 3436 3449, 27. First published September 26, 27; doi:1.1152/jn.441.27. Dynamics of Response to Perceptual Pop-Out Stimuli in Macaque V1 Matthew A. Smith, 1 Ryan C. Kelly, 1,2 and Tai
Neuroscience Tutorial
 Neuroscience Tutorial Brain Organization : cortex, basal ganglia, limbic lobe : thalamus, hypothal., pituitary gland : medulla oblongata, midbrain, pons, cerebellum Cortical Organization Cortical Organization
Sustained and transient covert attention enhance the signal via different contrast response functions
 Vision Research 46 (2006) 1210 1220 www.elsevier.com/locate/visres Sustained and transient covert attention enhance the signal via different contrast response functions Sam Ling a, Marisa Carrasco b, *
Tuning Curve Shift by Attention Modulation in Cortical Neurons: a Computational Study of its Mechanisms
 Cerebral Cortex June 26;16:761-778 doi:1.193/cercor/bhj21 Advance Access publication August 31, 25 Tuning Curve Shift by Attention Modulation in Cortical Neurons: a Computational Study of its Mechanisms
A model of encoding and decoding in V1 and MT accounts for motion perception anisotropies in the human visual system
 B R A I N R E S E A R C H 1 2 9 9 ( 2 0 0 9 ) 3 1 6 a v a i l a b l e a t w w w. s c i e n c e d i r e c t. c o m w w w. e l s e v i e r. c o m / l o c a t e / b r a i n r e s Research Report A model of
Report. Decoding the Representation of Multiple Simultaneous Objects in Human Occipitotemporal Cortex
 Current Biology 19, 1 5, June 9, 2009 ª2009 Elsevier Ltd All rights reserved DOI 10.1016/j.cub.2009.04.020 Decoding the Representation of Multiple Simultaneous Objects in Human Occipitotemporal Cortex
Perceptual Decisions between Multiple Directions of Visual Motion
 The Journal of Neuroscience, April 3, 8 8(7):4435 4445 4435 Behavioral/Systems/Cognitive Perceptual Decisions between Multiple Directions of Visual Motion Mamiko Niwa and Jochen Ditterich, Center for Neuroscience
Prof. Greg Francis 7/31/15
 s PSY 200 Greg Francis Lecture 06 How do you recognize your grandmother? Action potential With enough excitatory input, a cell produces an action potential that sends a signal down its axon to other cells
FINAL PROGRESS REPORT
 (1) Foreword (optional) (2) Table of Contents (if report is more than 10 pages) (3) List of Appendixes, Illustrations and Tables (if applicable) (4) Statement of the problem studied FINAL PROGRESS REPORT
Descending Control of Neural Bias and Selectivity in a Spatial Attention Network: Rules and Mechanisms
 Article Descending Control of Neural Bias and Selectivity in a Spatial Attention Network: Rules and Mechanisms Shreesh P. Mysore 1,2, * and Eric I. Knudsen 1 1 Department of Neurobiology, Stanford University,
Attention alters the appearance of motion coherence
 Psychonomic Bulletin & Review 2006, 13 (6), 1091-1096 Attention alters the appearance of motion coherence TAOSHENG LIU, STUART FULLER, and MARISA CARRASCO New York University, New York, New York Selective
Neurons in Dorsal Visual Area V5/MT Signal Relative
 17892 The Journal of Neuroscience, December 7, 211 31(49):17892 1794 Behavioral/Systems/Cognitive Neurons in Dorsal Visual Area V5/MT Signal Relative Disparity Kristine Krug and Andrew J. Parker Oxford
CS/NEUR125 Brains, Minds, and Machines. Due: Friday, April 14
 CS/NEUR125 Brains, Minds, and Machines Assignment 5: Neural mechanisms of object-based attention Due: Friday, April 14 This Assignment is a guided reading of the 2014 paper, Neural Mechanisms of Object-Based
Visual attention mediated by biased competition in extrastriate visual cortex
 Visual attention mediated by biased competition in extrastriate visual cortex Robert Desimone Laboratory of Neuropsychology, NIMH, 49 Convent Drive, Building 49, Room 1B80, Bethesda, MD 20892-4415, USA
20: c 2009 Wolters Kluwer Health Lippincott Williams & Wilkins. NeuroReport 2009, 20:
 Vision, central 1619 Comparing neuronal and behavioral thresholds for spiral motion discrimination Antonio J. Rodríguez-Sanchez a, John K. Tsotsos a, Stefan Treue c,d and Julio C. Martinez-Trujillo b As
Motion direction signals in the primary visual cortex of cat and monkey
 Visual Neuroscience (2001), 18, 501 516. Printed in the USA. Copyright 2001 Cambridge University Press 0952-5238001 $12.50 DOI: 10.1017.S0952523801184014 Motion direction signals in the primary visual
Entrainment of neuronal oscillations as a mechanism of attentional selection: intracranial human recordings
 Entrainment of neuronal oscillations as a mechanism of attentional selection: intracranial human recordings J. Besle, P. Lakatos, C.A. Schevon, R.R. Goodman, G.M. McKhann, A. Mehta, R.G. Emerson, C.E.
Effects of attention on motion repulsion
 Vision Research () 139 1339 www.elsevier.com/locate/visres Effects of attention on motion repulsion Yuzhi Chen a,1, Xin Meng a, Nestor Matthews b, Ning Qian a, * a Center for Neurobiology and Behavior,
The Role of Neural Mechanisms of Attention in Solving the Binding Problem
 Neuron, Vol. 24, 19 29, September, 1999, Copyright 1999 by Cell Press The Role of Neural Mechanisms of Attention in Solving the Binding Problem Review John H. Reynolds* and Robert Desimone Laboratory of
Visual Selection and Attention
 Visual Selection and Attention Retrieve Information Select what to observe No time to focus on every object Overt Selections Performed by eye movements Covert Selections Performed by visual attention 2
Changes in Visual Receptive Fields with Microstimulation of Frontal Cortex
 Neuron 50, 791 798, June 1, 2006 ª2006 Elsevier Inc. DOI 10.1016/j.neuron.2006.05.010 Changes in Visual Receptive Fields with Microstimulation of Frontal Cortex Katherine M. Armstrong, 1 Jamie K. Fitzgerald,
Attention enhances adaptability: evidence from motion adaptation experiments
 Vision Research 44 (2004) 3035 3044 www.elsevier.com/locate/visres Attention enhances adaptability: evidence from motion adaptation experiments Amy Rezec a, Bart Krekelberg b, Karen R. Dobkins a, * a Department
Time Course and Stimulus Dependence of Repetition-Induced Response Suppression in Inferotemporal Cortex
 J Neurophysiol : 48 436, 9. First published November, 8; doi:.2/jn.996.8. Time Course and Stimulus Dependence of Repetition-Induced Response Suppression in Inferotemporal Cortex Yan Liu, Scott O. Murray,
TMS Disruption of Time Encoding in Human Primary Visual Cortex Molly Bryan Beauchamp Lab
 TMS Disruption of Time Encoding in Human Primary Visual Cortex Molly Bryan Beauchamp Lab This report details my summer research project for the REU Theoretical and Computational Neuroscience program as
Adventures into terra incognita
 BEWARE: These are preliminary notes. In the future, they will become part of a textbook on Visual Object Recognition. Chapter VI. Adventures into terra incognita In primary visual cortex there are neurons
Monocular and Binocular Mechanisms of Contrast Gain Control. Izumi Ohzawa and Ralph D. Freeman
 Monocular and Binocular Mechanisms of Contrast Gain Control Izumi Ohzawa and alph D. Freeman University of California, School of Optometry Berkeley, California 9472 E-mail: izumi@pinoko.berkeley.edu ABSTACT
Fundamentals of Psychophysics
 Fundamentals of Psychophysics John Greenwood Department of Experimental Psychology!! NEUR3045! Contact: john.greenwood@ucl.ac.uk 1 Visual neuroscience physiology stimulus How do we see the world? neuroimaging
Supplemental Material
 Supplemental Material Recording technique Multi-unit activity (MUA) was recorded from electrodes that were chronically implanted (Teflon-coated platinum-iridium wires) in the primary visual cortex representing
Optimal Coding Predicts Attentional Modulation of Activity in Neural Systems
 LETTER Communicated by Emilio Salinas Optimal Coding Predicts Attentional Modulation of Activity in Neural Systems Santiago Jaramillo sjara@ieee.org Barak A. Pearlmutter barak@cs.nuim.ie Hamilton Institute,
Distinct Mechanisms for Top-Down Control of Neural Gain and Sensitivity in the Owl Optic Tectum
 Article Distinct Mechanisms for Top-Down Control of Neural Gain and Sensitivity in the Owl Optic Tectum Daniel E. Winkowski 1,2, * and Eric I. Knudsen 1 1 Neurobiology Department, Stanford University Medical
A Model of Neuronal Responses in Visual Area MT
 A Model of Neuronal Responses in Visual Area MT Eero P. Simoncelli a and David J. Heeger b a Center for Neural Science 4 Washington Place, Room 809 New York, NY 10003 b Department of Psychology Stanford
Analysis of in-vivo extracellular recordings. Ryan Morrill Bootcamp 9/10/2014
 Analysis of in-vivo extracellular recordings Ryan Morrill Bootcamp 9/10/2014 Goals for the lecture Be able to: Conceptually understand some of the analysis and jargon encountered in a typical (sensory)