Supplementary Figure 1. Using DNA barcode-labeled MHC multimers to generate TCR fingerprints
|
|
|
- Kelley O’Brien’
- 5 years ago
- Views:
Transcription
1 Supplementary Figure 1 Using DNA barcode-labeled MHC multimers to generate TCR fingerprints (a) Schematic overview of the workflow behind a TCR fingerprint. Each peptide position of the original peptide is substituted with all naturally occurring amino acids. The resultant peptide variants are assembled with MHC molecules, and individually multiplexed on a PE-labeled dextran backbone together with individual DNA barcodes. Thus, a given DNA barcode forms a tag for the corresponding pmhc variant. T cells recognizing the original pmhc are incubated with all MHC multimer variants simultaneously. The MHC multimer binding cells are isolated based on the shared PE-label and their associated DNA barcodes are amplified and sequenced. The hierarchy of pmhc interactions is revealed from the relative number of DNA-barcode reads specifically associated with a given MHC multimer. DNA barcode reads are typically transformed to log 2 FC values (data in the example corresponds to results from Fig. 1a). (b) A clonal TCR will bind a pool of pmhc variants in a hierarchical manner that is governed by the avidity of the given pmhc and the TCR. (c) The hierarchy of TCR-pMHC interactions is used to determine the recognition pattern of that given TCR, visualized as a Shannon plot (here determined TCR fingerprint ).
2 Supplementary Figure 2
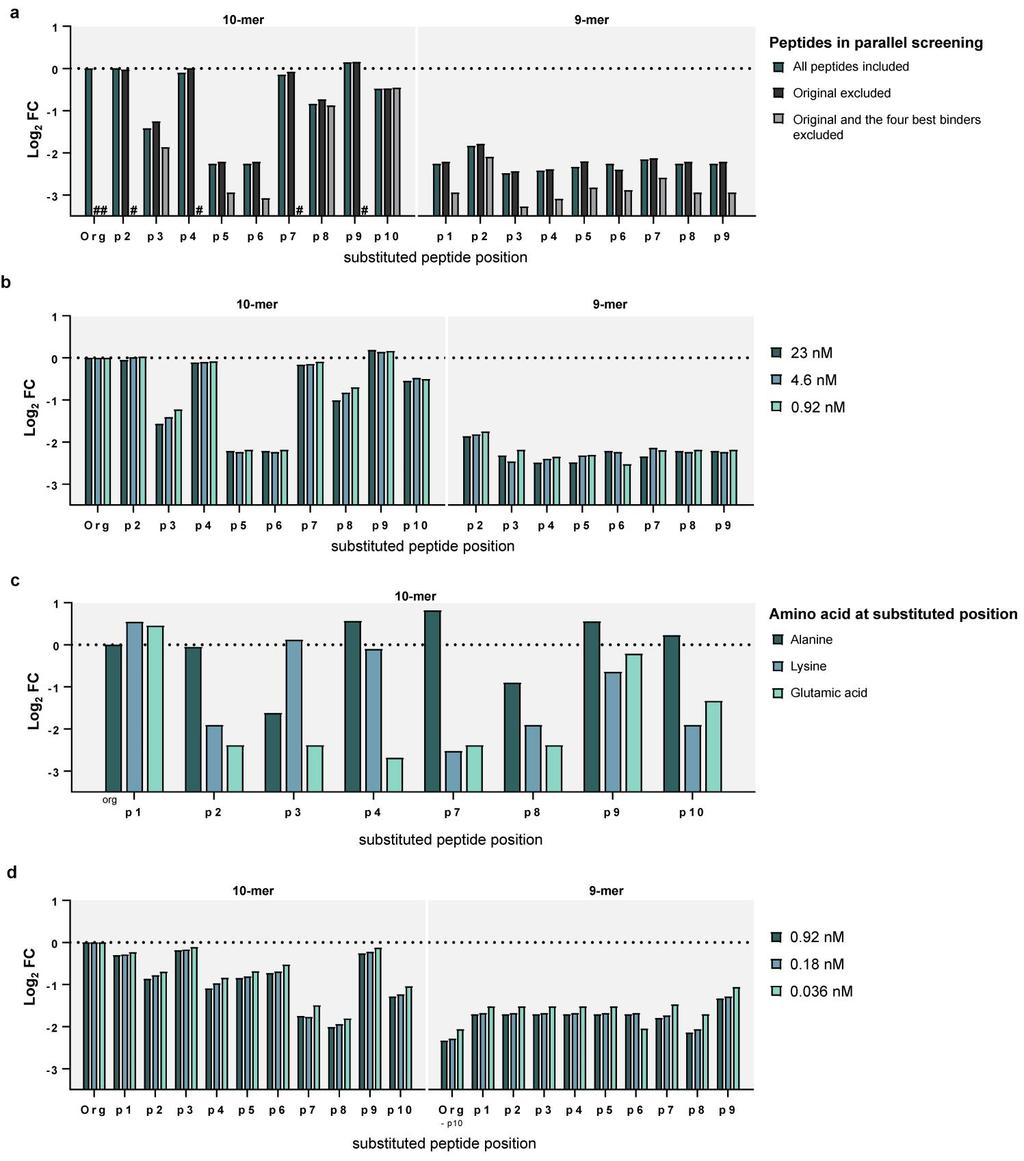
3 Feasibility of using DNA barcode-labeled multimers to determine the binding hierarchy of multiple pmhcs in a one-pot screen Bar plots of the relative log 2 FC values from the DNA barcode-based analyses of PBMCs transduced with (a-c) a HLA- B*0702 APN engaging TCR or (d) a HLA-A*2402 EWW engaging TCR. Each bar represents a pmhc variant with an amino acid substitution at the given peptide position. Bars of the same color indicate peptides that were included in a parallel screening. The dotted line at zero indicates the normalized log 2 FC of the original pmhc. (a-b) The MHC multimer libraries applied in the analyses included all possible 9- and 10-mer variants of APNCYGNIPL generated from substituting with alanine. (a) Shows a series of three analyses where # indicates a peptide variant that was excluded in a given screening. Data is representative of triplicate analyses. (b) Bar plot from a series of analyses using the same MHC multimer library of APNCYGNIPL variants. In these analyses a varying amount of DNA barcode-labeled MHC multimers were used, i.e. a titration from 23 nm to 0.92 nm in respect to each pmhc (corresponding to 100%, 20% or 4% of the amount originally applied, n=1 for each variable). (c) Bar plot from a series of analyses where a range of 10-mer peptides produced from substituting with alanine, lysine or glutamic acid were applied to generate three different libraries of DNA barcode-labeled MHC multimers that were used to stain the HLA-B*0702 APN engaging TCR. (d) The MHC multimer libraries applied in these analyses included all possible 9- and 10-mer variants of EWWRSGGFSF generated from substituting with alanine. The series of analyses are equivalent to that shown in (b) only conducted on a different TCR and at lower MHC multimer concentrations, i.e. a titration from 0.92 nm to nm in respect to each pmhc (corresponding to 4%, 0.8% or 0.16% of the amount originally applied, n=1 for each variable).

4 Supplementary Figure 3 Replicate screening of the HLA-B*0702 APN -engaging TCR showing read counts and data from an irrelevant sample
5 Results obtained from the DNA barcode-based analysis of T cells transduced with a TCR recognizing the HLA-B*0702 restricted peptide, APNCYGNIPL (replicate of the data shown in Fig. 1a-c). The analysis was performed with all possible variations of peptides created by single-position amino acid substitutions. The hierarchy of pmhc interactions expressed as (a) clonality reduced read counts or (b) log 2 FC relative to a triplicate baseline sample (see Supplementary Note 1). A healthy donor PBMC sample (BC-D62) was screened with the same MHC multimer panel in parallel. The plotted order of read counts or log 2 FC of each pmhc-associated DNA barcode is determined by the hierarchy obtained from screening the HLA-B*0702 APN responsive TCR. (c-f) Heat map showing the clonality reduced read counts or log 2 FC of (c,d) the HLA-B*0702 APN responsive TCR or (e,f) the healthy donor BC-D62, respectively. Each row represents a given amino acid and each column a position in the peptide sequence. The amino acids of the original peptide target are marked with black borders. c and e showing read counts, and d and f showing Log 2 FC are colored according to the same keys respectively. (g) The replicate recognition pattern of the HLA-B*0702 APN interacting TCR, here visualized as a sequence logo based on the data from a-d.
6 Supplementary Figure 4 Replicate screening of the HLA-A*2402 EWW -engaging TCR showing read counts and data from an irrelevant sample
7 Results obtained from the DNA barcode-based analysis of T cells transduced with a TCR recognizing the HLA-A*2402 restricted peptide, EWWRSGGFSF (replicate of the data shown in Fig. 1d-f). The analysis was performed with all possible variations of peptides created by single-position amino acid substitutions. The hierarchy of pmhc interactions expressed as (a) clonality reduced read counts or (b) log 2 FC relative to a triplicate baseline sample (see Supplementary Note). A healthy donor PBMC sample (BC-D42) was screened with the same MHC multimer panel in parallel. The plotted order of read counts or log 2 FC of each pmhc-associated DNA barcode is determined by the hierarchy obtained from screening the HLA-A*2402 EWW responsive TCR. (c-f) Heat map showing the clonality reduced read counts or log 2 FC of (c,d) the HLA-A*2402 EWW responsive TCR or (e,f) the healthy donor BC-D42, respectively. Each row represents a given amino acid and each column a position in the peptide sequence. The amino acids of the original peptide target are marked with black borders. c and e showing read counts, and d and f showing Log 2 FC are colored according to the same keys respectively. (g) The replicate recognition pattern of the HLA-A*2402 EWW interacting TCR, here visualized as a sequence logo based on the data from a-d.
8 Supplementary Figure 5
9 The effect of peptide MHC interaction on analyzing the recognition pattern of the HLA-B*0702 APN -engaging TCR (a) Sequence logo showing the amino acid preferences for peptide binding to HLA-B*0702 constructed with NetMHCpan by finding the binding cores of the top 1% strongest predicted binders among 100,000 natural random 10-mer peptides and visualizing these using R with the Shannon method in Seq2Logo 48. (b) Scatter plot of the experimentally determined peptide binding to HLA-B*0702 (MHC ELISA, Supplementary Note 3), given as the relative quantity of a pmhc variant (only alanine substitutions) after UV-exchange, compared to that of the original peptide, in correlation to the experimentally obtained recognition properties of the given phla-b*0702 interacting with the TCR. The MHC ELISA data is average of 5 experiments (n=2). Each dot in b represents one peptide-mhc variation. The coloring indicates the position of a given amino acid substitution and the asterisks indicates the original peptide. (c) Dot plots from staining the HLA-B*0702 APN engaging TCR with fluorescently labeled MHC multimers carrying one of six variations of APNCYGNIPL and an irrelevant peptide (p*, the UV conditional peptide). 1-3 are all examples of peptides predicted as strong binders to HLA-B*0702 (%Rank<0.5), here only 1 and 2 are recognized by the TCR. 4-6 are examples of peptides that are predicted as poor binders to MHC (%Rank>2), but the TCR is still able to recognize 4 and 5. The respective peptide sequences (substitutions in red), %Rank, MFI and percentages out of total CD8 T cells are indicated within the contour plots. The fluorescent based multimer stainings were performed twice.
10
11 Supplementary Figure 6 The effect of peptide MHC interaction on analyzing the recognition pattern of the HLA-A*2402 EWW -engaging TCR (a) Sequence logo showing the amino acid preferences for peptide binding to HLA-A*2402 constructed with NetMHCpan by finding the binding cores of the top 1% strongest predicted binders among 100,000 natural random 10-mer peptides and visualizing these using R with the Shannon method in Seq2Logo 48. (b) Shows the sequencing output expressed in log 2 FC after enrichment of only the correctly folded pmhc amongst the full DNA barcode-labeled MHC multimer library comprising all 191 single substitution EWWRSGGFSF variants (Supplementary Data 4 and Supplementary Note 3). Correctly folded pmhc were captured on W6/32 beads that were subsequently sorted. The pmhc associated DNA barcodes were amplified and sequenced. This was performed at T0, which was just after collecting and reducing the volume of the MHC multimer panel, T4, after four hours incubation at RT, and at T20, after 20 hours incubation at RT. Each dot represents one peptide-mhc variation. The coloring indicates the position of a given amino acid substitution and the asterisks indicates the original peptide. (c) Dot plots from staining the HLA-A*2402 EWW engaging TCR with fluorescently labeled MHC multimers carrying one of five variations of EWWRSGGFSF and an irrelevant peptide (p*, the UV conditional peptide). 1 and 2 are examples of peptides predicted as strong binders to HLA- A*2402 MHC (%Rank<0.5), only peptide 1 is recognized by the TCR. 3-5 are examples of peptides that are predicted as poor binders to MHC (%Rank>2), but the TCR is still able to recognize all three peptides. The respective peptide sequences (substitutions in red), %Rank, MFI and percentages out of total CD8 T cells are indicated within the contour plots. The experiments were performed twice.
12 Supplementary Figure 7 In silico modeling of the APNCYGNIPL peptide conformation when bound to HLA-B*0702 (a) Structural model of the original peptide, APNCYGNIPL, binding to HLA-B*0702. Color scaling indicates the importance of a given amino acid for retaining the conformation of the original peptide when bound to the MHC (the information content is listed in Supplementary Data 5). (b) Bar plot of the FoldX derived ΔΔG energy between the original peptide (APNCYGNIPL) and HLA-B*0702, as well as all the peptide variants created by substituting each peptide position (x-axis) with all naturally occurring amino acids (n=19). If the ΔΔG is larger than zero it indicates that the given amino acid substitution has destabilized the peptide-mhc interaction while a ΔΔG smaller than zero indicates that the substitution has stabilized the peptide-mhc interaction. (c) Sequence logo showing the structurally predicted peptide-mhc binding preference for HLA-B*0702 APN based on the energy change (ΔΔ ) calculated in b.
13 Supplementary Figure 8 In silico modeling of the EWWRSGGFSF peptide conformation when bound to HLA-A*2402 (a) Structural model of original peptide, EWWRSGGFSF, binding to HLA-A*2402. Color scaling indicates the importance of a given amino acid for retaining the conformation of the peptide when bound to the MHC (the information content is listed in Supplementary Data 6). (b) Bar plot of the FoldX derived ΔΔG energy between the original peptide (EWWRSGGFSF) and HLA-A*2402, as well as all the peptide variants created by substituting each peptide position (xaxis) with all naturally occurring amino acids (n=19). If the ΔΔG is larger than zero it indicates that the given amino acid substitution has destabilized the peptide-mhc interaction while a ΔΔG smaller than zero indicates that the substitution has stabilized the peptide-mhc interaction. (c) Sequence logo showing the structurally predicted peptide-mhc binding preference for HLA-A*2402 EWW based on the energy change (ΔΔ ) calculated in b.
14
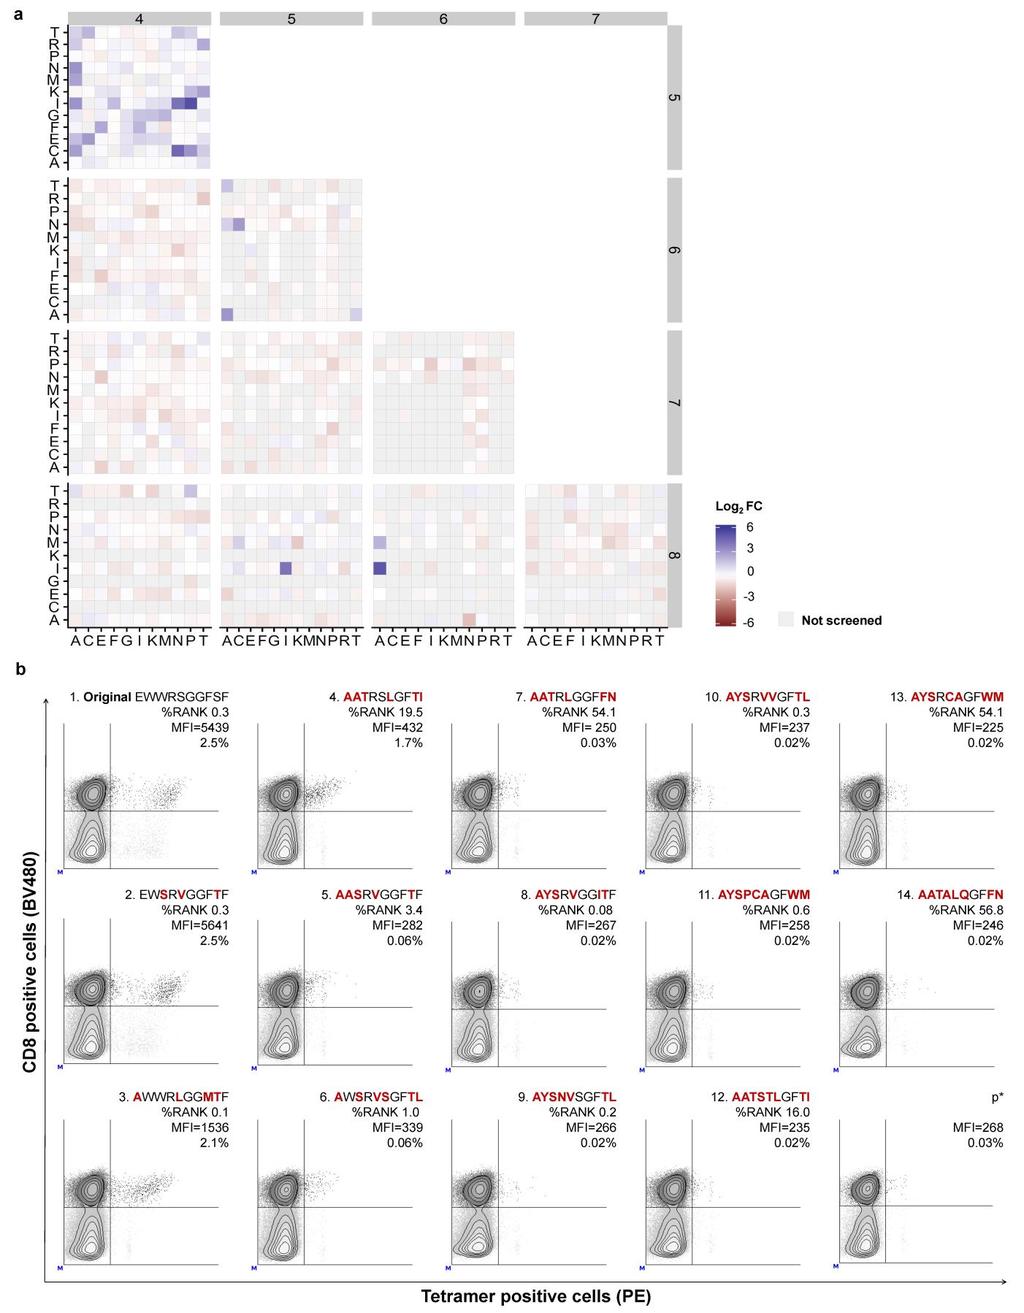
15 Supplementary Figure 9 The HLA-A*2402 EWW -engaging TCRs recognize peptides with multiple amino acid substitutions (a) Heat map showing the amino acid preferences of the TCR recognizing the HLA-A*2402 restricted peptide, EWWRSGGFSF, expressed as log 2 FC of read counts relative to a triplicate baseline sample (see Supplementary Note). The TCR transduced clones were stained with a MHC multimer library composed of peptides with all single amino acid substitutions of the original EWWRSGGFSF peptide, as well as double amino acid substitutions covering 12 naturally occurring amino acids, where positions 4-8 were substituted two amino acids at a time. The heat map includes only double amino acid substitution variants (the effect of single amino acid substitutions can be seen in Fig. 1 and Supplementary Fig. 4). Double substitution variants resulting in peptides with a %Rank>0.5 were excluded from the analysis (total number of double substitution peptide variants, n=776, Supplementary Data 7). The data largely confirm the findings when screening only with the single substitution library, that there is some flexibility of the amino acids at positions 4 and 5, while almost no other double substitutions are tolerated. The barcode-based analysis of double substitutions is representative of duplicate analyses. (b) Dot plots from staining the HLA-A*2402 EWW engaging TCR with fluorescently labeled MHC multimers carrying one of 14 variations of EWWRSGGFSF and an irrelevant peptide (p*, the UV conditional peptide). The variants are comprised of peptides with 3 to 8 amino acid substitutions compared to the original peptide sequence (1). The substitutions were either at positions that had no preference for certain amino acids for TCR recognition (positions 1, 3 or 9, as visualized in the TCR fingerprint, Fig. 1f) or substituted with an amino acid that was prominent in the TCR fingerprint (positions 2, 4, 5, 6, 8 and 10). The MHC anchor at positions 2 were in some cases instead substituted with tyrosine (Y), which is the preferred amino acid for the peptide-mhc interaction (peptides 8, 9, 10, 11, 13, see Supplementary Fig. 6). We saw that the TCR were able to recognize peptide variants with up to 6 amino acids substituted compared to the original sequence (peptide 4 and 6) when the substituted amino acids were represented in the TCR fingerprint. The respective peptide sequences (substitutions in red), %Rank, MFI and percentages out of total CD8 T cells are indicated within the contour plots. The fluorescent-based MHC multimer stainings were performed once.
16 Supplementary Figure 10
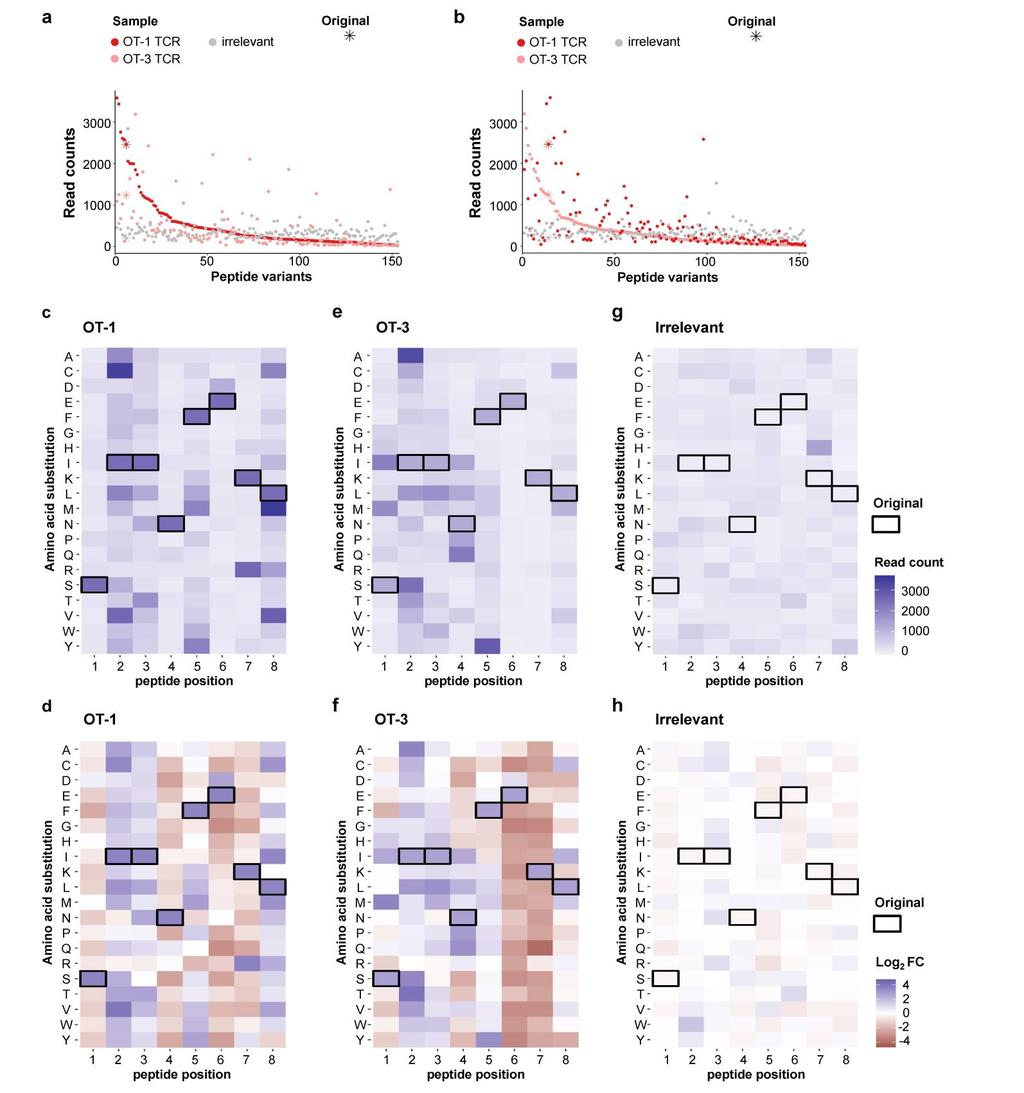
17 The DNA barcode-based MHC multimer analysis of OT-1 and OT-3 T cells, showing read counts, log 2 FC and data from an irrelevant sample The underlying data from the DNA barcode-based analysis of splenocytes derived from OT-1 or OT-3 transgenic mice or T cells from wild-type C57BL/6 mice, respectively, used for Fig. 2a-d. The analysis was performed with all possible variations created by single-position amino acid substitutions of the H-2Kb restricted peptide, SIINFEKL. (a,b) Shows the clonality reduced read counts of each pmhc-associated DNA barcode plotted based on the hierarchy of counts derived from (a) screening the OT-1 T cells or (b) screening the OT-3 T cells. The obtained read counts from screening splenocytes from wild-type C57BL/6 mice are also plotted. (c-h) Heat map showing the read counts or log 2 FC derived from screening of (c,d) the OT-1 T cells, (e,f) the OT-3 T cells or (g,h) the wild-type C57BL/6 splenocytes respectively. Each row represents a given amino acid and each column a position in the peptide sequence. The amino acids of the original peptide target are marked with black borders. The analysis was performed once.
18
19 Supplementary Figure 11 Fluorescence-based MHC multimer analyses of OT-1 and OT-3 T cells (a) Dot plots from the fluorescent-based MHC multimer staining of splenocytes derived from OT-1 or OT-3 mice. MHC tetramers carrying one of seven variations of SIINFEKL were applied in single color MHC multimer analyses. When comparing the staining of OT-1 and OT-3 in relation to their binding to the original peptide (1), the most variation between the TCRs is seen when staining with MHC multimers carrying peptide 3, 6 or 7. Peptide 3, which has a K to R substitution at position 7, leads to a higher MFI of the OT-1 T cells but a lower MFI of the OT-3 T cells. The opposite is seen for peptides 6 and 7, with N to P or S to M substitutions at position 4 and 1 respectively. When staining with the corresponding tetramers, the OT-1 T cells has a marked decreased in MFI, whereas the MFI of the OT-3 T cells is retained. These binding properties reflects the amino acid preferences evident from the individual TCR fingerprints (Fig. 2c,d). The respective peptide sequences, MFI and percentages out of total CD8 + T cells are indicated adjacent to or within the contour plots. All peptide variants are predicted to be strong binders of H-2Kb (%Rank<0.5). b) Dot plots from staining OT-1, OT-3 or wild-type C57BL/6 splenocytes with the full panel of 153 DNA barcode-labeled MHC multimer variants, a single irrelevant MHC multimer carrying the UV-conditional peptide (p*) or the original peptide SIINFEKL. The MFI and percentages out of total CD8 T cells are indicated within the contour plots. The MHC multimer stainings were performed once.
20
21 Supplementary Figure 12 Detailed information on the 12 HLA-A*0201 KLL -engaging TCRs (a) Principal component analysis (PCA) to visualize the diversity of the 12 TCR fingerprints of the MCC-derived T cells from Fig. 2e. Each dot represents one T cell clone (n=12 individual T cell clones). (b) Bar plots of the cytokine secretion of clone 2 and clone 5, w876, after stimulating the clonal T cells with peptides containing alanine substitutions at the indicated positions. The bars correspond to the individual stainings of the data shown in Fig. 2f. The grey bars indicate the original peptide that has an alanine at position 6. Cytokine secretion was determined once. (c) A correlation matrix showing the interrelationship between each of the 1000 peptides (predicted from the human proteome) that match best the individual TCR fingerprints of the 12 MCC clones (n=12,000) of Fig. 2e. Correlation was determined using Pearson s correlation coefficient. Similarity is depicted on both color grading and size of dots. (d) Screening for T cell recognition of 75 peptides that are potentially cross-recognized by one or more of the 12 clonal T cells that has the HLA-A*A0201 restricted KLLEIAPNC peptide as original target. A library including 75 potentially cross-recognized peptides were applied in a DNA barcode-based MHC multimer analysis (Fig. 3a and Supplementary Data 12). The clonality reduced read counts resulting from the DNA barcode-based screen of all 75 pmhc multimers and all 12 clones are plotted (y-axis) according to %Rank score (x-axis). Dotted line at x=2 marks the recommended cut-off of peptides that are considered as binders to MHC. The closed symbol indicates a response that were also stained with fluorescently labeled MHC tetramers. The plotted data is mean of duplicate analyses and error bars indicate range of duplicates.
22 Supplementary Figure 13 General gating strategy (a) Shows an example of the initial gating of CD8 + T cells. (b) Shows an example of the multimer positive population of total CD8 + T cells, which was sorted in a DNA barcode-based analysis. This gating strategy was applied for all MHC multimer analyses.
Supplementary Data 1. Alanine substitutions and position variants of APNCYGNIPL. Applied in
 Supplementary Data 1. Alanine substitutions and position variants of APNCYGNIPL. Applied in Supplementary Fig. 2 Substitution Sequence Position variant Sequence original APNCYGNIPL original APNCYGNIPL
Nature Biotechnology: doi: /nbt Supplementary Figure 1. Binding capacity of DNA-barcoded MHC multimers and recovery of antigen specificity
 Supplementary Figure 1 Binding capacity of DNA-barcoded MHC multimers and recovery of antigen specificity (a, b) Fluorescent-based determination of the binding capacity of DNA-barcoded MHC multimers (+barcode)
Nature Immunology: doi: /ni Supplementary Figure 1
 Supplementary Figure 1 A β-strand positions consistently places the residues at CDR3β P6 and P7 within human and mouse TCR-peptide-MHC interfaces. (a) E8 TCR containing V β 13*06 carrying with an 11mer
SUPPLEMENTARY INFORMATION
 Complete but curtailed T-cell response to very-low-affinity antigen Dietmar Zehn, Sarah Y. Lee & Michael J. Bevan Supp. Fig. 1: TCR chain usage among endogenous K b /Ova reactive T cells. C57BL/6 mice
Low Avidity CMV + T Cells accumulate in Old Humans
 Supplementary Figure Legends Supplementary Figure 1. CD45RA expressing CMVpp65-specific T cell populations accumulate within HLA-A*0201 and HLA-B*0701 individuals Pooled data showing the size of the NLV/HLA-A*0201-specific
Dual Targeting Nanoparticle Stimulates the Immune
 Dual Targeting Nanoparticle Stimulates the Immune System to Inhibit Tumor Growth Alyssa K. Kosmides, John-William Sidhom, Andrew Fraser, Catherine A. Bessell, Jonathan P. Schneck * Supplemental Figure
Supplementary Figure 1
 Supplementary Figure 1 Identification of IFN-γ-producing CD8 + and CD4 + T cells with naive phenotype by alternative gating and sample-processing strategies. a. Contour 5% probability plots show definition
Supplementary Figure 1. Enhanced detection of CTLA-4 on the surface of HIV-specific
 SUPPLEMENTARY FIGURE LEGEND Supplementary Figure 1. Enhanced detection of CTLA-4 on the surface of HIV-specific CD4 + T cells correlates with intracellular CTLA-4 levels. (a) Comparative CTLA-4 levels
HD1 (FLU) HD2 (EBV) HD2 (FLU)
 HD2 (EBV) HD2 (FLU)") ramer staining + anti-pe beads ramer staining a HD1 (FLU) HD2 (EBV) HD2 (FLU).73.11.56.46.24 1.12 b CD127 + c CD127 + d CD127 - e CD127 - PD1 - PD1 + PD1 + PD1-1 1 1 1 %CD127 + PD1-8 6 4 2 + anti-pe %CD127
ramer staining + anti-pe beads ramer staining a HD1 (FLU) HD2 (EBV) HD2 (FLU).73.11.56.46.24 1.12 b CD127 + c CD127 + d CD127 - e CD127 - PD1 - PD1 + PD1 + PD1-1 1 1 1 %CD127 + PD1-8 6 4 2 + anti-pe %CD127
MHC MULTIMER PROFICIENCY PANEL 2017
 MHC MULTIMER PROFICIENCY PANEL 2017 August 2017 CONTACT Charlotte Halgreen ProficiencyPanel@immudex.com FOR MORE INFORMATION www.proficiencypanel.com MHC MULTIMER PROFICIENCY PANEL 2017 This report summarizes
Supplementary Figure 1. BMS enhances human T cell activation in vitro in a
 Supplementary Figure 1. BMS98662 enhances human T cell activation in vitro in a concentration-dependent manner. Jurkat T cells were activated with anti-cd3 and anti-cd28 antibody in the presence of titrated
Supplementary Table 1. Functional avidities of survivin-specific T-cell clones against LML-peptide
 Supplementary Table 1. Functional avidities of survivin-specific T-cell clones against LML-peptide pulsed T2 cells. clone avidity by 4-hour 51 Cr-release assay 50% lysis at E:T 10:1 [LML peptide, M] #24
Lentiviral Delivery of Combinatorial mirna Expression Constructs Provides Efficient Target Gene Repression.
 Supplementary Figure 1 Lentiviral Delivery of Combinatorial mirna Expression Constructs Provides Efficient Target Gene Repression. a, Design for lentiviral combinatorial mirna expression and sensor constructs.
Nature Biotechnology: doi: /nbt Supplementary Figure 1. Experimental design and workflow utilized to generate the WMG Protein Atlas.
 Supplementary Figure 1 Experimental design and workflow utilized to generate the WMG Protein Atlas. (a) Illustration of the plant organs and nodule infection time points analyzed. (b) Proteomic workflow
Lecture 6. Burr BIO 4353/6345 HIV/AIDS. Tetramer staining of T cells (CTL s) Andrew McMichael seminar: Background
 Andrew McMichael seminar: Background") Lecture 6 Burr BIO 4353/6345 HIV/AIDS Andrew McMichael seminar: Background Tetramer staining of T cells (CTL s) 1. Vβ 19: There are 52 T cell receptor (TCR) Vβ gene segments in germ line DNA (See following
Lecture 6 Burr BIO 4353/6345 HIV/AIDS Andrew McMichael seminar: Background Tetramer staining of T cells (CTL s) 1. Vβ 19: There are 52 T cell receptor (TCR) Vβ gene segments in germ line DNA (See following
Supplementary Figure 1. Example of gating strategy
 Supplementary Figure 1. Example of gating strategy Legend Supplementary Figure 1: First, gating is performed to include only single cells (singlets) (A) and CD3+ cells (B). After gating on the lymphocyte
activation with anti-cd3/cd28 beads and 3d following transduction. Supplemental Figure 2 shows
 Supplemental Data Supplemental Figure 1 compares CXCR4 expression in untreated CD8 + T cells, following activation with anti-cd3/cd28 beads and 3d following transduction. Supplemental Figure 2 shows the
SUPPLEMENTARY INFORMATION
 Supplementary Notes 1: accuracy of prediction algorithms for peptide binding affinities to HLA and Mamu alleles For each HLA and Mamu allele we have analyzed the accuracy of four predictive algorithms
7SK ChIRP-seq is specifically RNA dependent and conserved between mice and humans.
 Supplementary Figure 1 7SK ChIRP-seq is specifically RNA dependent and conserved between mice and humans. Regions targeted by the Even and Odd ChIRP probes mapped to a secondary structure model 56 of the
Atypical Natural Killer T-cell receptor recognition of CD1d-lipid antigens supplementary Information.
 Atypical Natural Killer T-cell receptor recognition of CD1d-lipid antigens supplementary Information. Supplementary Figure 1. Phenotypic analysis of TRBV25-1 + and TRBV25-1 - CD1d-α-GalCerreactive cells.
Supplemental Figure 1
 Supplemental Figure 1 1a 1c PD-1 MFI fold change 6 5 4 3 2 1 IL-1α IL-2 IL-4 IL-6 IL-1 IL-12 IL-13 IL-15 IL-17 IL-18 IL-21 IL-23 IFN-α Mut Human PD-1 promoter SBE-D 5 -GTCTG- -1.2kb SBE-P -CAGAC- -1.kb
Supplementary Figure 1. ALVAC-protein vaccines and macaque immunization. (A) Maximum likelihood
 Maximum likelihood") Supplementary Figure 1. ALVAC-protein vaccines and macaque immunization. (A) Maximum likelihood tree illustrating CRF01_AE gp120 protein sequence relationships between 107 Envs sampled in the RV144 trial
Supplementary Figure 1. ALVAC-protein vaccines and macaque immunization. (A) Maximum likelihood tree illustrating CRF01_AE gp120 protein sequence relationships between 107 Envs sampled in the RV144 trial
Supplemental Figure 1. CD69 antigen-response curves of CAR engrafted Jurkat T cells. Supplemental Figure 2.
 Supplemental Figure 1. CD69 antigen-response curves of CAR engrafted Jurkat T cells. To evaluate the antigen sensitivity of mutant CARs transduced Jurkat T cells were stimulated with varying concentrations
Supplementary Fig. 1: Ex vivo tetramer enrichment with anti-c-myc beads
 Supplementary Fig. 1: Ex vivo tetramer enrichment with anti-c-myc beads Representative example of comparative ex vivo tetramer enrichment performed in three independent experiments with either conventional
and follicular helper T cells is Egr2-dependent. (a) Diagrammatic representation of the
 Diagrammatic representation of the") Supplementary Figure 1. LAG3 + Treg-mediated regulation of germinal center B cells and follicular helper T cells is Egr2-dependent. (a) Diagrammatic representation of the experimental protocol for the
Supplementary Figure 1. LAG3 + Treg-mediated regulation of germinal center B cells and follicular helper T cells is Egr2-dependent. (a) Diagrammatic representation of the experimental protocol for the
MHC MULTIMER PROFICIENCY PANEL 2015
 MHC MULTIMER PROFICIENCY PANEL 2015 July 2015 CONTACT Charlotte Halgreen ProficiencyPanel@immudex.com FOR MORE INFORMATION www.proficiencypanel.com MHC MULTIMER PROFICIENCY PANEL 2015 This report summarizes
Potential cross reactions between HIV 1 specific T cells and the microbiome. Andrew McMichael Suzanne Campion
 Potential cross reactions between HIV 1 specific T cells and the microbiome Andrew McMichael Suzanne Campion Role of the Microbiome? T cell (and B cell) immune responses to HIV and Vaccines are influenced
AbSeq on the BD Rhapsody system: Exploration of single-cell gene regulation by simultaneous digital mrna and protein quantification
 BD AbSeq on the BD Rhapsody system: Exploration of single-cell gene regulation by simultaneous digital mrna and protein quantification Overview of BD AbSeq antibody-oligonucleotide conjugates. High-throughput
Mouse Clec9a ORF sequence
 Mouse Clec9a gene LOCUS NC_72 13843 bp DNA linear CON 1-JUL-27 DEFINITION Mus musculus chromosome 6, reference assembly (C57BL/6J). ACCESSION NC_72 REGION: 129358881-129372723 Mouse Clec9a ORF sequence
Antigen Recognition by T cells
 Antigen Recognition by T cells TCR only recognize foreign Ags displayed on cell surface These Ags can derive from pathogens, which replicate within cells or from pathogens or their products that cells
SUPPLEMENTARY INFORMATION
 DOI: 1.138/ncb3355 a S1A8 + cells/ total.1.8.6.4.2 b S1A8/?-Actin c % T-cell proliferation 3 25 2 15 1 5 T cells Supplementary Figure 1 Inter-tumoral heterogeneity of MDSC accumulation in mammary tumor
Nature Immunology: doi: /ni Supplementary Figure 1. DNA-methylation machinery is essential for silencing of Cd4 in cytotoxic T cells.
 Supplementary Figure 1 DNA-methylation machinery is essential for silencing of Cd4 in cytotoxic T cells. (a) Scheme for the retroviral shrna screen. (b) Histogram showing CD4 expression (MFI) in WT cytotoxic
Pearson r = P (one-tailed) = n = 9
 = n = 9") 8F4-Specific Lysis, % 1 UPN1 UPN3 8 UPN7 6 Pearson r =.69 UPN2 UPN5 P (one-tailed) =.192 4 UPN8 n = 9 2 UPN9 UPN4 UPN6 5 1 15 2 25 8 8F4, % Max MFI Supplementary Figure S1. AML samples UPN1-UPN9 show variable
8F4-Specific Lysis, % 1 UPN1 UPN3 8 UPN7 6 Pearson r =.69 UPN2 UPN5 P (one-tailed) =.192 4 UPN8 n = 9 2 UPN9 UPN4 UPN6 5 1 15 2 25 8 8F4, % Max MFI Supplementary Figure S1. AML samples UPN1-UPN9 show variable
ILC1 and ILC3 isolation and culture Following cell sorting, we confirmed that the recovered cells belonged to the ILC1, ILC2 and
 Supplementary Methods and isolation and culture Following cell sorting, we confirmed that the recovered cells belonged to the, ILC2 and subsets. For this purpose we performed intracellular flow cytometry
Supplementary Information
 Supplementary Information High throughput epitope discovery reveals frequent recognition of neo-antigens by CD4 + T-cells in human melanoma Carsten Linnemann, Marit M. van Buuren, Laura Bies, Els M.E.Verdegaal,
Supplementary Fig. 1 p38 MAPK negatively regulates DC differentiation. (a) Western blot analysis of p38 isoform expression in BM cells, immature DCs
 Western blot analysis of p38 isoform expression in BM cells, immature DCs") Supplementary Fig. 1 p38 MAPK negatively regulates DC differentiation. (a) Western blot analysis of p38 isoform expression in BM cells, immature DCs (idcs) and mature DCs (mdcs). A myeloma cell line expressing
Supplementary Fig. 1 p38 MAPK negatively regulates DC differentiation. (a) Western blot analysis of p38 isoform expression in BM cells, immature DCs (idcs) and mature DCs (mdcs). A myeloma cell line expressing
SUPPLEMENTARY INFORMATION
 Supplemental Figure 1. Furin is efficiently deleted in CD4 + and CD8 + T cells. a, Western blot for furin and actin proteins in CD4cre-fur f/f and fur f/f Th1 cells. Wild-type and furin-deficient CD4 +
BD CBA on the BD Accuri C6: Bringing Multiplexed Cytokine Detection to the Benchtop
 BD CBA on the BD Accuri C6: Bringing Multiplexed Cytokine Detection to the Benchtop Maria Dinkelmann, PhD Senior Marketing Applications Specialist BD Biosciences, Ann Arbor, MI 23-14380-00 Cellular Communication
Human and mouse T cell regulation mediated by soluble CD52 interaction with Siglec-10. Esther Bandala-Sanchez, Yuxia Zhang, Simone Reinwald,
 Human and mouse T cell regulation mediated by soluble CD52 interaction with Siglec-1 Esther Bandala-Sanchez, Yuxia Zhang, Simone Reinwald, James A. Dromey, Bo Han Lee, Junyan Qian, Ralph M Böhmer and Leonard
Nature Structural & Molecular Biology: doi: /nsmb Supplementary Figure 1
 Supplementary Figure 1 Effect of HSP90 inhibition on expression of endogenous retroviruses. (a) Inducible shrna-mediated Hsp90 silencing in mouse ESCs. Immunoblots of total cell extract expressing the
MHC Tetramers and Monomers for Immuno-Oncology and Autoimmunity Drug Discovery
 MHC Tetramers and Monomers for Immuno-Oncology and Autoimmunity Drug Discovery Your Partner in Drug Discovery and Research MHC Tetramer Background T-Cell Receptors recognize and bind to complexes composed
Supplemental Figure S1. Expression of Cirbp mrna in mouse tissues and NIH3T3 cells.
 SUPPLEMENTAL FIGURE AND TABLE LEGENDS Supplemental Figure S1. Expression of Cirbp mrna in mouse tissues and NIH3T3 cells. A) Cirbp mrna expression levels in various mouse tissues collected around the clock
T Cell Receptor Optimized Peptide Skewing of the T-Cell Repertoire Can Enhance Antigen Targeting
 T Cell Receptor Optimized Peptide Skewing of the T-Cell Repertoire Can Enhance Antigen Targeting Julia Ekeruche-Makinde 1*, Mathew Clement 1*, David K Cole 1*, Emily S J Edwards 1, Kristin Ladell 1, John
Eosinophils are required. for the maintenance of plasma cells in the bone marrow
 Eosinophils are required for the maintenance of plasma cells in the bone marrow Van Trung Chu, Anja Fröhlich, Gudrun Steinhauser, Tobias Scheel, Toralf Roch, Simon Fillatreau, James J. Lee, Max Löhning
Nature Immunology: doi: /ni Supplementary Figure 1. Characteristics of SEs in T reg and T conv cells.
 Supplementary Figure 1 Characteristics of SEs in T reg and T conv cells. (a) Patterns of indicated transcription factor-binding at SEs and surrounding regions in T reg and T conv cells. Average normalized
Degenerate T-cell Recognition of Peptides on MHC Molecules Creates Large Holes in the T-cell Repertoire
 Degenerate T-cell Recognition of Peptides on MHC Molecules Creates Large Holes in the T-cell Repertoire Jorg J. A. Calis*, Rob J. de Boer, Can Keşmir Theoretical Biology & Bioinformatics, Utrecht University,
Supplemental Figures Supplemental Figure 1:
 Supplemental Figures Supplemental Figure 1: Representative FACS data showing Concurrent Brain cell type Acquisition using either Percoll PLUS (top row) or myelin removal beads (bottom two rows). Debris
Supplementary Data. Treg phenotype
 Supplementary Data Additional Experiment An additional experiment was performed using cryopreserved peripheral blood mononuclear cells (PBMC) derived from five renal cell carcinoma (RCC) patients [see
SUPPLEMENTARY INFORMATION
 doi: 1.138/nature775 4 O.D. (595-655) 3 1 -ζ no antibody isotype ctrl Plated Soluble 1F6 397 7H11 Supplementary Figure 1 Soluble and plated anti- Abs induce -! signalling. B3Z cells stably expressing!
Mechanisms of antagonism of HIVspecific CD4+ T cell responses BSRI
 Mechanisms of antagonism of HIVspecific CD4+ T cell responses BSRI Problems Virus escape from immune recognition Antagonism of T cell responses Peptide-MHC-TCR interaction T cell antagonism Variants of
The autoimmune disease-associated PTPN22 variant promotes calpain-mediated Lyp/Pep
 SUPPLEMENTARY INFORMATION The autoimmune disease-associated PTPN22 variant promotes calpain-mediated Lyp/Pep degradation associated with lymphocyte and dendritic cell hyperresponsiveness Jinyi Zhang, Naima
Supplementary Table 1. Data collection and refinement statistics (molecular replacement).
.") Supplementary Table 1. Data collection and refinement statistics (molecular replacement). Data set statistics HLA A*0201- ALWGPDPAAA PPI TCR PPI TCR/A2- ALWGPDPAAA PPI TCR/A2- ALWGPDPAAA Space Group P2
Supplementary Table 1. Data collection and refinement statistics (molecular replacement). Data set statistics HLA A*0201- ALWGPDPAAA PPI TCR PPI TCR/A2- ALWGPDPAAA PPI TCR/A2- ALWGPDPAAA Space Group P2
SUPPLEMENTARY INFORMATION. Supp. Fig. 1. Autoimmunity. Tolerance APC APC. T cell. T cell. doi: /nature06253 ICOS ICOS TCR CD28 TCR CD28
 Supp. Fig. 1 a APC b APC ICOS ICOS TCR CD28 mir P TCR CD28 P T cell Tolerance Roquin WT SG Icos mrna T cell Autoimmunity Roquin M199R SG Icos mrna www.nature.com/nature 1 Supp. Fig. 2 CD4 + CD44 low CD4
Supplementary. presence of the. (c) mrna expression. Error. in naive or
 mrna expression. Error. in naive or") Figure 1. (a) Naive CD4 + T cells were activated in the presence of the indicated cytokines for 3 days. Enpp2 mrna expression was measured by qrt-pcrhr, infected with (b, c) Naive CD4 + T cells were activated
Figure 1. (a) Naive CD4 + T cells were activated in the presence of the indicated cytokines for 3 days. Enpp2 mrna expression was measured by qrt-pcrhr, infected with (b, c) Naive CD4 + T cells were activated
Supplementary Figures
 Supplementary Figures Supplementary Fig. 1. Surface thiol groups and reduction of activated T cells. (a) Activated CD8 + T-cells have high expression levels of free thiol groups on cell surface proteins.
IgG3 regulates tissue-like memory B cells in HIV-infected individuals
 SUPPLEMENTARY INFORMATION Articles https://doi.org/10.1038/s41590-018-0180-5 In the format provided by the authors and unedited. IgG3 regulates tissue-like memory B cells in HIV-infected individuals Lela
Bead Based Assays for Cytokine Detection
 Bead Based Assays for Cytokine Detection September 27, 2014 6 th EFIS-EJI South East European Immunology School SEEIS 2014 Timisoara, Romania The Cells of the Immune System The Immune Reaction (Th2) (Th1)
Supplementary Figure 1. SybII and Ceb are sorted to distinct vesicle populations in astrocytes. Nature Neuroscience: doi: /nn.
 Supplementary Figure 1 SybII and Ceb are sorted to distinct vesicle populations in astrocytes. (a) Exemplary images for cultured astrocytes co-immunolabeled with SybII and Ceb antibodies. SybII accumulates
<10. IL-1β IL-6 TNF + _ TGF-β + IL-23
 3 ns 25 ns 2 IL-17 (pg/ml) 15 1 ns ns 5 IL-1β IL-6 TNF
Nature Biotechnology: doi: /nbt.3828
 Supplementary Figure 1 Development of a FRET-based MCS. (a) Linker and MA2 modification are indicated by single letter amino acid code. indicates deletion of amino acids and N or C indicate the terminus
Nature Immunology: doi: /ni Supplementary Figure 1. RNA-Seq analysis of CD8 + TILs and N-TILs.
 Supplementary Figure 1 RNA-Seq analysis of CD8 + TILs and N-TILs. (a) Schematic representation of the tumor and cell types used for the study. HNSCC, head and neck squamous cell cancer; NSCLC, non-small
Nature Structural & Molecular Biology: doi: /nsmb Supplementary Figure 1
 Supplementary Figure 1 Design of isolated protein and RNC constructs, and homogeneity of purified RNCs. (a) Schematic depicting the design and nomenclature used for all the isolated proteins and RNCs used
Supplemental Information. Aryl Hydrocarbon Receptor Controls. Monocyte Differentiation. into Dendritic Cells versus Macrophages
 Immunity, Volume 47 Supplemental Information Aryl Hydrocarbon Receptor Controls Monocyte Differentiation into Dendritic Cells versus Macrophages Christel Goudot, Alice Coillard, Alexandra-Chloé Villani,
SUPPLEMENTARY INFORMATION
 DOI: 10.1038/ncb2638 Figure S1 Morphological characteristics of fetal testes and ovaries from 6.5-20 developmental weeks. Representative images of Hematoxylin and Eosin staining of testes and ovaries over
Antigen capture and presentation to T lymphocytes
 Antigen capture and presentation to T lymphocytes What T lymphocytes see Innate Immunity Immediately available or Very broad specificity rapidly recruited Adaptive Immunity Rare and naïve cells require
Human Immunodeficiency Virus Type-1 Myeloid Derived Suppressor Cells Inhibit Cytomegalovirus Inflammation through Interleukin-27 and B7-H4
 Human Immunodeficiency Virus Type-1 Myeloid Derived Suppressor Cells Inhibit Cytomegalovirus Inflammation through Interleukin-27 and B7-H4 Ankita Garg, Rodney Trout and Stephen A. Spector,,* Department
Nature Genetics: doi: /ng Supplementary Figure 1. Workflow of CDR3 sequence assembly from RNA-seq data.
 Supplementary Figure 1 Workflow of CDR3 sequence assembly from RNA-seq data. Paired-end short-read RNA-seq data were mapped to human reference genome hg19, and unmapped reads in the TCR regions were extracted
TITLE: Development of Antigen Presenting Cells for adoptive immunotherapy in prostate cancer
 AD Award Number: W8-XWH-5-- TITLE: Development of Antigen Presenting Cells for adoptive immunotherapy in prostate cancer PRINCIPAL INVESTIGATOR: Mathias Oelke, Ph.D. CONTRACTING ORGANIZATION: Johns Hopkins
Commercially available HLA Class II tetramers (Beckman Coulter) conjugated to
 conjugated to") Class II tetramer staining Commercially available HLA Class II tetramers (Beckman Coulter) conjugated to PE were combined with dominant HIV epitopes (DRB1*0101-DRFYKTLRAEQASQEV, DRB1*0301- PEKEVLVWKFDSRLAFHH,
Class II tetramer staining Commercially available HLA Class II tetramers (Beckman Coulter) conjugated to PE were combined with dominant HIV epitopes (DRB1*0101-DRFYKTLRAEQASQEV, DRB1*0301- PEKEVLVWKFDSRLAFHH,
Surface plasmon resonance (SPR) analysis
 analysis") Surface plasmon resonance (SPR) analysis Soluble CD8αα and was manufactured as described previously. 1,2 The C12C heterodimeric TCR was produced using an engineered disulfide bridge between the constant
Surface plasmon resonance (SPR) analysis Soluble CD8αα and was manufactured as described previously. 1,2 The C12C heterodimeric TCR was produced using an engineered disulfide bridge between the constant
Supplementary Materials for
 advances.sciencemag.org/cgi/content/full/4/3/eaaq0762/dc1 Supplementary Materials for Structures of monomeric and oligomeric forms of the Toxoplasma gondii perforin-like protein 1 Tao Ni, Sophie I. Williams,
B220 CD4 CD8. Figure 1. Confocal Image of Sensitized HLN. Representative image of a sensitized HLN
 B220 CD4 CD8 Natarajan et al., unpublished data Figure 1. Confocal Image of Sensitized HLN. Representative image of a sensitized HLN showing B cell follicles and T cell areas. 20 µm thick. Image of magnification
Nature Immunology: doi: /ni.3631
 Supplementary Figure 1 SPT analyses of Zap70 at the T cell plasma membrane. (a) Total internal reflection fluorescent (TIRF) excitation at 64-68 degrees limits single molecule detection to 100-150 nm above
Supplemental Information. Genomic Characterization of Murine. Monocytes Reveals C/EBPb Transcription. Factor Dependence of Ly6C Cells
 Immunity, Volume 46 Supplemental Information Genomic Characterization of Murine Monocytes Reveals C/EBPb Transcription Factor Dependence of Ly6C Cells Alexander Mildner, Jörg Schönheit, Amir Giladi, Eyal
Narrowed TCR repertoire and viral escape as a consequence of heterologous immunity
 Research article Narrowed TCR repertoire and viral escape as a consequence of heterologous immunity Markus Cornberg, 1,2 Alex T. Chen, 1 Lee A. Wilkinson, 1 Michael A. Brehm, 1 Sung-Kwon Kim, 1 Claudia
Nature Immunology: doi: /ni Supplementary Figure 1. Gene expression profile of CD4 + T cells and CTL responses in Bcl6-deficient mice.
 Supplementary Figure 1 Gene expression profile of CD4 + T cells and CTL responses in Bcl6-deficient mice. (a) Gene expression profile in the resting CD4 + T cells were analyzed by an Affymetrix microarray
New technologies for studying human immunity. Lisa Wagar Postdoctoral fellow, Mark Davis lab Stanford University School of Medicine
 New technologies for studying human immunity Lisa Wagar Postdoctoral fellow, Mark Davis lab Stanford University School of Medicine New strategies: Human immunology is ideal for a systems approach We have
Titrations in Cytobank
 The Premier Platform for Single Cell Analysis (1) Titrations in Cytobank To analyze data from a titration in Cytobank, the first step is to upload your own FCS files or clone an experiment you already
CONVENTIONAL VACCINE DEVELOPMENT
 CONVENTIONAL VACCINE DEVELOPMENT PROBLEM Lethal germ Dead mouse LIVE VACCINES Related but harmless germ gives protection against lethal pathogen. Examples are the original pox vaccine and some TB vaccines
Supplemental Figure 1. Activated splenocytes upregulate Serpina3g and Serpina3f expression.
 Relative Serpin expression 25 2 15 1 5 Serpina3f 1 2 3 4 5 6 8 6 4 2 Serpina3g 1 2 3 4 5 6 C57BL/6 DBA/2 Supplemental Figure 1. Activated splenocytes upregulate Serpina3g and Serpina3f expression. Splenocytes
Supplementary Figure 1. Characterization of basophils after reconstitution of SCID mice
 Supplementary figure legends Supplementary Figure 1. Characterization of after reconstitution of SCID mice with CD4 + CD62L + T cells. (A-C) SCID mice (n = 6 / group) were reconstituted with 2 x 1 6 CD4
Supplementary Figure S1. PTPN2 levels are not altered in proliferating CD8+ T cells. Lymph node (LN) CD8+ T cells from C57BL/6 mice were stained with
 CD8+ T cells from C57BL/6 mice were stained with") Supplementary Figure S1. PTPN2 levels are not altered in proliferating CD8+ T cells. Lymph node (LN) CD8+ T cells from C57BL/6 mice were stained with CFSE and stimulated with plate-bound α-cd3ε (10µg/ml)
Supplementary Figure S1. PTPN2 levels are not altered in proliferating CD8+ T cells. Lymph node (LN) CD8+ T cells from C57BL/6 mice were stained with CFSE and stimulated with plate-bound α-cd3ε (10µg/ml)
Supplementary Figures
 Supplementary Figures Supplementary Figure 1 Characterization of stable expression of GlucB and sshbira in the CT26 cell line (a) Live cell imaging of stable CT26 cells expressing green fluorescent protein
SUPPLEMENTARY INFORMATION
 doi:10.1038/nature10866 a b 1 2 3 4 5 6 7 Match No Match 1 2 3 4 5 6 7 Turcan et al. Supplementary Fig.1 Concepts mapping H3K27 targets in EF CBX8 targets in EF H3K27 targets in ES SUZ12 targets in ES
Supplementary Materials for
 www.sciencesignaling.org/cgi/content/full/3/114/ra23/dc1 Supplementary Materials for Regulation of Zap70 Expression During Thymocyte Development Enables Temporal Separation of CD4 and CD8 Repertoire Selection
Electron micrograph of phosphotungstanic acid-stained exosomes derived from murine
 1 SUPPLEMENTARY INFORMATION SUPPLEMENTARY FIGURES Supplementary Figure 1. Physical properties of murine DC-derived exosomes. a, Electron micrograph of phosphotungstanic acid-stained exosomes derived from
Structural Characterization of Prion-like Conformational Changes of the Neuronal Isoform of Aplysia CPEB
 Structural Characterization of Prion-like Conformational Changes of the Neuronal Isoform of Aplysia CPEB Bindu L. Raveendra, 1,5 Ansgar B. Siemer, 2,6 Sathyanarayanan V. Puthanveettil, 1,3,7 Wayne A. Hendrickson,
Supplementary Figure 1 CD4 + T cells from PKC-θ null mice are defective in NF-κB activation during T cell receptor signaling. CD4 + T cells were
 Supplementary Figure 1 CD4 + T cells from PKC-θ null mice are defective in NF-κB activation during T cell receptor signaling. CD4 + T cells were isolated from wild type (PKC-θ- WT) or PKC-θ null (PKC-θ-KO)
Crystallization-grade After D After V3 cocktail. Time (s) Time (s) Time (s) Time (s) Time (s) Time (s)
 Time (s) Time (s) Time (s) Time (s) Time (s)") Ligand Type Name 6 Crystallization-grade After 447-52D After V3 cocktail Receptor CD4 Resonance Units 5 1 5 1 5 1 Broadly neutralizing antibodies 2G12 VRC26.9 Resonance Units Resonance Units 3 1 15 1 5
Ligand Type Name 6 Crystallization-grade After 447-52D After V3 cocktail Receptor CD4 Resonance Units 5 1 5 1 5 1 Broadly neutralizing antibodies 2G12 VRC26.9 Resonance Units Resonance Units 3 1 15 1 5
The Immune Epitope Database Analysis Resource: MHC class I peptide binding predictions. Edita Karosiene, Ph.D.
 The Immune Epitope Database Analysis Resource: MHC class I peptide binding predictions Edita Karosiene, Ph.D. edita@liai.org IEDB Workshop October 29, 2015 Outline Introduction MHC-I peptide binding prediction
Incomplete immune response to Coxsackie B viruses. associates with early autoimmunity against insulin
 Incomplete immune response to Coxsackie B viruses associates with early autoimmunity against insulin Michelle P. Ashton 1, Anne Eugster 1, Denise Walther 1, Natalie Daehling 1, Stephanie Riethausen 2,
Supplemental Figure 1. Cell-bound Cetuximab reduces EGFR staining intensity. Blood
 Antibody-mediated depletion of CD19-CAR T cells Supplemental 1 Supplemental Materials Supplemental Figure 1. Supplemental Figure 1. Cell-bound Cetuximab reduces EGFR staining intensity. Blood cells were
<20 <20 <20 < <20 <20 <20 <20. Mock
 Cross-Lineage Neutralization PRNT 80 Titers Asian Asian West African Indian Ocean Group NHP Strain 181/25 Strain 99659 Strain 37997 Strain LR 142590 80 80 20 40 EILV/CHIKV 150844 640 640 160 320 Mock 150849
CD25-PE (BD Biosciences) and labeled with anti-pe-microbeads (Miltenyi Biotec) for depletion of CD25 +
 and labeled with anti-pe-microbeads (Miltenyi Biotec) for depletion of CD25 +") Supplements Supplemental Materials and Methods Depletion of CD25 + T-cells from PBMC. Fresh or HD precultured PBMC were stained with the conjugate CD25-PE (BD Biosciences) and labeled with anti-pe-microbeads
Supplements Supplemental Materials and Methods Depletion of CD25 + T-cells from PBMC. Fresh or HD precultured PBMC were stained with the conjugate CD25-PE (BD Biosciences) and labeled with anti-pe-microbeads
Supplementary Figure 1. Efficiency of Mll4 deletion and its effect on T cell populations in the periphery. Nature Immunology: doi: /ni.
 Supplementary Figure 1 Efficiency of Mll4 deletion and its effect on T cell populations in the periphery. Expression of Mll4 floxed alleles (16-19) in naive CD4 + T cells isolated from lymph nodes and
Supplementary Data Table of Contents:
 Supplementary Data Table of Contents: - Supplementary Methods - Supplementary Figures S1(A-B) - Supplementary Figures S2 (A-B) - Supplementary Figures S3 - Supplementary Figures S4(A-B) - Supplementary
T Cell Development II: Positive and Negative Selection
 T Cell Development II: Positive and Negative Selection 8 88 The two phases of thymic development: - production of T cell receptors for antigen, by rearrangement of the TCR genes CD4 - selection of T cells
Nature Genetics: doi: /ng Supplementary Figure 1. HOX fusions enhance self-renewal capacity.
 Supplementary Figure 1 HOX fusions enhance self-renewal capacity. Mouse bone marrow was transduced with a retrovirus carrying one of three HOX fusion genes or the empty mcherry reporter construct as described
In vitro human regulatory T cell suppression assay
 Human CD4 + CD25 + regulatory T cell isolation, in vitro suppression assay and analysis In vitro human regulatory T cell suppression assay Introduction Regulatory T (Treg) cells are a subpopulation of
Figure S1. Western blot analysis of clathrin RNA interference in human DCs Human immature DCs were transfected with 100 nm Clathrin SMARTpool or
 Figure S1. Western blot analysis of clathrin RNA interference in human DCs Human immature DCs were transfected with 100 nm Clathrin SMARTpool or control nontargeting sirnas. At 90 hr after transfection,