a 0,8 Figure S1 8 h 12 h y = 0,036x + 0,2115 y = 0,0366x + 0,206 Labeling index Labeling index ctrl shrna Time (h) Time (h) ctrl shrna S G2 M G1
|
|
|
- Jayson Daniels
- 5 years ago
- Views:
Transcription
 - - Time (h) c d")
 M G S G M G S G e Bin Bin 9 Bin Bin")
1 (GFP+ BrdU+)/GFP+ Labeling index Labeling index Figure S a, b, y =,x +, y =,x +,,,,,,,, Time (h) - - Time (h) c d S G M G h M G S G M G S G h Time of BrdU injection after electroporation (h) M G S G M G S G e Bin Bin 9 Bin Bin 9
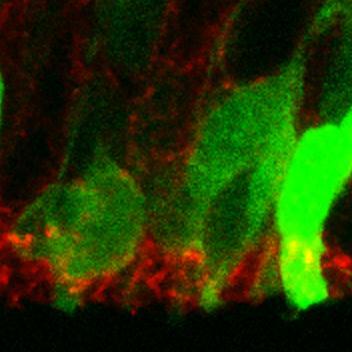
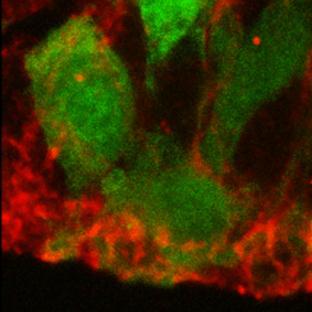
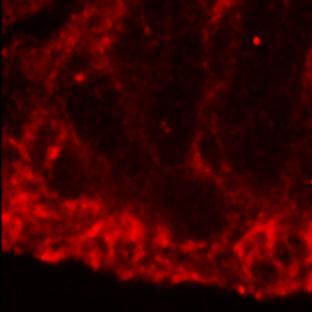
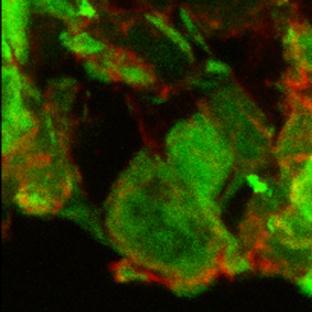
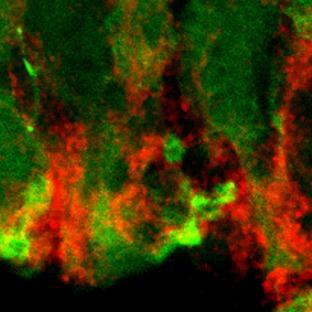
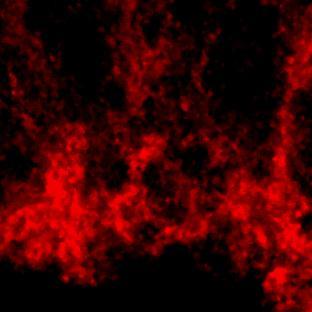
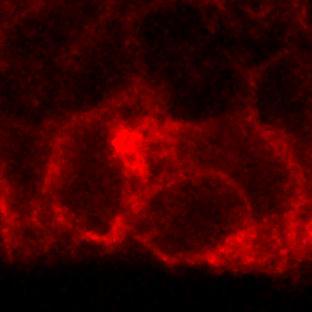
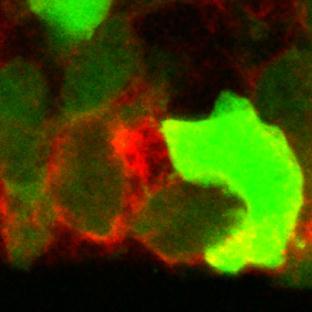
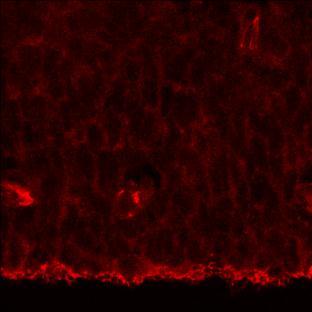
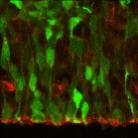
2 Supplementary Figure S: Rnd knockdown does not affect cell cycle progression in cortical progenitors. (a) We first used the S-phase cumulative labeling technique to analyze ex vivo the cell cycle kinetics of control and Rnd deficient cells days after electroporation. However, as previously described, the labeling index was not linear suggesting that electroporation in the targets a synchronized cohort of cycling precursors, which precluded the use of BrdU cumulative labeling as a valid technique to measure the cell cycle paramaters of the GFP + precursors. (b) However, if a linear curve is drawn between the values obtained for the different time points, the equation obtained with control cells (blue) is equivalent to the equation obtained with Rnd knockdown cells (red) suggesting that the cell cycle parameters are similar between these two populations of cells. Data are presented as the mean ± s.e.m. from at least three different sections at each time point. (c) G duration is similar in control and Rnd deficient cells as the number of GFP + cells that had incorporated BrdU is similar between the two conditions at different time points after electroporation. Data are presented as the mean ± s.e.m. from at least six sections prepared from three or four embryos obtained from two or three litters. (d) Schematic representation of the results obtained in (c) and h after electroporation. Electroporation is optimal during S, G and M phases and thus targets cells preferentially during these phases. The electroporated cells (GFP + in green) progress similarly through G after electroporation at E. with or. Yellow cells = GFP + BrdU + cells; Red cells = GFP - BrdU + cells; White cells = GFP - BrdU - cells. (e) Comparison of the distribution of GFP + BrdU + cells between ctrl and after h BrdU pulse across the cortex divided into bins as indicated, with bin being at the ventricle surface and bin at the boundary. Blue rectangles show the areas enlarged in the insets and white arrowheads indicate double positive cells.
3 / IZ / IZ a b c min h h Figure S + cofilin SA 9 9 % of GFP + BrdU + cells per bin NS p=. / IZ % of GFP + BrdU + cells per bin % of GFP + BrdU + cells per bin Supplementary Figure S: Rnd regulates interkinetic nuclear migration of cortical neuron progenitors by depolymerizing F-actin. (a-c) Coelectroporation of cofilin SA, a nonphosphorylatable form of cofilin that depolymerizes F-actin, fully rescues the defects observed after Rnd silencing, min (a), h (b) and h (c) after the pulse of BrdU. GFP + BrdU + cells in a given bin are expressed as percentage of the total number of GFP + BrdU + - labeled cells in all bins. Data are presented as the mean ± s.e.m. from seven sections prepared from four embryos obtained from two or three litters. One way ANOVA followed by a Fisher PLSD post hoc test; p<., p<., p<..


4 Figure S β-catenin N-cadherin a b c d e f g h + cofilin SA i j k l F-actin m n o p ZO q r s t + cofilin SA u v w x
5 Supplementary Figure S: Rnd is required for the maintenance of adherens junctions. Close up views of electroporated cells shown in Figure. (a-x) Cortices immunostained for β- catenin (red in a, b, e, f, i, j), N-cadherin (red in c, d, g, h, k, l), F-actin (red in m, n, q, r, u, v) and ZO (red in o, p, s, t, w, x), h after the co-electroporation at E. of GFP (green) and (a, b, c, d, m, n, o, p, ), (e, f, g, h, q, r, s, t) or + cofilin SA (i, j, k, l, u, v, w, x). Scale bar represents µm.
/GFP+")
/GFP+")
6 (GFP+ Tbr+)/GFP+ (GFP+ Ki+)/GFP+ cn-cadherin (GFP+ PAX+)/GFP+ (GFP+ PAX+)/GFP+ / IZ Anaphase/Telophase Metaphase Figure S a min b + Rnd TV + Rnd TR/V9R + pcmv-rnd TV + pcmv-rnd TR/V9R.% 9.%.%.% 9.% NS p=..% %.%.%.9%.% % of GFP + BrdU + cells per bin d e + Rnd TV + Rnd TR/V9R E.. + IZ f g IZ + CP NS p=. NS p=. ZO F-actin h E.. u l (GFP+ Ki+)/GFP+ + pcmv-rnd TV + pcmv-rnd TR/V9R E..
7 Supplementary Figure S: Rnd acts in apical progenitors by antagonizing RhoA signaling but not in basal progenitors. The mutations of Rnd residues Thr and Val9 to arginines disrupts the ability of Rnd to bind the RhoA effector ROCKI and to block its kinase activity. Rnd TR/V9R was as efficient as wild-type Rnd at rescuing the defects induced by Rnd knockdown in cortical progenitors, suggesting that Rnd activities in apical and basal progenitors do not require interaction with ROCKI (the star indicates silent point mutations in the sequence recognized by ). Rnd can also bind to and stimulate the activity of the Rho GTPase-activating protein p9rhogap and this interaction is disrupted by mutation of residue T into valine. Rnd TV was partially or totally inactive at rescuing interkinetic nuclear migration, cleavage plane orientation, adherens junctions and radial glia cell displacement defects observed in Rnd silenced apical progenitors indicating that Rnd in these progenitors acts by inhibiting RhoA via the stimulation of the Rho GAP activity of p9rhogap. However Rnd TV was as efficient as wild-type Rnd at rescuing basal progenitor proliferation, demonstrating that Rnd activity in basal progenitors do not require inhibition of RhoA. See corresponding main figures for details on experiments. (b) Metaphase: + Rnd TV n= cells, + Rnd TR/V9R n=9 cells. Anaphase/Telophase: + Rnd TV n= cells, + Rnd TR/V9R n= cells. Data in a, b, d-h are presented as the mean ± s.e.m; one way ANOVA followed by a Fisher PLSD post hoc test; p<., p<., p<..
8 (GFP+ Ccnd+)/GFP+ (GFP+ Ki+)/GFP+ (GFP+ Tbr+)/GFP+ % of GFP+ cells without apical conatct (GFP+ PAX+)/GFP+ (GFP+ PAX+)/GFP+ Figure S a b c E.. E.. + IZ d e IZ + CP f u l E.. E.. (GFP+ Ki+)/GFP+ g h IZ + CP u + cofilin SA l E.. (GFP+ Ccnd+)/GFP+ Supplementary Figure S: Rnd regulates cortical neurogenesis through actin dependent and independent mechanisms. (a-c) Cofilin SA expression rescues the loss of the apical endfoot (a) as well as the displacement of radial glia cells (b, c) induced by Rnd silencing. (d-h) However, cofilin SA does not rescue the increase of basal progenitor proliferation observed after Rnd knockdown suggesting that Rnd regulates this process through actin-independent mechanism. Data are presented as the mean ± s.e.m. from at least six sections prepared from four embryos obtained from two or three litters. One way ANOVA followed by a Fisher PLSD post hoc test; p<., p<., p<..


9 Anaphase/ Telophase Metaphase Anaphase/ Telophase Metaphase Figure S a Ascl flox/flox Emx +/+,% Ascl flox/flox Emx +/Cre,%,% 9,%,% -9,%,% - -,% 9,%,% b Ascl shrna Ascl shrna + Rnd.%.%.%.%,% 9.% 9.%.%,%,%,%,%,%,9%,% c ctrl Cre d Ascl flox/flox GFP/Ki CP IZ Ki CP IZ GFP/Ki CP IZ Ki CP IZ IZ+CP ctrl Cre (GFP+/Ki+)/GFP+
10 Supplementary Figure S: Ascl regulates the proliferation and cleavage plane orientation of progenitors in the embryonic cerebral cortex. (a, b) Cleavage plane orientation is affected in Ascl-deleted (a) and Ascl-silenced (b) apical progenitors and restored when Rnd is co-expressed. Pie charts show the percentage of cells with color coded cleavage angles during metaphase and ana-telophase in Ascl flox/flox Emx +/+ (Metaphase n= cells, Ana/telophase n= cells) and Ascl flox/flox Emx +/Cre cortices (Metaphase n= cells, Ana/telophase n= 9 cells) (a) or h after the electroporation (E.) of (Metaphase n=9 cells, Ana/telophase n= 9 cells), Ascl shrna (Metaphase n=9 cells, Ana/telophase n= 9 cells) or Ascl shrna + pcmv-rnd (Metaphase n= cells, Ana/telophase n= cells) (b). Cells were analyzed from four embryos obtained from two litters in (a) and from at least six embryos obtained from three litters in (b). (c, d) Ascl flox/flox cortices electroporated at E. with GFP (control panel) or GFP and the recombinase Cre (Cre panel) and immunostained at E. for GFP (green) and Ki (red). White rectangles show the areas enlarged in the insets and white arrowheads indicate double positive cells. (d) Percentage of electroporated cells that are Ki + in the different zones of the cortex. Data are presented as the mean ± s.e.m. from five sections prepared from three embryos obtained from two litters. Student s t-test; p<.. Scale bar represents µm (c).


11 a min Figure S 9 Ascl shrna % of GFP + BrdU + cells per bin b N-cadherin F-actin ZO Ascl flox/flox Emx +/Cre Ascl flox/flox Emx +/+ Supplementary Figure S: Deletion of Ascl in the embryonic cerebral cortex does not affect interkinetic nuclear migration and adherens junctions. (a) Cerebral cortices of E. embryos were electroporated in utero with Ascl shrna or and subjected to min BrdU pulse labeling h after the electroporation. GFP + /BrdU + cells in a given bin are expressed as percentage of the total number of GFP + /BrdU + -labeled cells in all bins. Data are presented as the mean ± s.e.m. from six sections prepared from five embryos obtained from two or three litters. (b) Images of cortices after immunostaining for N-cadherin, F-actin and ZO (in red) show no difference between Ascl flox/flox Emx +/+ and Ascl flox/flox Emx +/Cre embryos. Scale bar represents µm (b).
Supplementary Figure 1
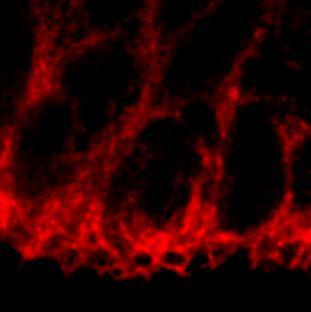
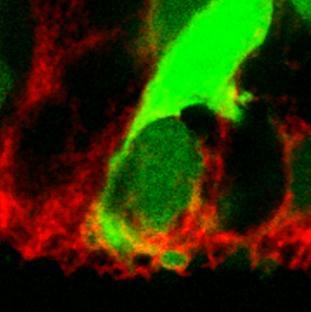
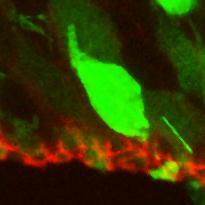
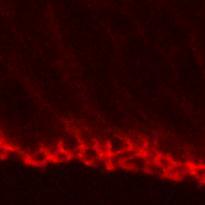
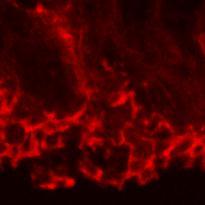
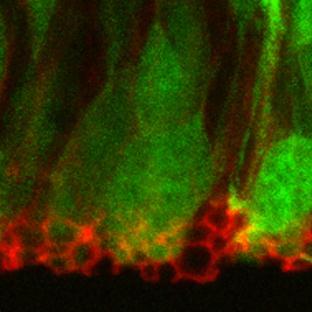
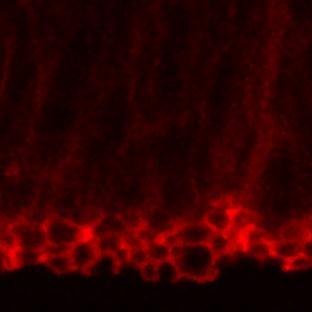
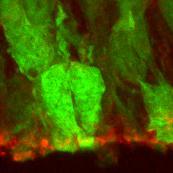
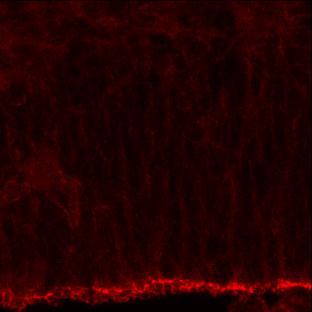
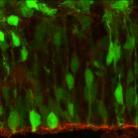
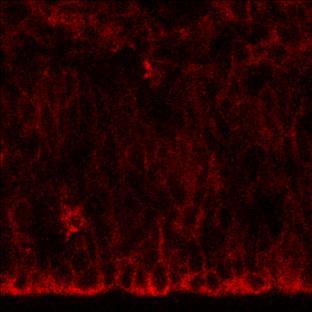
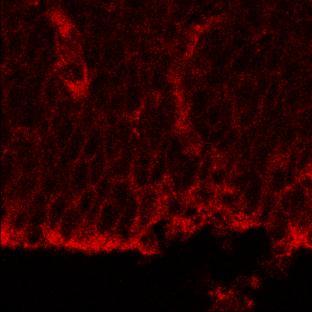
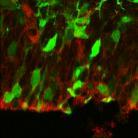
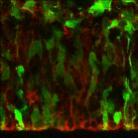
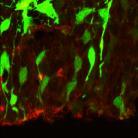
 Supplementary Figure 1 Kif1a RNAi effect on basal progenitor differentiation Related to Figure 2. Representative confocal images of the VZ and SVZ of rat cortices transfected at E16 with scrambled or Kif1a
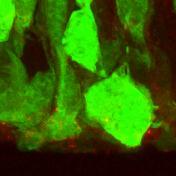
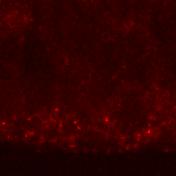
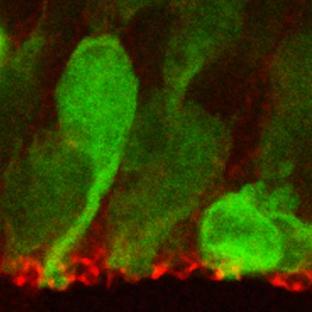
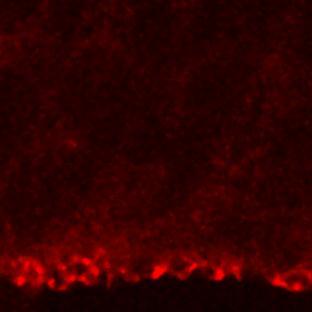
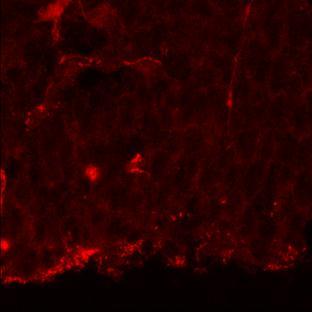
Supplementary Figure 1: Signaling centers contain few proliferating cells, express p21, and
 Supplementary Figure 1: Signaling centers contain few proliferating cells, express p21, and exclude YAP from the nucleus. (a) Schematic diagram of an E10.5 mouse embryo. (b,c) Sections at B and C in (a)
A new subtype of progenitor cell in the mouse embryonic neocortex. Xiaoqun Wang, Jin-Wu Tsai, Bridget LaMonica & Arnold R.
 A new subtype of progenitor cell in the mouse embryonic neocortex Xiaoqun Wang, Jin-Wu Tsai, Bridget LaMonica & Arnold R. Kriegstein Supplementary Figures 1-6: Supplementary Movies 1-9: Supplementary
Nature Methods: doi: /nmeth.4257
 Supplementary Figure 1 Screen for polypeptides that affect cellular actin filaments. (a) Table summarizing results from all polypeptides tested. Source shows organism, gene, and amino acid numbers used.
SUPPLEMENTARY INFORMATION
 SUPPLEMENTARY INFORMATION Human cerebral cortex development from pluripotent stem cells to functional excitatory synapses Yichen Shi 1,2, Peter Kirwan 1,2, James Smith 1,2, Hugh P.C. Robinson 3 and Frederick
Supplementary Figure 1. Electroporation of a stable form of β-catenin causes masses protruding into the IV ventricle. HH12 chicken embryos were
 Supplementary Figure 1. Electroporation of a stable form of β-catenin causes masses protruding into the IV ventricle. HH12 chicken embryos were electroporated with β- Catenin S33Y in PiggyBac expression
Supplementary Information
 1 Supplementary Information A role for primary cilia in glutamatergic synaptic integration of adult-orn neurons Natsuko Kumamoto 1,4,5, Yan Gu 1,4, Jia Wang 1,4, Stephen Janoschka 1,2, Ken-Ichi Takemaru
Nature Neuroscience: doi: /nn Supplementary Figure 1. MADM labeling of thalamic clones.
 Supplementary Figure 1 MADM labeling of thalamic clones. (a) Confocal images of an E12 Nestin-CreERT2;Ai9-tdTomato brain treated with TM at E10 and stained for BLBP (green), a radial glial progenitor-specific
OSVZ progenitors of human and ferret neocortex are epithelial-like and
 OSVZ progenitors of human and ferret neocortex are epithelial-like and expand by integrin signaling Simone A Fietz, Iva Kelava, Johannes Vogt, Michaela Wilsch-Bräuninger, Denise Stenzel, Jennifer L Fish,
* * A3027. A4623 e A3507 A3507 A3507
 a c L A327 d e A37 A37 A37 Supplementary Figure 1. Clinical manifestations of individuals with mutations. (a) Renal ultrasound of right kidney in A327 reveals small renal cysts, loss of corticomedullary
Supplementary Figure 1. Nature Neuroscience: doi: /nn.4547
 Supplementary Figure 1 Characterization of the Microfetti mouse model. (a) Gating strategy for 8-color flow analysis of peripheral Ly-6C + monocytes from Microfetti mice 5-7 days after TAM treatment. Living
SUPPLEMENTARY INFORMATION
 doi:10.1038/nature10188 Supplementary Figure 1. Embryonic epicardial genes are down-regulated from midgestation stages and barely detectable post-natally. Real time qrt-pcr revealed a significant down-regulation
Supplemental Figure 1. Quantification of proliferation in thyroid of WT, Ctns -/- and grafted
 Supplemental Figure 1. Quantification of proliferation in thyroid of WT, Ctns -/- and grafted Ctns -/- mice. Cells immunolabeled for the proliferation marker (Ki-67) were counted in sections (n=3 WT, n=4
GFP/Iba1/GFAP. Brain. Liver. Kidney. Lung. Hoechst/Iba1/TLR9!
 Supplementary information a +KA Relative expression d! Tlr9 5!! 5! NSC Neuron Astrocyte Microglia! 5! Tlr7!!!! NSC Neuron Astrocyte! GFP/Sβ/! Iba/Hoechst Microglia e Hoechst/Iba/TLR9! GFP/Iba/GFAP f Brain
Supplementary Figure 1. EC-specific Deletion of Snail1 Does Not Affect EC Apoptosis. (a,b) Cryo-sections of WT (a) and Snail1 LOF (b) embryos at
 Cryo-sections of WT (a) and Snail1 LOF (b) embryos at") Supplementary Figure 1. EC-specific Deletion of Snail1 Does Not Affect EC Apoptosis. (a,b) Cryo-sections of WT (a) and Snail1 LOF (b) embryos at E10.5 were double-stained for TUNEL (red) and PECAM-1 (green).
Supplementary Figure 1. EC-specific Deletion of Snail1 Does Not Affect EC Apoptosis. (a,b) Cryo-sections of WT (a) and Snail1 LOF (b) embryos at E10.5 were double-stained for TUNEL (red) and PECAM-1 (green).
Supplementary Materials for
 www.sciencetranslationalmedicine.org/cgi/content/full/4/117/117ra8/dc1 Supplementary Materials for Notch4 Normalization Reduces Blood Vessel Size in Arteriovenous Malformations Patrick A. Murphy, Tyson
SUPPLEMENTARY INFORMATION
 SUPPLEMENTARY INFORMATION doi:10.1038/nature11306 Supplementary Figures Supplementary Figure 1. Basic characterization of GFP+ RGLs in the dentate gyrus of adult nestin-gfp mice. a, Sample confocal images
Nature Neuroscience: doi: /nn Supplementary Figure 1. Distribution of starter cells for RV-mediated retrograde tracing.
 Supplementary Figure 1 Distribution of starter cells for RV-mediated retrograde tracing. Parcellation of cortical areas is based on Allen Mouse Brain Atlas and drawn to scale. Thick white curves, outlines
Cell Birth and Death. Chapter Three
 Cell Birth and Death Chapter Three Neurogenesis All neurons and glial cells begin in the neural tube Differentiated into neurons rather than ectoderm based on factors we have already discussed If these
Nature Neuroscience: doi: /nn Supplementary Figure 1. Diverse anorexigenic signals induce c-fos expression in CEl PKC-δ + neurons
 Supplementary Figure 1 Diverse anorexigenic signals induce c-fos expression in CEl PKC-δ + neurons a-c. Quantification of CEl c-fos expression in mice intraperitoneal injected with anorexigenic drugs (a),
SUPPLEMENTARY LEGENDS...
 TABLE OF CONTENTS SUPPLEMENTARY LEGENDS... 2 11 MOVIE S1... 2 FIGURE S1 LEGEND... 3 FIGURE S2 LEGEND... 4 FIGURE S3 LEGEND... 5 FIGURE S4 LEGEND... 6 FIGURE S5 LEGEND... 7 FIGURE S6 LEGEND... 8 FIGURE
Supplementary Figure 1 Information on transgenic mouse models and their recording and optogenetic equipment. (a) 108 (b-c) (d) (e) (f) (g)
 108 (b-c) (d) (e) (f) (g)") Supplementary Figure 1 Information on transgenic mouse models and their recording and optogenetic equipment. (a) In four mice, cre-dependent expression of the hyperpolarizing opsin Arch in pyramidal cells
Supplementary Figure 1 Information on transgenic mouse models and their recording and optogenetic equipment. (a) In four mice, cre-dependent expression of the hyperpolarizing opsin Arch in pyramidal cells
Nature Neuroscience: doi: /nn Supplementary Figure 1
 Supplementary Figure 1 Relative expression of K IR2.1 transcript to enos was reduced 29-fold in capillaries from knockout animals. Relative expression of K IR2.1 transcript to enos was reduced 29-fold
klp-18 (RNAi) Control. supplementary information. starting strain: AV335 [emb-27(g48); GFP::histone; GFP::tubulin] bleach
![klp-18 (RNAi) Control. supplementary information. starting strain: AV335 [emb-27(g48); GFP::histone; GFP::tubulin] bleach](/thumbs/91/104639484.jpg "klp-18 (RNAi) Control. supplementary information. starting strain: AV335 [emb-27(g48); GFP::histone; GFP::tubulin] bleach") DOI: 10.1038/ncb1891 A. starting strain: AV335 [emb-27(g48); GFP::histone; GFP::tubulin] bleach embryos let hatch overnight transfer to RNAi plates; incubate 5 days at 15 C RNAi food L1 worms adult worms
DOI: 10.1038/ncb1891 A. starting strain: AV335 [emb-27(g48); GFP::histone; GFP::tubulin] bleach embryos let hatch overnight transfer to RNAi plates; incubate 5 days at 15 C RNAi food L1 worms adult worms
Genesis of cerebellar interneurons and the prevention of neural DNA damage require XRCC1.
 Genesis of cerebellar interneurons and the prevention of neural DNA damage require XRCC1. Youngsoo Lee, Sachin Katyal, Yang Li, Sherif F. El-Khamisy, Helen R. Russell, Keith W. Caldecott and Peter J. McKinnon.
SUPPLEMENTARY INFORMATION
 DOI: 10.1038/ncb2988 Supplementary Figure 1 Kif7 L130P encodes a stable protein that does not localize to cilia tips. (a) Immunoblot with KIF7 antibody in cell lysates of wild-type, Kif7 L130P and Kif7
Nature Neuroscience: doi: /nn Supplementary Figure 1. Neuron class-specific arrangements of Khc::nod::lacZ label in dendrites.
 Supplementary Figure 1 Neuron class-specific arrangements of Khc::nod::lacZ label in dendrites. Staining with fluorescence antibodies to detect GFP (Green), β-galactosidase (magenta/white). (a, b) Class
Cajal-Retzius Cells Instruct Neuronal Migration by Coincidence Signaling between Secreted and Contact-Dependent Guidance Cues
 Article Cajal-Retzius Cells Instruct Neuronal Migration by Coincidence Signaling between Secreted and Contact-Dependent Guidance Cues Cristina Gil-Sanz, 1 Santos J. Franco, 1 Isabel Martinez-Garay, 1,2
Nature Neuroscience: doi: /nn Supplementary Figure 1
 Supplementary Figure 1 Bidirectional optogenetic modulation of the tonic activity of CEA PKCδ + neurons in vitro. a, Top, Cell-attached voltage recording illustrating the blue light-induced increase in
F-actin VWF Vinculin. F-actin. Vinculin VWF
 a F-actin VWF Vinculin b F-actin VWF Vinculin Supplementary Fig. 1. WPBs in HUVECs are located along stress fibers and at focal adhesions. (a) Immunofluorescence images of f-actin (cyan), VWF (yellow),
SUPPLEMENTARY FIGURES
 SUPPLEMENTARY FIGURES 1 Supplementary Figure 1, Adult hippocampal QNPs and TAPs uniformly express REST a-b) Confocal images of adult hippocampal mouse sections showing GFAP (green), Sox2 (red), and REST
Supplementary Figure 1. Spatial distribution of LRP5 and β-catenin in intact cardiomyocytes. (a) and (b) Immunofluorescence staining of endogenous
 and (b) Immunofluorescence staining of endogenous") Supplementary Figure 1. Spatial distribution of LRP5 and β-catenin in intact cardiomyocytes. (a) and (b) Immunofluorescence staining of endogenous LRP5 in intact adult mouse ventricular myocytes (AMVMs)
Supplementary Figure 1. Spatial distribution of LRP5 and β-catenin in intact cardiomyocytes. (a) and (b) Immunofluorescence staining of endogenous LRP5 in intact adult mouse ventricular myocytes (AMVMs)
Supplementary Information. Cofilin Regulates Nuclear Architecture through a Myosin-II Dependent Mechanotransduction Module
 Supplementary Information Cofilin Regulates Nuclear Architecture through a Myosin-II Dependent Mechanotransduction Module O Neil Wiggan, Bryce Schroder, Diego Krapf, James R. Bamurg and Jennifer G. DeLuca
mtorc1 loss impairs epidermal adhesion via TGF-β/Rho kinase activation
 The Journal of Clinical Investigation mtorc1 loss impairs epidermal adhesion via TGF-β/Rho kinase activation Kaushal Asrani, 1 Akshay Sood, 1 Alba Torres, 1 Dan Georgess, 2 Pornima Phatak, 3 Harsimar Kaur,
Supporting Information. Calculation of the relative contributions of myocyte proliferation, stem cell. Supporting Information Fig 1 (page 9)
") Supporting Information Table of contents Calculation of the relative contributions of myocyte proliferation, stem cell differentiation and cardioprotection (page 2) Supporting Information Fig 1 (page 9)
Supporting Information Table of contents Calculation of the relative contributions of myocyte proliferation, stem cell differentiation and cardioprotection (page 2) Supporting Information Fig 1 (page 9)
Supplementary Figure 1. Genotyping strategies for Mcm3 +/+, Mcm3 +/Lox and Mcm3 +/- mice and luciferase activity in Mcm3 +/Lox mice. A.
 Supplementary Figure 1. Genotyping strategies for Mcm3 +/+, Mcm3 +/Lox and Mcm3 +/- mice and luciferase activity in Mcm3 +/Lox mice. A. Upper part, three-primer PCR strategy at the Mcm3 locus yielding
Supplementary Information
 Supplementary Information Title Degeneration and impaired regeneration of gray matter oligodendrocytes in amyotrophic lateral sclerosis Authors Shin H. Kang, Ying Li, Masahiro Fukaya, Ileana Lorenzini,
(A) SW480, DLD1, RKO and HCT116 cells were treated with DMSO or XAV939 (5 µm)
 SW480, DLD1, RKO and HCT116 cells were treated with DMSO or XAV939 (5 µm)") Supplementary Figure Legends Figure S1. Tankyrase inhibition suppresses cell proliferation in an axin/β-catenin independent manner. (A) SW480, DLD1, RKO and HCT116 cells were treated with DMSO or XAV939
Supplementary Figure Legends Figure S1. Tankyrase inhibition suppresses cell proliferation in an axin/β-catenin independent manner. (A) SW480, DLD1, RKO and HCT116 cells were treated with DMSO or XAV939
Supplementary Figure 1. Characterization of NMuMG-ErbB2 and NIC breast cancer cells expressing shrnas targeting LPP. NMuMG-ErbB2 cells (a) and NIC
 and NIC") Supplementary Figure 1. Characterization of NMuMG-ErbB2 and NIC breast cancer cells expressing shrnas targeting LPP. NMuMG-ErbB2 cells (a) and NIC cells (b) were engineered to stably express either a LucA-shRNA
Supplementary Figure 1. Characterization of NMuMG-ErbB2 and NIC breast cancer cells expressing shrnas targeting LPP. NMuMG-ErbB2 cells (a) and NIC cells (b) were engineered to stably express either a LucA-shRNA
Developmental disruptions underlying brain abnormalities in ciliopathies
 Received 9 Dec Accepted 9 Jun Published Jul DOI:.8/ncomms887 Developmental disruptions underlying brain abnormalities in ciliopathies OPEN Jiami Guo,, Holden Higginbotham,, Jingjun Li, Jackie Nichols,
Genetics and Hydrocephalus
 Genetics and Hydrocephalus James P. (Pat) McAllister II, PhD 1,2,4 1 Pediatric Neurosurgery, Primary Children s Medical Center & University of Utah, Salt Lake City, UT 2 Bioengineering and 3 Physiology,
Prss56, a novel marker of adult neurogenesis in the mouse brain. - Supplemental Figures 1 to 5- Brain Structure and Function
 Prss56, a novel marker of adult neurogenesis in the mouse brain - Supplemental Figures 1 to 5- Brain Structure and Function Alexandre Jourdon 1,2, Aurélie Gresset 1, Nathalie Spassky 1, Patrick Charnay
Supplemental Figure 1. Intracranial transduction of a modified ptomo lentiviral vector in the mouse
 Supplemental figure legends Supplemental Figure 1. Intracranial transduction of a modified ptomo lentiviral vector in the mouse hippocampus targets GFAP-positive but not NeuN-positive cells. (A) Stereotaxic
SUPPLEMENTARY INFORMATION
 SUPPLEMENTARY INFORMATION Supplementary Figure 1. The expression of ephrin-b2 H2BGFP persists in the post-hearingonset organ of Corti and is specifically restricted to supporting cells. Sox2 immunolabeling
Supplementary Figure 1 Expression of Crb3 in mouse sciatic nerve: biochemical analysis (a) Schematic of Crb3 isoforms, ERLI and CLPI, indicating the
 Schematic of Crb3 isoforms, ERLI and CLPI, indicating the") Supplementary Figure 1 Expression of Crb3 in mouse sciatic nerve: biochemical analysis (a) Schematic of Crb3 isoforms, ERLI and CLPI, indicating the location of the transmembrane (TM), FRM binding (FB)
Supplementary Figure 1 Expression of Crb3 in mouse sciatic nerve: biochemical analysis (a) Schematic of Crb3 isoforms, ERLI and CLPI, indicating the location of the transmembrane (TM), FRM binding (FB)
Supplemental Figure 1. Western blot analysis indicated that MIF was detected in the fractions of
 Supplemental Figure Legends Supplemental Figure 1. Western blot analysis indicated that was detected in the fractions of plasma membrane and cytosol but not in nuclear fraction isolated from Pkd1 null
Neocortex Zbtb20 / NFIA / Sox9
 Neocortex / NFIA / Sox9 Supplementary Figure 1. Expression of, NFIA, and Sox9 in the mouse neocortex at. The lower panels are higher magnification views of the oxed area. Arrowheads indicate triple-positive
Nature Biotechnology: doi: /nbt Supplementary Figure 1. Analysis of hair bundle morphology in Ush1c c.216g>a mice at P18 by SEM.
 Supplementary Figure 1 Analysis of hair bundle morphology in Ush1c c.216g>a mice at P18 by SEM. (a-c) Heterozygous c.216ga mice displayed normal hair bundle morphology at P18. (d-i) Disorganized hair bundles
Mammalian Par3 Regulates Progenitor Cell Asymmetric Division via Notch Signaling in the Developing Neocortex
 Article Mammalian Par3 Regulates Progenitor Cell Asymmetric Division via Notch Signaling in the Developing Neocortex Ronald S. Bultje, 1,2,6 David R. Castaneda-Castellanos, 3,4,6 Lily Yeh Jan, 5 Yuh-Nung
Emx2 patterns the neocortex by regulating FGF positional signaling
 Emx2 patterns the neocortex by regulating FGF positional signaling Tomomi Fukuchi-Shimogori and Elizabeth A Grove Presented by Sally Kwok Background Cerebral cortex has anatomically and functionally distinct
Control of CNS Cell-Fate Decisions by SHP-2 and Its Dysregulation in Noonan Syndrome
 Article Control of CNS Cell-Fate Decisions by SHP-2 and Its Dysregulation in Noonan Syndrome Andrée S. Gauthier, 1,2,3 Olivia Furstoss, 1,2 Toshiyuki Araki, 5 Richard Chan, 5 Benjamin G. Neel, 5 David
Figure S1: Effects on haptotaxis are independent of effects on cell velocity A)
") Supplemental Figures Figure S1: Effects on haptotaxis are independent of effects on cell velocity A) Velocity of MV D7 fibroblasts expressing different GFP-tagged Ena/VASP family proteins in the haptotaxis
Supplemental Figures Figure S1: Effects on haptotaxis are independent of effects on cell velocity A) Velocity of MV D7 fibroblasts expressing different GFP-tagged Ena/VASP family proteins in the haptotaxis
SUPPLEMENTARY INFORMATION
 doi:10.1038/nature12652 Supplementary Figure 1. PRDM16 interacts with endogenous EHMT1 in brown adipocytes. Immunoprecipitation of PRDM16 complex by flag antibody (M2) followed by Western blot analysis
mir-7a regulation of Pax6 in neural stem cells controls the spatial origin of forebrain dopaminergic neurons
 Supplemental Material mir-7a regulation of Pax6 in neural stem cells controls the spatial origin of forebrain dopaminergic neurons Antoine de Chevigny, Nathalie Coré, Philipp Follert, Marion Gaudin, Pascal
Supplementary Figure S1: TIPF reporter validation in the wing disc.
 Supplementary Figure S1: TIPF reporter validation in the wing disc. a,b, Test of put RNAi. a, In wildtype discs the Dpp target gene Sal (red) is expressed in a broad stripe in the centre of the ventral
Loss of RhoA promotes skin tumor formation. Supplementary Figure 1. Loss of RhoA does not impair F-actin organization.
 Supplementary Figure Legends Supplementary Figure 1. Loss of RhoA does not impair F-actin organization. a. Representative IF images of F-actin staining of big and small control (left) and RhoA ko tumors
Supplementary Figure 1. mir124 does not change neuron morphology and synaptic
 Supplementary Figure 1. mir124 does not change neuron morphology and synaptic density. Hippocampal neurons were transfected with mir124 (containing DsRed) or DsRed as a control. 2 d after transfection,
Supplemental Information. Induction of Expansion and Folding. in Human Cerebral Organoids
 Cell Stem Cell, Volume 20 Supplemental Information Induction of Expansion and Folding in Human Cerebral Organoids Yun Li, Julien Muffat, Attya Omer, Irene Bosch, Madeline A. Lancaster, Mriganka Sur, Lee
Supplementary Materials for
 www.sciencesignaling.org/cgi/content/full/8/375/ra41/dc1 Supplementary Materials for Actin cytoskeletal remodeling with protrusion formation is essential for heart regeneration in Hippo-deficient mice
Nature Neuroscience: doi: /nn Supplementary Figure 1
 Supplementary Figure 1 Drd1a-Cre driven ChR2 expression in the SCN. (a) Low-magnification image of a representative Drd1a-ChR2 coronal brain section (n = 2) showing endogenous tdtomato fluorescence (magenta).
The subcortical maternal complex controls symmetric division of mouse zygotes by
 The subcortical maternal complex controls symmetric division of mouse zygotes by regulating F-actin dynamics Xing-Jiang Yu 1,2, Zhaohong Yi 1, Zheng Gao 1,2, Dan-dan Qin 1,2, Yanhua Zhai 1, Xue Chen 1,
Supplementary Figure 1
 Supplementary Figure 1 14 12 SEM4C PLXN2 8 SEM4C C 3 Cancer Cell Non Cancer Cell Expression 1 8 6 6 4 log2 ratio Expression 2 1 4 2 2 p value.1 D Supplementary Figure 1. Expression of Sema4C and Plexin2
SOS1 and Ras regulate epithelial tight junction formation in the human airway through EMP1
 Manuscript EMBOR-2014-39218 SOS1 and Ras regulate epithelial tight junction formation in the human airway through EMP1 Joanne Durgan, Guangbo Tao, Matthew S. Walters, Oliver Florey, Anja Schmidt, Vanessa
Supplemental Information. Tissue Myeloid Progenitors Differentiate. into Pericytes through TGF-b Signaling. in Developing Skin Vasculature
 Cell Reports, Volume 18 Supplemental Information Tissue Myeloid Progenitors Differentiate into Pericytes through TGF-b Signaling in Developing Skin Vasculature Tomoko Yamazaki, Ani Nalbandian, Yutaka Uchida,
Supplementary Figure 1 Validation of Per2 deletion in neuronal cells in N Per2 -/- mice. (a) Western blot from liver extracts of mice held under ad
 Western blot from liver extracts of mice held under ad") Supplementary Figure 1 Validation of Per2 deletion in neuronal cells in N Per2 -/- mice. (a) Western blot from liver extracts of mice held under ad libitum conditions detecting PER2 protein in brain and
Supplementary Figure 1 Validation of Per2 deletion in neuronal cells in N Per2 -/- mice. (a) Western blot from liver extracts of mice held under ad libitum conditions detecting PER2 protein in brain and
Supplemental Information. Myocardial Polyploidization Creates a Barrier. to Heart Regeneration in Zebrafish
 Developmental Cell, Volume 44 Supplemental Information Myocardial Polyploidization Creates a Barrier to Heart Regeneration in Zebrafish Juan Manuel González-Rosa, Michka Sharpe, Dorothy Field, Mark H.
Supplementary Information
 Supplementary Information Astrocytes regulate adult hippocampal neurogenesis through ephrin-b signaling Randolph S. Ashton, Anthony Conway, Chinmay Pangarkar, Jamie Bergen, Kwang-Il Lim, Priya Shah, Mina
Supplemental Information. Ciliary Beating Compartmentalizes. Cerebrospinal Fluid Flow in the Brain. and Regulates Ventricular Development
 Current Biology, Volume Supplemental Information Ciliary Beating Compartmentalizes Cerebrospinal Fluid Flow in the Brain and Regulates Ventricular Development Emilie W. Olstad, Christa Ringers, Jan N.
Supplementary Figure 1: Neuregulin 1 increases the growth of mammary organoids compared to EGF. (a) Mammary epithelial cells were freshly isolated,
 Mammary epithelial cells were freshly isolated,") 1 2 3 4 5 6 7 8 9 10 Supplementary Figure 1: Neuregulin 1 increases the growth of mammary organoids compared to EGF. (a) Mammary epithelial cells were freshly isolated, embedded in matrigel and exposed
1 2 3 4 5 6 7 8 9 10 Supplementary Figure 1: Neuregulin 1 increases the growth of mammary organoids compared to EGF. (a) Mammary epithelial cells were freshly isolated, embedded in matrigel and exposed
Supplementary Figure 1: Hsp60 / IEC mice are embryonically lethal (A) Light microscopic pictures show mouse embryos at developmental stage E12.
 Light microscopic pictures show mouse embryos at developmental stage E12.") Supplementary Figure 1: Hsp60 / IEC mice are embryonically lethal (A) Light microscopic pictures show mouse embryos at developmental stage E12.5 and E13.5 prepared from uteri of dams and subsequently genotyped.
Supplementary Figure 1: Hsp60 / IEC mice are embryonically lethal (A) Light microscopic pictures show mouse embryos at developmental stage E12.5 and E13.5 prepared from uteri of dams and subsequently genotyped.
Zhu et al, page 1. Supplementary Figures
 Zhu et al, page 1 Supplementary Figures Supplementary Figure 1: Visual behavior and avoidance behavioral response in EPM trials. (a) Measures of visual behavior that performed the light avoidance behavior
Supplementary information. The Light Intermediate Chain 2 Subpopulation of Dynein Regulates Mitotic. Spindle Orientation
 Supplementary information The Light Intermediate Chain 2 Subpopulation of Dynein Regulates Mitotic Spindle Orientation Running title: Dynein LICs distribute mitotic functions. Sagar Mahale a, d, *, Megha
SUPPLEMENTARY INFORMATION
 DOI: 10.1038/ncb3021 Supplementary figure 1 Characterisation of TIMPless fibroblasts. a) Relative gene expression of TIMPs1-4 by real time quantitative PCR (RT-qPCR) in WT or ΔTimp fibroblasts (mean ±
Mary ET Boyle, Ph. D. Department of Cognitive Science UCSD
 ? Mary ET Boyle, Ph. D. Department of Cognitive Science UCSD Christian S Lobsiger & Don W Cleveland (2007) Nature Neuroscience 10, 1355-1360 Astrocytes: interlinked gatekeepers of glutamate astrocytes
File name: Supplementary Information Description: Supplementary Figures, Supplementary Table and Supplementary References
 File name: Supplementary Information Description: Supplementary Figures, Supplementary Table and Supplementary References File name: Supplementary Data 1 Description: Summary datasheets showing the spatial
During Brain Development Final Destinations for Neurons and Glia Get Separated from Germinal Niches
 During Brain Development Final Destinations for Neurons and Glia Get Separated from Germinal Niches Progenitors are Contained within Unique Domains and Tangentially Fixed. EMBRYO ADULT Migratory Behavior
Nature Neuroscience: doi: /nn Supplementary Figure 1. PICALM expression in brain capillary endothelium in human brain and in mouse brain.
 Supplementary Figure 1 PICALM expression in brain capillary endothelium in human brain and in mouse brain. a, Double immunostaining for PICALM (red, left) and lectin positive endothelial profiles (blue,
Nature Neuroscience: doi: /nn Supplementary Figure 1
 Supplementary Figure 1 Quantification of myelin fragments in the aging brain (a) Electron microscopy on corpus callosum is shown for a 18-month-old wild type mice. Myelin fragments (arrows) were detected
Supplementary Figure S1: Tanycytes are restricted to the central/posterior hypothalamus
 Supplementary Figure S1: Tanycytes are restricted to the central/posterior hypothalamus a: Expression of Vimentin, GFAP, Sox2 and Nestin in anterior, central and posterior hypothalamus. In the anterior
Supplementary Figure 1. Flies form water-reward memory only in the thirsty state
 1 2 3 4 5 6 7 Supplementary Figure 1. Flies form water-reward memory only in the thirsty state Thirsty but not sated wild-type flies form robust 3 min memory. For the thirsty group, the flies were water-deprived
(a) Schematic diagram of the FS mutation of UVRAG in exon 8 containing the highly instable
 Schematic diagram of the FS mutation of UVRAG in exon 8 containing the highly instable") Supplementary Figure 1. Frameshift (FS) mutation in UVRAG. (a) Schematic diagram of the FS mutation of UVRAG in exon 8 containing the highly instable A 10 DNA repeat, generating a premature stop codon
Supplementary Figure 1. Frameshift (FS) mutation in UVRAG. (a) Schematic diagram of the FS mutation of UVRAG in exon 8 containing the highly instable A 10 DNA repeat, generating a premature stop codon
Light triggers PILS-dependent reduction in nuclear auxin signalling for growth transition
 In the format provided y the authors and unedited. SUPPLEMENTARY INFORMATION VOLUME: 3 ARTICLE NUMBER: 217.15 Light triggers PILS-dependent reduction in nuclear auxin signalling for growth transition Chloé
Type of file: PDF Size of file: 0 KB Title of file for HTML: Supplementary Information Description: Supplementary Figures
 Type of file: PDF Size of file: 0 KB Title of file for HTML: Supplementary Information Description: Supplementary Figures Supplementary Figure 1 mir-128-3p is highly expressed in chemoresistant, metastatic
Metformin Activates an Atypical PKC-CBP Pathway to Promote Neurogenesis and Enhance Spatial Memory Formation
 rticle formin ctivates an typical PKC-CBP Pathway to Promote Neurogenesis and Enhance Spatial Memory Formation Jing Wang, 1,2 Denis Gallagher, 1,2,4,9 Loren M. DeVito, 3,9 Gonzalo I. Cancino, 1,2 David
PKCζ Promotes Breast Cancer Invasion by Regulating Expression of E-cadherin and Zonula Occludens-1 (ZO-1) via NFκB-p65
 via NFκB-p65") SUPPLEMENTARY INFORMATION TITLE: PKCζ Promotes Breast Cancer Invasion by Regulating Expression of E-cadherin and Zonula Occludens-1 (ZO-1) via NFκB-p65 RUNNING TITLE: PKCζ-NFκB Signaling in Breast Cancer
SUPPLEMENTARY INFORMATION TITLE: PKCζ Promotes Breast Cancer Invasion by Regulating Expression of E-cadherin and Zonula Occludens-1 (ZO-1) via NFκB-p65 RUNNING TITLE: PKCζ-NFκB Signaling in Breast Cancer
Nature Neuroscience doi: /nn Supplementary Figure 1. Characterization of viral injections.
 Supplementary Figure 1 Characterization of viral injections. (a) Dorsal view of a mouse brain (dashed white outline) after receiving a large, unilateral thalamic injection (~100 nl); demonstrating that
Supplementary Figure 1. Rab27a-KD inhibits speed and persistence of HEp3 cells migrating in the chick CAM. (a) Western blot analysis of Rab27a
 Western blot analysis of Rab27a") Supplementary Figure 1. Rab27a-KD inhibits speed and persistence of HEp3 cells migrating in the chick CAM. (a) Western blot analysis of Rab27a expression in GFP-expressing HEp3 cells. (b) Representative
Supplementary Figure 1. Rab27a-KD inhibits speed and persistence of HEp3 cells migrating in the chick CAM. (a) Western blot analysis of Rab27a expression in GFP-expressing HEp3 cells. (b) Representative
Supplementary Figure S1. Monolayer differentiation of mouse ESCs into telencephalic neural precursors. (a) Schematic representation of the protocols
 Schematic representation of the protocols") Supplementary Figure S1. Monolayer differentiation of mouse ESCs into telencephalic neural precursors. (a) Schematic representation of the protocols used to differentiate mouse ESCs. (b) Representative
Supplementary Figure S1. Monolayer differentiation of mouse ESCs into telencephalic neural precursors. (a) Schematic representation of the protocols used to differentiate mouse ESCs. (b) Representative
SUPPLEMENTARY INFORMATION
 doi: 10.1038/nature06994 A phosphatase cascade by which rewarding stimuli control nucleosomal response A. Stipanovich*, E. Valjent*, M. Matamales*, A. Nishi, J.H. Ahn, M. Maroteaux, J. Bertran-Gonzalez,
SUPPLEMENTARY INFORMATION
 Supplementary Figure 1. Normal AMPAR-mediated fepsp input-output curve in CA3-Psen cdko mice. Input-output curves, which are plotted initial slopes of the evoked fepsp as function of the amplitude of the
SUPPLEMENTARY INFORMATION
 DOI: 10.1038/ncb2566 Figure S1 CDKL5 protein expression pattern and localization in mouse brain. (a) Multiple-tissue western blot from a postnatal day (P) 21 mouse probed with an antibody against CDKL5.
Type of file: PDF Title of file for HTML: Supplementary Information Description: Supplementary Figures
 Type of file: PDF Title of file for HTML: Supplementary Information Description: Supplementary Figures Type of file: MOV Title of file for HTML: Supplementary Movie 1 Description: NLRP3 is moving along
Nature Immunology doi: /ni.3268
 Supplementary Figure 1 Loss of Mst1 and Mst2 increases susceptibility to bacterial sepsis. (a) H&E staining of colon and kidney sections from wild type and Mst1 -/- Mst2 fl/fl Vav-Cre mice. Scale bar,
Neurodevelopment II Structure Formation. Reading: BCP Chapter 23
 Neurodevelopment II Structure Formation Reading: BCP Chapter 23 Phases of Development Ovum + Sperm = Zygote Cell division (multiplication) Neurogenesis Induction of the neural plate Neural proliferation
Supplementary Figure 1. Efficiency of Mll4 deletion and its effect on T cell populations in the periphery. Nature Immunology: doi: /ni.
 Supplementary Figure 1 Efficiency of Mll4 deletion and its effect on T cell populations in the periphery. Expression of Mll4 floxed alleles (16-19) in naive CD4 + T cells isolated from lymph nodes and
Nature Structural and Molecular Biology: doi: /nsmb Supplementary Figure 1
 Supplementary Figure 1 Mutational analysis of the SA2-Scc1 interaction in vitro and in human cells. (a) Autoradiograph (top) and Coomassie stained gel (bottom) of 35 S-labeled Myc-SA2 proteins (input)
Primary Mouse Cerebral Cortex Neurons V: 80% TE: 70%
 Primary Mouse Cerebral Cortex Neurons V: 80% TE: 70% Pictures: 9 days after electroporation Red: MAP2 Blue: GFAP Green: GFP The cells were from Embryonic Day 14 Mouse Cerebral Cortex Primary Mouse Hippocampal
Supplementary figures
 Supplementary figures Supplementary Figure 1. B cells stimulated with pokeweed mitogen display normal mitotic figures but not cells infected with B95-8. The figures show cells stimulated with pokeweed
Supplementary Information
 Supplementary Information Figure S1: Follicular melanocytes in the wound peripheral area migrate to the epidermis in response to wounding stimuli. Dorsal skin of Trp2-LacZ mice stained with X-gal and analyzed
SUPPLEMENTARY INFORMATION
 DOI: 0.038/ncb33 a b c 0 min 6 min 7 min (fixed) DIC -GFP, CenpF 3 µm Nocodazole Single optical plane -GFP, CenpF Max. intensity projection d µm -GFP, CenpF, -GFP CenpF 3-D rendering e f 0 min 4 min 0