Title of file for HTML: Supplementary Information Description: Supplementary Figures and Supplementary Table
|
|
|
- Camron Campbell
- 5 years ago
- Views:
Transcription
1 Title of file for HTML: Supplementary Information Description: Supplementary Figures and Supplementary Table Title of file for HTML: Peer Review File Description:
 Eight weeks after challenge infection, mice were sacrificed and perfused to collect adult worms.")
2 Innate Scavenger Receptor-A regulates adaptive T helper cell responses to pathogen infection Supplementary Figure 1, Related to Figure 1: SR-A deficiency attenuates immunopathology after S. japonicum infection (a) Eight weeks after challenge infection, mice were sacrificed and perfused to collect adult worms. (b) The numbers of eggs extracted from the livers were determined by microscopic examination. Data are expressed as the mean ± SD of 12 mice for each group, and the experiments were repeated twice with similar results. ns, not significant (Student s t-test), compared to infected WT mice. (c) Mice were randomly chosen and sacrificed at 0 (before infection), 3 (before produce eggs), 5, 8 or 13 weeks post-infection (n=12 each time point per group). Paraffin-embedded liver sections were stained with H&E. Scale bars, 100μm. (d) Levels of serum endotoxin in WT and SR-A-deficient mice 8 weeks post infection were determined. Values are given as mean ± SD for each group, and are representative of one typical experiment out of three. **p < 0.01, ***p < (ANOVA/LSD). 1
3 Supplementary Figure 2, Related to Figure 2: SR-A deficiency promotes Th1 responses in S. japonicum-infected mouse model At different time points (0, 3, 5, 8, 13 weeks) after infection, single cell suspensions of mouse livers, mesenteric LN, and spleens from WT or SR-A-deficient mice infected with or without S. japonicum were prepared. Cells were stained with CD3-APC and CD4-FITC, and then intracellularly stained with PE-conjugated antibodies against IFN-γ or IL-4 for FACS analysis of CD3 + CD4 + IFN-γ + (a) or CD3 + CD4 + IL-4 + (b) cells, respectively. Data shown were gated on CD3 + CD4 + cells. Data are expressed as the mean ± SD of 12 mice for each group, all experiments were repeated three times with similar results. Splenocytes from WT or SR-A-deficient mice stimulated with or without SEA, and the proportion of CD3 + CD4 + IFN-γ + (c) or CD3 + CD4 + IL-4 + (d) cells in CD4 + T cells was analyzed by FACS. Livers, mesenteric LN, and spleens from WT and SR-A-deficient mice infected with or without S. japonicum were harvested. Cells were analysis of Th17 (e), Treg (f), or Tfh (g) cells, respectively. Data are expressed as the mean ± SD of 12 mice for each group, all experiments were repeated three times with similar results, ***p < 0.001, **p < 0.01, * p < 0.05 (ANOVA/LSD). WT and SR-A-deficient mice were injected with heat-inactivated M. tuberculosis (i.p. 4mg/kg) (h). After 24h, Th1 and Th2 cells in splenocytes were analyzed, respectively. Data are expressed as the mean ± SD of 10 mice for each group, and the experiments were repeated twice with similar results. **p < 0.01, * p < 0.05 (ANOVA/LSD). 2
4 Supplementary Figure 3, Related to Figure 3: SR-A deficiency enhances M1 polarization in heat-inactivated M. tuberculosis-immunized mouse models (a) Peritoneal macrophages were isolated from WT and SR-A-deficient mice immunized with heat-inactivated M. tuberculosis and analyzed of CD16/32 and CD206 expression, respectively. (b) Peritoneal macrophages from control WT or SR-A-deficient mice were stimulated with SEA and analyzed the levels of MHC II, CD80, and CD86 on macrophages by FACS. Data are expressed as the mean ± SD of 12 mice for each group. All experiments were repeated twice with similar results. ** p <0.001, *p<0.05 (ANOVA/LSD). 3

5 Supplementary Figure 4, Related to Figure 4: SR-A suppressed Th1 but induced Th2 differentiation through regulation of macrophage but not DC responses (a) FACS analysis of proportion of CD16/32 + or CD206 + on peritoneal macrophages from WT or SR-A deficient mice infected with or without S. japonicum. (b) Two weeks after adoptive transfer of infected WT or SR-A-deficient mice derived peritoneal macrophages to normal WT mice, representative of Th1 or Th2 cells in recipient mouse splenocytes were shown. (c) Representative Th1 or Th2 cells after co-culture of infected mice derived SR-A WT or KO macrophages with normal mice derived CD4 + T cells for 48h were shown. (d) CD4 + T cells from control WT mice were co-cultured with purified peritoneal macrophages from control WT or control SR-A-deficient mice in the presence of SEA, and representative Th1 or Th2 cells were shown. Data are representative of three independent 4
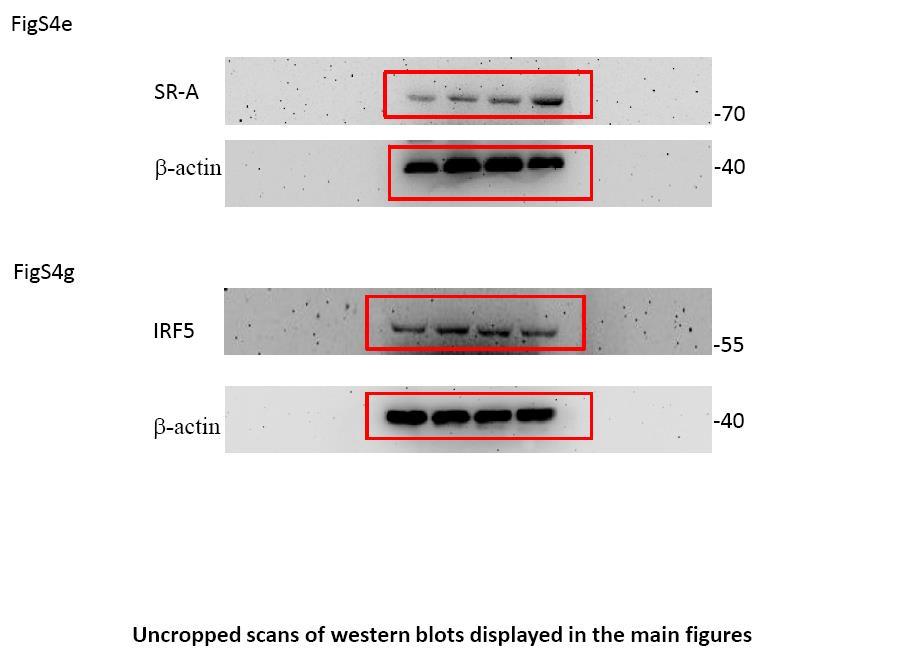
6 experiments. DCs of mouse spleens from WT and SR-A-deficient mice infected with or without S. japonicum were purified for immunoblot analysis of SR-A (e) or IRF5 (g) protein. (f) CD4 + T cells from control WT mice were purified and co-cultured with purified CD11c + DCs from infected WT or SR-A-deficient mice for analysis of Th1/Th2 cells. Data are representative of three independent experiments. * p<0.05 (ANOVA/LSD). (h-i) 4 weeks after adoptive transfer of normal WT or SR-A-deficient mice derived peritoneal macrophages to infected WT or infected SR-A-deficient mice, respectively. (h)the numbers of eggs extracted from the livers were determined by microscopic examination. (i) Representative Th1 or Th2 cells in the liver or spleen of recipient mouse were shown. Data are expressed as the mean ± SD of 6 mice for each group, and the experiments were repeated twice with similar results. * p<0.05, ** p<0.01, *** p<0.001 (ANOVA/LSD). 5

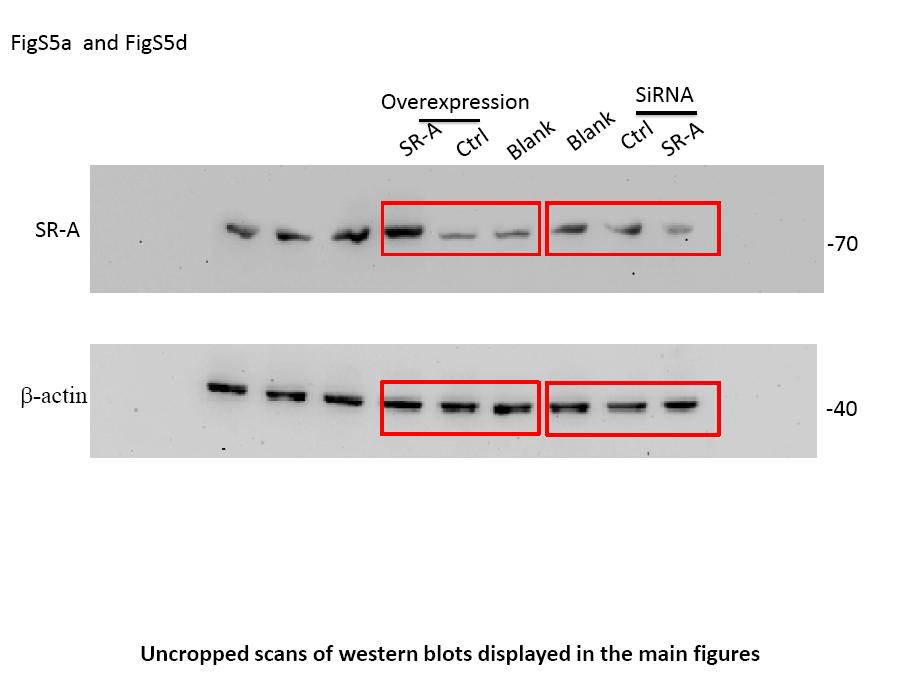
7 Supplementary Figure 5, Related to Figure 4: SR-A suppressed Th1 but induced Th2 differentiation through regulation of macrophage but not DC responses (a) sirna targeting SR-A (si-sr-a)-mediated interference efficiently downregulated SR-A expression in BMDMs. Data are expressed as the mean ± SD from three independent experiments, ***p < (b) BMDMs from control WT mice were transfected with si-sr-a or nontargeting sirna (ctrl-sirna) and stimulated with or without SEA, the representative plots of CD16/32 + or CD206 + cells in BMDMs were analyzed by FACS. And then BMDMs were co-cultured with purified CD4 + T cells from control WT mice for Th1/Th2 analysis (c). (d) pcdna3.1-msr-mediated overexpression upregulates SR-A expression in BMDMs. (e) BMDMs from control WT mice were transfected with pcdna3.1-msr (SR-A) or empty vector (pcdna3.1) and stimulated with or without SEA, the representative of CD16/32 + or CD206 + cells in BMDMs were analyzed by FACs. And then BMDMs were co-cultured with CD4 + T cells from control WT mice for Th1/Th2 analysis (f), data are representative of three independent experiments. **p<0.01 (ANOVA/LSD). (g) The protein levels of IL-12p70 or IL-4 in the serum or liver tissue homogenate from WT or SR-A-deficient mice infected with or without S. japonicum. Data are expressed as the mean ± SD of 12 mice for each group, all experiments were repeated three times with similar results, UD, undetectable, ***p < (ANOVA/LSD). (h) ELISA analysis of IL-12p70 or IL-4 produced by peritoneal macrophages from WT or SR-A-deficient mice in the presence or absence of SEA stimulation for 12, 24, 36, and 48h. Data are representative of three independent experiments. * p<0.05 (ANOVA/LSD). 6
 or nuclear (b) protein by immunoblot. Peritoneal macrophages from S.")
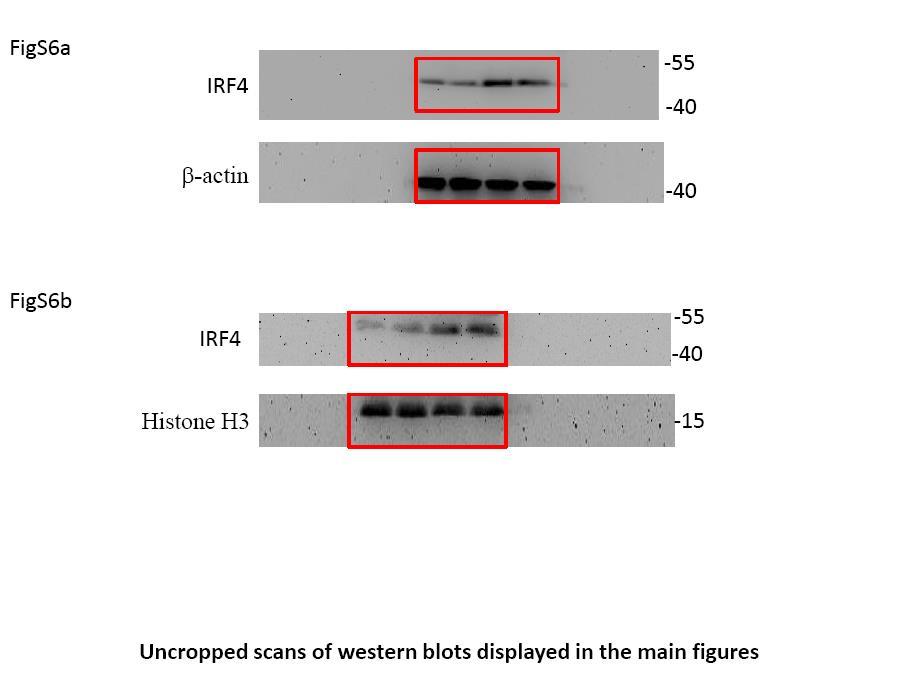
8 Supplementary Figure 6, Related to Figure 5: SR-A regulates macrophage polarization by regulation of IRF5 but not IRF4 Peritoneal macrophages from S. japonicum-infected WT or SR-A-deficient mice were prepared for analysis of IRF4 total (a) or nuclear (b) protein by immunoblot. Peritoneal macrophages from S. japonicum-infected WT or SR-A-deficient mice were transfected with sh-irf5 or ctrl-shrna in the presence of SEA. (c) Representative plots of CD16/32-expressed macrophages or CD206-expressed macrophages. (d) After transfection, peritoneal macrophages were co-culture with CD4 + T cells from control WT mice stimulated with SEA, and representative of Th1 and Th2 cells were shown. 7

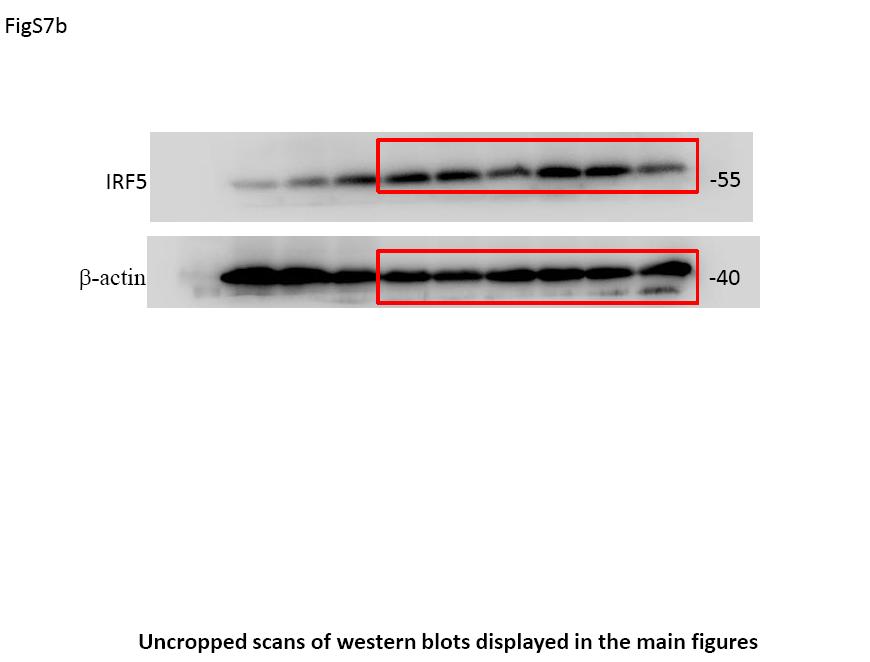
9 Supplementary Figure 7, Related to Figure 6: Knockdown of IRF5 reduces M1 and Th1 polarization and restores liver pathology in SR-A-deficient mice (a) Mice were intravenously injected with shrna lentiviral particles targeting IRF5 since 3.5 weeks post S. japonicum infection by weekly for 4 weeks and sacrificed at 7.5 weeks post S. japonicum infection for further study. (b) The efficiency of IRF5 knockdown in liver of S. japonicum-infected WT or SR-A KO mice after Lv-shRNA injection on 7.5 wk post-infection. Statistical analysis of CD16/32 + or CD206 + cells in hepatic (c) or peritoneal (d) macrophages from S. japonicum-infected WT or SR-A-deficient mice. Statistical analysis of Th1 or Th2 cells in CD4 + T cells in mouse livers (e), mesenteric LN (f), and spleens (g) from S. japonicum-infected WT and SR-A-deficient mice. Data are representative of two experiments with 6 mice per group in each experiment. ***p < 0.001, **p < 0.01, *p < 0.05 (ANOVA/LSD). 8

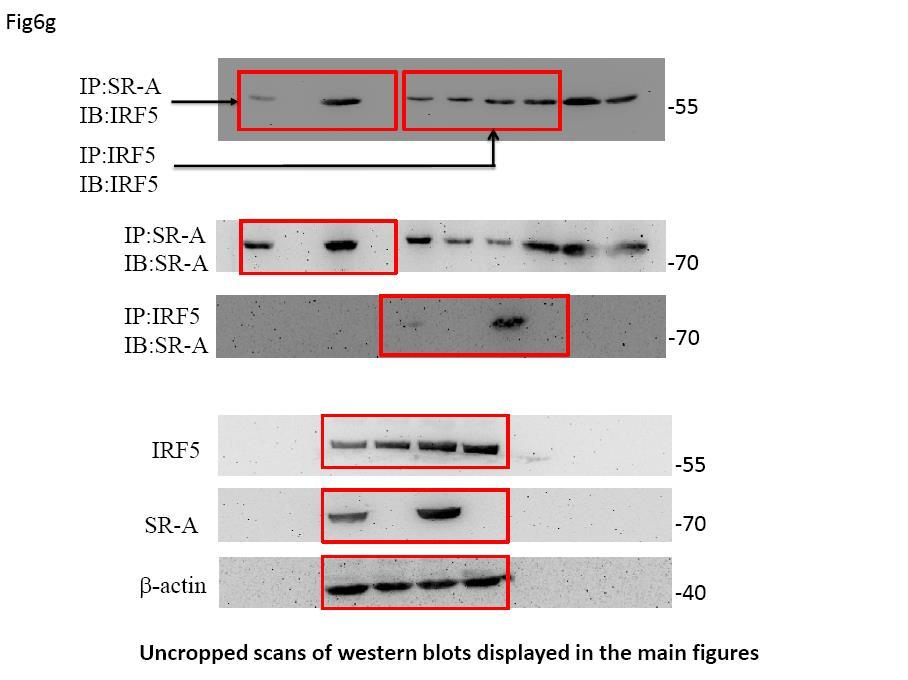
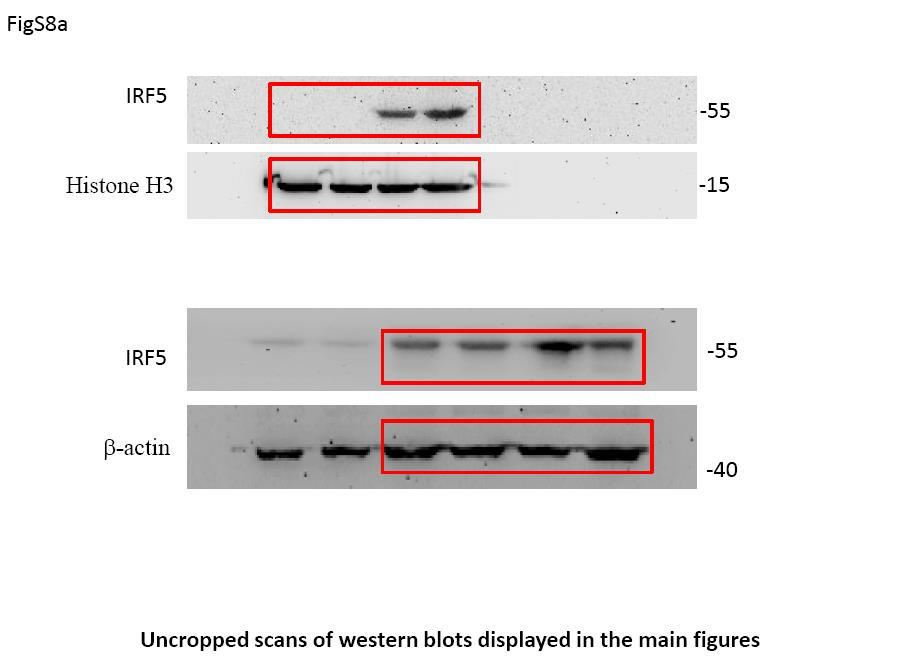
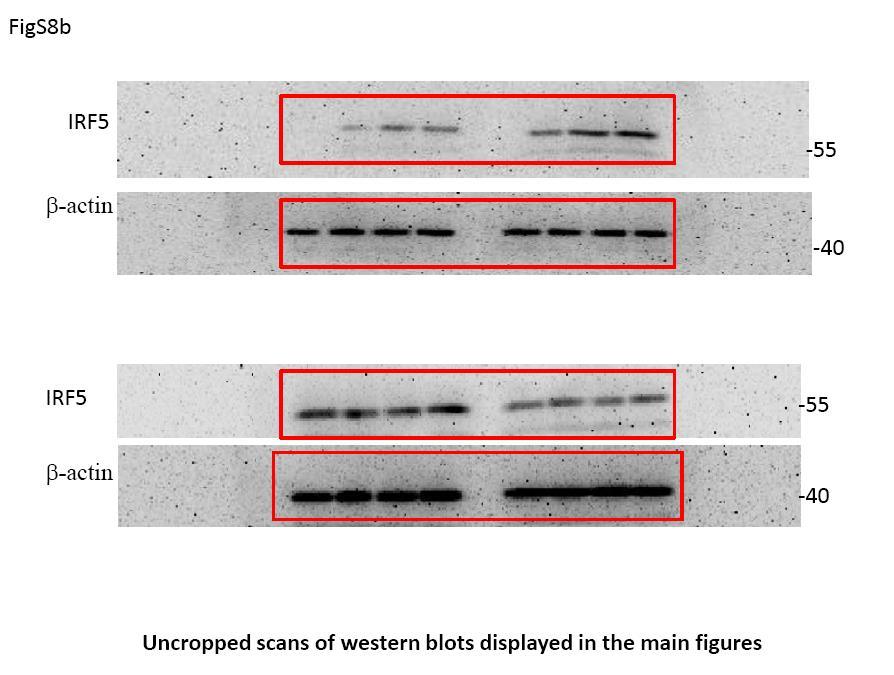
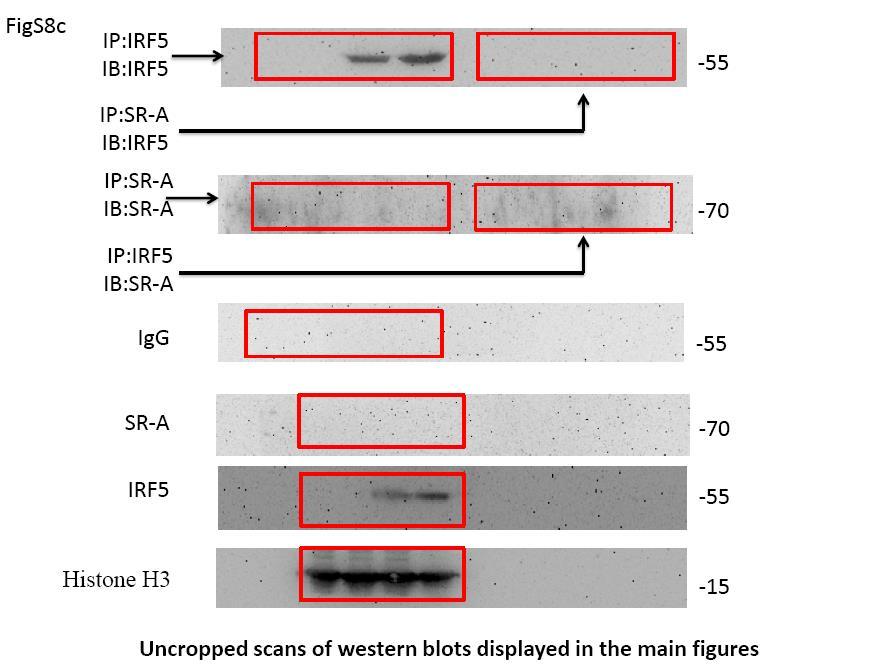
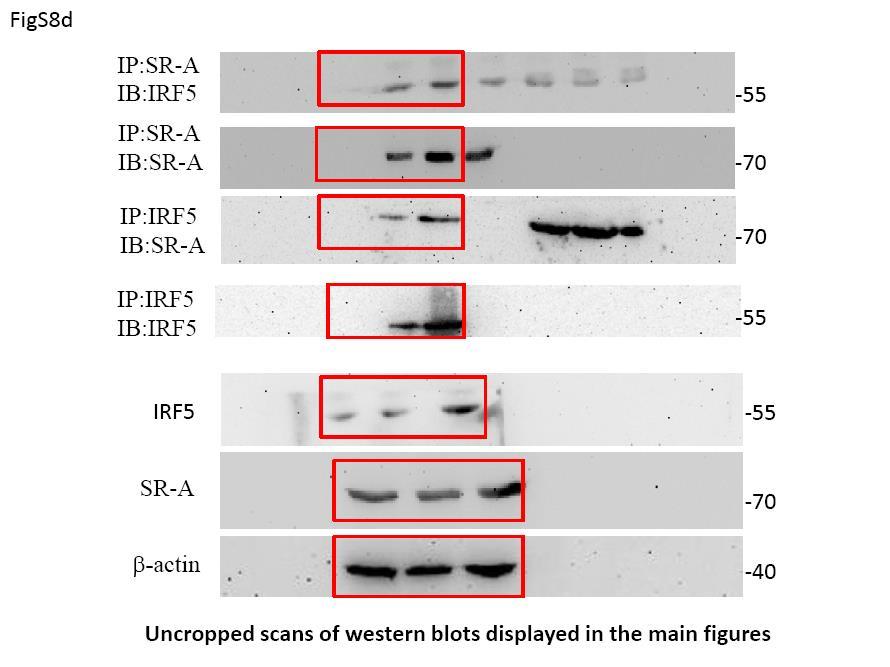
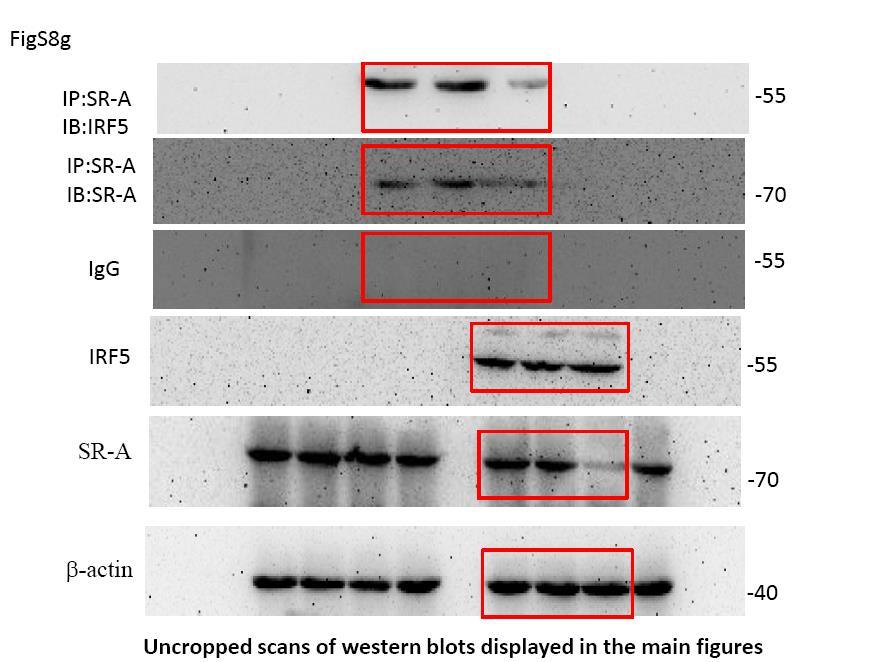
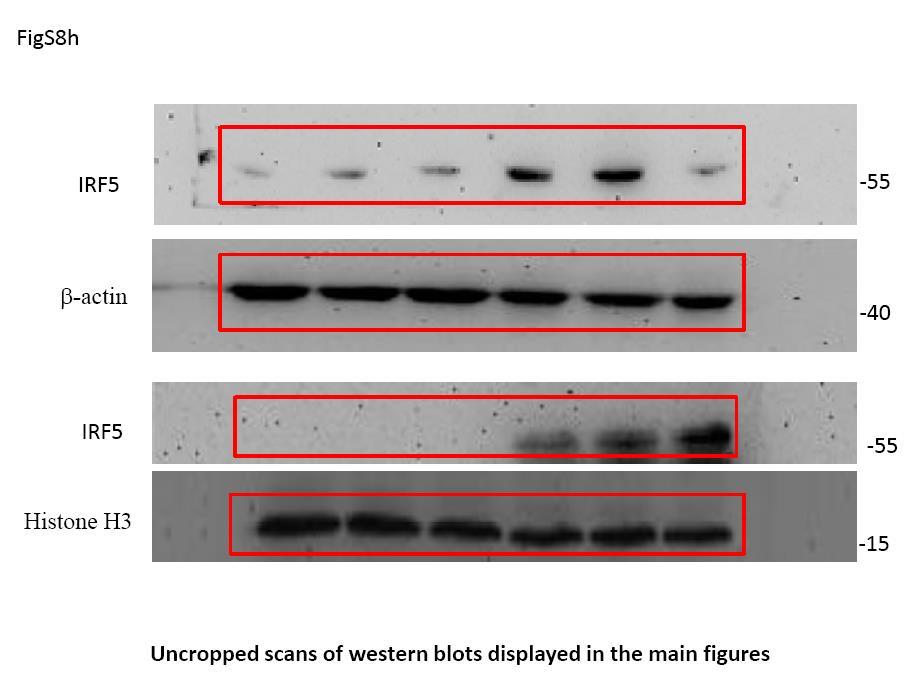
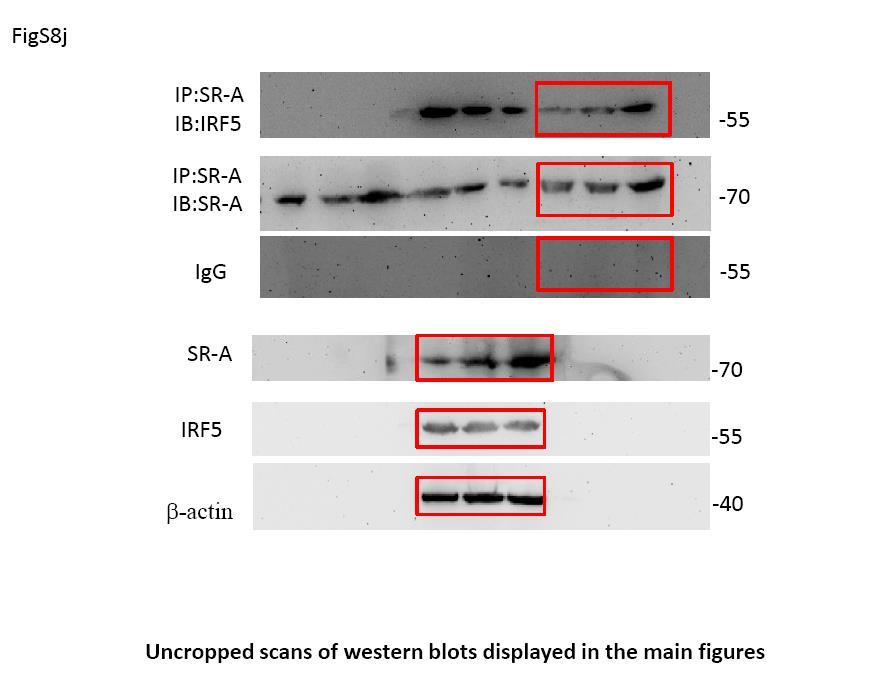
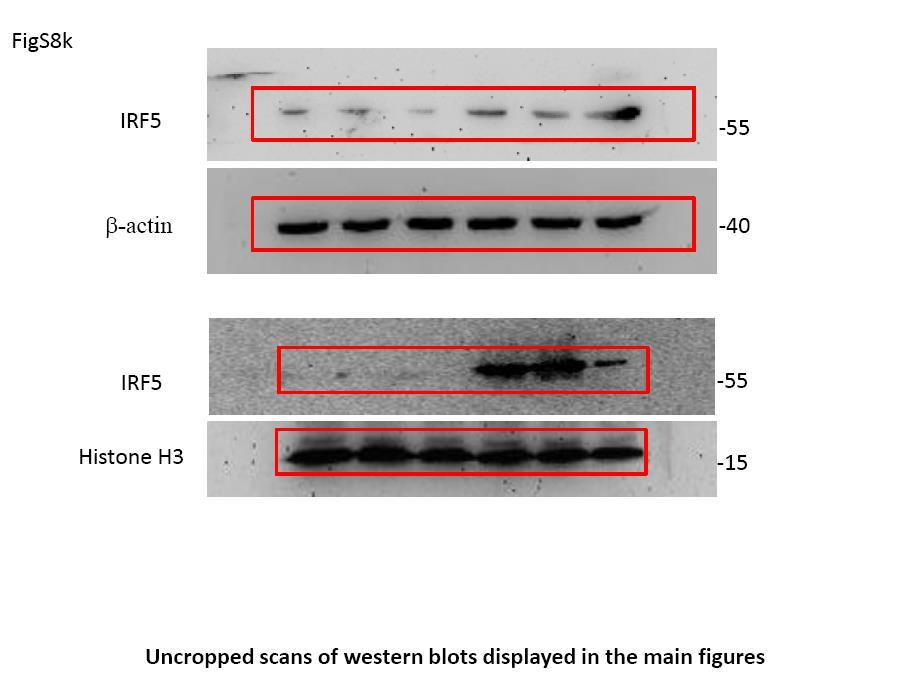
10 Supplementary Figure 8, Related to Figure 6: SR-A interacts with IRF5 in cytoplasm and inhibits IRF5 nuclear transfer (a) Immunoblot analysis of IRF5 protein in nuclear and cytoplasmic fractions of peritoneal macrophages from WT or SR-A-deficient mice infected with or without S. japonicum. (b) Immunoblot analysis of IRF5 protein in nuclear and cytoplasmic fractions of peritoneal macrophages for 3, 6, 12h from normal WT or SR-A-deficient mice in the presence of SEA. Immunoblot analysis of IRF5 of endogenous SR-A immunoprecipitated from nuclear (c) protein extracted from peritoneal macrophages of WT or SR-A-deficient mice infected with or without S. japonicum. The association of SR-A and IRF5 was confirmed by a reciprocal immunoprecipitation 9
11 assay using anti-irf5. Immunoblot was also carried out using whole nuclear lysate (WNL). Immunoblot analysis of IRF5 of endogenous SR-A immunoprecipitated from cytoplasmic (d) and nuclear (e) protein extracted from RAW264.7 cells stimulation with SEA. Co-localization of endogenous SR-A and IRF5 with Golgi in peritoneal macrophages from control WT mice by confocal microscopy, scale bars, 10μm (f). After transfection with si-sr-a (g-i) or pcdna3.1-msr (j-l), immunoblot analysis of IRF5 protein in cytoplasmic and nuclear of RAW264.7 cell fractions with or without SEA. Data are representative of three independent experiments. ***p < 0.001, **p < 0.01, *p < 0.05 (ANOVA/LSD). 10

12 Supplementary Figure 9, Related to Figure 6: prediction of the interaction between SR-A and IRF5 STRING database ( was used to predict the possible interaction of SR-A and IRF5. 11

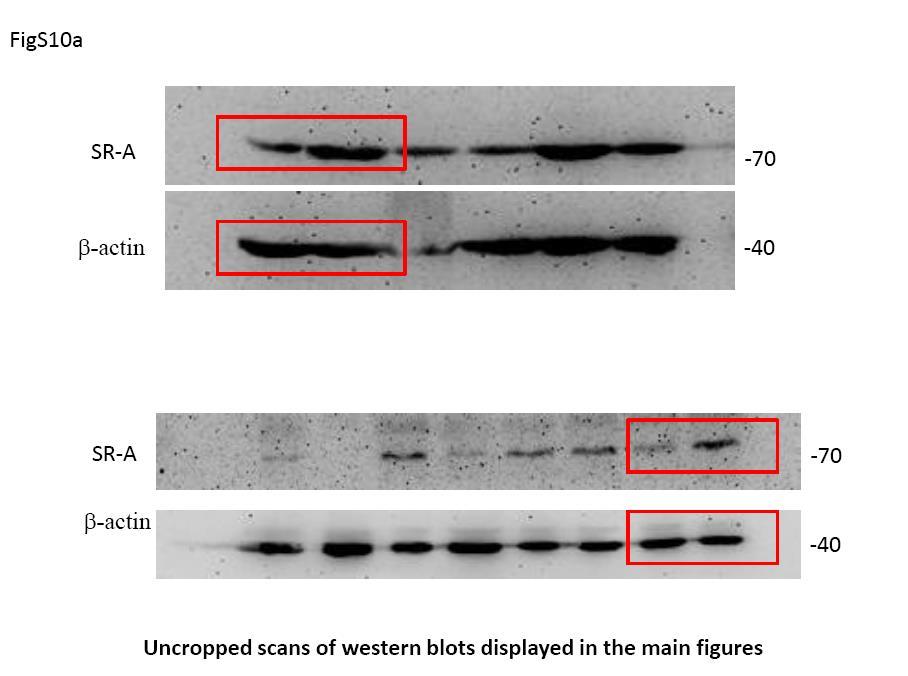
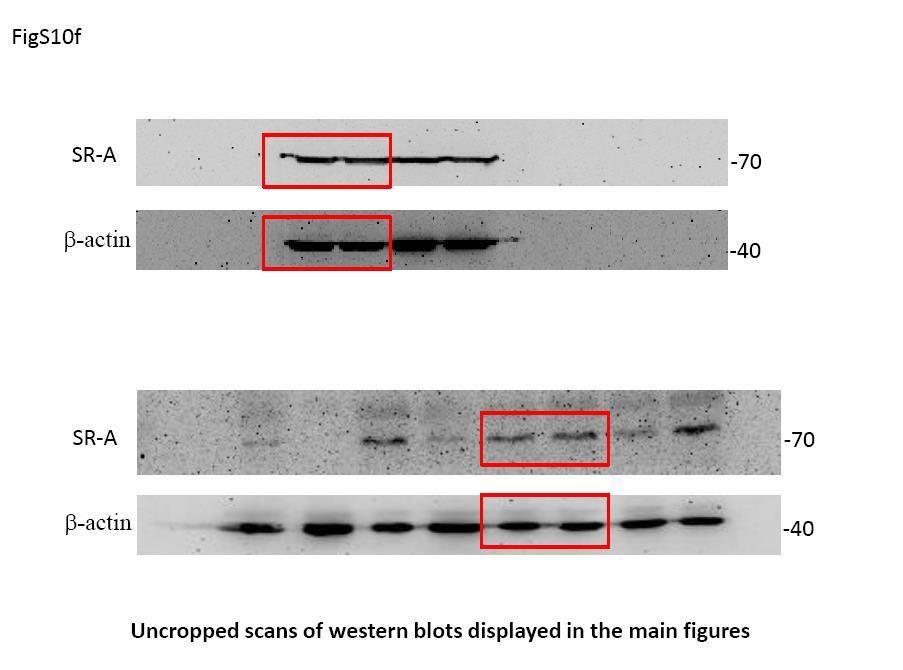
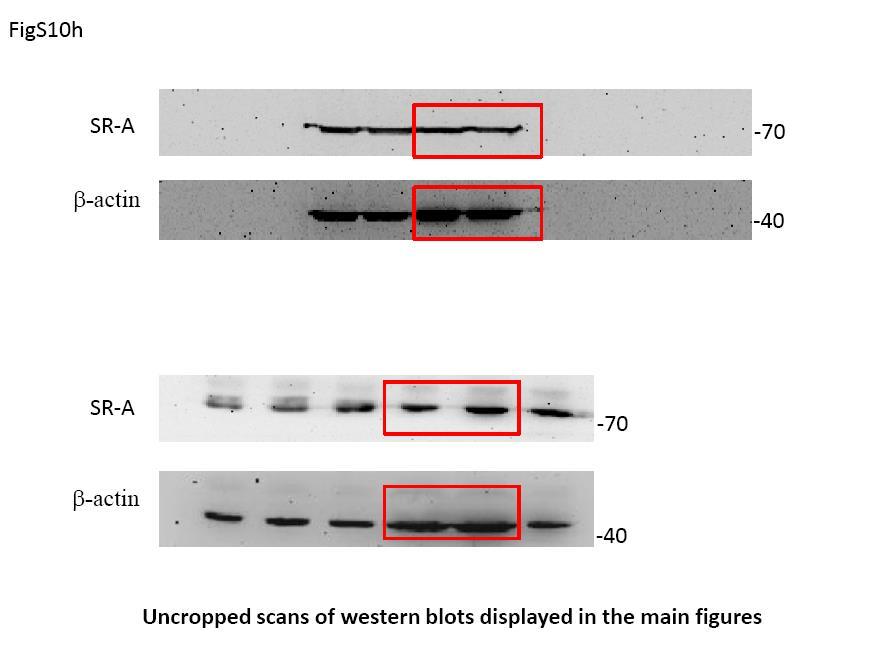
13 Supplementary Figure 10, Related to Figure 6: SR-A expression is regulated by pathogen infection or stimuli Peritoneal macrophages were isolated from normal and S. japonicum-infected or heat-inactivated M. tuberculosis injected WT mice, western blot was carried out for evaluation of SR-A in whole cell lysate (WCL) or cytoplasm (a,f), and the levels of membrane SR-A were analyzed by FACS (b,g), respectively. (c,h) Peritoneal macrophages were in vitro stimulated with SEA or heat-inactivated M. tuberculosis and total and cytoplasmic SR-A was analyzed by western blot. (d,e,i) Peritoneal macrophages were in vitro stimulated with PBS, SEA, or heat-inactivated M. tuberculosis after pretreatment with SR-A blocking antibody (2F8), then membrane SR-A was analyzed by FACS or confocal microscopy. (Scale bars, 10μm). 12
.")
14 Supplementary Figure 11: Diagram of SR-A regulates of adaptive T helper cell responses The current study suggests the possible roles of SR-A in regulating IRF5 nuclear translocation. After the pathogen infection or stimuli, SR-A localizes to the plasma membrane and recognizes the antigen (e.g.sea). The receptor is endocytosed with its recognized antigen, and binds to the cytoplasmic IRF5, a master regulator of the macrophage polarization and Th responses. The interaction of SR-A and IRF5 in cytoplasm inhibits IRF5 translocation and activation. This process is characterized by M2 polarization and high IL-4 production, which induced Th2 differentiation and promoting liver pathology. However, SR-A-deficiency resulted in increasing IRF5 nuclear translocation, the increase of nuclear IRF5 shifted macrophage polarization from M2 towards M1, which subsequently switched Th responses from Th2 to Th1. 13
15 Supplementary Figure 12: FACS gating/sorting strategies (a) Gating schemes for analysis of the percentages of CD3 + CD4 + IFN-γ + (R3, gated from R1 and R2, related to Figures 2a, 2c, 4a-4c, 4g-4i, 5e, Supplementary Figures 2a, 2c, 2h, 4b-4d, 4f, 4i, 5c, 5f, 6d, 7e-7g), CD3 + CD4 + IL-4 + (R4, gated from R1 and R2, related to Figure 2b, 2d, 4a-4c, 4f-4i, 5e, Supplementary Figures 2b,2d, 2h, 4b-4d, 4f, 4i, 5c, 5f, 6d, 7e-7g), CD3 + CD4 + IL-17 + (R5, gated from R1 and R2, related to Supplementary Figure 2e ), CD4 + CD25 + Foxp3 + (R7, gated from R1 and R6, related to Supplementary Figure 2f), CD3 + CD4 + CXCR5 + PD-1 + (R9, gated from R1 and R8, related to Supplementary Figure 2g). Gating schemes for analysis of the percentages of CD3 + CD4 + (R10, gated from R1) after purification by magnetic-activated cell sorting (MACS), related to Figures 4b, 4c, 4h-4i, 5e, Supplementary Figures 4c-4d, 4f, 5c, 5f, 6d). Gating schemes for analysis of the percentages of CD11c + (R11, gated from R1) after purification by MACS, related to Supplementary Figures 4e-4g). (b) Gating schemes for analysis of the percentages of F4/80 + CD11b + CD16/32 + (gated from R1 and R2) or 14
16 F4/80 + CD11b + CD206 + (gated from R1 and R2) cells in the liver, related to Figure 3a. Mononuclear cells from livers of WT and SR-A-deficient mice were collected by Percoll gradient centrifugation, and then purified by flow sorting, related to Figure 3c. (c) Gating schemes for analysis of the percentages of CD16/32 + (R3, gated from R1) or CD206 + (R4, gated from R1) cells in the peritoneal macrophges or BMDMs, related to Supplementary Figures 3a, 4a, 5b, 5e, and 6c. Gating schemes for analysis of the percentages of CD80 +, CD86 +, or MHCII + (R5, gated from R1) cells in the peritoneal macrophges, related to Supplementary Figure 3b. 15

17 Supplementary Figure 13: Uncropped scans of western blots displayed in the main figures 16
18 17
19 18
20 19
21 20
22 21
23 22
24 23
25 24
26 25
27 26
28 27
29 28
30 29
31 30
32 31
33 32
34 33
35 34
36 Supplementary Table 1. Sequence of Primers used Gene name forward reverse TNF catcttctcaaaattcgagtgacaa tgggagtagacaaggtacaaccc IL-12p35: gacagtggaggcaccaggcc cagacatcgctgtcccggcg IL-10 actttaagggttacttgggttgc attttcacaggggagaaatcg CXCL9 tctcggacttcactccaacaca actccacactgctggaggaaga CXCL10 ccgtcattttctgcctcatcc ccctatggccctcattctca CXCL11 gaacaggaaggtcacagccatagc tcaactttgtcgcagccgttactc CCL2 aagccagctctctcttcctcca gcgttaactgcatctggctga CCL17 agtgctgcctggattacttcaaag ctggacagtcagaaacacgatgg CCL22 taacatcatggctaccctgcg tgtcttccacattggcacca IL-4 acaggagaagggacgccat gaagccctacagacgagctca inos gccaccaacaatggcaaca cgtaccggatgagctgtgaatt Arg-1 cagaagaatggaagagtcag cagatatgcagggagtcacc Ym-1 tcacaggtctggcaattcttctg tttgtccttaggagggcttcctc IL-6 gaggataccactcccaacagacc aagtgcatcatcgttgttcataca IRF5 aataccccaccaccttttga aataccccaccaccttttga GAPDH ggtgaaggtcggtgtgaacg accatgtagttgaggtcaatgaagg 35
Supplementary Figure 1
 Supplementary Figure 1 YAP negatively regulates IFN- signaling. (a) Immunoblot analysis of Yap knockdown efficiency with sh-yap (#1 to #4 independent constructs) in Raw264.7 cells. (b) IFN- -Luc and PRDs
Supplementary Figure 1. mrna expression of chitinase and chitinase-like protein in splenic immune cells. Each splenic immune cell population was
 Supplementary Figure 1. mrna expression of chitinase and chitinase-like protein in splenic immune cells. Each splenic immune cell population was sorted by FACS. Surface markers for sorting were CD11c +
Intracellular MHC class II molecules promote TLR-triggered innate. immune responses by maintaining Btk activation
 Intracellular MHC class II molecules promote TLR-triggered innate immune responses by maintaining Btk activation Xingguang Liu, Zhenzhen Zhan, Dong Li, Li Xu, Feng Ma, Peng Zhang, Hangping Yao and Xuetao
Type of file: PDF Title of file for HTML: Supplementary Information Description: Supplementary Figures
 Type of file: PDF Title of file for HTML: Supplementary Information Description: Supplementary Figures Type of file: MOV Title of file for HTML: Supplementary Movie 1 Description: NLRP3 is moving along
Supplemental Figure 1. Signature gene expression in in vitro differentiated Th0, Th1, Th2, Th17 and Treg cells. (A) Naïve CD4 + T cells were cultured
 Naïve CD4 + T cells were cultured") Supplemental Figure 1. Signature gene expression in in vitro differentiated Th0, Th1, Th2, Th17 and Treg cells. (A) Naïve CD4 + T cells were cultured under Th0, Th1, Th2, Th17, and Treg conditions. mrna
Supplemental Figure 1. Signature gene expression in in vitro differentiated Th0, Th1, Th2, Th17 and Treg cells. (A) Naïve CD4 + T cells were cultured under Th0, Th1, Th2, Th17, and Treg conditions. mrna
Supplementary Figure 1. Normal T lymphocyte populations in Dapk -/- mice. (a) Normal thymic development in Dapk -/- mice. Thymocytes from WT and Dapk
 Normal thymic development in Dapk -/- mice. Thymocytes from WT and Dapk") Supplementary Figure 1. Normal T lymphocyte populations in Dapk -/- mice. (a) Normal thymic development in Dapk -/- mice. Thymocytes from WT and Dapk -/- mice were stained for expression of CD4 and CD8.
Supplementary Figure 1. Normal T lymphocyte populations in Dapk -/- mice. (a) Normal thymic development in Dapk -/- mice. Thymocytes from WT and Dapk -/- mice were stained for expression of CD4 and CD8.
Supplementary Figure 1. Deletion of Smad3 prevents B16F10 melanoma invasion and metastasis in a mouse s.c. tumor model.
 A B16F1 s.c. Lung LN Distant lymph nodes Colon B B16F1 s.c. Supplementary Figure 1. Deletion of Smad3 prevents B16F1 melanoma invasion and metastasis in a mouse s.c. tumor model. Highly invasive growth
Supplementary Figure 1. Characterization of basophils after reconstitution of SCID mice
 Supplementary figure legends Supplementary Figure 1. Characterization of after reconstitution of SCID mice with CD4 + CD62L + T cells. (A-C) SCID mice (n = 6 / group) were reconstituted with 2 x 1 6 CD4
RAW264.7 cells stably expressing control shrna (Con) or GSK3b-specific shrna (sh-
 or GSK3b-specific shrna (sh-") 1 a b Supplementary Figure 1. Effects of GSK3b knockdown on poly I:C-induced cytokine production. RAW264.7 cells stably expressing control shrna (Con) or GSK3b-specific shrna (sh- GSK3b) were stimulated
1 a b Supplementary Figure 1. Effects of GSK3b knockdown on poly I:C-induced cytokine production. RAW264.7 cells stably expressing control shrna (Con) or GSK3b-specific shrna (sh- GSK3b) were stimulated
% of live splenocytes. STAT5 deletion. (open shapes) % ROSA + % floxed
 % ROSA + % floxed") Supp. Figure 1. a 14 1 1 8 6 spleen cells (x1 6 ) 16 % of live splenocytes 5 4 3 1 % of live splenocytes 8 6 4 b 1 1 c % of CD11c + splenocytes (closed shapes) 8 6 4 8 6 4 % ROSA + (open shapes) % floxed
Supp. Figure 1. a 14 1 1 8 6 spleen cells (x1 6 ) 16 % of live splenocytes 5 4 3 1 % of live splenocytes 8 6 4 b 1 1 c % of CD11c + splenocytes (closed shapes) 8 6 4 8 6 4 % ROSA + (open shapes) % floxed
Supplementary Fig. 1 p38 MAPK negatively regulates DC differentiation. (a) Western blot analysis of p38 isoform expression in BM cells, immature DCs
 Western blot analysis of p38 isoform expression in BM cells, immature DCs") Supplementary Fig. 1 p38 MAPK negatively regulates DC differentiation. (a) Western blot analysis of p38 isoform expression in BM cells, immature DCs (idcs) and mature DCs (mdcs). A myeloma cell line expressing
Supplementary Fig. 1 p38 MAPK negatively regulates DC differentiation. (a) Western blot analysis of p38 isoform expression in BM cells, immature DCs (idcs) and mature DCs (mdcs). A myeloma cell line expressing
Supplementary Figure 1: TSLP receptor skin expression in dcssc. A: Healthy control (HC) skin with TSLP receptor expression in brown (10x
 skin with TSLP receptor expression in brown (10x") Supplementary Figure 1: TSLP receptor skin expression in dcssc. A: Healthy control (HC) skin with TSLP receptor expression in brown (10x magnification). B: Second HC skin stained for TSLP receptor in brown
Supplementary Figure 1: TSLP receptor skin expression in dcssc. A: Healthy control (HC) skin with TSLP receptor expression in brown (10x magnification). B: Second HC skin stained for TSLP receptor in brown
Supplementary Figure 1. Antibiotic partially rescues mice from sepsis. (ab) BALB/c mice under CLP were treated with antibiotic or PBS.
 BALB/c mice under CLP were treated with antibiotic or PBS.") 1 Supplementary Figure 1. Antibiotic partially rescues mice from sepsis. (ab) BALB/c mice under CLP were treated with antibiotic or PBS. (a) Survival curves. WT Sham (n=5), WT CLP or WT CLP antibiotic
1 Supplementary Figure 1. Antibiotic partially rescues mice from sepsis. (ab) BALB/c mice under CLP were treated with antibiotic or PBS. (a) Survival curves. WT Sham (n=5), WT CLP or WT CLP antibiotic
Supplementary Figure 1. Expression of CUGBP1 in non-parenchymal liver cells treated with TGF-β
 Supplementary Figures Supplementary Figure 1. Expression of CUGBP1 in non-parenchymal liver cells treated with TGF-β and LPS. Non-parenchymal liver cells were isolated and treated with or without TGF-β
ECM1 controls T H 2 cell egress from lymph nodes through re-expression of S1P 1
 ZH, Li et al, page 1 ECM1 controls T H 2 cell egress from lymph nodes through re-expression of S1P 1 Zhenhu Li 1,4,Yuan Zhang 1,4, Zhiduo Liu 1, Xiaodong Wu 1, Yuhan Zheng 1, Zhiyun Tao 1, Kairui Mao 1,
Supplementary Figure 1. Spatial distribution of LRP5 and β-catenin in intact cardiomyocytes. (a) and (b) Immunofluorescence staining of endogenous
 and (b) Immunofluorescence staining of endogenous") Supplementary Figure 1. Spatial distribution of LRP5 and β-catenin in intact cardiomyocytes. (a) and (b) Immunofluorescence staining of endogenous LRP5 in intact adult mouse ventricular myocytes (AMVMs)
Supplementary Figure 1. Spatial distribution of LRP5 and β-catenin in intact cardiomyocytes. (a) and (b) Immunofluorescence staining of endogenous LRP5 in intact adult mouse ventricular myocytes (AMVMs)
SUPPLEMENTARY INFORMATION
 doi:1.138/nature1554 a TNF-α + in CD4 + cells [%] 1 GF SPF 6 b IL-1 + in CD4 + cells [%] 5 4 3 2 1 Supplementary Figure 1. Effect of microbiota on cytokine profiles of T cells in GALT. Frequencies of TNF-α
a surface permeabilized
 a surface permeabilized RAW 64.7 P388D1 J774 b CD11b + Ly-6G - Blood Monocytes WT Supplementary Figure 1. Cell surface expression on macrophages and DCs. (a) RAW64.7, P388D1, and J774 cells were subjected
Supplementary Information. Tissue-wide immunity against Leishmania. through collective production of nitric oxide
 Supplementary Information Tissue-wide immunity against Leishmania through collective production of nitric oxide Romain Olekhnovitch, Bernhard Ryffel, Andreas J. Müller and Philippe Bousso Supplementary
Supplementary Figure 1.TRIM33 binds β-catenin in the nucleus. a & b, Co-IP of endogenous TRIM33 with β-catenin in HT-29 cells (a) and HEK 293T cells
 and HEK 293T cells") Supplementary Figure 1.TRIM33 binds β-catenin in the nucleus. a & b, Co-IP of endogenous TRIM33 with β-catenin in HT-29 cells (a) and HEK 293T cells (b). TRIM33 was immunoprecipitated, and the amount of
Supplementary Figure 1.TRIM33 binds β-catenin in the nucleus. a & b, Co-IP of endogenous TRIM33 with β-catenin in HT-29 cells (a) and HEK 293T cells (b). TRIM33 was immunoprecipitated, and the amount of
Tbk1-TKO! DN cells (%)! 15! 10!
! 15! 10!") a! T Cells! TKO! B Cells! TKO! b! CD4! 8.9 85.2 3.4 2.88 CD8! Tbk1-TKO! 1.1 84.8 2.51 2.54 c! DN cells (%)! 4 3 2 1 DP cells (%)! 9 8 7 6 CD4 + SP cells (%)! 5 4 3 2 1 5 TKO! TKO! TKO! TKO! 15 1 5 CD8
a! T Cells! TKO! B Cells! TKO! b! CD4! 8.9 85.2 3.4 2.88 CD8! Tbk1-TKO! 1.1 84.8 2.51 2.54 c! DN cells (%)! 4 3 2 1 DP cells (%)! 9 8 7 6 CD4 + SP cells (%)! 5 4 3 2 1 5 TKO! TKO! TKO! TKO! 15 1 5 CD8
SUPPLEMENTARY METHODS
 SUPPLEMENTARY METHODS Histological analysis. Colonic tissues were collected from 5 parts of the middle colon on day 7 after the start of DSS treatment, and then were cut into segments, fixed with 4% paraformaldehyde,
Supplementary Figures
 Supplementary Figures Supplementary Figure 1 Characterization of stable expression of GlucB and sshbira in the CT26 cell line (a) Live cell imaging of stable CT26 cells expressing green fluorescent protein
Nature Immunology: doi: /ni.3866
 Nature Immunology: doi:10.1038/ni.3866 Supplementary Figure 1 The effect of TIPE2 on chemotaxis. a, The expression of TIPE2 in dhl-60c, dhl-60t, TIPE2-expressing and 15/16Q-expressing dhl-60t neutrophils
Nature Immunology: doi: /ni Supplementary Figure 1. Cellularity of leukocytes and their progenitors in naive wild-type and Spp1 / mice.
 Supplementary Figure 1 Cellularity of leukocytes and their progenitors in naive wild-type and Spp1 / mice. (a, b) Gating strategies for differentiated cells including PMN (CD11b + Ly6G hi and CD11b + Ly6G
Blocking antibodies and peptides. Rat anti-mouse PD-1 (29F.1A12, rat IgG2a, k), PD-
, PD-") Supplementary Methods Blocking antibodies and peptides. Rat anti-mouse PD-1 (29F.1A12, rat IgG2a, k), PD- L1 (10F.9G2, rat IgG2b, k), and PD-L2 (3.2, mouse IgG1) have been described (24). Anti-CTLA-4 (clone
Supplementary Methods Blocking antibodies and peptides. Rat anti-mouse PD-1 (29F.1A12, rat IgG2a, k), PD- L1 (10F.9G2, rat IgG2b, k), and PD-L2 (3.2, mouse IgG1) have been described (24). Anti-CTLA-4 (clone
Therapeutic effect of baicalin on experimental autoimmune encephalomyelitis. is mediated by SOCS3 regulatory pathway
 Therapeutic effect of baicalin on experimental autoimmune encephalomyelitis is mediated by SOCS3 regulatory pathway Yuan Zhang 1,2, Xing Li 1,2, Bogoljub Ciric 1, Cun-gen Ma 3, Bruno Gran 4, Abdolmohamad
Myeloid cell-derived inducible nitric oxide synthase suppresses M1 macrophage polarization
 Received 28 Oct 24 Accepted 7 Feb 25 Published 27 Mar 25 DOI:.38/ncomms7676 OPEN Myeloid cell-derived inducible nitric oxide synthase suppresses M macrophage polarization Geming Lu, Ruihua Zhang, Shuo
X P. Supplementary Figure 1. Nature Medicine: doi: /nm Nilotinib LSK LT-HSC. Cytoplasm. Cytoplasm. Nucleus. Nucleus
 a b c Supplementary Figure 1 c-kit-apc-eflu780 Lin-FITC Flt3-Linc-Kit-APC-eflu780 LSK Sca-1-PE-Cy7 d e f CD48-APC LT-HSC CD150-PerCP-cy5.5 g h i j Cytoplasm RCC1 X Exp 5 mir 126 SPRED1 SPRED1 RAN P SPRED1
W/T Itgam -/- F4/80 CD115. F4/80 hi CD115 + F4/80 + CD115 +
 F4/8 % in the peritoneal lavage 6 4 2 p=.15 n.s p=.76 CD115 F4/8 hi CD115 + F4/8 + CD115 + F4/8 hi CD115 + F4/8 + CD115 + MHCII MHCII Supplementary Figure S1. CD11b deficiency affects the cellular responses
Title. CitationCancer science, 109(4): Issue Date Doc URL. Rights(URL)
: Issue Date Doc URL. Rights(URL)") Title Toll-like receptor 3 signal augments radiation-induc Yoshida, Sumito; Shime, Hiroaki; Takeda, Yohei; Nam, Author(s) Hiroki; Kasahara, Masanori; Seya, Tsukasa CitationCancer science, 19(): 956-965
Title Toll-like receptor 3 signal augments radiation-induc Yoshida, Sumito; Shime, Hiroaki; Takeda, Yohei; Nam, Author(s) Hiroki; Kasahara, Masanori; Seya, Tsukasa CitationCancer science, 19(): 956-965
Supplementary Figure 1. Prevalence of U539C and G540A nucleotide and E172K amino acid substitutions among H9N2 viruses. Full-length H9N2 NS
 Supplementary Figure 1. Prevalence of U539C and G540A nucleotide and E172K amino acid substitutions among H9N2 viruses. Full-length H9N2 NS nucleotide sequences (a, b) or amino acid sequences (c) from
Supplemental Table I.
 Supplemental Table I Male / Mean ± SEM n Mean ± SEM n Body weight, g 29.2±0.4 17 29.7±0.5 17 Total cholesterol, mg/dl 534.0±30.8 17 561.6±26.1 17 HDL-cholesterol, mg/dl 9.6±0.8 17 10.1±0.7 17 Triglycerides,
Cell isolation. Spleen and lymph nodes (axillary, inguinal) were removed from mice
 were removed from mice") Supplementary Methods: Cell isolation. Spleen and lymph nodes (axillary, inguinal) were removed from mice and gently meshed in DMEM containing 10% FBS to prepare for single cell suspensions. CD4 + CD25
Supplementary Methods: Cell isolation. Spleen and lymph nodes (axillary, inguinal) were removed from mice and gently meshed in DMEM containing 10% FBS to prepare for single cell suspensions. CD4 + CD25
Supplementary Information:
 Supplementary Information: Follicular regulatory T cells with Bcl6 expression suppress germinal center reactions by Yeonseok Chung, Shinya Tanaka, Fuliang Chu, Roza Nurieva, Gustavo J. Martinez, Seema
and follicular helper T cells is Egr2-dependent. (a) Diagrammatic representation of the
 Diagrammatic representation of the") Supplementary Figure 1. LAG3 + Treg-mediated regulation of germinal center B cells and follicular helper T cells is Egr2-dependent. (a) Diagrammatic representation of the experimental protocol for the
Supplementary Figure 1. LAG3 + Treg-mediated regulation of germinal center B cells and follicular helper T cells is Egr2-dependent. (a) Diagrammatic representation of the experimental protocol for the
supplementary information
 DOI: 10.1038/ncb2153 Figure S1 Ectopic expression of HAUSP up-regulates REST protein. (a) Immunoblotting showed that ectopic expression of HAUSP increased REST protein levels in ENStemA NPCs. (b) Immunofluorescent
SUPPLEMENTARY INFORMATION
 DOI: 10.1038/ncb2607 Figure S1 Elf5 loss promotes EMT in mammary epithelium while Elf5 overexpression inhibits TGFβ induced EMT. (a, c) Different confocal slices through the Z stack image. (b, d) 3D rendering
Supplemental Figure 1
 Supplemental Figure 1 1a 1c PD-1 MFI fold change 6 5 4 3 2 1 IL-1α IL-2 IL-4 IL-6 IL-1 IL-12 IL-13 IL-15 IL-17 IL-18 IL-21 IL-23 IFN-α Mut Human PD-1 promoter SBE-D 5 -GTCTG- -1.2kb SBE-P -CAGAC- -1.kb
Supporting Information
 Supporting Information Valkenburg et al. 10.1073/pnas.1403684111 SI Materials and Methods ELISA and Microneutralization. Sera were treated with Receptor Destroying Enzyme II (RDE II, Accurate) before ELISA
Supplemental Materials for. Effects of sphingosine-1-phosphate receptor 1 phosphorylation in response to. FTY720 during neuroinflammation
 Supplemental Materials for Effects of sphingosine-1-phosphate receptor 1 phosphorylation in response to FTY7 during neuroinflammation This file includes: Supplemental Table 1. EAE clinical parameters of
Live cell imaging of trafficking of the chaperone complex vaccine to the ER. BMDCs were incubated with ER-Tracker Red (1 M) in staining solution for
 in staining solution for") Live cell imaging of trafficking of the chaperone complex vaccine to the ER. BMDCs were incubated with ER-Tracker Red (1 M) in staining solution for 15 min at 37 C and replaced with fresh complete medium.
Live cell imaging of trafficking of the chaperone complex vaccine to the ER. BMDCs were incubated with ER-Tracker Red (1 M) in staining solution for 15 min at 37 C and replaced with fresh complete medium.
Supplementary Figure S1. Flow cytometric analysis of the expression of Thy1 in NH cells. Flow cytometric analysis of the expression of T1/ST2 and
 Supplementary Figure S1. Flow cytometric analysis of the expression of Thy1 in NH cells. Flow cytometric analysis of the expression of T1/ST2 and Thy1 in NH cells derived from the lungs of naïve mice.
IL-6Rα IL-6RαT-KO KO. IL-6Rα f/f bp. f/f 628 bp deleted 368 bp. 500 bp
 STD H 2 O WT KO IL-6Rα f/f IL-6Rα IL-6RαT-KO KO 1000 bp 500 bp f/f 628 bp deleted 368 bp Supplementary Figure 1 Confirmation of T-cell IL-6Rα deficiency. (a) Representative histograms and (b) quantification
Supplementary Figures for TSC1 controls macrophage polarization to prevent inflammatory disorder by Linnan Zhu et al
 Supplementary Figures for TSC1 controls macrophage polarization to prevent inflammatory disorder by Linnan Zhu et al Suppl. Fig. 1 Tissue DN C Proteins kd TSC1-17 TSC 1 loxp bp -48-285 ctin PEMs Neutrophils
Nature Immunology: doi: /ni Supplementary Figure 1. Production of cytokines and chemokines after vaginal HSV-2 infection.
 Supplementary Figure 1 Production of cytokines and chemokines after vaginal HSV-2 infection. C57BL/6 mice were (a) treated intravaginally with 20 µl of PBS or infected with 6.7x10 4 pfu of HSV-2 in the
The encephalitogenicity of TH17 cells is dependent on IL-1- and IL-23- induced production of the cytokine GM-CSF
 CORRECTION NOTICE Nat.Immunol. 12, 568 575 (2011) The encephalitogenicity of TH17 cells is dependent on IL-1- and IL-23- induced production of the cytokine GM-CSF Mohamed El-Behi, Bogoljub Ciric, Hong
Supplementary Figure S I: Effects of D4F on body weight and serum lipids in apoe -/- mice.
 Supplementary Figures: Supplementary Figure S I: Effects of D4F on body weight and serum lipids in apoe -/- mice. Male apoe -/- mice were fed a high-fat diet for 8 weeks, and given PBS (model group) or
Supplementary Figures
 Supplementary Figures Supplementary Figure 1 Increased ABHD5 expression in human colon cancer associated macrophages. (a) Murine peritoneal macrophages were treated with regular culture medium (Ctrl) or
(a) Significant biological processes (upper panel) and disease biomarkers (lower panel)
 Significant biological processes (upper panel) and disease biomarkers (lower panel)") Supplementary Figure 1. Functional enrichment analyses of secretomic proteins. (a) Significant biological processes (upper panel) and disease biomarkers (lower panel) 2 involved by hrab37-mediated secretory
Supplementary Figure 1. Functional enrichment analyses of secretomic proteins. (a) Significant biological processes (upper panel) and disease biomarkers (lower panel) 2 involved by hrab37-mediated secretory
Supplementary Information
 Supplementary Information TABLE S1. SUBJECT CHARACTERISTICS* Normal Control Subjects Subjects with Asthma p Value Number 23 48 Age (years) 35±10 35±10 0.75 Sex, M:F (% F) 9:12 (57) 17:26 (60) 0.76 FEV1
Supplementary Figure S1. Venn diagram analysis of mrna microarray data and mirna target analysis. (a) Western blot analysis of T lymphoblasts (CLS)
 Western blot analysis of T lymphoblasts (CLS)") Supplementary Figure S1. Venn diagram analysis of mrna microarray data and mirna target analysis. (a) Western blot analysis of T lymphoblasts (CLS) and their exosomes (EXO) in resting (REST) and activated
Supplementary Figure S1. Venn diagram analysis of mrna microarray data and mirna target analysis. (a) Western blot analysis of T lymphoblasts (CLS) and their exosomes (EXO) in resting (REST) and activated
Supplementary Figure S1 Supplementary Figure S2
 Supplementary Figure S A) The blots shown in Figure B were qualified by using Gel-Pro analyzer software (Rockville, MD, USA). The ratio of LC3II/LC3I to actin was then calculated. The data are represented
SUPPORTING INFORMATIONS
 SUPPORTING INFORMATIONS Mice MT/ret RetCD3ε KO α-cd25 treated MT/ret Age 1 month 3 mnths 6 months 1 month 3 months 6 months 1 month 3 months 6 months 2/87 Survival 87/87 incidence of 17/87 1 ary tumor
SUPPLEMENTARY INFORMATION
 Supplemental Figure 1. Furin is efficiently deleted in CD4 + and CD8 + T cells. a, Western blot for furin and actin proteins in CD4cre-fur f/f and fur f/f Th1 cells. Wild-type and furin-deficient CD4 +
Supplementary information. MARCH8 inhibits HIV-1 infection by reducing virion incorporation of envelope glycoproteins
 Supplementary information inhibits HIV-1 infection by reducing virion incorporation of envelope glycoproteins Takuya Tada, Yanzhao Zhang, Takayoshi Koyama, Minoru Tobiume, Yasuko Tsunetsugu-Yokota, Shoji
Supporting Information
 Supporting Information M1 macrophage-derived nanovesicles potentiate the anticancer efficacy of immune checkpoint inhibitors Yeon Woong Choo, 1, Mikyung Kang, 2, Han Young Kim, 1 Jin Han, 1 Seokyung Kang,
Integrin CD11b negatively regulates TLR-triggered inflammatory responses by. activating Syk and promoting MyD88 and TRIF degradation via cbl-b
 Integrin CD11b negatively regulates TLR-triggered inflammatory responses by activating Syk and promoting MyD88 and TRIF degradation via cbl-b Chaofeng Han, Jing Jin, Sheng Xu, Haibo Liu, Nan Li, and Xuetao
Supplementary Figure 1. Confocal immunofluorescence showing mitochondrial translocation of Drp1. Cardiomyocytes treated with H 2 O 2 were prestained
 Supplementary Figure 1. Confocal immunofluorescence showing mitochondrial translocation of Drp1. Cardiomyocytes treated with H 2 O 2 were prestained with MitoTracker (red), then were immunostained with
Supplementary Fig. 1 No relative growth advantage of Foxp3 negative cells.
 Supplementary Fig. 1 Supplementary Figure S1: No relative growth advantage of Foxp3 negative cells. itreg were induced from WT (A) or FIR (B) CD4 + T cells. FIR itregs were then removed from the TCR signal
Supplementary Figure 1 Chemokine and chemokine receptor expression during muscle regeneration (a) Analysis of CR3CR1 mrna expression by real time-pcr
 Analysis of CR3CR1 mrna expression by real time-pcr") Supplementary Figure 1 Chemokine and chemokine receptor expression during muscle regeneration (a) Analysis of CR3CR1 mrna expression by real time-pcr at day 0, 1, 4, 10 and 21 post- muscle injury. (b)
Supplementary Figure 1 Chemokine and chemokine receptor expression during muscle regeneration (a) Analysis of CR3CR1 mrna expression by real time-pcr at day 0, 1, 4, 10 and 21 post- muscle injury. (b)
Irf1 fold changes (D) 24h 48h. p-p65. t-p65. p-irf3. t-irf3. β-actin SKO TKO 100% 80% 60% 40% 20%
 24h 48h. p-p65. t-p65. p-irf3. t-irf3. β-actin SKO TKO 100% 80% 60% 40% 20%") Irf7 Fold changes 3 1 Irf1 fold changes 3 1 8h h 8h 8h h 8h p-p6 p-p6 t-p6 p-irf3 β-actin p-irf3 t-irf3 β-actin TKO TKO STKO (E) (F) TKO TKO % of p6 nuclear translocation % % 1% 1% % % p6 TKO % of IRF3
Irf7 Fold changes 3 1 Irf1 fold changes 3 1 8h h 8h 8h h 8h p-p6 p-p6 t-p6 p-irf3 β-actin p-irf3 t-irf3 β-actin TKO TKO STKO (E) (F) TKO TKO % of p6 nuclear translocation % % 1% 1% % % p6 TKO % of IRF3
Supplementary Figure 1 IMQ-Induced Mouse Model of Psoriasis. IMQ cream was
 Supplementary Figure 1 IMQ-Induced Mouse Model of Psoriasis. IMQ cream was painted on the shaved back skin of CBL/J and BALB/c mice for consecutive days. (a, b) Phenotypic presentation of mouse back skin
F-actin VWF Vinculin. F-actin. Vinculin VWF
 a F-actin VWF Vinculin b F-actin VWF Vinculin Supplementary Fig. 1. WPBs in HUVECs are located along stress fibers and at focal adhesions. (a) Immunofluorescence images of f-actin (cyan), VWF (yellow),
Supplementary Figure 1. Dynamic Response of WT and mir-21 -/- mice to caerulein. (a) Representative histological sections of mouse pancreas stained
 Representative histological sections of mouse pancreas stained") Supplementary Figure 1. Dynamic Response of WT and mir-21 -/- mice to caerulein. (a) Representative histological sections of mouse pancreas stained with hematoxylin from caerulein-treated WT and mir-21
Supplementary Figure 1. Dynamic Response of WT and mir-21 -/- mice to caerulein. (a) Representative histological sections of mouse pancreas stained with hematoxylin from caerulein-treated WT and mir-21
Targeting tumour associated macrophages in anti-cancer therapies. Annamaria Gal Seminar Series on Drug Discovery Budapest 5 January 2018
 Targeting tumour associated macrophages in anti-cancer therapies Annamaria Gal Seminar Series on Drug Discovery Budapest 5 January 2018 Macrophages: Professional phagocytes of the myeloid lineage APC,
Supplementary. presence of the. (c) mrna expression. Error. in naive or
 mrna expression. Error. in naive or") Figure 1. (a) Naive CD4 + T cells were activated in the presence of the indicated cytokines for 3 days. Enpp2 mrna expression was measured by qrt-pcrhr, infected with (b, c) Naive CD4 + T cells were activated
Figure 1. (a) Naive CD4 + T cells were activated in the presence of the indicated cytokines for 3 days. Enpp2 mrna expression was measured by qrt-pcrhr, infected with (b, c) Naive CD4 + T cells were activated
Supplementary Figure 1: si-craf but not si-braf sensitizes tumor cells to radiation.
 Supplementary Figure 1: si-craf but not si-braf sensitizes tumor cells to radiation. (a) Embryonic fibroblasts isolated from wildtype (WT), BRAF -/-, or CRAF -/- mice were irradiated (6 Gy) and DNA damage
Supplementary Figure 1. The CagA-dependent wound healing or transwell migration of gastric cancer cell. AGS cells transfected with vector control or
 Supplementary Figure 1. The CagA-dependent wound healing or transwell migration of gastric cancer cell. AGS cells transfected with vector control or 3xflag-CagA expression vector were wounded using a pipette
Nature Immunology doi: /ni.3268
 Supplementary Figure 1 Loss of Mst1 and Mst2 increases susceptibility to bacterial sepsis. (a) H&E staining of colon and kidney sections from wild type and Mst1 -/- Mst2 fl/fl Vav-Cre mice. Scale bar,
Interferon γ regulates idiopathic pneumonia syndrome, a. Th17 + CD4 + T-cell-mediated GvH disease
 Interferon γ regulates idiopathic pneumonia syndrome, a Th17 + CD4 + T-cell-mediated GvH disease Nora Mauermann, Julia Burian, Christophe von Garnier, Stefan Dirnhofer, Davide Germano, Christine Schuett,
Supplemental Materials
 Supplemental Materials Programmed death one homolog maintains the pool size of regulatory T cells by promoting their differentiation and stability Qi Wang 1, Jianwei He 1, Dallas B. Flies 2, Liqun Luo
SUPPLEMENTARY FIGURES
 SUPPLEMENTARY FIGURES Supplementary Figure 1. (A) Left, western blot analysis of ISGylated proteins in Jurkat T cells treated with 1000U ml -1 IFN for 16h (IFN) or left untreated (CONT); right, western
Supplementary Figure 1. Efficiency of Mll4 deletion and its effect on T cell populations in the periphery. Nature Immunology: doi: /ni.
 Supplementary Figure 1 Efficiency of Mll4 deletion and its effect on T cell populations in the periphery. Expression of Mll4 floxed alleles (16-19) in naive CD4 + T cells isolated from lymph nodes and
Figure S1. Western blot analysis of clathrin RNA interference in human DCs Human immature DCs were transfected with 100 nm Clathrin SMARTpool or
 Figure S1. Western blot analysis of clathrin RNA interference in human DCs Human immature DCs were transfected with 100 nm Clathrin SMARTpool or control nontargeting sirnas. At 90 hr after transfection,
Supplementary Figure 1. PAQR3 knockdown inhibits SREBP-2 processing in CHO-7 cells CHO-7 cells were transfected with control sirna or a sirna
 Supplementary Figure 1. PAQR3 knockdown inhibits SREBP-2 processing in CHO-7 cells CHO-7 cells were transfected with control sirna or a sirna targeted for hamster PAQR3. At 24 h after the transfection,
well for 2 h at rt. Each dot represents an individual mouse and bar is the mean ±
 Supplementary data: Control DC Blimp-1 ko DC 8 6 4 2-2 IL-1β p=.5 medium 8 6 4 2 IL-2 Medium p=.16 8 6 4 2 IL-6 medium p=.3 5 4 3 2 1-1 medium IL-1 n.s. 25 2 15 1 5 IL-12(p7) p=.15 5 IFNγ p=.65 4 3 2 1
SUPPLEMENTARY FIGURE 1
 SUPPLEMENTARY FIGURE 1 A LN Cell count (1 ) 1 3 1 CD+ 1 1 CDL lo CD hi 1 CD+FoxP3+ 1 1 1 7 3 3 3 % of cells 9 7 7 % of cells CD+ 3 1 % of cells CDL lo CD hi 1 1 % of CD+ cells CD+FoxP3+ 3 1 % of CD+ T
Trim29 gene-targeting strategy. (a) Genotyping of wildtype mice (+/+), Trim29 heterozygous mice (+/ ) and homozygous mice ( / ).
 Genotyping of wildtype mice (+/+), Trim29 heterozygous mice (+/ ) and homozygous mice ( / ).") Supplementary Figure 1 Trim29 gene-targeting strategy. (a) Genotyping of wildtype mice (+/+), Trim29 heterozygous mice (+/ ) and homozygous mice ( / ). (b) Immunoblot analysis of TRIM29 in lung primary
Supplementary Figure 1 Trim29 gene-targeting strategy. (a) Genotyping of wildtype mice (+/+), Trim29 heterozygous mice (+/ ) and homozygous mice ( / ). (b) Immunoblot analysis of TRIM29 in lung primary
Supplementary Figures
 Supplementary Figures Supplementary Figure 1. NKT ligand-loaded tumour antigen-presenting B cell- and monocyte-based vaccine induces NKT, NK and CD8 T cell responses. (A) The cytokine profiles of liver
<10. IL-1β IL-6 TNF + _ TGF-β + IL-23
 3 ns 25 ns 2 IL-17 (pg/ml) 15 1 ns ns 5 IL-1β IL-6 TNF
CD4 + T cells recovered in Rag2 / recipient ( 10 5 ) Heart Lung Pancreas
 Heart Lung Pancreas") a CD4 + T cells recovered in Rag2 / recipient ( 1 5 ) Heart Lung Pancreas.5 1 2 4 6 2 4 6 Ctla4 +/+ Ctla4 / Ctla4 / Lung Ctla4 / Pancreas b Heart Lung Pancreas Ctla4 +/+ Ctla4 / Ctla4 / Lung Ctla4 / Pancreas
a CD4 + T cells recovered in Rag2 / recipient ( 1 5 ) Heart Lung Pancreas.5 1 2 4 6 2 4 6 Ctla4 +/+ Ctla4 / Ctla4 / Lung Ctla4 / Pancreas b Heart Lung Pancreas Ctla4 +/+ Ctla4 / Ctla4 / Lung Ctla4 / Pancreas
Supplementary Material
 Supplementary Material accompanying the manuscript Interleukin 37 is a fundamental inhibitor of innate immunity Marcel F Nold, Claudia A Nold-Petry, Jarod A Zepp, Brent E Palmer, Philip Bufler & Charles
Supplementary Materials for
 www.sciencemag.org/content/348/6241/aaa825/suppl/dc1 Supplementary Materials for A mucosal vaccine against Chlamydia trachomatis generates two waves of protective memory T cells Georg Stary,* Andrew Olive,
Supplementary Materials for
 www.sciencesignaling.org/cgi/content/full/2/1/ra81/dc1 Supplementary Materials for Delivery of MicroRNA-126 by Apoptotic Bodies Induces CXCL12- Dependent Vascular Protection Alma Zernecke,* Kiril Bidzhekov,
SUPPLEMENTARY FIGURES
 SUPPLEMENTARY FIGURES Supplementary Figure 1: Chemokine receptor expression profiles of CCR6 + and CCR6 - CD4 + IL-17A +/ex and Treg cells. Quantitative PCR analysis of chemokine receptor transcript abundance
Supplementary Figure 1 CD4 + T cells from PKC-θ null mice are defective in NF-κB activation during T cell receptor signaling. CD4 + T cells were
 Supplementary Figure 1 CD4 + T cells from PKC-θ null mice are defective in NF-κB activation during T cell receptor signaling. CD4 + T cells were isolated from wild type (PKC-θ- WT) or PKC-θ null (PKC-θ-KO)
Peli1 negatively regulates T-cell activation and prevents autoimmunity
 Peli1 negatively regulates T-cell activation and prevents autoimmunity Mikyoung Chang 1,*, Wei Jin 1,5,*, Jae-Hoon Chang 1, Yi-chuan Xiao 1, George Brittain 1, Jiayi Yu 1, Xiaofei Zhou 1, Yi-Hong Wang
Supplemental Information. Aryl Hydrocarbon Receptor Controls. Monocyte Differentiation. into Dendritic Cells versus Macrophages
 Immunity, Volume 47 Supplemental Information Aryl Hydrocarbon Receptor Controls Monocyte Differentiation into Dendritic Cells versus Macrophages Christel Goudot, Alice Coillard, Alexandra-Chloé Villani,
Supplementary Information
 Supplementary Information mediates STAT3 activation at retromer-positive structures to promote colitis and colitis-associated carcinogenesis Zhang et al. a b d e g h Rel. Luc. Act. Rel. mrna Rel. mrna
Control GST GST-RAP. α2-mg. 170 kda. b-actin. 42 kda LRP-1
 % of max Supplementary Figure 1 Control GST GST-RP 17 kda α2-mg 42 kda b-actin Gate: CD11c+ (DCs) Gate: F4/8+ (Mfs) IgG Cd11cCre + Lrp1 fl/fl LRP-1 Supplementary figure 1. () MDCs were pretreated with
Figure S1. Reduction in glomerular mir-146a levels correlate with progression to higher albuminuria in diabetic patients.
 Supplementary Materials Supplementary Figures Figure S1. Reduction in glomerular mir-146a levels correlate with progression to higher albuminuria in diabetic patients. Figure S2. Expression level of podocyte
for six pairs of mice. (b) Representative FACS analysis of absolute number of T cells (CD4 + and
 Representative FACS analysis of absolute number of T cells (CD4 + and") SUPPLEMENTARY DATA Supplementary Figure 1: Peripheral lymphoid organs of SMAR1 -/- mice have an effector memory phenotype. (a) Lymphocytes collected from MLNs and Peyer s patches (PPs) of WT and SMAR1
SUPPLEMENTARY DATA Supplementary Figure 1: Peripheral lymphoid organs of SMAR1 -/- mice have an effector memory phenotype. (a) Lymphocytes collected from MLNs and Peyer s patches (PPs) of WT and SMAR1
LPS LPS P6 - + Supplementary Fig. 1.
 P6 LPS - - - + + + - LPS + + - - P6 + Supplementary Fig. 1. Pharmacological inhibition of the JAK/STAT blocks LPS-induced HMGB1 nuclear translocation. RAW 267.4 cells were stimulated with LPS in the absence
Supplementary Figure 1 Induction of cellular senescence and isolation of exosome. a to c, Pre-senescent primary normal human diploid fibroblasts
 Supplementary Figure 1 Induction of cellular senescence and isolation of exosome. a to c, Pre-senescent primary normal human diploid fibroblasts (TIG-3 cells) were rendered senescent by either serial passage
Supplementary Information
 Supplementary Information An orally available, small-molecule interferon inhibits viral replication Hideyuki Konishi 1, Koichi Okamoto 1, Yusuke Ohmori 1, Hitoshi Yoshino 2, Hiroshi Ohmori 1, Motooki Ashihara
p = formed with HCI-001 p = Relative # of blood vessels that formed with HCI-002 Control Bevacizumab + 17AAG Bevacizumab 17AAG
 A.. Relative # of ECs associated with HCI-001 1.4 1.2 1.0 0.8 0.6 0.4 0.2 0.0 ol b p < 0.001 Relative # of blood vessels that formed with HCI-001 1.4 1.2 1.0 0.8 0.6 0.4 0.2 0.0 l b p = 0.002 Control IHC:
Supporting Information. FADD regulates NF-кB activation and promotes ubiquitination of cflip L to induce. apoptosis
 1 2 Supporting Information 3 4 5 FADD regulates NF-кB activation and promotes ubiquitination of cflip L to induce apoptosis 6 7 Kishu Ranjan and Chandramani Pathak* 8 9 Department of Cell Biology, School
Programmed necrosis, not apoptosis, is a key mediator of cell loss and DAMP-mediated inflammation in dsrna-induced retinal degeneration
 Programmed necrosis, not apoptosis, is a key mediator of cell loss and DAMP-mediated inflammation in dsrna-induced retinal degeneration The Harvard community has made this article openly available. Please
Nature Neuroscience: doi: /nn Supplementary Figure 1
 Supplementary Figure 1 Quantification of myelin fragments in the aging brain (a) Electron microscopy on corpus callosum is shown for a 18-month-old wild type mice. Myelin fragments (arrows) were detected