Nature Immunology doi: /ni.3268
|
|
|
- Steven Carson
- 5 years ago
- Views:
Transcription
1
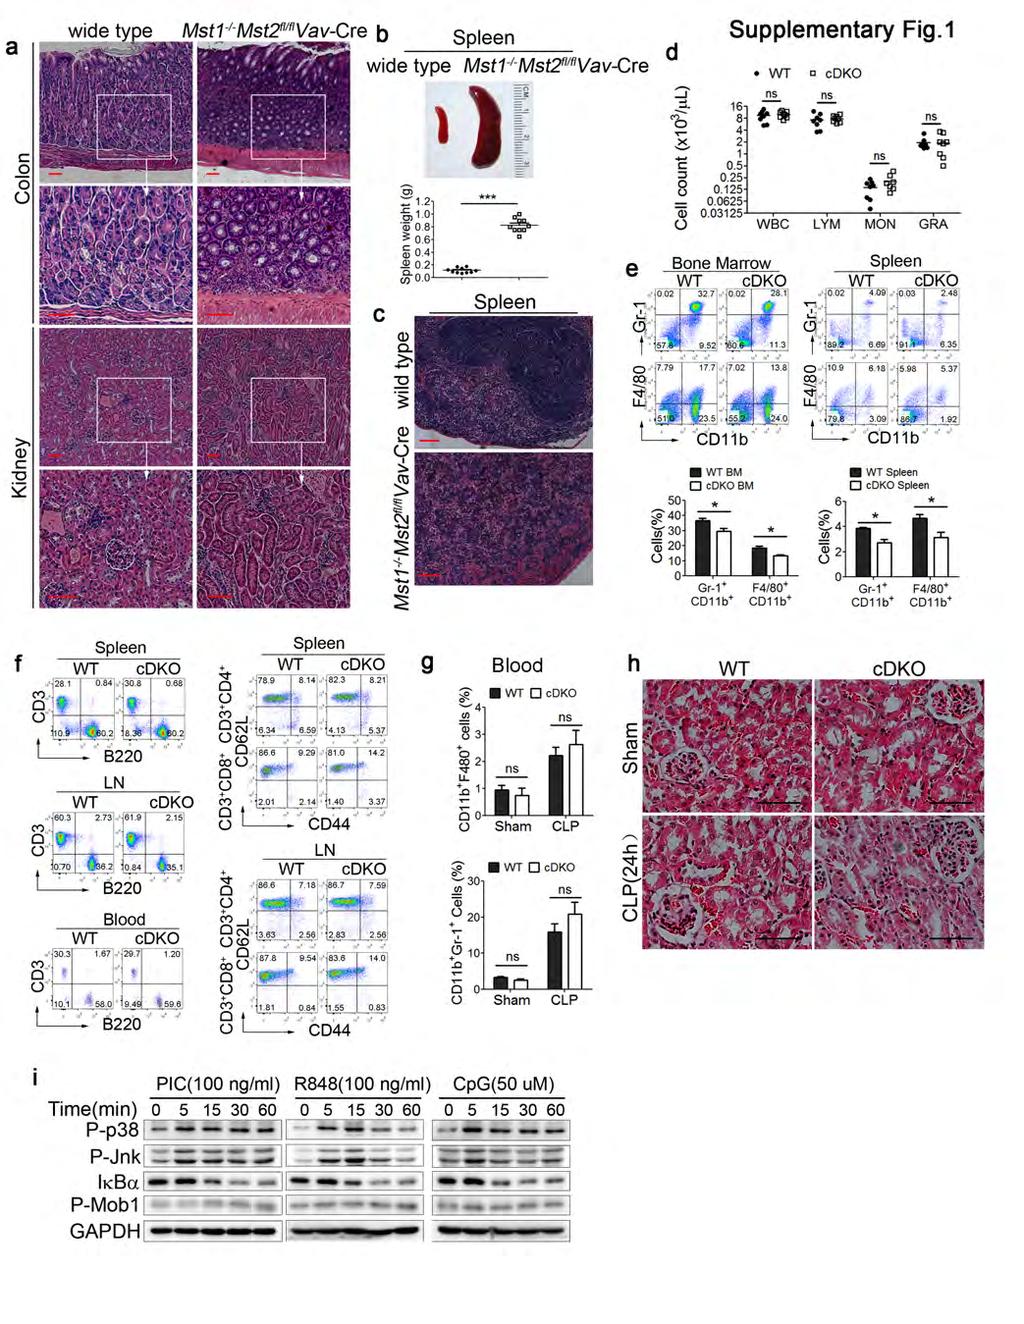
2 Supplementary Figure 1 Loss of Mst1 and Mst2 increases susceptibility to bacterial sepsis. (a) H&E staining of colon and kidney sections from wild type and Mst1 -/- Mst2 fl/fl Vav-Cre mice. Scale bar, 50 µm. (b, c) Representative spleen tissues: spleen weight (b) and H&E staining of spleen sections (c) from wild type and Mst1 -/- Mst2 fl/fl Vav-Cre mice. Scale bar, 100 µm. (d) White blood cell (WBC), circulating lymphocyte (LYM), monocyte (MON) and granulocyte (GRA) counts in Mst1 fl/fl Mst2 fl/fl (WT) and Mst1 fl/fl Mst2 fl/fl Lyz2-Cre (cdko) mice. Each dot represents an individual mouse, and horizontal bars indicate the mean. (e) Flow cytometric analysis of Gr-1 + CD11b + neutrophil and F4/80 + CD11b + macrophage populations in the bone marrow and spleens of WT and cdko mice, as determined with anti-gr-1, anti-f4/80 and anti-cd11b antibodies. (f) Flow cytometric analysis of B220 + B cell, CD3 + T cell, the naïve T cell (CD62L high CD44 low ) and the effector T cell (CD62L low CD44 high ) populations in the spleen, lymph node (LN) or blood of WT and cdko mice, with the indicated antibodies. (g) Flow cytometric analysis of Gr-1 + CD11b + neutrophil and F4/80 + CD11b + macrophage populations in blood of WT and cdko mice subjected to cecal ligation and puncture (CLP) for 24h. (h) H&E staining of kidney sections from WT or cdko mice subjected to sublethal CLP. Scale bar, 50 µm. (i) WT BMDMs were stimulated with different TLR agonists for the indicated times, followed by immunoblot analysis with the indicated antibodies. Data were assessed with Student s t-test and are represented as mean ± s.d. ns, not significant, * p<0.05, *** p<0.001 compared with respective controls or as indicated (b, n=10; d, n=8; e, n=3; g, n=4). Data are representative of three independent experiments
3
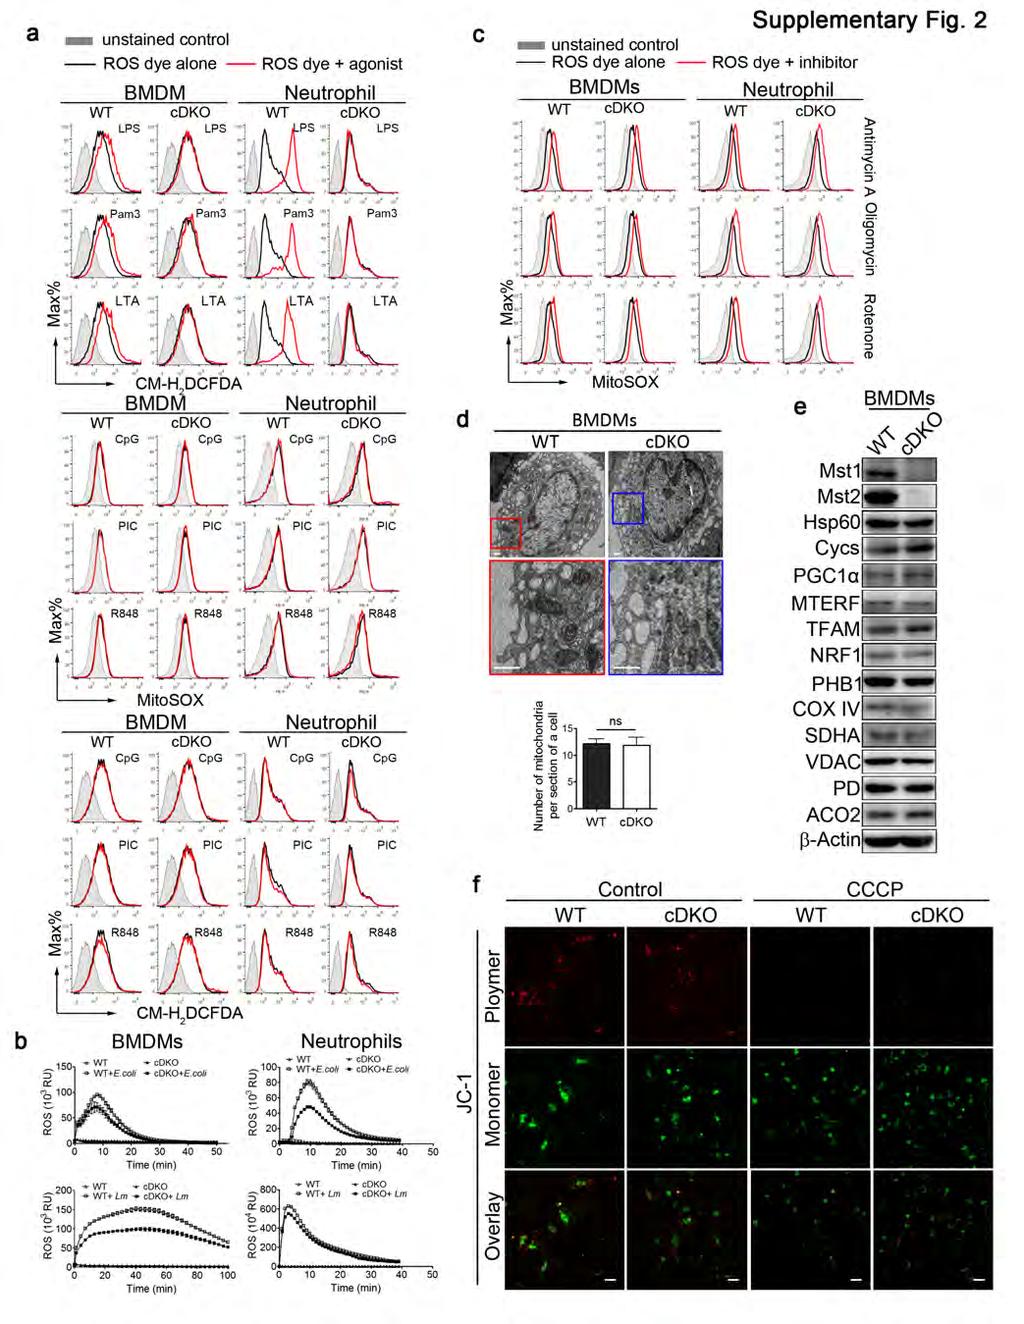
4 Supplementary Figure 2 Mst1- and Mst2-deficient myeloid cells are defective in killing bacteria and induction of mros. (a) Mst1 fl/fl Mst2 fl/fl (WT) and Mst1 fl/fl Mst2 fl/fl Lyz2-Cre (cdko) BMDMs or neutrophils were treated with indicated TLR agonists for 6 h. LPS, Lipopolysaccharide; Pam3, Pam3CSK4; LTA, Lipoteichoic acid; PIC, poly(i:c). mros (MitoSox) and total cellular ROS (CM-H2DCFDA) production were measured by flow cytometry. (b) Luminometry of ROS production by WT and cdko BMDMs or neutrophils infected with E. coli (MOI, 10) or L. monocytogenes (Lm, MOI, 10). RU, relative units. Results are represented as mean ± s.d. n=3. (c) WT and cdko BMDMs or neutrophils were treated with antimycin A, oligomysin or rotenone for 6 h. mros production was measured as described in (a). (d-f) Representative transmission electron micrographs (d, Scale bar, 0.5 µm), the number of mitochondria (d), western blots of the major electron transport chain components (e) and the mitochondrial potential shown by JC-1 staining (f, Scale bar, 50 µm) of DMDMs from WT and cdko mice. Data were assessed with Student s t test and are represented as mean ± s.d. (d, n=20). ns, not significant. Data are representative of three independent experiments.
 Mst1 fl/fl Mst2 fl/fl (WT), Mst1 fl/fl Mst2 fl/fl Lyz2-Cre (cdko), Rac1 G12V and cdko-rac1 G12V BMDMs were treated with the indicated doses of cytochalasin D and were immunostained with F-actin")
5 Supplementary Figure 3 Treatment with cytochalasin D diminishes the induction of mros and cellular ROS in BMDMs after stimulation with LPS. (a) Mst1 fl/fl Mst2 fl/fl (WT), Mst1 fl/fl Mst2 fl/fl Lyz2-Cre (cdko), Rac1 G12V and cdko-rac1 G12V BMDMs were treated with the indicated doses of cytochalasin D and were immunostained with F-actin antibodies (green). Scale bar, 20 µm. (b) WT BMDMs were pretreated with the indicated doses of cytochalasin D for 1 h followed by LPS stimulation for 3 h. mros and cellular ROS production were measured by staining cells with MitoSOX and
6 CM-H2DCFDA for 30 min, respectively, followed by flow cytometry. Data are representative of three independent experiments.
7 Supplementary Figure 4 Interaction of Mst2 and PKC isoforms. (a) The interaction between Mst2 and PKC kinases. Co-immunoprecipitation assay of 293T cells expressing HA-Mst2 and Flag-tagged PKCα, β, γ, δ, ε, η, θ, ι or ζ as indicated. Cell lysates were immunoprecipitated with anti-flag antibody and analysed by immunoblotting with antibodies as indicated. (b) Mst2 binds the N-terminal regulatory domain of PKCα. Co-immunoprecipitation assay of 293T cells
8 expressing HA-Mst2 and Flag-PKCα N-terminal (NT) or Flag-PKCα C-terminal (CT) as indicated combination. The cell lysates and immunoprecipitates were analysed by immunoblotting with antibodies as indicated. (c) Phosphorylation sites of PKCα were detected by mass spectrometry analysis of bacterially expressed GSTtagged PKCα(NT) from an in vitro kinase reaction with triple HA-tagged Mst2 immunoprecipitated from HeLa cells. Data are representative of three independent experiments.
 The distribution of Rac1 (red) in Mst1 fl/fl Mst2 fl/fl (WT) BMDMs, Mst1 fl/fl Mst2 fl/fl Lyz2-Cre (cdko) BMDMs and WT BMDMs treated with NSC23766 after phagocytosis with GFP-E. coli.")
9 Supplementary Figure 5 TRAF6 activity is essential for the K63-linked ubiquitylation of Rac1. (a) The distribution of Rac1 (red) in Mst1 fl/fl Mst2 fl/fl (WT) BMDMs, Mst1 fl/fl Mst2 fl/fl Lyz2-Cre (cdko) BMDMs and WT BMDMs treated with NSC23766 after phagocytosis with GFP-E. coli. Images shown are representative of approximately 100 cells. Scale bar, 20 µm. (b) Pull-down experiments were performed using purified Flag-Rac1 WT, Flag-Rac1 G12V or Flag-Rac T17N
10 incubated with lysates from LPS-treated BMDMs. Immunoblots show the association of TRAF6 with Flag- Rac T17N. (c) Ubiquitination and immunoprecipitation assay of 293T cells transfected with plasmids expressing Flag- Rac1, Myc-TRAF6 and HA-ubiquitin (Ub), HA-ubiquitin K48 (Ub 48) or HA-ubiquitin K63 (Ub 63). Cell lysates were immunoprecipitated with anti-flag antibody. The cell lysates and immunoprecipitates were analysed by immunoblotting with antibodies as indicated. Anti-HA immunoblotting shows the level of Rac ubiquitylation. (d) Knock-down of TRAF6 expression levels in BMDMs or RAW264.7 cells with different TRAF6 shrnas. (e) The ubiquitination levels of WT or mutated Rac1 with the indicated substitutions of lysine (K) with arginine (R) in 293T cells. Data are representative of three independent experiments.
 HeLa cells were transfected with plasmids expressing Rac1 WT, Rac1 G12V or Rac1 TN17, and/or TRAF6 as indicated combination.")
11 Supplementary Figure 6 TRAF6 maintains a Rac1 activation state via K63-linked ubiquitination. (a) HeLa cells were transfected with plasmids expressing Rac1 WT, Rac1 G12V or Rac1 TN17, and/or TRAF6 as indicated combination. Confocal microscopy shows the co-localization of TRAF6 (green) with Rac1 TN17 (red),
12 but not with Rac1 G12V (red), at the cell periphery. Images shown are representative of approximately 100 cells. Scale bar, 20 µm. (b) Ubiquitination and immunoprecipitation assay of 293T cells expressing Flag-Rac1, Myc-TRAF6 and/or HA-Ub and treated with or without NSC23766 as indicated. Cell lysates were immunoprecipitated with anti- Flag antibody and analysed by immunoblotting with antibodies as indicated. Anti-HA immunoblotting shows that Rac ubiquitination by TRAF6 is reduced by the Rac1 inhibitor. Data are representative of three independent experiments.
13
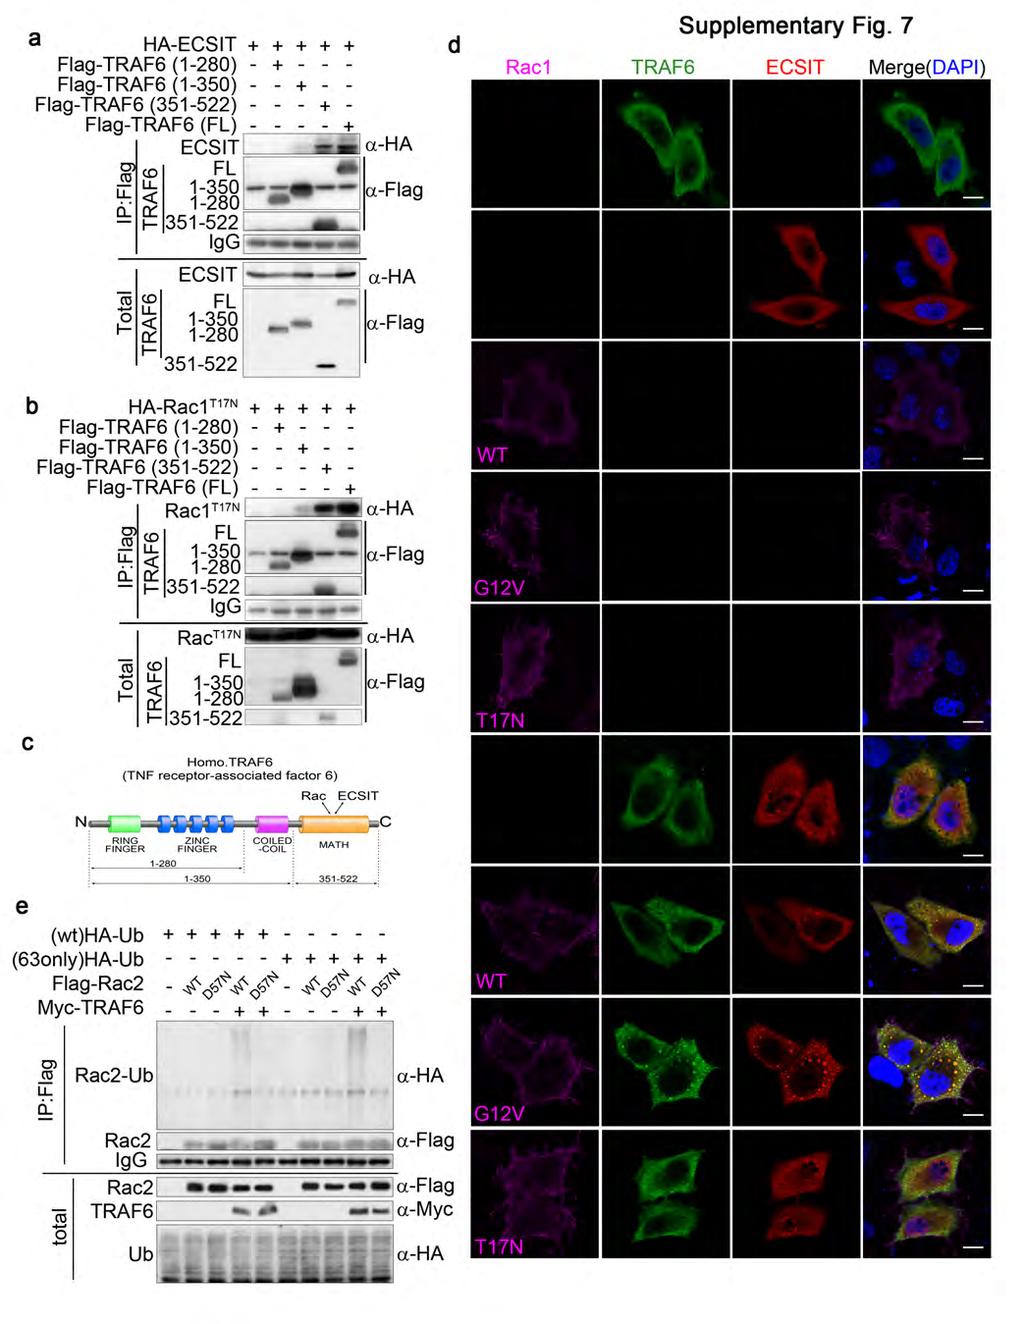
14 Supplementary Figure 7 Rac1 G12V enhances assembly of the TRAF6-ECSIT complex. (a-c) ECIST or Rac1 binds to the math domain of TRAF6. Co-immunoprecipitation assay of 293T cells expressing HA-ECSIT (a) or HA-Rac1 T17N (b), and Flag-TRAF6 full-length (FL) or fragments as indicated. Cell lysates were immunoprecipitated with anti-flag antibody and analysed by immunoblotting with antibodies as indicated. Schematic representation of the domain organization of TRAF6 is shown (c). (d) Loss of the K63-linked ubiquitination of inactivated Rac2 D57N by TRAF6 in 293T cells. Ubiquitination and co-immunoprecipitation assay of 293T cells expressing Flag-Rac2 WT, Flag-Rac2 D57N and/or Myc-TRAF6, plus WT ubiquitin (HA-Ub) or K63-linked ubiquitin ([63 only]ha-ub) as indicated. (e) HeLa cells were transfected with expression plasmids for Rac1 WT, Rac1 G12V or Rac1 TN17. Confocal microscopy shows enhanced co-localization of TRAF6 (green) with ECSIT (red) mediated by active Rac1 G12V (purple). Images shown are representative of approximately 100 cells. Scale bar, 20 µm. Data are representative of three independent experiments.
15 Supplementary Figure 8 Mst1 and Mst2 positively regulate the induction of phagocyte ROS and bactericidal activity. (a) A proposed working model for TLR-Hippo signalling-mediated ROS production. During an antimicrobial response, Toll-like receptor (TLR) signalling triggers the Mst1 and Mst2 kinases to directly phosphorylate PKCα at Ser 226 and Thr 228, leading to its activation, which promotes the dissociation of the GDPdissociation inhibitor LyGDI from Rac and enhances the GTP charging of Rac. Activated Rac then triggers the assembly of the TRAF6-ECSIT complex, controlling mitochondrial trafficking and promoting mitochondrionphagosome juxtaposition and thereby augmenting mitochondrial ROS (mros) production. TRAF6 further mediates the Lys (63)-linked ubiquitination of active Rac, maintaining the GTP charging of Rac and the subsequent activation of ROS-generating machinery during an antimicrobial response.
Supplementary Figure 1. Normal T lymphocyte populations in Dapk -/- mice. (a) Normal thymic development in Dapk -/- mice. Thymocytes from WT and Dapk
 Normal thymic development in Dapk -/- mice. Thymocytes from WT and Dapk") Supplementary Figure 1. Normal T lymphocyte populations in Dapk -/- mice. (a) Normal thymic development in Dapk -/- mice. Thymocytes from WT and Dapk -/- mice were stained for expression of CD4 and CD8.
Supplementary Figure 1. Normal T lymphocyte populations in Dapk -/- mice. (a) Normal thymic development in Dapk -/- mice. Thymocytes from WT and Dapk -/- mice were stained for expression of CD4 and CD8.
Nature Immunology: doi: /ni.3866
 Nature Immunology: doi:10.1038/ni.3866 Supplementary Figure 1 The effect of TIPE2 on chemotaxis. a, The expression of TIPE2 in dhl-60c, dhl-60t, TIPE2-expressing and 15/16Q-expressing dhl-60t neutrophils
Supplementary Figure 1
 Supplementary Figure 1 YAP negatively regulates IFN- signaling. (a) Immunoblot analysis of Yap knockdown efficiency with sh-yap (#1 to #4 independent constructs) in Raw264.7 cells. (b) IFN- -Luc and PRDs
Intracellular MHC class II molecules promote TLR-triggered innate. immune responses by maintaining Btk activation
 Intracellular MHC class II molecules promote TLR-triggered innate immune responses by maintaining Btk activation Xingguang Liu, Zhenzhen Zhan, Dong Li, Li Xu, Feng Ma, Peng Zhang, Hangping Yao and Xuetao
Type of file: PDF Title of file for HTML: Supplementary Information Description: Supplementary Figures
 Type of file: PDF Title of file for HTML: Supplementary Information Description: Supplementary Figures Type of file: MOV Title of file for HTML: Supplementary Movie 1 Description: NLRP3 is moving along
Nature Immunology: doi: /ni Supplementary Figure 1. IC261 inhibits a virus-induced type I interferon response.
 Supplementary Figure 1 IC261 inhibits a virus-induced type I interferon response. (a) HEK293T cells were cultured in 384 wells and transiently transfected with 50 ng of the IFN-β promoter-luc construct
RAW264.7 cells stably expressing control shrna (Con) or GSK3b-specific shrna (sh-
 or GSK3b-specific shrna (sh-") 1 a b Supplementary Figure 1. Effects of GSK3b knockdown on poly I:C-induced cytokine production. RAW264.7 cells stably expressing control shrna (Con) or GSK3b-specific shrna (sh- GSK3b) were stimulated
1 a b Supplementary Figure 1. Effects of GSK3b knockdown on poly I:C-induced cytokine production. RAW264.7 cells stably expressing control shrna (Con) or GSK3b-specific shrna (sh- GSK3b) were stimulated
Supplementary Figure 1.TRIM33 binds β-catenin in the nucleus. a & b, Co-IP of endogenous TRIM33 with β-catenin in HT-29 cells (a) and HEK 293T cells
 and HEK 293T cells") Supplementary Figure 1.TRIM33 binds β-catenin in the nucleus. a & b, Co-IP of endogenous TRIM33 with β-catenin in HT-29 cells (a) and HEK 293T cells (b). TRIM33 was immunoprecipitated, and the amount of
Supplementary Figure 1.TRIM33 binds β-catenin in the nucleus. a & b, Co-IP of endogenous TRIM33 with β-catenin in HT-29 cells (a) and HEK 293T cells (b). TRIM33 was immunoprecipitated, and the amount of
SUPPLEMENTAL FIGURE LEGENDS
 SUPPLEMENTAL FIGURE LEGENDS Supplemental Figure S1: Endogenous interaction between RNF2 and H2AX: Whole cell extracts from 293T were subjected to immunoprecipitation with anti-rnf2 or anti-γ-h2ax antibodies
(A) SW480, DLD1, RKO and HCT116 cells were treated with DMSO or XAV939 (5 µm)
 SW480, DLD1, RKO and HCT116 cells were treated with DMSO or XAV939 (5 µm)") Supplementary Figure Legends Figure S1. Tankyrase inhibition suppresses cell proliferation in an axin/β-catenin independent manner. (A) SW480, DLD1, RKO and HCT116 cells were treated with DMSO or XAV939
Supplementary Figure Legends Figure S1. Tankyrase inhibition suppresses cell proliferation in an axin/β-catenin independent manner. (A) SW480, DLD1, RKO and HCT116 cells were treated with DMSO or XAV939
SUPPLEMENTARY INFORMATION
 SUPPLEMENTARY INFORMATION doi:10.1038/nature11429 S1a 6 7 8 9 Nlrc4 allele S1b Nlrc4 +/+ Nlrc4 +/F Nlrc4 F/F 9 Targeting construct 422 bp 273 bp FRT-neo-gb-PGK-FRT 3x.STOP S1c Nlrc4 +/+ Nlrc4 F/F casp1
SUPPLEMENTARY INFORMATION
 SUPPLEMENTARY INFORMATION doi:1.138/nature9814 a A SHARPIN FL B SHARPIN ΔNZF C SHARPIN T38L, F39V b His-SHARPIN FL -1xUb -2xUb -4xUb α-his c Linear 4xUb -SHARPIN FL -SHARPIN TF_LV -SHARPINΔNZF -SHARPIN
Supplementary Figure 1 CD4 + T cells from PKC-θ null mice are defective in NF-κB activation during T cell receptor signaling. CD4 + T cells were
 Supplementary Figure 1 CD4 + T cells from PKC-θ null mice are defective in NF-κB activation during T cell receptor signaling. CD4 + T cells were isolated from wild type (PKC-θ- WT) or PKC-θ null (PKC-θ-KO)
Tbk1-TKO! DN cells (%)! 15! 10!
! 15! 10!") a! T Cells! TKO! B Cells! TKO! b! CD4! 8.9 85.2 3.4 2.88 CD8! Tbk1-TKO! 1.1 84.8 2.51 2.54 c! DN cells (%)! 4 3 2 1 DP cells (%)! 9 8 7 6 CD4 + SP cells (%)! 5 4 3 2 1 5 TKO! TKO! TKO! TKO! 15 1 5 CD8
a! T Cells! TKO! B Cells! TKO! b! CD4! 8.9 85.2 3.4 2.88 CD8! Tbk1-TKO! 1.1 84.8 2.51 2.54 c! DN cells (%)! 4 3 2 1 DP cells (%)! 9 8 7 6 CD4 + SP cells (%)! 5 4 3 2 1 5 TKO! TKO! TKO! TKO! 15 1 5 CD8
Figure S1. Generation of inducible PTEN deficient mice and the BMMCs (A) B6.129 Pten loxp/loxp mice were mated with B6.
 B6.129 Pten loxp/loxp mice were mated with B6.") Figure S1. Generation of inducible PTEN deficient mice and the BMMCs (A) B6.129 Pten loxp/loxp mice were mated with B6.129-Gt(ROSA)26Sor tm1(cre/ert2)tyj /J mice. To induce deletion of the Pten locus,
Figure S1. Generation of inducible PTEN deficient mice and the BMMCs (A) B6.129 Pten loxp/loxp mice were mated with B6.129-Gt(ROSA)26Sor tm1(cre/ert2)tyj /J mice. To induce deletion of the Pten locus,
293T cells were transfected with indicated expression vectors and the whole-cell extracts were subjected
 SUPPLEMENTARY INFORMATION Supplementary Figure 1. Formation of a complex between Slo1 and CRL4A CRBN E3 ligase. (a) HEK 293T cells were transfected with indicated expression vectors and the whole-cell
a surface permeabilized
 a surface permeabilized RAW 64.7 P388D1 J774 b CD11b + Ly-6G - Blood Monocytes WT Supplementary Figure 1. Cell surface expression on macrophages and DCs. (a) RAW64.7, P388D1, and J774 cells were subjected
Supplementary Figure 1. PD-L1 is glycosylated in cancer cells. (a) Western blot analysis of PD-L1 in breast cancer cells. (b) Western blot analysis
 Western blot analysis of PD-L1 in breast cancer cells. (b) Western blot analysis") Supplementary Figure 1. PD-L1 is glycosylated in cancer cells. (a) Western blot analysis of PD-L1 in breast cancer cells. (b) Western blot analysis of PD-L1 in ovarian cancer cells. (c) Western blot analysis
Supplementary Figure 1. PD-L1 is glycosylated in cancer cells. (a) Western blot analysis of PD-L1 in breast cancer cells. (b) Western blot analysis of PD-L1 in ovarian cancer cells. (c) Western blot analysis
SUPPLEMENTARY INFORMATION
 DOI: 10.1038/ncb2988 Supplementary Figure 1 Kif7 L130P encodes a stable protein that does not localize to cilia tips. (a) Immunoblot with KIF7 antibody in cell lysates of wild-type, Kif7 L130P and Kif7
a 10 4 Link et al. Supplementary Figure 1 Nature Immunology: doi: /ni.1842 Cells per mouse ( 10 5 ) TRPV2KO anti-gr1 anti-gr anti-f4/80
 TRPV2KO anti-gr1 anti-gr anti-f4/80") a 10 4 WT 10 4 TRPV2KO 10 3 10 3 anti-gr1 10 2 10 1 anti-gr1 10 2 10 1 10 0 10 0 10 1 10 2 10 3 10 4 anti-f4/80 42.3 45.2 10 0 10 0 10 1 10 2 10 3 10 4 anti-f4/80 10 4 10 4 40 42.5 anti-cd11b 10 3 10 2
a 10 4 WT 10 4 TRPV2KO 10 3 10 3 anti-gr1 10 2 10 1 anti-gr1 10 2 10 1 10 0 10 0 10 1 10 2 10 3 10 4 anti-f4/80 42.3 45.2 10 0 10 0 10 1 10 2 10 3 10 4 anti-f4/80 10 4 10 4 40 42.5 anti-cd11b 10 3 10 2
Supplementary. presence of the. (c) mrna expression. Error. in naive or
 mrna expression. Error. in naive or") Figure 1. (a) Naive CD4 + T cells were activated in the presence of the indicated cytokines for 3 days. Enpp2 mrna expression was measured by qrt-pcrhr, infected with (b, c) Naive CD4 + T cells were activated
Figure 1. (a) Naive CD4 + T cells were activated in the presence of the indicated cytokines for 3 days. Enpp2 mrna expression was measured by qrt-pcrhr, infected with (b, c) Naive CD4 + T cells were activated
Live cell imaging of trafficking of the chaperone complex vaccine to the ER. BMDCs were incubated with ER-Tracker Red (1 M) in staining solution for
 in staining solution for") Live cell imaging of trafficking of the chaperone complex vaccine to the ER. BMDCs were incubated with ER-Tracker Red (1 M) in staining solution for 15 min at 37 C and replaced with fresh complete medium.
Live cell imaging of trafficking of the chaperone complex vaccine to the ER. BMDCs were incubated with ER-Tracker Red (1 M) in staining solution for 15 min at 37 C and replaced with fresh complete medium.
Trim29 gene-targeting strategy. (a) Genotyping of wildtype mice (+/+), Trim29 heterozygous mice (+/ ) and homozygous mice ( / ).
 Genotyping of wildtype mice (+/+), Trim29 heterozygous mice (+/ ) and homozygous mice ( / ).") Supplementary Figure 1 Trim29 gene-targeting strategy. (a) Genotyping of wildtype mice (+/+), Trim29 heterozygous mice (+/ ) and homozygous mice ( / ). (b) Immunoblot analysis of TRIM29 in lung primary
Supplementary Figure 1 Trim29 gene-targeting strategy. (a) Genotyping of wildtype mice (+/+), Trim29 heterozygous mice (+/ ) and homozygous mice ( / ). (b) Immunoblot analysis of TRIM29 in lung primary
T H E J O U R N A L O F C E L L B I O L O G Y
 T H E J O U R N A L O F C E L L B I O L O G Y Supplemental material Krenn et al., http://www.jcb.org/cgi/content/full/jcb.201110013/dc1 Figure S1. Levels of expressed proteins and demonstration that C-terminal
Peli1 negatively regulates T-cell activation and prevents autoimmunity
 Peli1 negatively regulates T-cell activation and prevents autoimmunity Mikyoung Chang 1,*, Wei Jin 1,5,*, Jae-Hoon Chang 1, Yi-chuan Xiao 1, George Brittain 1, Jiayi Yu 1, Xiaofei Zhou 1, Yi-Hong Wang
c Ischemia (30 min) Reperfusion (8 w) Supplementary Figure bp 300 bp Ischemia (30 min) Reperfusion (4 h) Dox 20 mg/kg i.p.
 Reperfusion (8 w) Supplementary Figure bp 300 bp Ischemia (30 min) Reperfusion (4 h) Dox 20 mg/kg i.p.") a Marker Ripk3 +/ 5 bp 3 bp b Ischemia (3 min) Reperfusion (4 h) d 2 mg/kg i.p. 1 w 5 w Sacrifice for IF size A subset for echocardiography and morphological analysis c Ischemia (3 min) Reperfusion (8
a Marker Ripk3 +/ 5 bp 3 bp b Ischemia (3 min) Reperfusion (4 h) d 2 mg/kg i.p. 1 w 5 w Sacrifice for IF size A subset for echocardiography and morphological analysis c Ischemia (3 min) Reperfusion (8
Supplementary Information. Tissue-wide immunity against Leishmania. through collective production of nitric oxide
 Supplementary Information Tissue-wide immunity against Leishmania through collective production of nitric oxide Romain Olekhnovitch, Bernhard Ryffel, Andreas J. Müller and Philippe Bousso Supplementary
SUPPLEMENTARY INFORMATION
 Supplementary Figures Supplementary Figure S1. Binding of full-length OGT and deletion mutants to PIP strips (Echelon Biosciences). Supplementary Figure S2. Binding of the OGT (919-1036) fragments with
SUPPLEMENTARY INFORMATION
 Supplementary Table 1. Cell sphingolipids and S1P bound to endogenous TRAF2. Sphingolipid Cell pmol/mg TRAF2 immunoprecipitate pmol/mg Sphingomyelin 4200 ± 250 Not detected Monohexosylceramide 311 ± 18
Supplementary Figure 1. Characterization of basophils after reconstitution of SCID mice
 Supplementary figure legends Supplementary Figure 1. Characterization of after reconstitution of SCID mice with CD4 + CD62L + T cells. (A-C) SCID mice (n = 6 / group) were reconstituted with 2 x 1 6 CD4
Structure and Function of Antigen Recognition Molecules
 MICR2209 Structure and Function of Antigen Recognition Molecules Dr Allison Imrie allison.imrie@uwa.edu.au 1 Synopsis: In this lecture we will examine the major receptors used by cells of the innate and
S1a S1b S1c. S1d. S1f S1g S1h SUPPLEMENTARY FIGURE 1. - si sc Il17rd Il17ra bp. rig/s IL-17RD (ng) -100 IL-17RD
 -100 IL-17RD") SUPPLEMENTARY FIGURE 1 0 20 50 80 100 IL-17RD (ng) S1a S1b S1c IL-17RD β-actin kda S1d - si sc Il17rd Il17ra rig/s15-574 - 458-361 bp S1f S1g S1h S1i S1j Supplementary Figure 1. Knockdown of IL-17RD enhances
SUPPLEMENTARY FIGURE 1 0 20 50 80 100 IL-17RD (ng) S1a S1b S1c IL-17RD β-actin kda S1d - si sc Il17rd Il17ra rig/s15-574 - 458-361 bp S1f S1g S1h S1i S1j Supplementary Figure 1. Knockdown of IL-17RD enhances
Supplementary Figure 1. Successful excision of genes from WBM lysates and
 Supplementary Information: Supplementary Figure 1. Successful excision of genes from WBM lysates and survival of mice with different genotypes. (a) The proper excision of Pten, p110α, p110α and p110δ was
SUPPLEMENTARY INFORMATION. Supplementary Figures S1-S9. Supplementary Methods
 SUPPLEMENTARY INFORMATION SUMO1 modification of PTEN regulates tumorigenesis by controlling its association with the plasma membrane Jian Huang 1,2#, Jie Yan 1,2#, Jian Zhang 3#, Shiguo Zhu 1, Yanli Wang
% of live splenocytes. STAT5 deletion. (open shapes) % ROSA + % floxed
 % ROSA + % floxed") Supp. Figure 1. a 14 1 1 8 6 spleen cells (x1 6 ) 16 % of live splenocytes 5 4 3 1 % of live splenocytes 8 6 4 b 1 1 c % of CD11c + splenocytes (closed shapes) 8 6 4 8 6 4 % ROSA + (open shapes) % floxed
Supp. Figure 1. a 14 1 1 8 6 spleen cells (x1 6 ) 16 % of live splenocytes 5 4 3 1 % of live splenocytes 8 6 4 b 1 1 c % of CD11c + splenocytes (closed shapes) 8 6 4 8 6 4 % ROSA + (open shapes) % floxed
Supplementary Figure S1. PTPN2 levels are not altered in proliferating CD8+ T cells. Lymph node (LN) CD8+ T cells from C57BL/6 mice were stained with
 CD8+ T cells from C57BL/6 mice were stained with") Supplementary Figure S1. PTPN2 levels are not altered in proliferating CD8+ T cells. Lymph node (LN) CD8+ T cells from C57BL/6 mice were stained with CFSE and stimulated with plate-bound α-cd3ε (10µg/ml)
Supplementary Figure S1. PTPN2 levels are not altered in proliferating CD8+ T cells. Lymph node (LN) CD8+ T cells from C57BL/6 mice were stained with CFSE and stimulated with plate-bound α-cd3ε (10µg/ml)
Supplementary Figures for TSC1 controls macrophage polarization to prevent inflammatory disorder by Linnan Zhu et al
 Supplementary Figures for TSC1 controls macrophage polarization to prevent inflammatory disorder by Linnan Zhu et al Suppl. Fig. 1 Tissue DN C Proteins kd TSC1-17 TSC 1 loxp bp -48-285 ctin PEMs Neutrophils
SUPPLEMENTARY INFORMATION
 DOI:.38/ncb2822 a MTC02 FAO cells EEA1 b +/+ MEFs /DAPI -/- MEFs /DAPI -/- MEFs //DAPI c HEK 293 cells WCE N M C P AKT TBC1D7 Lamin A/C EEA1 VDAC d HeLa cells WCE N M C P AKT Lamin A/C EEA1 VDAC Figure
Figure S1. Reduction in glomerular mir-146a levels correlate with progression to higher albuminuria in diabetic patients.
 Supplementary Materials Supplementary Figures Figure S1. Reduction in glomerular mir-146a levels correlate with progression to higher albuminuria in diabetic patients. Figure S2. Expression level of podocyte
Supplementary Figure 1. Efficiency of Mll4 deletion and its effect on T cell populations in the periphery. Nature Immunology: doi: /ni.
 Supplementary Figure 1 Efficiency of Mll4 deletion and its effect on T cell populations in the periphery. Expression of Mll4 floxed alleles (16-19) in naive CD4 + T cells isolated from lymph nodes and
Supplementary Figure S1 Supplementary Figure S2
 Supplementary Figure S A) The blots shown in Figure B were qualified by using Gel-Pro analyzer software (Rockville, MD, USA). The ratio of LC3II/LC3I to actin was then calculated. The data are represented
Page 39 of 44. 8h LTA & AT h PepG & AT h LTA
 Page 39 of 44 Fig. S1 A: B: C: D: 8h LTA 8h LTA & AT7519 E: F: 8h PepG G: 8h PepG & AT7519 Fig. S1. AT7519 overrides the survival effects of lipoteichoic acid (LTA) and peptidoglycan (PepG). (A) Human
Title of file for HTML: Supplementary Information Description: Supplementary Figures and Supplementary Table
 Title of file for HTML: Supplementary Information Description: Supplementary Figures and Supplementary Table Title of file for HTML: Peer Review File Description: Innate Scavenger Receptor-A regulates
Supplementary information to: Mechanism of lipopolysaccharide-induced skin edema formation in the mouse
 Supplementary information to: Mechanism of lipopolysaccharide-induced skin edema formation in the mouse Ivan Zanoni*, Renato Ostuni*, Simona Barresi, Marco Di Gioia, Achille Broggi, Barbara Costa, Roberta
Supplementary Figure 1. mrna expression of chitinase and chitinase-like protein in splenic immune cells. Each splenic immune cell population was
 Supplementary Figure 1. mrna expression of chitinase and chitinase-like protein in splenic immune cells. Each splenic immune cell population was sorted by FACS. Surface markers for sorting were CD11c +
SUPPLEMENTARY INFORMATION
 DOI: 10.1038/ncb2566 Figure S1 CDKL5 protein expression pattern and localization in mouse brain. (a) Multiple-tissue western blot from a postnatal day (P) 21 mouse probed with an antibody against CDKL5.
(a) Schematic diagram of the FS mutation of UVRAG in exon 8 containing the highly instable
 Schematic diagram of the FS mutation of UVRAG in exon 8 containing the highly instable") Supplementary Figure 1. Frameshift (FS) mutation in UVRAG. (a) Schematic diagram of the FS mutation of UVRAG in exon 8 containing the highly instable A 10 DNA repeat, generating a premature stop codon
Supplementary Figure 1. Frameshift (FS) mutation in UVRAG. (a) Schematic diagram of the FS mutation of UVRAG in exon 8 containing the highly instable A 10 DNA repeat, generating a premature stop codon
Expanded View Figures
 MO reports PR3 dephosphorylates TZ Xian-o Lv et al xpanded View igures igure V1. PR3 dephosphorylates and inactivates YP/TZ., Overexpression of tight junction proteins Pals1 () or LIN7 () has no effect
Nature Immunology: doi: /ni Supplementary Figure 1. Cellularity of leukocytes and their progenitors in naive wild-type and Spp1 / mice.
 Supplementary Figure 1 Cellularity of leukocytes and their progenitors in naive wild-type and Spp1 / mice. (a, b) Gating strategies for differentiated cells including PMN (CD11b + Ly6G hi and CD11b + Ly6G
fig. S1 Gene silencing of LC3B by sirna enhances IL-1β secretion. Peritoneal
 15 Scramble sirna LC3B sirna IL-1β (pg/ml) 1 5 LC3B (kda) - 18 (LC3B I) - 16 (LC3B II) β-actin - 42 ( _ ) LPS LPS ATP fig. S1 Gene silencing of LC3B by sirna enhances IL-1β secretion. Peritoneal macrophages
William C. Comb, Jessica E. Hutti, Patricia Cogswell, Lewis C. Cantley, and Albert S. Baldwin
 Molecular Cell, Volume 45 Supplemental Information p85 SH2 Domain Phosphorylation by IKK Promotes Feedback Inhibition of PI3K and Akt in Response to Cellular Starvation William C. Comb, Jessica E. Hutti,
SUPPLEMENTARY FIGURES AND TABLE
 SUPPLEMENTARY FIGURES AND TABLE Supplementary Figure S1: Characterization of IRE1α mutants. A. U87-LUC cells were transduced with the lentiviral vector containing the GFP sequence (U87-LUC Tet-ON GFP).
Supplementary Figure 1. Generation of knockin mice expressing L-selectinN138G. (a) Schematics of the Sellg allele (top), the targeting vector, the
 Schematics of the Sellg allele (top), the targeting vector, the") Supplementary Figure 1. Generation of knockin mice expressing L-selectinN138G. (a) Schematics of the Sellg allele (top), the targeting vector, the targeted allele in ES cells, and the mutant allele in
Supplementary Figure 1. Generation of knockin mice expressing L-selectinN138G. (a) Schematics of the Sellg allele (top), the targeting vector, the targeted allele in ES cells, and the mutant allele in
B220 CD4 CD8. Figure 1. Confocal Image of Sensitized HLN. Representative image of a sensitized HLN
 B220 CD4 CD8 Natarajan et al., unpublished data Figure 1. Confocal Image of Sensitized HLN. Representative image of a sensitized HLN showing B cell follicles and T cell areas. 20 µm thick. Image of magnification
Supplementary Information
 Supplementary Information mediates STAT3 activation at retromer-positive structures to promote colitis and colitis-associated carcinogenesis Zhang et al. a b d e g h Rel. Luc. Act. Rel. mrna Rel. mrna
Nature Immunology: doi: /ni eee Supplementary Figure 1
 eee Supplementary Figure 1 Hyphae induce NET release, but yeast do not. (a) NET release by human peripheral neutrophils stimulated with a hgc1 yeast-locked C. albicans mutant (yeast) or pre-formed WT C.
Supplements. Figure S1. B Phalloidin Alexa488
 Supplements A, DMSO, PP2, PP3 Crk-myc Figure S1. (A) Src kinase activity is necessary for recruitment of Crk to Nephrin cytoplasmic domain. Human podocytes expressing /7-NephrinCD () were treated with
Control GST GST-RAP. α2-mg. 170 kda. b-actin. 42 kda LRP-1
 % of max Supplementary Figure 1 Control GST GST-RP 17 kda α2-mg 42 kda b-actin Gate: CD11c+ (DCs) Gate: F4/8+ (Mfs) IgG Cd11cCre + Lrp1 fl/fl LRP-1 Supplementary figure 1. () MDCs were pretreated with
Supplementary Table 1. Metabolic parameters in GFP and OGT-treated mice
 Supplementary Table 1. Metabolic parameters in GFP and OGT-treated mice Fasted Refed GFP OGT GFP OGT Liver G6P (mmol/g) 0.03±0.01 0.04±0.02 0.60±0.04 0.42±0.10 A TGs (mg/g of liver) 20.08±5.17 16.29±0.8
Nature Medicine: doi: /nm.3922
 Title: Glucocorticoid-induced tumor necrosis factor receptor-related protein co-stimulation facilitates tumor regression by inducing IL-9-producing helper T cells Authors: Il-Kyu Kim, Byung-Seok Kim, Choong-Hyun
Supplemental Figure 1
 Supplemental Figure 1 1a 1c PD-1 MFI fold change 6 5 4 3 2 1 IL-1α IL-2 IL-4 IL-6 IL-1 IL-12 IL-13 IL-15 IL-17 IL-18 IL-21 IL-23 IFN-α Mut Human PD-1 promoter SBE-D 5 -GTCTG- -1.2kb SBE-P -CAGAC- -1.kb
Supplementary Material
 Supplementary Material accompanying the manuscript Interleukin 37 is a fundamental inhibitor of innate immunity Marcel F Nold, Claudia A Nold-Petry, Jarod A Zepp, Brent E Palmer, Philip Bufler & Charles
SUPPLEMENTARY INFORMATION
 doi: 10.1038/nature05732 SUPPLEMENTARY INFORMATION Supplemental Data Supplement Figure Legends Figure S1. RIG-I 2CARD undergo robust ubiquitination a, (top) At 48 h posttransfection with a GST, GST-RIG-I-2CARD
A. List of selected proteins with high SILAC (H/L) ratios identified in mass
 ratios identified in mass") Supplementary material Figure S1. Interaction between UBL5 and FANCI A. List of selected proteins with high SILAC (H/L) ratios identified in mass spectrometry (MS)-based analysis of UBL5-interacting proteins,
Supplementary material Figure S1. Interaction between UBL5 and FANCI A. List of selected proteins with high SILAC (H/L) ratios identified in mass spectrometry (MS)-based analysis of UBL5-interacting proteins,
Figure S1. (A) SDS-PAGE separation of GST-fusion proteins purified from E.coli BL21 strain is shown. An equal amount of GST-tag control, LRRK2 LRR
 SDS-PAGE separation of GST-fusion proteins purified from E.coli BL21 strain is shown. An equal amount of GST-tag control, LRRK2 LRR") Figure S1. (A) SDS-PAGE separation of GST-fusion proteins purified from E.coli BL21 strain is shown. An equal amount of GST-tag control, LRRK2 LRR and LRRK2 WD40 GST fusion proteins (5 µg) were loaded
Figure S1. (A) SDS-PAGE separation of GST-fusion proteins purified from E.coli BL21 strain is shown. An equal amount of GST-tag control, LRRK2 LRR and LRRK2 WD40 GST fusion proteins (5 µg) were loaded
Supplementary Figure 1. Confocal immunofluorescence showing mitochondrial translocation of Drp1. Cardiomyocytes treated with H 2 O 2 were prestained
 Supplementary Figure 1. Confocal immunofluorescence showing mitochondrial translocation of Drp1. Cardiomyocytes treated with H 2 O 2 were prestained with MitoTracker (red), then were immunostained with
A Yersinia-Secreted Effector Protein Promotes Virulence by Preventing Inflammasome Recognition of the Type III Secretion System
 Cell Host & Microbe, Volume 7 Supplemental Information A Yersinia-Secreted Effector Protein Promotes Virulence by Preventing Inflammasome Recognition of the Type III Secretion System Igor E. Brodsky, Noah
Supplement Figure S1. Real Time PCR analysis of mrna levels of C/EBPα and PU.1 in wild type (WT) and NQO1-null (NQO1-/-) mice.
 and NQO1-null (NQO1-/-) mice.") competes with 20S proteasome for binding with C/EBP leading to its stabilization and Relative mrna levels Supplement Figure S1. Real Time PCR analysis of mrna levels of C/EBPα and PU.1 in wild type (WT)
competes with 20S proteasome for binding with C/EBP leading to its stabilization and Relative mrna levels Supplement Figure S1. Real Time PCR analysis of mrna levels of C/EBPα and PU.1 in wild type (WT)
(A) RT-PCR for components of the Shh/Gli pathway in normal fetus cell (MRC-5) and a
 RT-PCR for components of the Shh/Gli pathway in normal fetus cell (MRC-5) and a") Supplementary figure legends Supplementary Figure 1. Expression of Shh signaling components in a panel of gastric cancer. (A) RT-PCR for components of the Shh/Gli pathway in normal fetus cell (MRC-5) and
Supplementary figure legends Supplementary Figure 1. Expression of Shh signaling components in a panel of gastric cancer. (A) RT-PCR for components of the Shh/Gli pathway in normal fetus cell (MRC-5) and
Crucial role for human Toll-like receptor 4 in the development of contact allergy to nickel
 Supplementary Figures 1-8 Crucial role for human Toll-like receptor 4 in the development of contact allergy to nickel Marc Schmidt 1,2, Badrinarayanan Raghavan 1,2, Verena Müller 1,2, Thomas Vogl 3, György
SUPPLEMENTARY FIGURES
 SUPPLEMENTARY FIGURES Supplementary Figure 1. (A) Left, western blot analysis of ISGylated proteins in Jurkat T cells treated with 1000U ml -1 IFN for 16h (IFN) or left untreated (CONT); right, western
Integrin CD11b negatively regulates TLR-triggered inflammatory responses by. activating Syk and promoting MyD88 and TRIF degradation via cbl-b
 Integrin CD11b negatively regulates TLR-triggered inflammatory responses by activating Syk and promoting MyD88 and TRIF degradation via cbl-b Chaofeng Han, Jing Jin, Sheng Xu, Haibo Liu, Nan Li, and Xuetao
Supporting Information Table of Contents
 Supporting Information Table of Contents Supporting Information Figure 1 Page 2 Supporting Information Figure 2 Page 4 Supporting Information Figure 3 Page 5 Supporting Information Figure 4 Page 6 Supporting
Supplementary Figure 1. Antibiotic partially rescues mice from sepsis. (ab) BALB/c mice under CLP were treated with antibiotic or PBS.
 BALB/c mice under CLP were treated with antibiotic or PBS.") 1 Supplementary Figure 1. Antibiotic partially rescues mice from sepsis. (ab) BALB/c mice under CLP were treated with antibiotic or PBS. (a) Survival curves. WT Sham (n=5), WT CLP or WT CLP antibiotic
1 Supplementary Figure 1. Antibiotic partially rescues mice from sepsis. (ab) BALB/c mice under CLP were treated with antibiotic or PBS. (a) Survival curves. WT Sham (n=5), WT CLP or WT CLP antibiotic
Atg5 flox/flox ; CAG-Cre, 19M brain heart lung. spleen stomach colon. Takamura_Fig. S1
 Takamura_Fig. S1 brain heart lung spleen stomach colon kidney SM Supplemental Figure 1 Histological findings of tg5 flox/flox ;CG-Cre mouse tissues. H&E staining of the brain, heart, lung, spleen, stomach,
SUPPLEMENTARY INFORMATION
 doi:10.1038/nature10962 Supplementary Figure 1. Expression of AvrAC-FLAG in protoplasts. Total protein extracted from protoplasts described in Fig. 1a was subjected to anti-flag immunoblot to detect AvrAC-FLAG
Supplementary Appendix
 Supplementary Appendix This appendix has been provided by the authors to give readers additional information about their work. Supplement to: Choi YL, Soda M, Yamashita Y, et al. EML4-ALK mutations in
Stewart et al. CD36 ligands promote sterile inflammation through assembly of a TLR 4 and 6 heterodimer
 NFκB (fold induction) Stewart et al. ligands promote sterile inflammation through assembly of a TLR 4 and 6 heterodimer a. mrna (fold induction) 5 4 3 2 1 LDL oxldl Gro1a MIP-2 RANTES mrna (fold induction)
SUPPLEMENTARY INFORMATION
 SUPPLEMENTARY INFORMATION doi:10.10/nature10195 NCBI gene: Tagged Subunit(s: HA-Vpx; FLAG-Cul4 HA-DCAF1 FLAG-Cul4 HA-FLAG-Vpx Mock Vpx (SIVmac 100 (a ; 0.159 (b ; 0.05 DCAF1 DDB1 DDA1 Cul4A 1; 0.024591
SUPPLEMENTARY INFORMATION
 doi:10.1038/nature10134 Supplementary Figure 1. Anti-inflammatory activity of sfc. a, Autoantibody immune complexes crosslink activating Fc receptors, promoting activation of macrophages, and WWW.NATURE.COM/NATURE
Schwarz et al. Activity-Dependent Ubiquitination of GluA1 Mediates a Distinct AMPAR Endocytosis
 Schwarz et al Activity-Dependent Ubiquitination of GluA1 Mediates a Distinct AMPAR Endocytosis and Sorting Pathway Supplemental Data Supplemental Fie 1: AMPARs undergo activity-mediated ubiquitination
Supplementary information
 Supplementary information Supplementary Figure S1: Ex[Ca 2+ ]-induced IL-1ß production of monocytes primed with different TLR ligands IL-1ß release of CD14+ monocytes in response to stimulation for 16
T H E J O U R N A L O F C E L L B I O L O G Y
 Supplemental material Chairoungdua et al., http://www.jcb.org/cgi/content/full/jcb.201002049/dc1 T H E J O U R N A L O F C E L L B I O L O G Y Figure S1. Expression of CD9 and CD82 inhibits Wnt/ -catenin
(a) Significant biological processes (upper panel) and disease biomarkers (lower panel)
 Significant biological processes (upper panel) and disease biomarkers (lower panel)") Supplementary Figure 1. Functional enrichment analyses of secretomic proteins. (a) Significant biological processes (upper panel) and disease biomarkers (lower panel) 2 involved by hrab37-mediated secretory
Supplementary Figure 1. Functional enrichment analyses of secretomic proteins. (a) Significant biological processes (upper panel) and disease biomarkers (lower panel) 2 involved by hrab37-mediated secretory
Pro-apoptotic signalling through Toll-like receptor 3 involves TRIF-dependent
 Pro-apoptotic signalling through Toll-like receptor 3 involves TRIF-dependent activation of caspase-8 and is under the control of inhibitor of apoptosis proteins in melanoma cells Arnim Weber, Zofia Kirejczyk,
a b G75 G60 Sw-2 Sw-1 Supplementary Figure 1. Structure predictions by I-TASSER Server.
 a b G75 2 2 G60 Sw-2 Sw-1 Supplementary Figure 1. Structure predictions by I-TASSER Server. a. Overlay of top 10 models generated by I-TASSER illustrates the potential effect of 7 amino acid insertion
ERK1/2/MAPK pathway-dependent regulation of the telomeric factor TRF2
 ERK1/2/MAPK pathway-dependent regulation of the telomeric factor TRF2 SUPPLEMENTARY FIGURES AND TABLE Supplementary Figure S1: Conservation of the D domain throughout evolution. Alignment of TRF2 sequences
Supplementary Materials for
 www.sciencesignaling.org/cgi/content/full/6/283/ra57/dc1 Supplementary Materials for JNK3 Couples the Neuronal Stress Response to Inhibition of Secretory Trafficking Guang Yang,* Xun Zhou, Jingyan Zhu,
Supplemental Information. NRF2 Is a Major Target of ARF. in p53-independent Tumor Suppression
 Molecular Cell, Volume 68 Supplemental Information NRF2 Is a Major Target of ARF in p53-independent Tumor Suppression Delin Chen, Omid Tavana, Bo Chu, Luke Erber, Yue Chen, Richard Baer, and Wei Gu Figure
33VASTVNGATSANNHGEPPS51PADARPR58
 Pro-rich region Trans-membrane region 214 246 359 381 UL50 1 397 211SSRTAS216PPPPPR222 NLS CR1 CR2 CR3 CR4 UL53 1 376 11RERRS15ALRS19LLRKRRR25 33VASTVNGATSANNHGEPPS51PADARPR58 FIG S1. UL97 phosphorylation
Supplementary Figure 1. Dynamic Response of WT and mir-21 -/- mice to caerulein. (a) Representative histological sections of mouse pancreas stained
 Representative histological sections of mouse pancreas stained") Supplementary Figure 1. Dynamic Response of WT and mir-21 -/- mice to caerulein. (a) Representative histological sections of mouse pancreas stained with hematoxylin from caerulein-treated WT and mir-21
Supplementary Figure 1. Dynamic Response of WT and mir-21 -/- mice to caerulein. (a) Representative histological sections of mouse pancreas stained with hematoxylin from caerulein-treated WT and mir-21
Supplementary Figure 1. Double-staining immunofluorescence analysis of invasive colon and breast cancers. Specimens from invasive ductal breast
 Supplementary Figure 1. Double-staining immunofluorescence analysis of invasive colon and breast cancers. Specimens from invasive ductal breast carcinoma (a) and colon adenocarcinoma (b) were staining
Supplementary Figure 1. ETBF activate Stat3 in B6 and Min mice colons
 Supplementary Figure 1 ETBF activate Stat3 in B6 and Min mice colons a pstat3 controls Pos Neg ETBF 1 2 3 4 b pstat1 pstat2 pstat3 pstat4 pstat5 pstat6 Actin Figure Legend: (a) ETBF induce predominantly
SUPPLEMENTARY INFORMATION
 doi: 1.138/nature775 4 O.D. (595-655) 3 1 -ζ no antibody isotype ctrl Plated Soluble 1F6 397 7H11 Supplementary Figure 1 Soluble and plated anti- Abs induce -! signalling. B3Z cells stably expressing!
SUPPLEMENTARY MATERIAL
 SUPPLEMENTARY MATERIAL IL-1 signaling modulates activation of STAT transcription factors to antagonize retinoic acid signaling and control the T H 17 cell it reg cell balance Rajatava Basu 1,5, Sarah K.
Supplementary Figures
 Supplementary Figures Supplementary Fig. 1. Galectin-3 is present within tumors. (A) mrna expression levels of Lgals3 (galectin-3) and Lgals8 (galectin-8) in the four classes of cell lines as determined
Myeloid cell-derived inducible nitric oxide synthase suppresses M1 macrophage polarization
 Received 28 Oct 24 Accepted 7 Feb 25 Published 27 Mar 25 DOI:.38/ncomms7676 OPEN Myeloid cell-derived inducible nitric oxide synthase suppresses M macrophage polarization Geming Lu, Ruihua Zhang, Shuo
CD44
 MR1-5-OP-RU CD24 CD24 CD44 MAIT cells 2.78 11.2 WT RORγt- GFP reporter 1 5 1 4 1 3 2.28 1 5 1 4 1 3 4.8 1.6 8.1 1 5 1 4 1 3 1 5 1 4 1 3 3.7 3.21 8.5 61.7 1 2 1 3 1 4 1 5 TCRβ 2 1 1 3 1 4 1 5 CD44 1 2 GFP
LPS LPS P6 - + Supplementary Fig. 1.
 P6 LPS - - - + + + - LPS + + - - P6 + Supplementary Fig. 1. Pharmacological inhibition of the JAK/STAT blocks LPS-induced HMGB1 nuclear translocation. RAW 267.4 cells were stimulated with LPS in the absence
Supplemental Materials
 Supplemental Materials Programmed death one homolog maintains the pool size of regulatory T cells by promoting their differentiation and stability Qi Wang 1, Jianwei He 1, Dallas B. Flies 2, Liqun Luo