Supplementary Figure 1
|
|
|
- Wilfrid Fitzgerald
- 5 years ago
- Views:
Transcription
 Tamoxifen (TAM; 100 μg per gram bodyweight) and analyzed 4 weeks later.")
1 Supplementary Figure 1 Genetic labeling of microglia Male and female 2-3 month-old CreERT2;R26-tdTomato mice or CreERT2;R26-tdTomato;Iba1-eGFP transgenic mice were treated with 1x, 2x (48 h apart), or 5x (each 24 h apart) Tamoxifen (TAM; 100 μg per gram bodyweight) and analyzed 4 weeks later. One hemisphere was used for flow cytometry (only the neocortex was used, see methods for details), the second hemisphere was used for histology. (a) Exemplary gating strategy of an animal injected with 2xTAM. Cells were gated based on forward (FSC) and backward scatter (BSC). FSC-width and height was used to determine single cells. 1.55% of single cells were tdtomato positive, of which the vast majority (approximately 97%) were microglia, identified as the CD11b high and CD45 low cell population by flow cytometry. tdtomato-positive microglia were not distinguishable from tdtomato-negative microglia in size and granularity, as indicated by their similar position in the FSC/BSC blot (tdtomato-positive cells colour-coded in green) and were distributed across the microglial population based on CD11b and CD45 intensity. (b) Flow cytometric analysis of the neocortex revealed a dose-dependent increase in the induction of tdtomato-positive cells, of which the vast majority were microglia (n=3, 4, 3 mice per group, for 1x, 2x, and 5x TAM, respectively). (c) Histological analysis of tdtomato-positive microglia (arrows) revealed an apparent random distribution throughout the neocortex (shown in the frontal cortex). Morphologically, tdtomato-labeled microglial cells revealed all aspects of mature microglia (insert). Scale bars 100 µm and 10 µm for the insert. Some perivascular macrophages also showed recombination, but were clearly distinguishable from microglia due to their elongated shape and lack of processes. (d) The total number of tdtomato-positive cells per neocortex was estimated and related to the total number of Iba-1-positive microglia in the neocortex (the latter was assessed in Supplementary Figure 4 and the mean number of 880,000 was used for the calculation). In accordance with the flow cytometry analysis, a dose-dependent and comparable increase was found (n=3, 4, 3 mice per group, for 1x, 2x, and 5x TAM, respectively).
 of a triple-transgenic CD11b-CreERT2;R26-tdTomato;Iba1-eGFP mouse after an imaging period of 24 weeks (6 months). Scale bar is 100 µm.")
2 Supplementary Figure 2 Long-term repetitive in vivo imaging does not cause microglial activation (a) There was no noticeable activation of microglial cells in any of the in vivo imaged areas. Shown are in vivo images (z-projections of imaged volumes) of a triple-transgenic CD11b-CreERT2;R26-tdTomato;Iba1-eGFP mouse after an imaging period of 24 weeks (6 months). Scale bar is 100 µm. (b, c) Consistently, postmortem immunohistochemical analysis of the triple-transgenic CD11b-CreERT2;R26-tdTomato;Iba1-eGFP animals after the 24 week-imaging period using an Iba1-antibody did not reveal any signs of microglial activation, regardless of whether the cortical tissue was cut horizontally (b) or coronally (c), when compared to a nonimaged control animal of the same age. Blue area indicates the location of the cranial window. Three imaged and three control mice were analysed. Scale bars are 100 µm and 20 µm for the insert.

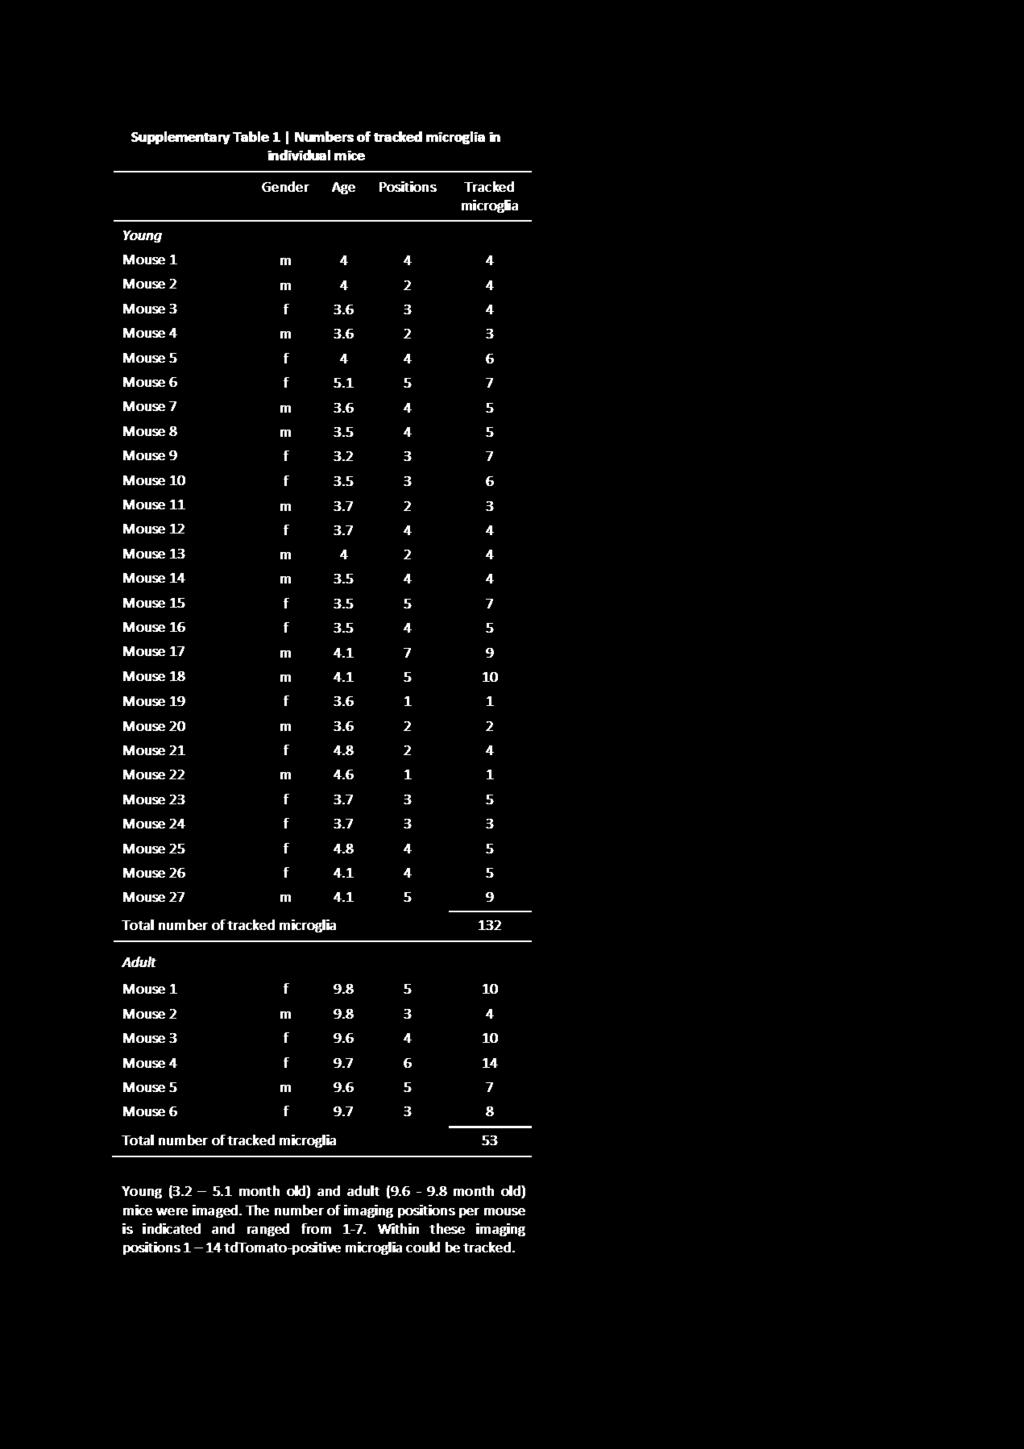
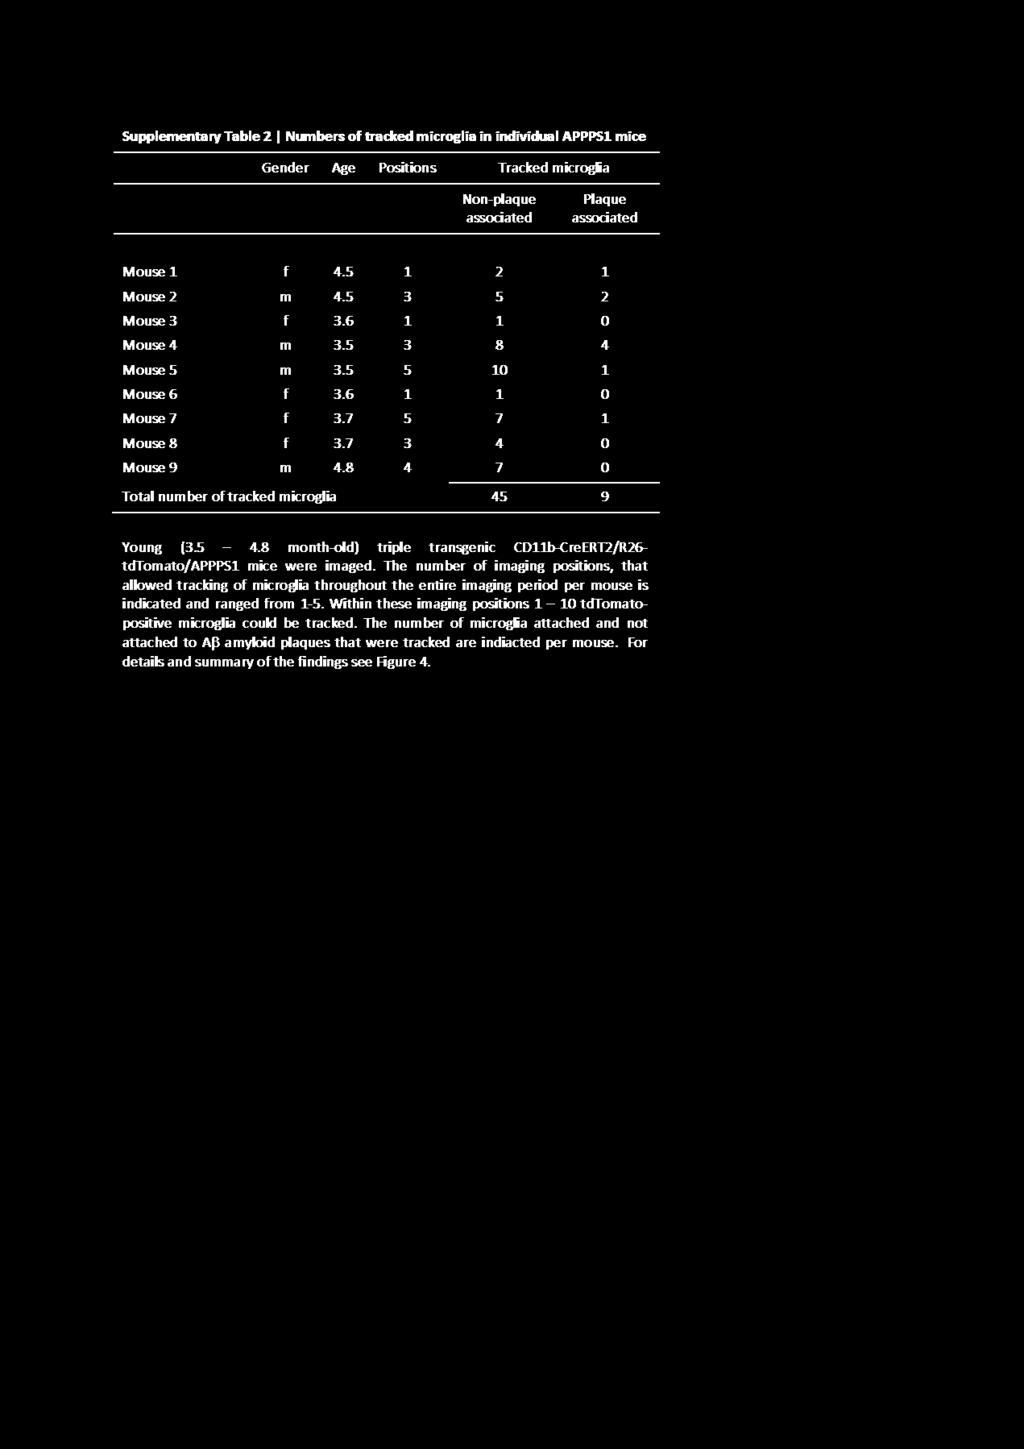
3 Supplementary Figure 3 Daily imaging of neocortical microglial cells rules out rapid cell turnover To study potential rapid replacement of microglial cells that would have been unrecognized in our long-term biweekly imaging protocol (see Fig. 1 and 2), three CD11b-CreERT2;R26-tdTomato;Iba1-eGFP mice (13 months of age; one male, two females) and two CD11b-CreERT2;R26-tdTomato mice (13 months of age; two males) were imaged daily for 10 consecutive days. (a, b) Shown are z-projections of imaged volumes of CD11b-CreERT2;R26-tdTomato;Iba1-eGFP mice where recombined microglia appeared yellow while surrounding microglia were green. An example of a recombined yellow microglial cell with surrounding green cells that are all stable over the imaging period of ten days is shown in (a). An example with a lost green microglial cell on day 5 is shown in (b). Scale bar is 40 µm. Note that in contrast to the long-term biweekly imaging (Fig. 2), the daily imaging also allowed us to track the Iba1-eGFP positive cells (green) since movement from day-to-day was minimal. (c) Average number of tdtomato-positive and Iba1-eGFP-positive cells tracked per mouse, the number of newly appearing cells (New) and the number of lost cells (Lost) during the imaging period. Given is the mean ± SEM of n=5 mice. The analysis and tracking was done as described for the long-term analysis in Figure 3. Occasionally, additional structures, which were connected to microglial processes, were observed. In two cases, these resembled a cell body in shape and size, but were identified as being formed by distinct microglial processes reminiscent of recently described extruded exophers albeit in C. elegans (Melentijevic, I. et al. C. elegans neurons jettison protein aggregates and mitochondria under neurotoxic stress. Nature 542, , 2017), whereas in three other instances, their composition was ambiguous. Though rapid splitting and consecutive death of the daughter cell in these cases cannot be ruled out, these observations were excluded from the analysis. Moreover, they do not change the lifetime estimate of the microglia.
 mice and CD11b- CreERT2;R26-tdTomato")
4 Supplementary Figure 4 No difference was observed in total microglial numbers or the number of BrdU-labeled microglia in the different mouse lines used in this study To exclude differences in microglial number or microglial proliferation based on BrdU incorporation, 7-monthold C57BL/6J mice, CD11b-CreERT2;R26-tdTomato;Iba1-eGFP (Cre/tdTom/GFP) mice and CD11b- CreERT2;R26-tdTomato (Cre/tdTom) mice of mixed gender were selected (n=5-6 per group). The selected age corresponds to the mid-time of the biweekly imaging period (4 months to 10 months) that was used for quantification in Figure 3. Mice were intraperitoneally injected on five consecutive days with BrdU and then analysed three days later. (a-c) Immunofluorescence double staining for Iba1 (green) and BrdU (red). Scale bar is 50 µm. (d) Quantification of double-labeled (yellow) cells (Iba1/BrdU) in the neocortex revealed no differences in BrdU-labeled microglia among the three groups (Kruskal-Wallis, χ 2 (2) = 2.19, p>0.05); dataset was checked for outliers using Graphpad Prism s ROUT method and an outlier value was excluded from the Cre/tdTom dataset. (e-g) Immunohistochemical staining of the neocortex using an Iba1 antibody for the three genotypes. Scale bar is 100 µm. (h) Stereological analysis of total neocortical microglia revealed no difference in microglial number between C57BL/6J control mice and the double- and triple-transgenic animals used in this study (Kruskal-Wallis, χ 2 (2) = 0.10, p>0.05).
5
6
Supplementary Figure 1. Nature Neuroscience: doi: /nn.4547
 Supplementary Figure 1 Characterization of the Microfetti mouse model. (a) Gating strategy for 8-color flow analysis of peripheral Ly-6C + monocytes from Microfetti mice 5-7 days after TAM treatment. Living
Nature Neuroscience: doi: /nn Supplementary Figure 1
 Supplementary Figure 1 Quantification of myelin fragments in the aging brain (a) Electron microscopy on corpus callosum is shown for a 18-month-old wild type mice. Myelin fragments (arrows) were detected
mm Distance (mm)
") b a Magnet Illumination Coverslips MPs Objective 2575 µm 1875 µm 1575 µm 1075 µm 875 µm 545 µm 20µm 2 3 0.5 0.3mm 1 1000 100 10 1 0.1 1000 100 10 1 0.1 Field Induction (Gauss) 1.5 0 5 10 15 20 Distance
b a Magnet Illumination Coverslips MPs Objective 2575 µm 1875 µm 1575 µm 1075 µm 875 µm 545 µm 20µm 2 3 0.5 0.3mm 1 1000 100 10 1 0.1 1000 100 10 1 0.1 Field Induction (Gauss) 1.5 0 5 10 15 20 Distance
Supplementary Figure 1. Double-staining immunofluorescence analysis of invasive colon and breast cancers. Specimens from invasive ductal breast
 Supplementary Figure 1. Double-staining immunofluorescence analysis of invasive colon and breast cancers. Specimens from invasive ductal breast carcinoma (a) and colon adenocarcinoma (b) were staining
Supplementary information - Table (1), Figures (12), and Videos (5)
, Figures (12), and Videos (5)") Supplementary information - Table (1), Figures (12), and Videos (5) A soft, transparent, freely accessible cranial window for chronic imaging and electrophysiology Chaejeong Heo 1, Hyejin Park 1, 2, Yong-Tae
Supplementary information - Table (1), Figures (12), and Videos (5) A soft, transparent, freely accessible cranial window for chronic imaging and electrophysiology Chaejeong Heo 1, Hyejin Park 1, 2, Yong-Tae
GFP/Iba1/GFAP. Brain. Liver. Kidney. Lung. Hoechst/Iba1/TLR9!
 Supplementary information a +KA Relative expression d! Tlr9 5!! 5! NSC Neuron Astrocyte Microglia! 5! Tlr7!!!! NSC Neuron Astrocyte! GFP/Sβ/! Iba/Hoechst Microglia e Hoechst/Iba/TLR9! GFP/Iba/GFAP f Brain
PHENOTYPIC DYNAMICS OF MICROGLIAL AND MONOCYTE-DERIVED CELLS IN GLIOBLASTOMA-BEARING MICE.
 SUPPLEMENTARY FIGURES, TABLES AND VIDEOS PHENOTYPIC DYNAMICS OF MICROGLIAL AND MONOCYTE-DERIVED CELLS IN GLIOBLASTOMA-BEARING MICE. Clément Ricard 1,2,3,4, Aurélie Tchoghandjian 2,4, Hervé Luche 5, Pierre
Supplementary Figure 1: TSLP receptor skin expression in dcssc. A: Healthy control (HC) skin with TSLP receptor expression in brown (10x
 skin with TSLP receptor expression in brown (10x") Supplementary Figure 1: TSLP receptor skin expression in dcssc. A: Healthy control (HC) skin with TSLP receptor expression in brown (10x magnification). B: Second HC skin stained for TSLP receptor in brown
Supplementary Figure 1: TSLP receptor skin expression in dcssc. A: Healthy control (HC) skin with TSLP receptor expression in brown (10x magnification). B: Second HC skin stained for TSLP receptor in brown
Supplementary Information
 Supplementary Information Title Degeneration and impaired regeneration of gray matter oligodendrocytes in amyotrophic lateral sclerosis Authors Shin H. Kang, Ying Li, Masahiro Fukaya, Ileana Lorenzini,
Nature Neuroscience: doi: /nn Supplementary Figure 1. Large-scale calcium imaging in vivo.
 Supplementary Figure 1 Large-scale calcium imaging in vivo. (a) Schematic illustration of the in vivo camera imaging set-up for large-scale calcium imaging. (b) High-magnification two-photon image from
An unconventional role for mirna: let-7 activates Toll-like receptor 7 and causes neurodegeneration
 An unconventional role for mirna: let-7 activates Toll-like receptor 7 and causes neurodegeneration Sabrina M. Lehmann, Christina Krüger, Boyoun Park, Katja Derkow, Karen Rosenberger, Jan Baumgart, Thorsten
Supplementary Figures
 Supplementary Figures Supplementary Fig. 1. Galectin-3 is present within tumors. (A) mrna expression levels of Lgals3 (galectin-3) and Lgals8 (galectin-8) in the four classes of cell lines as determined
Supplementary Figure 1. ACE robotic platform. A. Overview of the rig setup showing major hardware components of ACE (Automatic single Cell
 2 Supplementary Figure 1. ACE robotic platform. A. Overview of the rig setup showing major hardware components of ACE (Automatic single Cell Experimenter) including the MultiClamp 700B, Digidata 1440A,
Supplementary Materials for. c-abl Activation Plays a Role in α-synucleinopathy Induced Neurodegeneration
 Supplementary Materials for c-abl Activation Plays a Role in α-synucleinopathy Induced Neurodegeneration Saurav Brahmachari, Preston Ge, Su Hyun Lee, Donghoon Kim, Senthilkumar S. Karuppagounder, Manoj
Nature Neuroscience: doi: /nn Supplementary Figure 1
 Supplementary Figure 1 Atlas representations of the midcingulate (MCC) region targeted in this study compared against the anterior cingulate (ACC) region commonly reported. Coronal sections are shown on
a 10 4 Link et al. Supplementary Figure 1 Nature Immunology: doi: /ni.1842 Cells per mouse ( 10 5 ) TRPV2KO anti-gr1 anti-gr anti-f4/80
 TRPV2KO anti-gr1 anti-gr anti-f4/80") a 10 4 WT 10 4 TRPV2KO 10 3 10 3 anti-gr1 10 2 10 1 anti-gr1 10 2 10 1 10 0 10 0 10 1 10 2 10 3 10 4 anti-f4/80 42.3 45.2 10 0 10 0 10 1 10 2 10 3 10 4 anti-f4/80 10 4 10 4 40 42.5 anti-cd11b 10 3 10 2
a 10 4 WT 10 4 TRPV2KO 10 3 10 3 anti-gr1 10 2 10 1 anti-gr1 10 2 10 1 10 0 10 0 10 1 10 2 10 3 10 4 anti-f4/80 42.3 45.2 10 0 10 0 10 1 10 2 10 3 10 4 anti-f4/80 10 4 10 4 40 42.5 anti-cd11b 10 3 10 2
Supplementary Figure 1 IMQ-Induced Mouse Model of Psoriasis. IMQ cream was
 Supplementary Figure 1 IMQ-Induced Mouse Model of Psoriasis. IMQ cream was painted on the shaved back skin of CBL/J and BALB/c mice for consecutive days. (a, b) Phenotypic presentation of mouse back skin
Nature Biotechnology: doi: /nbt Supplementary Figure 1. Analysis of hair bundle morphology in Ush1c c.216g>a mice at P18 by SEM.
 Supplementary Figure 1 Analysis of hair bundle morphology in Ush1c c.216g>a mice at P18 by SEM. (a-c) Heterozygous c.216ga mice displayed normal hair bundle morphology at P18. (d-i) Disorganized hair bundles
Programmed necrosis, not apoptosis, is a key mediator of cell loss and DAMP-mediated inflammation in dsrna-induced retinal degeneration
 Programmed necrosis, not apoptosis, is a key mediator of cell loss and DAMP-mediated inflammation in dsrna-induced retinal degeneration The Harvard community has made this article openly available. Please
SUPPLEMENTARY FIGURES
 SUPPLEMENTARY FIGURES 1 Supplementary Figure 1, Adult hippocampal QNPs and TAPs uniformly express REST a-b) Confocal images of adult hippocampal mouse sections showing GFAP (green), Sox2 (red), and REST
Supplementary Figure S I: Effects of D4F on body weight and serum lipids in apoe -/- mice.
 Supplementary Figures: Supplementary Figure S I: Effects of D4F on body weight and serum lipids in apoe -/- mice. Male apoe -/- mice were fed a high-fat diet for 8 weeks, and given PBS (model group) or
In vivo reprogramming reactive glia into ipscs to produce new neurons in the
 In vivo reprogramming reactive glia into ipscs to produce new neurons in the cortex following traumatic brain injury Xiang Gao 1, Xiaoting Wang 1, Wenhui Xiong 1, Jinhui Chen 1, * 1 Spinal Cord and Brain
ROCK/Cdc42-mediated microglial motility and gliapse formation lead to phagocytosis of degenerating dopaminergic neurons in vivo
 Supplementary Information ROCK/Cdc42-mediated microglial motility and gliapse formation lead to phagocytosis of degenerating dopaminergic neurons in vivo Carlos Barcia* 1,2, Carmen M Ros 1,2, Valentina
Nature Biotechnology: doi: /nbt Supplementary Figure 1
 Supplementary Figure 1 Representative images of an in vitro comparison of several AAV serotypes regarding egfp expression in cochlear explants of CBA/CaJ mice. (A-F): Results after incubation at equal
Supporting Information. Calculation of the relative contributions of myocyte proliferation, stem cell. Supporting Information Fig 1 (page 9)
") Supporting Information Table of contents Calculation of the relative contributions of myocyte proliferation, stem cell differentiation and cardioprotection (page 2) Supporting Information Fig 1 (page 9)
Supporting Information Table of contents Calculation of the relative contributions of myocyte proliferation, stem cell differentiation and cardioprotection (page 2) Supporting Information Fig 1 (page 9)
Supplementary Table 1
 Supplementary Table 1 Flow Cytometry Antibodies Antibody Fluorochrome Clone Vendor CD45 PE-cyanine 7 30-F11 D ioscience CD3 Pacific lue 17A2 iolegend (San Diego, CA) CD11b APC M1/70 iolegend (San Diego,
Supplemental Figures Supplemental Figure 1:
 Supplemental Figures Supplemental Figure 1: Representative FACS data showing Concurrent Brain cell type Acquisition using either Percoll PLUS (top row) or myelin removal beads (bottom two rows). Debris
Nature Neuroscience: doi: /nn Supplementary Figure 1. MADM labeling of thalamic clones.
 Supplementary Figure 1 MADM labeling of thalamic clones. (a) Confocal images of an E12 Nestin-CreERT2;Ai9-tdTomato brain treated with TM at E10 and stained for BLBP (green), a radial glial progenitor-specific
Structural basis for the role of inhibition in facilitating adult brain plasticity
 Structural basis for the role of inhibition in facilitating adult brain plasticity Jerry L. Chen, Walter C. Lin, Jae Won Cha, Peter T. So, Yoshiyuki Kubota & Elly Nedivi SUPPLEMENTARY FIGURES 1-6 a b M
Nature Neuroscience: doi: /nn Supplementary Figure 1. Splenic atrophy and leucopenia caused by T3 SCI.
 Supplementary Figure 1 Splenic atrophy and leucopenia caused by T3 SCI. (a) Gross anatomy of representative spleens from control and T3 SCI mice at 28 days post-injury. (b and c) Hematoxylin and eosin
Supplementary Figure 1. Microglia do not show signs of classical immune activation following MD a-b. Images showing immunoreactivity for MHCII (a)
") 1 Supplementary Figure 1. Microglia do not show signs of classical immune activation following MD a-b. Images showing immunoreactivity for MHCII (a) and CD45 (b) in fixed sections of binocular visual cortex
1 Supplementary Figure 1. Microglia do not show signs of classical immune activation following MD a-b. Images showing immunoreactivity for MHCII (a) and CD45 (b) in fixed sections of binocular visual cortex
SUPPLEMENTARY INFORMATION
 doi:10.1038/nature10188 Supplementary Figure 1. Embryonic epicardial genes are down-regulated from midgestation stages and barely detectable post-natally. Real time qrt-pcr revealed a significant down-regulation
Bezzi et al., Supplementary Figure 1 *** Nature Medicine: doi: /nm Pten pc-/- ;Zbtb7a pc-/- Pten pc-/- ;Pml pc-/- Pten pc-/- ;Trp53 pc-/-
 Gr-1 Gr-1 Gr-1 Bezzi et al., Supplementary Figure 1 a Gr1-CD11b 3 months Spleen T cells 3 months Spleen B cells 3 months Spleen Macrophages 3 months Spleen 15 4 8 6 c CD11b+/Gr1+ cells [%] 1 5 b T cells
Supplementary Figure 1
 Supplementary Figure 1 The average sigmoid parametric curves of capillary dilation time courses and average time to 50% peak capillary diameter dilation computed from individual capillary responses averaged
Zhu et al, page 1. Supplementary Figures
 Zhu et al, page 1 Supplementary Figures Supplementary Figure 1: Visual behavior and avoidance behavioral response in EPM trials. (a) Measures of visual behavior that performed the light avoidance behavior
Disrupting GluA2-GAPDH Interaction Affects Axon and Dendrite Development
 Disrupting GluA2-GAPDH Interaction Affects Axon and Dendrite Development 1 Frankie Hang Fung Lee, 1 Ping Su, 1 Yu Feng Xie, 1 Kyle Ethan Wang, 2 Qi Wan and 1,3 Fang Liu 1 Campbell Research Institute, Centre
Nature Neuroscience: doi: /nn Supplementary Figure 1. Distribution of starter cells for RV-mediated retrograde tracing.
 Supplementary Figure 1 Distribution of starter cells for RV-mediated retrograde tracing. Parcellation of cortical areas is based on Allen Mouse Brain Atlas and drawn to scale. Thick white curves, outlines
File name: Supplementary Information Description: Supplementary Figures, Supplementary Table and Supplementary References
 File name: Supplementary Information Description: Supplementary Figures, Supplementary Table and Supplementary References File name: Supplementary Data 1 Description: Summary datasheets showing the spatial
SUPPLEMENTARY INFORMATION
 1. Supplementary Figures and Legends Supplementary Fig. 1. S1P-mediated transcriptional regulation of integrins expressed in OP/monocytoid cells. Real-time quantitative PCR analyses of mrna for two integrins,
SUPPLEMENTARY INFORMATION
 doi:1.138/nature1554 a TNF-α + in CD4 + cells [%] 1 GF SPF 6 b IL-1 + in CD4 + cells [%] 5 4 3 2 1 Supplementary Figure 1. Effect of microbiota on cytokine profiles of T cells in GALT. Frequencies of TNF-α
Supplementary Figure 1. BMS enhances human T cell activation in vitro in a
 Supplementary Figure 1. BMS98662 enhances human T cell activation in vitro in a concentration-dependent manner. Jurkat T cells were activated with anti-cd3 and anti-cd28 antibody in the presence of titrated
Supplementary Figure 1. EC-specific Deletion of Snail1 Does Not Affect EC Apoptosis. (a,b) Cryo-sections of WT (a) and Snail1 LOF (b) embryos at
 Cryo-sections of WT (a) and Snail1 LOF (b) embryos at") Supplementary Figure 1. EC-specific Deletion of Snail1 Does Not Affect EC Apoptosis. (a,b) Cryo-sections of WT (a) and Snail1 LOF (b) embryos at E10.5 were double-stained for TUNEL (red) and PECAM-1 (green).
Supplementary Figure 1. EC-specific Deletion of Snail1 Does Not Affect EC Apoptosis. (a,b) Cryo-sections of WT (a) and Snail1 LOF (b) embryos at E10.5 were double-stained for TUNEL (red) and PECAM-1 (green).
Supplementary Materials for
 www.sciencetranslationalmedicine.org/cgi/content/full/4/117/117ra8/dc1 Supplementary Materials for Notch4 Normalization Reduces Blood Vessel Size in Arteriovenous Malformations Patrick A. Murphy, Tyson
Serafino et al. Thymosin α1 activates complement receptor-mediated phagocytosis in human monocyte-derived macrophages. SUPPLEMENTARY FIGURES
 Supplementary Fig. S1. Evaluation of the purity and maturation of macrophage cultures tested by flow cytometry. The lymphocytic/monocytic cellular fraction was isolated from buffy coats of healthy donors
Postn MCM Smad2 fl/fl Postn MCM Smad3 fl/fl Postn MCM Smad2/3 fl/fl. Postn MCM. Tgfbr1/2 fl/fl TAC
 A Smad2 fl/fl Smad3 fl/fl Smad2/3 fl/fl Tgfbr1/2 fl/fl 1. mm B Tcf21 MCM Tcf21 MCM Smad3 fl/fl Tcf21 MCM Smad2/3 fl/fl Tcf21 MCM Tgfbr1/2 fl/fl αmhc MCM C 1. mm 1. mm D Smad2 fl/fl Smad3 fl/fl Smad2/3
marker. DAPI labels nuclei. Flies were 20 days old. Scale bar is 5 µm. Ctrl is
 Supplementary Figure 1. (a) Nos is detected in glial cells in both control and GFAP R79H transgenic flies (arrows), but not in deletion mutant Nos Δ15 animals. Repo is a glial cell marker. DAPI labels
Supplementary Figure 1. Characterization of basophils after reconstitution of SCID mice
 Supplementary figure legends Supplementary Figure 1. Characterization of after reconstitution of SCID mice with CD4 + CD62L + T cells. (A-C) SCID mice (n = 6 / group) were reconstituted with 2 x 1 6 CD4
Supplementary Figure S1: Tanycytes are restricted to the central/posterior hypothalamus
 Supplementary Figure S1: Tanycytes are restricted to the central/posterior hypothalamus a: Expression of Vimentin, GFAP, Sox2 and Nestin in anterior, central and posterior hypothalamus. In the anterior
Type of file: PDF Title of file for HTML: Supplementary Information Description: Supplementary Figures
 Type of file: PDF Title of file for HTML: Supplementary Information Description: Supplementary Figures Type of file: MOV Title of file for HTML: Supplementary Movie 1 Description: NLRP3 is moving along
Pearson r = P (one-tailed) = n = 9
 = n = 9") 8F4-Specific Lysis, % 1 UPN1 UPN3 8 UPN7 6 Pearson r =.69 UPN2 UPN5 P (one-tailed) =.192 4 UPN8 n = 9 2 UPN9 UPN4 UPN6 5 1 15 2 25 8 8F4, % Max MFI Supplementary Figure S1. AML samples UPN1-UPN9 show variable
8F4-Specific Lysis, % 1 UPN1 UPN3 8 UPN7 6 Pearson r =.69 UPN2 UPN5 P (one-tailed) =.192 4 UPN8 n = 9 2 UPN9 UPN4 UPN6 5 1 15 2 25 8 8F4, % Max MFI Supplementary Figure S1. AML samples UPN1-UPN9 show variable
SUPPLEMENTARY INFORMATION
 SUPPLEMENTARY INFORMATION doi:10.1038/nature11306 Supplementary Figures Supplementary Figure 1. Basic characterization of GFP+ RGLs in the dentate gyrus of adult nestin-gfp mice. a, Sample confocal images
a) Primary cultures derived from the pancreas of an 11-week-old Pdx1-Cre; K-MADM-p53
 Primary cultures derived from the pancreas of an 11-week-old Pdx1-Cre; K-MADM-p53") 1 2 3 4 5 6 7 8 9 10 Supplementary Figure 1. Induction of p53 LOH by MADM. a) Primary cultures derived from the pancreas of an 11-week-old Pdx1-Cre; K-MADM-p53 mouse revealed increased p53 KO/KO (green,
1 2 3 4 5 6 7 8 9 10 Supplementary Figure 1. Induction of p53 LOH by MADM. a) Primary cultures derived from the pancreas of an 11-week-old Pdx1-Cre; K-MADM-p53 mouse revealed increased p53 KO/KO (green,
SHREE ET AL, SUPPLEMENTAL MATERIALS. (A) Workflow for tumor cell line derivation and orthotopic implantation.
 Workflow for tumor cell line derivation and orthotopic implantation.") SHREE ET AL, SUPPLEMENTAL MATERIALS SUPPLEMENTAL FIGURE AND TABLE LEGENDS Supplemental Figure 1. Derivation and characterization of TS1-TGL and TS2-TGL PyMT cell lines and development of an orthotopic
SHREE ET AL, SUPPLEMENTAL MATERIALS SUPPLEMENTAL FIGURE AND TABLE LEGENDS Supplemental Figure 1. Derivation and characterization of TS1-TGL and TS2-TGL PyMT cell lines and development of an orthotopic
SUPPLEMENTARY INFORMATION
 DOI: 10.1038/ncb2697 Figure S1 Cytokeratin 5 is a specific marker for basal and intermediate cells in all mouse prostate lobes. (a) Immunofluorescence staining showing co-localization of YFP with p63 in
Supplementary Figure 1
 Supplementary Figure 1 AAV-GFP injection in the MEC of the mouse brain C57Bl/6 mice at 4 months of age were injected with AAV-GFP into the MEC and sacrificed at 7 days post injection (dpi). (a) Brains
fl/+ KRas;Atg5 fl/+ KRas;Atg5 fl/fl KRas;Atg5 fl/fl KRas;Atg5 Supplementary Figure 1. Gene set enrichment analyses. (a) (b)
 (b)") KRas;At KRas;At KRas;At KRas;At a b Supplementary Figure 1. Gene set enrichment analyses. (a) GO gene sets (MSigDB v3. c5) enriched in KRas;Atg5 fl/+ as compared to KRas;Atg5 fl/fl tumors using gene set
KRas;At KRas;At KRas;At KRas;At a b Supplementary Figure 1. Gene set enrichment analyses. (a) GO gene sets (MSigDB v3. c5) enriched in KRas;Atg5 fl/+ as compared to KRas;Atg5 fl/fl tumors using gene set
Supplemental Materials for. Effects of sphingosine-1-phosphate receptor 1 phosphorylation in response to. FTY720 during neuroinflammation
 Supplemental Materials for Effects of sphingosine-1-phosphate receptor 1 phosphorylation in response to FTY7 during neuroinflammation This file includes: Supplemental Table 1. EAE clinical parameters of
Supplementary Figure 1: Kv7 currents in neonatal CA1 neurons measured with the classic M- current voltage-clamp protocol.
 Supplementary Figures 1-11 Supplementary Figure 1: Kv7 currents in neonatal CA1 neurons measured with the classic M- current voltage-clamp protocol. (a), Voltage-clamp recordings from CA1 pyramidal neurons
SUPPLEMENTARY FIGURES
 SUPPLEMENTARY FIGURES 1 2 3 4 SUPPLEMENTARY TABLES Supplementary Table S1. Brain Tumors used in the study Code Tumor Classification Age Gender HuTuP51 Glioblastoma 57 Male HuTuP52 Glioblastoma 53 Male
Supplementary Figure 1: Validation of labeling specificity of immature OSNs and presynaptic terminals. (A) (B) (C) (D) (E)
 (B) (C) (D) (E)") Supplementary Figure 1: Validation of labeling specificity of immature OSNs and presynaptic terminals. (A) Confocal images of septal olfactory epithelium of an adult Gγ8-sypGFP-tdTom mouse showing colocalization
Supplementary Figure 1: Validation of labeling specificity of immature OSNs and presynaptic terminals. (A) Confocal images of septal olfactory epithelium of an adult Gγ8-sypGFP-tdTom mouse showing colocalization
Nature Neuroscience: doi: /nn Supplementary Figure 1. ACx plasticity is required for fear conditioning.
 Supplementary Figure 1 ACx plasticity is required for fear conditioning. (a) Freezing time of conditioned and control mice before CS presentation and during CS presentation in a new context. Student s
Supplementary Figure 1. Deletion of Smad3 prevents B16F10 melanoma invasion and metastasis in a mouse s.c. tumor model.
 A B16F1 s.c. Lung LN Distant lymph nodes Colon B B16F1 s.c. Supplementary Figure 1. Deletion of Smad3 prevents B16F1 melanoma invasion and metastasis in a mouse s.c. tumor model. Highly invasive growth
IL-34 is a tissue-restricted ligand of CSF1R required for the development of Langerhans cells and microglia
 Supplementary Figures IL-34 is a tissue-restricted ligand of CSF1R required for the development of Langerhans cells and microglia Yaming Wang, Kristy J. Szretter, William Vermi, Susan Gilfillan, Cristina
Supplementary Figure 1 Information on transgenic mouse models and their recording and optogenetic equipment. (a) 108 (b-c) (d) (e) (f) (g)
 108 (b-c) (d) (e) (f) (g)") Supplementary Figure 1 Information on transgenic mouse models and their recording and optogenetic equipment. (a) In four mice, cre-dependent expression of the hyperpolarizing opsin Arch in pyramidal cells
Supplementary Figure 1 Information on transgenic mouse models and their recording and optogenetic equipment. (a) In four mice, cre-dependent expression of the hyperpolarizing opsin Arch in pyramidal cells
Supplemental figure 1. PDGFRα is expressed dominantly by stromal cells surrounding mammary ducts and alveoli. A) IHC staining of PDGFRα in
 IHC staining of PDGFRα in") Supplemental figure 1. PDGFRα is expressed dominantly by stromal cells surrounding mammary ducts and alveoli. A) IHC staining of PDGFRα in nulliparous (left panel) and InvD6 mouse mammary glands (right
Supplemental figure 1. PDGFRα is expressed dominantly by stromal cells surrounding mammary ducts and alveoli. A) IHC staining of PDGFRα in nulliparous (left panel) and InvD6 mouse mammary glands (right
Supplemental Figure 1. Quantification of proliferation in thyroid of WT, Ctns -/- and grafted
 Supplemental Figure 1. Quantification of proliferation in thyroid of WT, Ctns -/- and grafted Ctns -/- mice. Cells immunolabeled for the proliferation marker (Ki-67) were counted in sections (n=3 WT, n=4
Supplementary Information
 Supplementary Information Overexpression of Fto leads to increased food intake and results in obesity Chris Church, Lee Moir, Fiona McMurray, Christophe Girard, Gareth T Banks, Lydia Teboul, Sara Wells,
Supplemental Figure 1. Intracranial transduction of a modified ptomo lentiviral vector in the mouse
 Supplemental figure legends Supplemental Figure 1. Intracranial transduction of a modified ptomo lentiviral vector in the mouse hippocampus targets GFAP-positive but not NeuN-positive cells. (A) Stereotaxic
SUPPLEMENTARY INFORMATION
 Figure S1. Loss of Ena/VASP proteins inhibits filopodia and neuritogenesis. (a) Bar graph of filopodia number per stage 1 control and mmvvee (Mena/ VASP/EVL-null) neurons at 40hrs in culture. Loss of all
Supplementary Materials for
 www.sciencesignaling.org/cgi/content/full/10/487/eaag2476/dc1 Supplementary Materials for Gene expression profiles of brain endothelial cells during embryonic development at bulk and single-cell levels
Supplementary Information. Tissue-wide immunity against Leishmania. through collective production of nitric oxide
 Supplementary Information Tissue-wide immunity against Leishmania through collective production of nitric oxide Romain Olekhnovitch, Bernhard Ryffel, Andreas J. Müller and Philippe Bousso Supplementary
TGF-β Signaling Regulates Neuronal C1q Expression and Developmental Synaptic Refinement
 Supplementary Information Title: TGF-β Signaling Regulates Neuronal C1q Expression and Developmental Synaptic Refinement Authors: Allison R. Bialas and Beth Stevens Supplemental Figure 1. In vitro characterization
Nature Neuroscience: doi: /nn Supplementary Figure 1. Diverse anorexigenic signals induce c-fos expression in CEl PKC-δ + neurons
 Supplementary Figure 1 Diverse anorexigenic signals induce c-fos expression in CEl PKC-δ + neurons a-c. Quantification of CEl c-fos expression in mice intraperitoneal injected with anorexigenic drugs (a),
label the basement membrane). Different fixation methods of EB-perfused P8 mice to optimize the combination
. Different fixation methods of EB-perfused P8 mice to optimize the combination") Supplementary Figure 1 Optimization of the tissue fixation protocol to combine EB perfusion and IB4 endothelial tip cell staining in the postnatal mouse brain. a-l Labeling of EB-perfused P8 mice with
Supplementary Figure 1 Optimization of the tissue fixation protocol to combine EB perfusion and IB4 endothelial tip cell staining in the postnatal mouse brain. a-l Labeling of EB-perfused P8 mice with
Supplementary Figure 1. Analysis of LN S1P gradients.
 Supplementary Figure 1 Analysis of LN S1P gradients. (a) Diagram showing the spatial distribution of NK cells in WT LN. Inset: Upon infection, sinus-lining macrophages secrete IL-18 and other cytokines,
Nature Neuroscience: doi: /nn Supplementary Figure 1
 Supplementary Figure 1 Subcellular segregation of VGluT2-IR and TH-IR within the same VGluT2-TH axon (wild type rats). (a-e) Serial sections of a dual VGluT2-TH labeled axon. This axon (blue outline) has
Supplemental Information. A Visual-Cue-Dependent Memory Circuit. for Place Navigation
 Neuron, Volume 99 Supplemental Information A Visual-Cue-Dependent Memory Circuit for Place Navigation Han Qin, Ling Fu, Bo Hu, Xiang Liao, Jian Lu, Wenjing He, Shanshan Liang, Kuan Zhang, Ruijie Li, Jiwei
Bone marrow-derived mesenchymal stem cells improve diabetes-induced cognitive impairment by
 Nakano et al. Supplementary information 1. Supplementary Figure 2. Methods 3. References Bone marrow-derived mesenchymal stem cells improve diabetes-induced cognitive impairment by exosome transfer into
Balancing intestinal and systemic inflammation through cell type-specific expression of
 Supplementary Information Balancing intestinal and systemic inflammation through cell type-specific expression of the aryl hydrocarbon receptor repressor Olga Brandstätter 1,2,6, Oliver Schanz 1,6, Julia
Nature Neuroscience: doi: /nn Supplementary Figure 1
 Supplementary Figure 1 Bidirectional optogenetic modulation of the tonic activity of CEA PKCδ + neurons in vitro. a, Top, Cell-attached voltage recording illustrating the blue light-induced increase in
Suppl Video: Tumor cells (green) and monocytes (white) are seeded on a confluent endothelial
 and monocytes (white) are seeded on a confluent endothelial") Supplementary Information Häuselmann et al. Monocyte induction of E-selectin-mediated endothelial activation releases VE-cadherin junctions to promote tumor cell extravasation in the metastasis cascade
Supplementary Information Häuselmann et al. Monocyte induction of E-selectin-mediated endothelial activation releases VE-cadherin junctions to promote tumor cell extravasation in the metastasis cascade
University of Miami Miller School of Medicine, Miami, FL 33136, USA, 3 State Key Laboratory
 Supplementary File ASXL1 plays an important role in erythropoiesis Hui Shi 1,2,3, Shohei Yamamoto 1,2,4, Mengyao Sheng 3, Jie Bai 3, Peng Zhang 1,2, Runze Chen 1,2, Shi Chen 1,2, Lihong Shi 3, Omar Abdel-Wahab
SUPPLEMENTARY INFORMATION. Otx2 controls neuron subtype identity in ventral tegmental area and antagonizes
 Di Salvio et al. 1 SUPPLEMENTARY INFORMATION Otx2 controls neuron subtype identity in ventral tegmental area and antagonizes vulnerability to MPTP Michela Di Salvio, Luca Giovanni Di Giovannantonio, Dario
The neuron. Biocytin labeled pyramidal neuron recorded in piriform cortex
 The neuron Biocytin labeled pyramidal neuron recorded in piriform cortex Discovery of the neuron (A) Reticularist Doctrine (B) Neuron Doctrine Exception.GAP JUNCTIONS between neurons Neuronal shape Dendrites
Supplemental Figure 1. (A) The localization of Cre DNA recombinase in the testis of Cyp19a1-Cre mice was detected by immunohistchemical analyses
 The localization of Cre DNA recombinase in the testis of Cyp19a1-Cre mice was detected by immunohistchemical analyses") Supplemental Figure 1. (A) The localization of Cre DNA recombinase in the testis of Cyp19a1-Cre mice was detected by immunohistchemical analyses using an anti-cre antibody; testes at 1 week (left panel),
Supplemental Figure 1. (A) The localization of Cre DNA recombinase in the testis of Cyp19a1-Cre mice was detected by immunohistchemical analyses using an anti-cre antibody; testes at 1 week (left panel),
Supplementary Figure 1. mrna expression of chitinase and chitinase-like protein in splenic immune cells. Each splenic immune cell population was
 Supplementary Figure 1. mrna expression of chitinase and chitinase-like protein in splenic immune cells. Each splenic immune cell population was sorted by FACS. Surface markers for sorting were CD11c +
Aggregated neutrophil extracellular traps limit inflammation by degrading cytokines and chemokines
 CORRECTION NOTICE Nat. Med. doi:10.1038/nm.3547; corrected online 25 August 2014 Aggregated neutrophil extracellular traps limit inflammation by degrading cytokines and chemokines Christine Schauer, Christina
Supplementary Figure 1
 Supplementary Figure 1 Kif1a RNAi effect on basal progenitor differentiation Related to Figure 2. Representative confocal images of the VZ and SVZ of rat cortices transfected at E16 with scrambled or Kif1a
Fibrinogen-induced perivascular microglial clustering is required for the. development of axonal damage in neuroinflammation
 SUPPLEMENTARY INFORMATION Fibrinogen-induced perivascular microglial clustering is required for the development of axonal damage in neuroinflammation Dimitrios Davalos, Jae Kyu Ryu, Mario Merlini, Kim
Nature Neuroscience: doi: /nn Supplementary Figure 1
 Supplementary Figure 1 Drd1a-Cre driven ChR2 expression in the SCN. (a) Low-magnification image of a representative Drd1a-ChR2 coronal brain section (n = 2) showing endogenous tdtomato fluorescence (magenta).
Lack of cadherins Celsr2 and Celsr3 impairs ependymal ciliogenesis, leading to fatal
 Lack of cadherins Celsr2 and Celsr3 impairs ependymal ciliogenesis, leading to fatal hydrocephalus Fadel TISSIR, Yibo QU, Mireille MONTCOUQUIOL, Libing ZHOU, Kouji KOMATSU, Dongbo SHI, Toshihiko FUJIMORI,
Supplement Material. Spleen weight (mg) LN cells (X106) Acat1-/- Acat1-/- Mouse weight (g)
 LN cells (X106) Acat1-/- Acat1-/- Mouse weight (g)") Supplement Material A Spleen weight (mg) C Mouse weight (g) 1 5 1 2 9 6 3 2 5 2 1 5 Male LN cells (X16) 4 ** ** Female B 3 2 1 Supplemental Figure I. Spleen weight (A), Inguinal lymph node (LN) cell number
Supplement Material A Spleen weight (mg) C Mouse weight (g) 1 5 1 2 9 6 3 2 5 2 1 5 Male LN cells (X16) 4 ** ** Female B 3 2 1 Supplemental Figure I. Spleen weight (A), Inguinal lymph node (LN) cell number
Quantitative PPARγ expression affects the balance between tolerance and immunity
 Quantitative PPARγ expression affects the balance between tolerance and immunity Ya-Hui Liu 1, Yau-Sheng Tsai 1,2,3, Shih-Chieh Lin 4, Nan-Shih Liao 5, Ming-Shiou Jan 6, Chung-Tiang Liang 7, Shih-Wen Hsu
Supplementary Figure 1
 Combination index (CI) Supplementary Figure 1 2. 1.5 1. Ishikawa AN3CA Nou-1 Hec-18.5...2.4.6.8 1. Fraction affected (Fa) Supplementary Figure 1. The synergistic effect of PARP inhibitor and PI3K inhibitor
Nature Neuroscience doi: /nn Supplementary Figure 1. Characterization of viral injections.
 Supplementary Figure 1 Characterization of viral injections. (a) Dorsal view of a mouse brain (dashed white outline) after receiving a large, unilateral thalamic injection (~100 nl); demonstrating that
SUPPLEMENTARY METHODS
 SUPPLEMENTARY METHODS Histological analysis. Colonic tissues were collected from 5 parts of the middle colon on day 7 after the start of DSS treatment, and then were cut into segments, fixed with 4% paraformaldehyde,
Figure S1. Generation of inducible PTEN deficient mice and the BMMCs (A) B6.129 Pten loxp/loxp mice were mated with B6.
 B6.129 Pten loxp/loxp mice were mated with B6.") Figure S1. Generation of inducible PTEN deficient mice and the BMMCs (A) B6.129 Pten loxp/loxp mice were mated with B6.129-Gt(ROSA)26Sor tm1(cre/ert2)tyj /J mice. To induce deletion of the Pten locus,
Figure S1. Generation of inducible PTEN deficient mice and the BMMCs (A) B6.129 Pten loxp/loxp mice were mated with B6.129-Gt(ROSA)26Sor tm1(cre/ert2)tyj /J mice. To induce deletion of the Pten locus,
Supplementary Figure S1: Histological analysis of kainate-treated animals
 Supplementary Figure S1: Histological analysis of kainate-treated animals Nissl stained coronal or horizontal sections were made from kainate injected (right) and saline injected (left) animals at different
Supplementary Information
 Supplementary Information Distinct bone marrow-derived and tissue resident macrophage lineages proliferate at key stages during inflammation. 1 Luke C. Davies, 1 Marcela Rosas, 2 Stephen J. Jenkins, 1
Supplementary Figure 1: STAT3 suppresses Kras-induced lung tumorigenesis
 Supplementary Figure 1: STAT3 suppresses Kras-induced lung tumorigenesis (a) Immunohistochemical (IHC) analysis of tyrosine 705 phosphorylation status of STAT3 (P- STAT3) in tumors and stroma (all-time