Nature Immunology: doi: /ni.3412
|
|
|
- Primrose Glenn
- 5 years ago
- Views:
Transcription
1
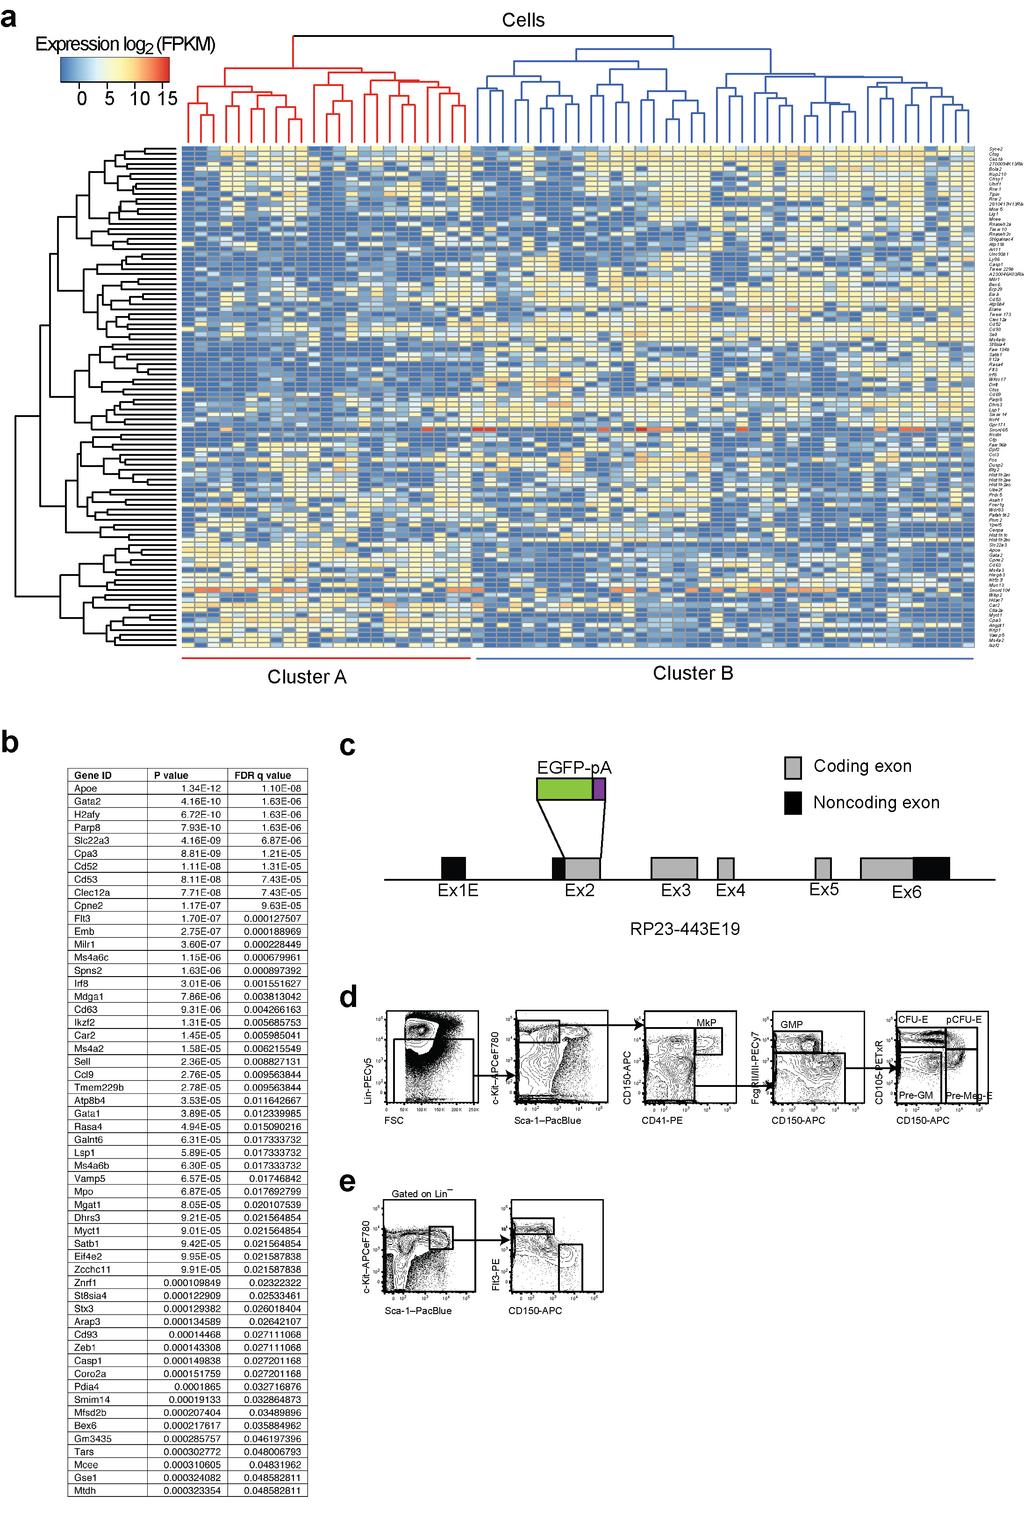
2 Supplementary Figure 1 Gata1 expression in heamatopoietic stem and progenitor populations. (a) Unsupervised clustering according to 100 top variable genes across single pre-gm cells. The two main cell clusters are indicated. (b) List of genes differentially expressed between clusters A and B in (a). Gene IDs, P-values and false discovery rate (FDR) q-values are indicated. Genes were included if both P<0.001 and q<0.05. (c) Structure of the Gata1-EGFP transgene (not to scale). The Gata1 genomic locus was contained within the RP23-443E19 BAC. (d-e) Flow cytometry profiles and gating strategies for identification of pre-gm, GMP, pre-meg-e, MkP, pre-cfu-e and CFU- E progenitors (d) and LSKCD150 + Flt3 and LSKFlt3 hi cells (e).
3
4 Supplementary Figure 2 Defining HSCs and LMPPs based on Gata1. (a-d) 22 weeks in vivo peripheral blood reconstitution after transplantation of 100 FACS purified GE - or GE + LSKCD150 + CD48 cells together with 250,000 congenic whole BM cells. Values show reconstitution of the compartment analyzed (mean ±SD); n=3 recipients/population in one experiment. WBC; white blood cells. (e) For evaluation of megakaryocyte (Mk) potential, LSKFlt3 hi GE - and GE + cells were manually plated at 1 cell per well into 60 well Terasaki plates and cultured for 8 or 12 days. Megakaryocytes were evaluated using an inverted microscope. Results are from 2 experiments, shown as percentage of colonies containing Mk cells of the total number of colonies formed. n=240 cells/population in 2 experiments. (f) Histogram plot showing expression of Flt3 and Gata1 in single sorted GE - (left) and GE + (right) pre-gms. Expression is shown as - (Ct(gene)-Ct(Kit)). (g) Combinations of one GE - pre-gm and three GE + pre-gms were cultured for 8 days. Single CD48 - HSCs were cultured for 25 days. Myeloid lineage potential readout of the cultures was based on morphology analysis after cytospins and MGG stain of the cultures. Number of cultures analyzed in indicated. Mo: monocytes, PMN: polymorphonuclear cells, Ma: mast cell. (h) Representative morphology of cells from cultures described in (g). Monocytes (Mo), polymorphonuclear granulocytes (PMN), and mast cells (Ma) are indicated. Scale bars: 25μm.
5
6 Supplementary Figure 3 Gene expression of vitro differentiated cell populations. (a) Schematic overview of eosinophil favoring culture conditions used. (b) Morphology of peritoneal eosinophils (left panel) and peripheral blood neutrophils (right panel) purified by cell sorting after cytospin and May-Grünwald-Giemsa staining. Note the larger size and similar, but less condensed, nuclear morphology of eosinophils, compared to neutrophils. (c-f) Neutrophils (Ne), eosinophils (Eo), monocytes (Mo) and mast cells (Ma) from day 8 cultured pre-gm and GMPs as indicated were sorted based on markers as in Figure 4a. Their gene expression was analyzed by quantitative-pcr for genes associated with mast cells (c, red), neutrophils (d, yellow), eosinophils (e, purple) and Gata1/Gata2 (f, orange). Gene expression is presented relative to Hprt expression (mean ±SD) (n=2 biological replicates).
7
8 Supplementary Figure 4 In vitro differentiation of hematopoietic progenitors. (a) Schematic overview of culture conditions used. Indicated progenitor populations were cultured for 3 days with mscf and mil-3, allowing the cells to reach a GMP stage, as defined by FcγRII/III expression. (b) Morphological analysis of EGFP-immunostained cytospins from cultures of the indicated in vitro generated EGFP - and EGFP + FcγRII/III + cells after manually plating at a density of 5 cells/well and cultured for 8 days. Cell types are shown as a percentage of total number of cultures analyzed (numbers above bars). (c) Flow cytometry analysis demonstrate expression of CD55, Ly6C, integrin beta 7 (Itgb7) and interleukin 1 receptor-like 1 (Il1rl1) with Gata1-EGFP in pre-gms and GMPs. Numbers indicate the percentage of cells within each quadrant. Representative plots of 2 (CD55, Ly6C and Il1rl1) or 1 experiment (Itgb7) are shown. (d) Quantification of identified cell population after 8-day cultures of CD55 + or Ly6C + pre-gm and GMP by FACS as in Figure 4a. n=6-8 biological replicates. Error bars show SD. Mo: monocyte, Ne: neutrophil, Eo: eosinophil, Ma: mast cell. (e) Flow cytometry analysis of T-cell cultures (OP9-DL1 stroma) of LMPP and pre- GM GE - cells cultured for 21 days (10 cells/culture). Plots show live cells. Stromal cells were gated out on FSC-SSC plot. Percentages are averages of cells in the gates or quadrants (+/-SD). (n=5 for LMPP, n=19 for pre-gm GE - ). Panels on the right show Thy1.2 vs CD25 expression profile on cells first gated as CD4 CD8.
9 Supplementary Figure 5 Effect of absence of Flt3L and GATA-1 on myeloid progenitors. (a) Flow cytometry analysis of wild type and Flt3L KO pre-gm cells from 17 week old male mice, showing Flt3 expression. Numbers indicate mean percentage of cells in each gate (+/- SD). n=5 from 2 experiments. (b) Quantification of number of myeloid progenitors by flow cytometry analysis shown as percentage of total bone marrow. Number of cells of indicated progenitors are shown as frequency of total number of bone marrow cells (+/- SD). n=5 from 2 experiments. (c) Schematic overview of Gata1 KO studies. Chimeric mice with wild type and conditional Gata1 KO blood cells are created by transplanting indicated cells into irradiated recipients. pic is injected to delete the floxed Gata1 gene mediated by MxCre. GE -
10 and GE + pre-gm and GMP cells were analyzed and sorted for in vitro culture. (d) Quantification of EGFP positive cells by flow cytometry of CD45.2 donor cells from experiment depicted in (c). Bars show percentage EGFP positive cells of the indicated CD45.2 progenitor population. Gata1 fl/y without MxCre are defined as wild type cells. n=2 for wild type cells and n=3 for Gata1 KO. SD is shown. (e) Indicated cells were manually plated at an average of 1 cell/culture and cultured for 8 days. Cell types of cultures are based on morphology analysis of cytospins. The number of cultures analyzed is indicated and are accumulated from 2 experiments. Mo: monocyte, PMN: polymorphonuclear granulocyte, Ma: mast cell (f) Representative picture of mast cells from cultured wild type and Gata1 KO GMP GE + single cells. Scale bar is 25µM.
11
12 Supplementary Figure 6 In vivo myeloid reconstitution by GE and GE + myeloid progenitor cells. (a) Experimental design for direct comparison of in vivo potential from GE - and GE + GMPs and pre-gms. (b-c) Quantification of in vivo contribution of GE + and GE - GMP (b) and pre-gm (c) progenitors to mast cells, eosinophils, neutrophils and monocytes, 7 (red; n=3) and 10 (blue; n=5) days after intra-femur transplantation of cells. Mean (SD) donor derived cells per million analyzed MNCs per 1000 injected cells detected in injected femur (top) and spleen (bottom) is shown. Data is from three independent experiments. * below detection limit (see methods). (d) Total donor (CD CD45.1/2) contribution per million MNCs analyzed at 7 and days following IP or IF transplantation of indicated progenitor populations. Peritoneal fluid was analyzed from IP transplanted mice, and bone marrow cells from injected femur and spleen cells were analyzed from IF transplanted mice (n=3-5 mice) cells/mouse were injected IP and cells/mouse were injected IF. Data is adjusted to per 1000 injected donor cells per 1 million acquired MNCs. (e-h) Representative morphology of donor-derived monocytes (e), neutrophils (f), eosinophils (g) and mast cells (h) following IP transplantation of purified GMPs, pre-gms and LMPPs. (i) Gata1-EGFP expression in donor-derived (CD45.1/2 and CD45.2) mast cells, eosinophils, neutrophils and monocytes 7 and 11 days following I.P. transplantation of GMPs and pre-gms respectively. Data from transplanted mice included in Figure 8 is shown.
 The classical model with initial segregation of myeloid/mk/e and lymphoid potential via a CMP and CLP, with a common CMP-derived GMP that gives rise to all monocyte-macrophage and granulocyte")
13 Supplementary Figure 7 Revised model of the hematopoietic hierarchy with an early bifurcation of distinct myeloid lineage pathways. (a) The classical model with initial segregation of myeloid/mk/e and lymphoid potential via a CMP and CLP, with a common CMP-derived GMP that gives rise to all monocyte-macrophage and granulocyte lineages. (b) Model incorporating the LMPP, where lymphoid and megakaryocyteerythroid potentials separate early, but both the LMPP and CMP produce the same GMP with combined potential for all monocyte-macrophage and granulocyte lineages. (c) Model supported by the work described herein based on an early branching point generating LMPPs and erythroidmegakaryocyte primed multi-potent progenitor (EMkMPP), where the monocyte-macrophage and granulocyte lineages separate along with the lymphoid and megakaryocyte/erythroid potentials, according to their Gata1 expression, generating progenitors restricted to eosinophil-mast cell (and likely basophil) fate (EoMP), or to neutrophil or monocyte-macrophage fate (prenm, NMP). The GATA-1 and Flt3 expression domains are
14 indicated. It should be noted that there is no direct evidence yet that the Flt3 fraction of prenms derive from multi-potent progenitors (MPPs), so this pathways remains hypothetical. (d) Composite model of the work described herein that includes a CMP placed upstream of both the EMkMPP and the prenm, assuming it contains all monocyte-macrophage and granulocyte potentials at the single cell level, something yet to be determined. For all models it should be noted that other commitment pathways are possible, given the lineage potentials of the progenitors involved. For example, direct commitment of MPPs or another multi-potent progenitor to an Mk-E fate, circumventing the CMP and/or EMkMPP cannot be ruled out. In addition, these models do not incorporate all established findings in the hematopoietic hierarchy, such as the sustained myeloid programming of CLPs and downstream lymphoid progenitors.
 Quantification of the number of sequencing reads that were mapped to a unique genome position for each single pre-gm cell.")
15 Supplementary Figure 8 Quantification of transcriptome coverage of pre-gm single-cell RNA-seq. (a) Quantification of the number of sequencing reads that were mapped to a unique genome position for each single pre-gm cell. (b) Percentage of total reads that were mapped to a unique genome position for each single pre-gm cell. (c) The total number of transcripts to which sequencing reads could be uniquely mapped for each single pre-gm cell, using a detection limit of 0.5 reads per million per kilobase of transcript. Cells where <2000 genes were detected were excluded from the analysis (sample 81).
Supplement Material. Spleen weight (mg) LN cells (X106) Acat1-/- Acat1-/- Mouse weight (g)
 LN cells (X106) Acat1-/- Acat1-/- Mouse weight (g)") Supplement Material A Spleen weight (mg) C Mouse weight (g) 1 5 1 2 9 6 3 2 5 2 1 5 Male LN cells (X16) 4 ** ** Female B 3 2 1 Supplemental Figure I. Spleen weight (A), Inguinal lymph node (LN) cell number
Supplement Material A Spleen weight (mg) C Mouse weight (g) 1 5 1 2 9 6 3 2 5 2 1 5 Male LN cells (X16) 4 ** ** Female B 3 2 1 Supplemental Figure I. Spleen weight (A), Inguinal lymph node (LN) cell number
SUPPLEMENTARY INFORMATION doi: /nature12026
 doi:1.138/nature1226 a 4 35 3 MCSF level (pg/ml) 25 2 15 1 5 1h3 3h 5h 7h 15h 24h b MPP (CD135 KSL) HSC (CD34 CD15 KSLF) c % 4 ** LPS 3 GFP pos cells 2 PU.1 GFP LPS 1 FSCA Ctl NI 24h LPS Sup.Fig.1 Effect
The Ufm1-activating enzyme Uba5 is indispensable for erythroid differentiation in mice
 Supplementary information The Ufm1-activating enzyme Uba5 is indispensable for erythroid differentiation in mice Kanako Tatsumi 1, 2, Harumi Yamamoto-Mukai 2, Ritsuko Shimizu 3, Satoshi Waguri 4, Yu-Shin
Nature Immunology: doi: /ni Supplementary Figure 1. Cellularity of leukocytes and their progenitors in naive wild-type and Spp1 / mice.
 Supplementary Figure 1 Cellularity of leukocytes and their progenitors in naive wild-type and Spp1 / mice. (a, b) Gating strategies for differentiated cells including PMN (CD11b + Ly6G hi and CD11b + Ly6G
sequences of a styx mutant reveals a T to A transversion in the donor splice site of intron 5
 sfigure 1 Styx mutant mice recapitulate the phenotype of SHIP -/- mice. (A) Analysis of the genomic sequences of a styx mutant reveals a T to A transversion in the donor splice site of intron 5 (GTAAC
Supplementary Figure 1. Successful excision of genes from WBM lysates and
 Supplementary Information: Supplementary Figure 1. Successful excision of genes from WBM lysates and survival of mice with different genotypes. (a) The proper excision of Pten, p110α, p110α and p110δ was
SUPPLEMENTARY INFORMATION
 doi:10.1038/nature10134 Supplementary Figure 1. Anti-inflammatory activity of sfc. a, Autoantibody immune complexes crosslink activating Fc receptors, promoting activation of macrophages, and WWW.NATURE.COM/NATURE
Nature Immunology: doi: /ni Supplementary Figure 1. Huwe1 has high expression in HSCs and is necessary for quiescence.
 Supplementary Figure 1 Huwe1 has high expression in HSCs and is necessary for quiescence. (a) Heat map visualizing expression of genes with a known function in ubiquitin-mediated proteolysis (KEGG: Ubiquitin
Supplemental Information. Granulocyte-Monocyte Progenitors and. Monocyte-Dendritic Cell Progenitors Independently
 Immunity, Volume 47 Supplemental Information Granulocyte-Monocyte Progenitors and Monocyte-endritic ell Progenitors Independently Produce Functionally istinct Monocytes lberto Yáñez, Simon G. oetzee, ndre
Stem cells: units of development and regeneration. Fernando D. Camargo Ph.D. Whitehead Fellow Whitehead Institute for Biomedical Research.
 Stem cells: units of development and regeneration Fernando D. Camargo Ph.D. Whitehead Fellow Whitehead Institute for Biomedical Research Concepts 1. Embryonic vs. adult stem cells 2. Hematopoietic stem
Nature Genetics: doi: /ng.3812
 Nature Genetics: doi:10.1038/ng.3812 Supplementary Figure 1 Smarcd2-knockout mice die perinatally with impaired energy homeostasis. (a) Generation of the Smarcd2 conditional knockout allele. Deletion of
Supplemental Information. Aryl Hydrocarbon Receptor Controls. Monocyte Differentiation. into Dendritic Cells versus Macrophages
 Immunity, Volume 47 Supplemental Information Aryl Hydrocarbon Receptor Controls Monocyte Differentiation into Dendritic Cells versus Macrophages Christel Goudot, Alice Coillard, Alexandra-Chloé Villani,
Nature Immunology: doi: /ni Supplementary Figure 1. Characteristics of SEs in T reg and T conv cells.
 Supplementary Figure 1 Characteristics of SEs in T reg and T conv cells. (a) Patterns of indicated transcription factor-binding at SEs and surrounding regions in T reg and T conv cells. Average normalized
Chronic variable stress activates hematopoietic stem cells
 SUPPLEMENTARY INFORMATION Chronic variable stress activates hematopoietic stem cells Timo Heidt *, Hendrik B. Sager *, Gabriel Courties, Partha Dutta, Yoshiko Iwamoto, Alex Zaltsman, Constantin von zur
SUPPLEMENTARY INFORMATION
 a. Smo+/+ b. Smo+/+ 5.63 5.48 c. Lin- d. e. 6 5 4 3 Ter119 Mac B T Sca1 Smo+/+ 25 15 2 o BMT 2 1 5 * Supplementary Figure 1: Deletion of Smoothened does not alter the frequency of hematopoietic lineages
CD34+ Cells: A Comparison of Stem and Progenitor Cells in Cord Blood, Peripheral Blood, and the Bone Marrow
 White Paper September 2016 CD34+ Cells: A Comparison of Stem and Progenitor Cells in Cord Blood, Peripheral Blood, and the Bone Marrow Lily C. Trajman, PhD Introduction: Hematopoietic Stem Cells (HSCs)
Hematopoiesis. - Process of generation of mature blood cells. - Daily turnover of blood cells (70 kg human)
") Hematopoiesis - Process of generation of mature blood cells - Daily turnover of blood cells (70 kg human) 1,000,000,000,000 total cells 200,000,000,000 red blood cells 70,000,000,000 neutrophils Hematopoiesis
Hematopoiesis - Process of generation of mature blood cells - Daily turnover of blood cells (70 kg human) 1,000,000,000,000 total cells 200,000,000,000 red blood cells 70,000,000,000 neutrophils Hematopoiesis
Nature Medicine doi: /nm.3150
 Nature Medicine doi:10.1038/nm.3150 Supplementary Table 1 Primer sequences used for q-pcr analysis Gene Forward primer Reverse primer Abca1 CAGCTTCCATCCTCCTTGTC CCACATCCACAACTGTCTGG Abcg1 GTACCATGACATCGCTGGTG
and follicular helper T cells is Egr2-dependent. (a) Diagrammatic representation of the
 Diagrammatic representation of the") Supplementary Figure 1. LAG3 + Treg-mediated regulation of germinal center B cells and follicular helper T cells is Egr2-dependent. (a) Diagrammatic representation of the experimental protocol for the
Supplementary Figure 1. LAG3 + Treg-mediated regulation of germinal center B cells and follicular helper T cells is Egr2-dependent. (a) Diagrammatic representation of the experimental protocol for the
BCR-ABL - LSK BCR-ABL + LKS - (%)
") Marker Clone BCR-ABL + LSK (%) BCR-ABL + LKS - (%) BCR-ABL - LSK (%) P value vs. BCR-ABL + LKS - P value vs. BCR-ABL - LSK CD2 RM2-5 12.9 ± 3.6 36.7 ± 6.5 19.3 ± 2.4 0.01 0.10 CD5 53-7.3 13.9 ± 3.2 20.8
Marker Clone BCR-ABL + LSK (%) BCR-ABL + LKS - (%) BCR-ABL - LSK (%) P value vs. BCR-ABL + LKS - P value vs. BCR-ABL - LSK CD2 RM2-5 12.9 ± 3.6 36.7 ± 6.5 19.3 ± 2.4 0.01 0.10 CD5 53-7.3 13.9 ± 3.2 20.8
Hematopoiesis. BHS Liège 27/1/2012. Dr Sonet Anne UCL Mont-Godinne
 Hematopoiesis BHS Liège 27/1/2012 Dr Sonet Anne UCL Mont-Godinne Hematopoiesis: definition = all the phenomenons to produce blood cells Leukocytes = White Blood Cells Polynuclear = Granulocytes Platelet
Supplemental Information. Genomic Characterization of Murine. Monocytes Reveals C/EBPb Transcription. Factor Dependence of Ly6C Cells
 Immunity, Volume 46 Supplemental Information Genomic Characterization of Murine Monocytes Reveals C/EBPb Transcription Factor Dependence of Ly6C Cells Alexander Mildner, Jörg Schönheit, Amir Giladi, Eyal
Transfer protocol of human HSC into NOG mice
 Transfer protocol of human HSC into NOG mice Mice: Adult NOG mice are aged 8-12 weeks. Newborn mice are 1 2 days old. 8-12 week old NOG mice irradiated with 2.5 Gy Intravenous transfer of 1-0.5 x 10 5
Expanded View Figures
 The EMO Journal Dnmt regulates translational fidelity Francesca Tuorto et al Expanded View Figures x E3 cells/µl W g/l HG x e3 cells/µl PLT % of cell type 8 day 8 month % of cell type 8 day 8 month 8 day
SUPPLEMENTARY INFORMATION
 SUPPLEMENTARY INFORMATION Pleiotrophin Regulates the Expansion and Regeneration of Hematopoietic Stem Cells Heather A Himburg 1, Garrett G Muramoto 1 *, Pamela Daher 1*, Sarah K Meadows 1, J. Lauren Russell
DISCOVERING ATCC IMMUNOLOGICAL CELLS - MODEL SYSTEMS TO STUDY THE IMMUNE AND CARDIOVASCULAR SYSTEMS
 DISCOVERING ATCC IMMUNOLOGICAL CELLS - MODEL SYSTEMS TO STUDY THE IMMUNE AND CARDIOVASCULAR SYSTEMS James Clinton, Ph.D. Scientist, ATCC February 19, 2015 About ATCC Founded in 1925, ATCC is a non-profit
Normal & Leukaemic haematopoiesis. Dr. Liu Te Chih Dept of Haematology / Oncology National University Health Services Singapore
 Normal & Leukaemic haematopoiesis 2010 Dr. Liu Te Chih Dept of Haematology / Oncology National University Health Services Singapore Use of Immunophenotyping today Lineage assignment Differentiation of
Supplemental Information. Gut Microbiota Promotes Hematopoiesis to Control Bacterial Infection. Cell Host & Microbe, Volume 15
 Cell Host & Microbe, Volume 15 Supplemental Information Gut Microbiota Promotes Hematopoiesis to Control Bacterial Infection Arya Khosravi, Alberto Yáñez, Jeremy G. Price, Andrew Chow, Miriam Merad, Helen
Toluidin-Staining of mast cells Ear tissue was fixed with Carnoy (60% ethanol, 30% chloroform, 10% acetic acid) overnight at 4 C, afterwards
 overnight at 4 C, afterwards") Toluidin-Staining of mast cells Ear tissue was fixed with Carnoy (60% ethanol, 30% chloroform, 10% acetic acid) overnight at 4 C, afterwards incubated in 100 % ethanol overnight at 4 C and embedded in
Toluidin-Staining of mast cells Ear tissue was fixed with Carnoy (60% ethanol, 30% chloroform, 10% acetic acid) overnight at 4 C, afterwards incubated in 100 % ethanol overnight at 4 C and embedded in
well for 2 h at rt. Each dot represents an individual mouse and bar is the mean ±
 Supplementary data: Control DC Blimp-1 ko DC 8 6 4 2-2 IL-1β p=.5 medium 8 6 4 2 IL-2 Medium p=.16 8 6 4 2 IL-6 medium p=.3 5 4 3 2 1-1 medium IL-1 n.s. 25 2 15 1 5 IL-12(p7) p=.15 5 IFNγ p=.65 4 3 2 1
Supplementary Figure 1. Efficiency of Mll4 deletion and its effect on T cell populations in the periphery. Nature Immunology: doi: /ni.
 Supplementary Figure 1 Efficiency of Mll4 deletion and its effect on T cell populations in the periphery. Expression of Mll4 floxed alleles (16-19) in naive CD4 + T cells isolated from lymph nodes and
Scientific report: Delineating cellular stages and regulation of human NK cell development to improve NK cell-based therapy for cancer (Dnr )
") Scientific report: Delineating cellular stages and regulation of human NK cell development to improve NK cell-based therapy for cancer (Dnr 130259) The main goal of this project focuses on establishing
Scientific report: Delineating cellular stages and regulation of human NK cell development to improve NK cell-based therapy for cancer (Dnr 130259) The main goal of this project focuses on establishing
Hosoya et al. TRIM28 is essential for erythroblast differentiation in the mouse (supplemental information)
") TaqMan assay Gene TRIM28 GATA-1 Applied Biosystems TaqMan assay Mm00495594_m1 Mm01352636_m1 SYBR Green assay Gene Forward primer Reverse primer Reference adult α-globin CCCGGTGCCTTGTCTGCT GTGAAATCGGCAGGGTGG
TaqMan assay Gene TRIM28 GATA-1 Applied Biosystems TaqMan assay Mm00495594_m1 Mm01352636_m1 SYBR Green assay Gene Forward primer Reverse primer Reference adult α-globin CCCGGTGCCTTGTCTGCT GTGAAATCGGCAGGGTGG
% of live splenocytes. STAT5 deletion. (open shapes) % ROSA + % floxed
 % ROSA + % floxed") Supp. Figure 1. a 14 1 1 8 6 spleen cells (x1 6 ) 16 % of live splenocytes 5 4 3 1 % of live splenocytes 8 6 4 b 1 1 c % of CD11c + splenocytes (closed shapes) 8 6 4 8 6 4 % ROSA + (open shapes) % floxed
Supp. Figure 1. a 14 1 1 8 6 spleen cells (x1 6 ) 16 % of live splenocytes 5 4 3 1 % of live splenocytes 8 6 4 b 1 1 c % of CD11c + splenocytes (closed shapes) 8 6 4 8 6 4 % ROSA + (open shapes) % floxed
Supplementary Material
 Supplementary Material Taghon, Yui, and Rothenberg: Mast cell diversion of T-lineage precursor cells by the essential T-lineage transcription factor GATA Supplemental Table Supplemental Figures 1-6 Supplemental
Supplemental Table 1. Primer sequences for transcript analysis
 Supplemental Table 1. Primer sequences for transcript analysis Primer Sequence (5 3 ) Primer Sequence (5 3 ) Mmp2 Forward CCCGTGTGGCCCTC Mmp15 Forward CGGGGCTGGCT Reverse GCTCTCCCGGTTTC Reverse CCTGGTGTGCCTGCTC
SUPPLEMENTARY INFORMATION
 doi:10.1038/nature12215 Supplementary Figure 1. The effects of full and dissociated GR agonists in supporting BFU-E self-renewal divisions. BFU-Es were cultured in self-renewal medium with indicated GR
Haematopoietic stem cells
 Haematopoietic stem cells Neil P. Rodrigues, DPhil NIH Centre for Biomedical Research Excellence in Stem Cell Biology Boston University School of Medicine neil.rodrigues@imm.ox.ac.uk Haematopoiesis: An
SUPPLEMENTARY INFORMATION
 1. Supplementary Figures and Legends Supplementary Fig. 1. S1P-mediated transcriptional regulation of integrins expressed in OP/monocytoid cells. Real-time quantitative PCR analyses of mrna for two integrins,
Supplemental Figure 1. Activated splenocytes upregulate Serpina3g and Serpina3f expression.
 Relative Serpin expression 25 2 15 1 5 Serpina3f 1 2 3 4 5 6 8 6 4 2 Serpina3g 1 2 3 4 5 6 C57BL/6 DBA/2 Supplemental Figure 1. Activated splenocytes upregulate Serpina3g and Serpina3f expression. Splenocytes
Flow Cytometry. What is flow cytometry?
 Flow Cytometry Flow Cytometry What is flow cytometry? Flow cytometry is a popular laser-based technology to analyze the characteristics of cells or particles. It is predominantly used to measure fluorescence
SUPPLEMENTARY INFORMATION
 doi:10.1038/nature11095 Supplementary Table 1. Summary of the binding between Angptls and various Igdomain containing receptors as determined by flow cytometry analysis. The results were summarized from
Eosinophils are required. for the maintenance of plasma cells in the bone marrow
 Eosinophils are required for the maintenance of plasma cells in the bone marrow Van Trung Chu, Anja Fröhlich, Gudrun Steinhauser, Tobias Scheel, Toralf Roch, Simon Fillatreau, James J. Lee, Max Löhning
Nature Medicine: doi: /nm.2109
 HIV 1 Infects Multipotent Progenitor Cells Causing Cell Death and Establishing Latent Cellular Reservoirs Christoph C. Carter, Adewunmi Onafuwa Nuga, Lucy A. M c Namara, James Riddell IV, Dale Bixby, Michael
Supplementary Information
 Supplementary Information Memory-type ST2 + CD + T cells participate in the steroid-resistant pathology of eosinophilic pneumonia Naoko Mato 1, 2, Kiyoshi Hirahara 2, Tomomi Ichikawa 2, Jin Kumagai 2,
Supplementary Figure 1. Characterization of basophils after reconstitution of SCID mice
 Supplementary figure legends Supplementary Figure 1. Characterization of after reconstitution of SCID mice with CD4 + CD62L + T cells. (A-C) SCID mice (n = 6 / group) were reconstituted with 2 x 1 6 CD4
Nature Immunology: doi: /ni Supplementary Figure 1. Examples of staining for each antibody used for the mass cytometry analysis.
 Supplementary Figure 1 Examples of staining for each antibody used for the mass cytometry analysis. To illustrate the functionality of each antibody probe, representative plots illustrating the expected
SUPPLEMENTARY METHODS
 SUPPLEMENTARY METHODS Histological analysis. Colonic tissues were collected from 5 parts of the middle colon on day 7 after the start of DSS treatment, and then were cut into segments, fixed with 4% paraformaldehyde,
Control shrna#9 shrna#12. shrna#12 CD14-PE CD14-PE
 a Control shrna#9 shrna#12 c Control shrna#9 shrna#12 e Control shrna#9 shrna#12 h 14 12 CFU-E BFU-E GEMM GM b Colony number 7 6 5 4 3 2 1 6 pm A pa pc CFU-E BFU-E GEMM GM pu pgm A p pg B d f CD11b-APC
Supplementary Figure 1. Generation of knockin mice expressing L-selectinN138G. (a) Schematics of the Sellg allele (top), the targeting vector, the
 Schematics of the Sellg allele (top), the targeting vector, the") Supplementary Figure 1. Generation of knockin mice expressing L-selectinN138G. (a) Schematics of the Sellg allele (top), the targeting vector, the targeted allele in ES cells, and the mutant allele in
Supplementary Figure 1. Generation of knockin mice expressing L-selectinN138G. (a) Schematics of the Sellg allele (top), the targeting vector, the targeted allele in ES cells, and the mutant allele in
SUPPLEMENTARY INFORMATION
 Suppl. Fig. 1 in vivo expression of ISL1 in the human fetal heart. a, Hematoxylin eosin staining showing structures of left atrium and left atrium appendage (*) of a human fetal heart at 11 weeks of gestation.
Hematopoiesis. Hematopoiesis. Hematopoiesis
 Chapter. Cells and Organs of the Immune System Hematopoiesis Hematopoiesis- formation and development of WBC and RBC bone marrow. Hematopoietic stem cell- give rise to any blood cells (constant number,
Nature Genetics: doi: /ng Supplementary Figure 1
 Supplementary Figure 1 MSI2 interactors are associated with the riboproteome and are functionally relevant. (a) Coomassie blue staining of FLAG-MSI2 immunoprecipitated complexes. (b) GO analysis of MSI2-interacting
Getting to the root of Cancer
 Cancer Stem Cells: Getting to the root of Cancer Dominique Bonnet, Ph.D Senior Group Leader, Haematopoietic Stem Cell Laboratory Cancer Research UK, London Research Institute Venice, Sept 2009 Overview
Pearson r = P (one-tailed) = n = 9
 = n = 9") 8F4-Specific Lysis, % 1 UPN1 UPN3 8 UPN7 6 Pearson r =.69 UPN2 UPN5 P (one-tailed) =.192 4 UPN8 n = 9 2 UPN9 UPN4 UPN6 5 1 15 2 25 8 8F4, % Max MFI Supplementary Figure S1. AML samples UPN1-UPN9 show variable
8F4-Specific Lysis, % 1 UPN1 UPN3 8 UPN7 6 Pearson r =.69 UPN2 UPN5 P (one-tailed) =.192 4 UPN8 n = 9 2 UPN9 UPN4 UPN6 5 1 15 2 25 8 8F4, % Max MFI Supplementary Figure S1. AML samples UPN1-UPN9 show variable
VETERINARY HEMATOLOGY ATLAS OF COMMON DOMESTIC AND NON-DOMESTIC SPECIES COPYRIGHTED MATERIAL SECOND EDITION
 VETERINARY HEMATOLOGY ATLAS OF COMMON DOMESTIC AND NON-DOMESTIC SPECIES SECOND EDITION COPYRIGHTED MATERIAL CHAPTER ONE HEMATOPOIESIS GENERAL FEATURES All blood cells have a finite life span, but in normal
Bezzi et al., Supplementary Figure 1 *** Nature Medicine: doi: /nm Pten pc-/- ;Zbtb7a pc-/- Pten pc-/- ;Pml pc-/- Pten pc-/- ;Trp53 pc-/-
 Gr-1 Gr-1 Gr-1 Bezzi et al., Supplementary Figure 1 a Gr1-CD11b 3 months Spleen T cells 3 months Spleen B cells 3 months Spleen Macrophages 3 months Spleen 15 4 8 6 c CD11b+/Gr1+ cells [%] 1 5 b T cells
Supplementary Information
 Supplementary Information Distinct bone marrow-derived and tissue resident macrophage lineages proliferate at key stages during inflammation. 1 Luke C. Davies, 1 Marcela Rosas, 2 Stephen J. Jenkins, 1
4. TEXTBOOK: ABUL K. ABBAS. ANDREW H. LICHTMAN. CELLULAR AND MOLECULAR IMMUNOLOGY. 5 TH EDITION. Chapter 2. pg
 LECTURE: 03 Title: CELLS INVOLVED IN THE IMMUNE RESPONSE LEARNING OBJECTIVES: The student should be able to: Identify the organs where the process of the blood formation occurs. Identify the main cell
TITLE: Properties of Leukemia Stem Cells in a Novel Model of CML Progression to Lymphoid Blast Crisis
 AD Award Number: W81XWH-05-1-0608 TITLE: Properties of Leukemia Stem Cells in a Novel Model of CML Progression to Lymphoid Blast Crisis PRINCIPAL INVESTIGATOR: Craig T. Jordan, Ph.D. CONTRACTING ORGANIZATION:
IL-34 is a tissue-restricted ligand of CSF1R required for the development of Langerhans cells and microglia
 Supplementary Figures IL-34 is a tissue-restricted ligand of CSF1R required for the development of Langerhans cells and microglia Yaming Wang, Kristy J. Szretter, William Vermi, Susan Gilfillan, Cristina
CRISPR-mediated Editing of Hematopoietic Stem Cells for the Treatment of β-hemoglobinopathies
 CRISPR-mediated Editing of Hematopoietic Stem Cells for the Treatment of β-hemoglobinopathies Jennifer Gori American Society of Gene & Cell Therapy May 11, 2017 editasmedicine.com 1 Highlights Developed
Supplementary Figures
 Supplementary Figures Supplementary Figure 1. Confirmation of Dnmt1 conditional knockout out mice. a, Representative images of sorted stem (Lin - CD49f high CD24 + ), luminal (Lin - CD49f low CD24 + )
Revision of the Human Hematopoietic Tree: Granulocyte Subtypes Derive from Distinct Hematopoietic Lineages
 Cell Reports Article Revision of the Human Hematopoietic Tree: Granulocyte Subtypes Derive from Distinct Hematopoietic Lineages André Görgens, 1 Stefan Radtke, 1 Michael Möllmann, 2 Michael Cross, 3 Jan
MATERIALS AND METHODS. Neutralizing antibodies specific to mouse Dll1, Dll4, J1 and J2 were prepared as described. 1,2 All
 MATERIALS AND METHODS Antibodies (Abs), flow cytometry analysis and cell lines Neutralizing antibodies specific to mouse Dll1, Dll4, J1 and J2 were prepared as described. 1,2 All other antibodies used
Highly Efficient CRISPR/Cas9 Gene Editing and Long-Term Engraftment of Human Hematopoietic Stem and Progenitor Cells
 Highly Efficient CRISPR/Cas9 Gene Editing and Long-Term Engraftment of Human Hematopoietic Stem and Progenitor Cells J. M. Heath, A. Chalishazar, C.S. Lee, W. Selleck, C. Cotta-Ramusino, D. Bumcrot, J.L.
Nature Immunology: doi: /ni Supplementary Figure 1. DNA-methylation machinery is essential for silencing of Cd4 in cytotoxic T cells.
 Supplementary Figure 1 DNA-methylation machinery is essential for silencing of Cd4 in cytotoxic T cells. (a) Scheme for the retroviral shrna screen. (b) Histogram showing CD4 expression (MFI) in WT cytotoxic
The Immune System. A macrophage. ! Functions of the Immune System. ! Types of Immune Responses. ! Organization of the Immune System
 The Immune System! Functions of the Immune System! Types of Immune Responses! Organization of the Immune System! Innate Defense Mechanisms! Acquired Defense Mechanisms! Applied Immunology A macrophage
X P. Supplementary Figure 1. Nature Medicine: doi: /nm Nilotinib LSK LT-HSC. Cytoplasm. Cytoplasm. Nucleus. Nucleus
 a b c Supplementary Figure 1 c-kit-apc-eflu780 Lin-FITC Flt3-Linc-Kit-APC-eflu780 LSK Sca-1-PE-Cy7 d e f CD48-APC LT-HSC CD150-PerCP-cy5.5 g h i j Cytoplasm RCC1 X Exp 5 mir 126 SPRED1 SPRED1 RAN P SPRED1
University of Miami Miller School of Medicine, Miami, FL 33136, USA, 3 State Key Laboratory
 Supplementary File ASXL1 plays an important role in erythropoiesis Hui Shi 1,2,3, Shohei Yamamoto 1,2,4, Mengyao Sheng 3, Jie Bai 3, Peng Zhang 1,2, Runze Chen 1,2, Shi Chen 1,2, Lihong Shi 3, Omar Abdel-Wahab
Meeting Report. From December 8 to 11, 2012 at Atlanta, GA, U.S.A
 Meeting Report Affiliation Department of Transfusion Medicine and Cell Therapy Name Hisayuki Yao Name of the meeting Period and venue Type of your presentation Title of your presentation The 54 th Annual
Supplementary Figure 1 Protease allergens induce IgE and IgG1 production. (a-c)
") 1 Supplementary Figure 1 Protease allergens induce IgE and IgG1 production. (a-c) Serum IgG1 (a), IgM (b) and IgG2 (c) concentrations in response to papain immediately before primary immunization (day
1 Supplementary Figure 1 Protease allergens induce IgE and IgG1 production. (a-c) Serum IgG1 (a), IgM (b) and IgG2 (c) concentrations in response to papain immediately before primary immunization (day
Schumacher et al. Journal of Hematology & Oncology (2015) 8:64 DOI /s
 8:64 DOI /s") Schumacher et al. Journal of Hematology & Oncology (2015) 8:64 DOI 10.1186/s13045-015-0152-2 JOURNAL OF HEMATOLOGY & ONCOLOGY RESEARCH Angptl4 is upregulated under inflammatory conditions in the bone marrow
Schumacher et al. Journal of Hematology & Oncology (2015) 8:64 DOI 10.1186/s13045-015-0152-2 JOURNAL OF HEMATOLOGY & ONCOLOGY RESEARCH Angptl4 is upregulated under inflammatory conditions in the bone marrow
B220 CD4 CD8. Figure 1. Confocal Image of Sensitized HLN. Representative image of a sensitized HLN
 B220 CD4 CD8 Natarajan et al., unpublished data Figure 1. Confocal Image of Sensitized HLN. Representative image of a sensitized HLN showing B cell follicles and T cell areas. 20 µm thick. Image of magnification
Supplementary Information. Tissue-wide immunity against Leishmania. through collective production of nitric oxide
 Supplementary Information Tissue-wide immunity against Leishmania through collective production of nitric oxide Romain Olekhnovitch, Bernhard Ryffel, Andreas J. Müller and Philippe Bousso Supplementary
Automated and Standardized Counting of Mouse Bone Marrow CFU Assays
 Automated and Standardized Counting of Mouse Bone Marrow CFU Assays 2 Automated and Standardized Colony Counting Table of Contents 4 Colony-Forming Unit (CFU) Assays for Mouse Bone Marrow 5 Automated Assay
DEPARTMENT OF PHYSIOLOGY
 UNIVERSITY OF MEDICAL SCIENCES, ONDO DEPARTMENT OF PHYSIOLOGY BLOOD AND BODY FLUID PHYSIOLOGY LECTURER: MR A.O. AKINOLA OBJECTIVES Leukopoiesis Thrombopoiesis Leukopoiesis and Lymphopoiesis White blood
pplementary Figur Supplementary Figure 1. a.
 pplementary Figur Supplementary Figure 1. a. Quantification by RT-qPCR of YFV-17D and YFV-17D pol- (+) RNA in the supernatant of cultured Huh7.5 cells following viral RNA electroporation of respective
Supplemental Figure 1. Protein L
 Supplemental Figure 1 Protein L m19delta T m1928z T Suppl. Fig 1. Expression of CAR: B6-derived T cells were transduced with m19delta (left) and m1928z (right) to generate CAR T cells and transduction
Control GST GST-RAP. α2-mg. 170 kda. b-actin. 42 kda LRP-1
 % of max Supplementary Figure 1 Control GST GST-RP 17 kda α2-mg 42 kda b-actin Gate: CD11c+ (DCs) Gate: F4/8+ (Mfs) IgG Cd11cCre + Lrp1 fl/fl LRP-1 Supplementary figure 1. () MDCs were pretreated with
SUPPLEMENTARY INFORMATION
 doi: 1.138/nature8645 Physical coverage (x haploid genomes) 11 6.4 4.9 6.9 6.7 4.4 5.9 9.1 7.6 125 Neither end mapped One end mapped Chimaeras Correct Reads (million ns) 1 75 5 25 HCC1187 HCC1395 HCC1599
Comprehensive evaluation of human immune system reconstitution in NSG. and NSG -SGM3 mouse models toward the development of a novel ONCO-HU
 Comprehensive evaluation of human immune system reconstitution in NSG and NSG -SGM3 mouse models toward the development of a novel ONCO-HU xenograft model Aaron Middlebrook, 1 Eileen Snowden, 2 Warren
TCF3 breakpoints of TCF3-PBX1 (patients 1a 5a) and TCF3-HLF (patients 6a 9a and11a) translocations.
 and TCF3-HLF (patients 6a 9a and11a) translocations.") Supplementary Figure 1 TCF3 breakpoints of TCF3-PBX1 (patients 1a 5a) and TCF3-HLF (patients 6a 9a and11a) translocations. The CpG motifs closest to the breakpoints are highlighted in red boxes and the
Supplementary Figure 1 TCF3 breakpoints of TCF3-PBX1 (patients 1a 5a) and TCF3-HLF (patients 6a 9a and11a) translocations. The CpG motifs closest to the breakpoints are highlighted in red boxes and the
SUPPLEMENTARY INFORMATION
 doi: 10.1038/nature05883 SUPPLEMENTARY INFORMATION Supplemental Figure 1 Prostaglandin agonists and antagonists alter runx1/cmyb expression. a-e, Embryos were exposed to (b) PGE2 and (c) PGI2 (20μM) and
Supplement Figure S1. Real Time PCR analysis of mrna levels of C/EBPα and PU.1 in wild type (WT) and NQO1-null (NQO1-/-) mice.
 and NQO1-null (NQO1-/-) mice.") competes with 20S proteasome for binding with C/EBP leading to its stabilization and Relative mrna levels Supplement Figure S1. Real Time PCR analysis of mrna levels of C/EBPα and PU.1 in wild type (WT)
competes with 20S proteasome for binding with C/EBP leading to its stabilization and Relative mrna levels Supplement Figure S1. Real Time PCR analysis of mrna levels of C/EBPα and PU.1 in wild type (WT)
Formation of Blood Cells
 Hematopoiesis Lecture Objectives Name organs responsible for hematopoiesis in the fetus. List the developmental stages of hematopoiesis both prenatally and postnatally. Outline the major steps of post
Supplementary Information
 Supplementary Information Supplementary Figure 1! a! b! Nfatc1!! Nfatc1"! P1! P2! pa1! pa2! ex1! ex2! exons 3-9! ex1! ex11!!" #" Nfatc1A!!" Nfatc1B! #"!" Nfatc1C! #" DN1! DN2! DN1!!A! #A!!B! #B!!C! #C!!A!
Nature Immunology: doi: /ni Supplementary Figure 1. Transcriptional program of the TE and MP CD8 + T cell subsets.
 Supplementary Figure 1 Transcriptional program of the TE and MP CD8 + T cell subsets. (a) Comparison of gene expression of TE and MP CD8 + T cell subsets by microarray. Genes that are 1.5-fold upregulated
7SK ChIRP-seq is specifically RNA dependent and conserved between mice and humans.
 Supplementary Figure 1 7SK ChIRP-seq is specifically RNA dependent and conserved between mice and humans. Regions targeted by the Even and Odd ChIRP probes mapped to a secondary structure model 56 of the
Hematology 101. Blanche P Alter, MD, MPH, FAAP Clinical Genetics Branch Division of Cancer Epidemiology and Genetics Bethesda, MD
 Hematology 101 Blanche P Alter, MD, MPH, FAAP Clinical Genetics Branch Division of Cancer Epidemiology and Genetics Bethesda, MD Hematocrits Plasma White cells Red cells Normal, Hemorrhage, IDA, Leukemia,
Characterization of human myeloid progenitors and their differentiation
 Characterization of human myeloid progenitors and their differentiation Edvardsson, Louise 2006 Link to publication Citation for published version (APA): Edvardsson, L. (2006). Characterization of human
Type of file: PDF Title of file for HTML: Supplementary Information Description: Supplementary Figures
 Type of file: PDF Title of file for HTML: Supplementary Information Description: Supplementary Figures Type of file: MOV Title of file for HTML: Supplementary Movie 1 Description: NLRP3 is moving along
Supplementary Figure 1. BMS enhances human T cell activation in vitro in a
 Supplementary Figure 1. BMS98662 enhances human T cell activation in vitro in a concentration-dependent manner. Jurkat T cells were activated with anti-cd3 and anti-cd28 antibody in the presence of titrated
Flow cytometry leukocyte differential : a critical appraisal
 Flow cytometry leukocyte differential : a critical appraisal Francis Lacombe Flow cytometry department University Hospital of Bordeaux, Pessac, France francis.lacombe@chu-bordeaux.fr 2008 HORIBA ABX, All
Supplementary Figure 1 Chemokine and chemokine receptor expression during muscle regeneration (a) Analysis of CR3CR1 mrna expression by real time-pcr
 Analysis of CR3CR1 mrna expression by real time-pcr") Supplementary Figure 1 Chemokine and chemokine receptor expression during muscle regeneration (a) Analysis of CR3CR1 mrna expression by real time-pcr at day 0, 1, 4, 10 and 21 post- muscle injury. (b)
Supplementary Figure 1 Chemokine and chemokine receptor expression during muscle regeneration (a) Analysis of CR3CR1 mrna expression by real time-pcr at day 0, 1, 4, 10 and 21 post- muscle injury. (b)
SUPPLEMENTARY FIGURE 1
 SUPPLEMENTARY FIGURE 1 A LN Cell count (1 ) 1 3 1 CD+ 1 1 CDL lo CD hi 1 CD+FoxP3+ 1 1 1 7 3 3 3 % of cells 9 7 7 % of cells CD+ 3 1 % of cells CDL lo CD hi 1 1 % of CD+ cells CD+FoxP3+ 3 1 % of CD+ T
VUmc Basispresentatie
 Clinical diagnostic cytometry Gerrit J Schuurhuis Dept of Hematology VU University Medical Center Amsterdam, Netherlands Use of immunophenotyping at diagnosis to trace residual disease after therapy 1.
Suppl Video: Tumor cells (green) and monocytes (white) are seeded on a confluent endothelial
 and monocytes (white) are seeded on a confluent endothelial") Supplementary Information Häuselmann et al. Monocyte induction of E-selectin-mediated endothelial activation releases VE-cadherin junctions to promote tumor cell extravasation in the metastasis cascade
Supplementary Information Häuselmann et al. Monocyte induction of E-selectin-mediated endothelial activation releases VE-cadherin junctions to promote tumor cell extravasation in the metastasis cascade
Supplementary Figures
 Supplementary Figures Supplementary Fig. 1. Galectin-3 is present within tumors. (A) mrna expression levels of Lgals3 (galectin-3) and Lgals8 (galectin-8) in the four classes of cell lines as determined
IKK-dependent activation of NF-κB contributes to myeloid and lymphoid leukemogenesis by BCR-ABL1
 Supplemental Figures BLOOD/2014/547943 IKK-dependent activation of NF-κB contributes to myeloid and lymphoid leukemogenesis by BCR-ABL1 Hsieh M-Y and Van Etten RA Supplemental Figure S1. Titers of retroviral