Supplementary information
|
|
|
- Tyler Dawson
- 5 years ago
- Views:
Transcription
1 Supplementary information Intrahepatic myeloid cell-aggregates enable local CD8 + T cell expansion and successful immunotherapy against chronic viral liver infection Li- Rung Huang, Dirk Wohlleber, Florian Reisinger, Craig N. Jenne, Ru- Lin Cheng, Zeinab Abdullah, Frank A. Schildberg, Margarete Odenthal, Hans- Peter Dienes, Nico van Rooijen, Edgar Schmitt, Natalio Garbi, Michael Croft, Christian Kurts, Paul Kubes, Ulrike Protzer, Mathias Heikenwalder & Percy A. Knolle
2 Supplementary Figure 1
3 Supplementary Figure 1: T cell expansion in the liver upon TLR signaling. (a) Numbers CD CTLs and BrdU + CD CTLs in liver and spleen at d3 after transfer. CTLs were in vitro- stimulated with α- CD3 and α- CD28- coated microbeads in the presence or absence of IL- 12 p70 (5 ng/ml) before transfer (n=3 per group). (b) Fold of increase of hepatic CD CTLs in livers d3 after transfer and application of different TLR agonists compared to saline- treated mice (n=3 per group). (c) Total numbers of CD CTLs in spleens and livers at d3 after application of different doses of TLR9- L (n=3 per group). (d) Serum ALT values at different time points after CTL transfer and TLR9- L application (n=3 per group). (e) CFSE- profile of CD CTLs in spleen, liver and lung at 4 or 72hrs after transfer and TLR9- L application. Data are representative of histograms of three different mice. (f) Number of endogenous CD8 + cells in spleen and liver of mice as in (c) at d3 after application of different doses of TLR9- L. (g i) Flow sorted spleen- derived naïve CD44 low KLRG1 neg (N) or memory CD44 hi KLRG1 neg CD127 + CD8 + T cells (M) (0.6x10 6 per mouse) from CD mice were transferred into Ctrl- or TLR9- L- treated CD CD recipients fed with BrdU drinking water for 4 days. Transfer of equal number of in vitro- activated CD CTL (CTL) served as positive control. (g) At d4 after TLR9- L challenge, BrdU- incorporation by CD or CD cells in the liver of TLR9- L- treated mice. (h) Fold increase of T cells derived from transferred naïve or memory T cells. (i) Absolute number of T cells from experiments in (h). (j) Fold of change of the endogenous CD8 + T cells in the organs at d4 after FTY720 treatment (n=3 per group). NS, not significant. *P < 0.05, **P < 0.01, ***P < (unpaired Student s t- test). Data are representative of 2 independent experiments. (a d, f, h j; error bars, s.d.)
4 Supplementary Figure 2
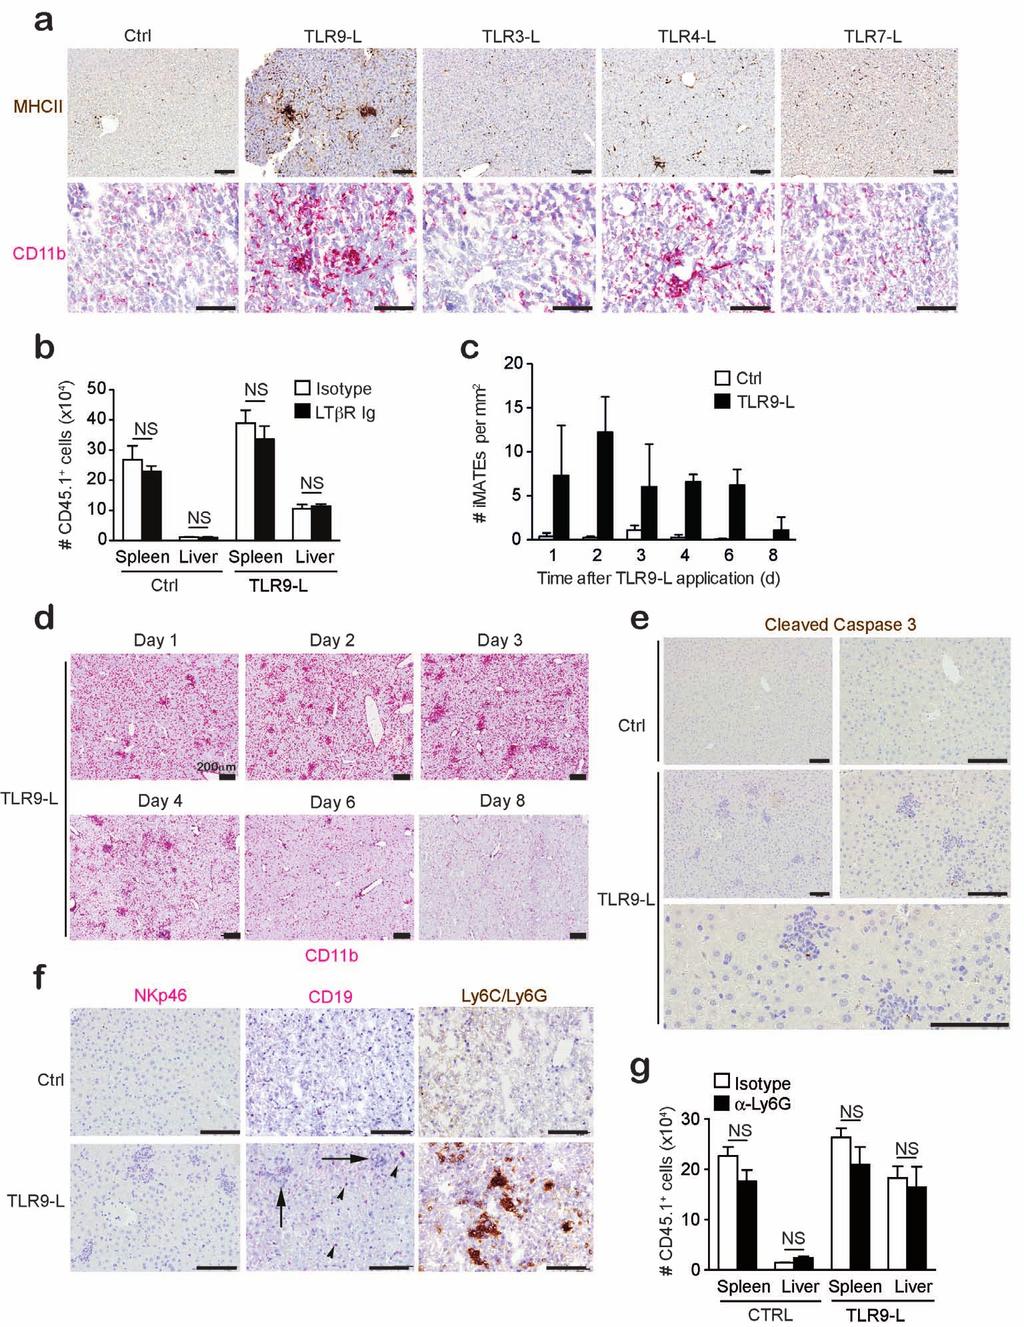
5 Supplementary Figure 2: Characteristics of imates. (a) Immunohistochemistry for MHCII and CD11b in the liver at d3 after application of TLR agonists. (b) Number of CD CTLs in different organs of TLR9- L- treated mice at d3 after daily application of LTβR Ig (100µg per mouse i.p.) or control isotype Ig. (c) Quantification of the numbers of imates at indicated time points after TLR9- L treatment. (n=3 per group per time point). (d) Immunohistochemistry for CD11b in the liver at indicated time points after TLR9- L treatment. (e) Staining for cleaved caspase 3 in liver tissue of mice at d3 after TLR9- L challenge. (f) Immunohistochemistry for NKp46, CD19 or Ly6C + Ly6G (Gr- 1) in liver tissue at d3 after TLR9- L challenge. Arrows indicate imate and arrowheads point out CD19 + cells. (g) Number of CD CTLs in spleen or liver of TLR9- L- treated mice at d3 after daily application of anti- Ly6G Ig (1A8) or isotype Ig (2A3) (d- 1- d2; 100ug per mouse i.v.) (n=3 per group). Scale bar, 100 µm. NS, not significant. *P < 0.05, **P < 0.01, ***P < (unpaired Student s t- test). Data are representative of two independent experiments with 3 mice per group. (b, c, g; error bars, s.d.)
6 Supplementary Figure 3
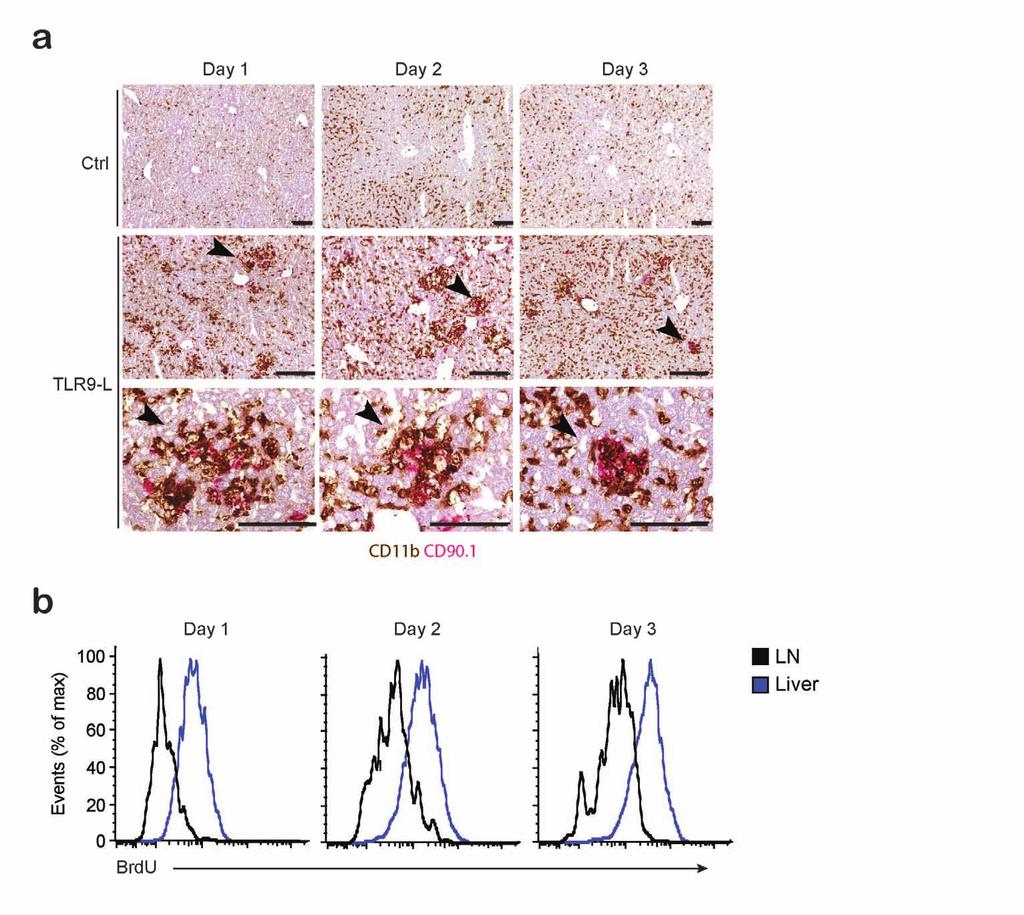
7 Supplementary Figure 3: Preferential CTL expansion in imates. (a) Immunohistochemistry for CD11b and CD90.1 in the liver of splenectomized FTY720- treated mice at indicated time points after transfer of CD CTLs and TLR9- L challenge. Mice received BrdU in drinking water (0.8 mg/ml) during the entire time of the experiment (n=3 per group per time point). Arrowheads indicate imates. (b) BrdU- incorporation in transferred CD cells from liver or lymph node (LN) of TLR9- L- treated mice as described in (a). Data are representative of two independent experiments with 3 mice per group. Scale bar, 100 µm.
8 Supplementary Figure 4
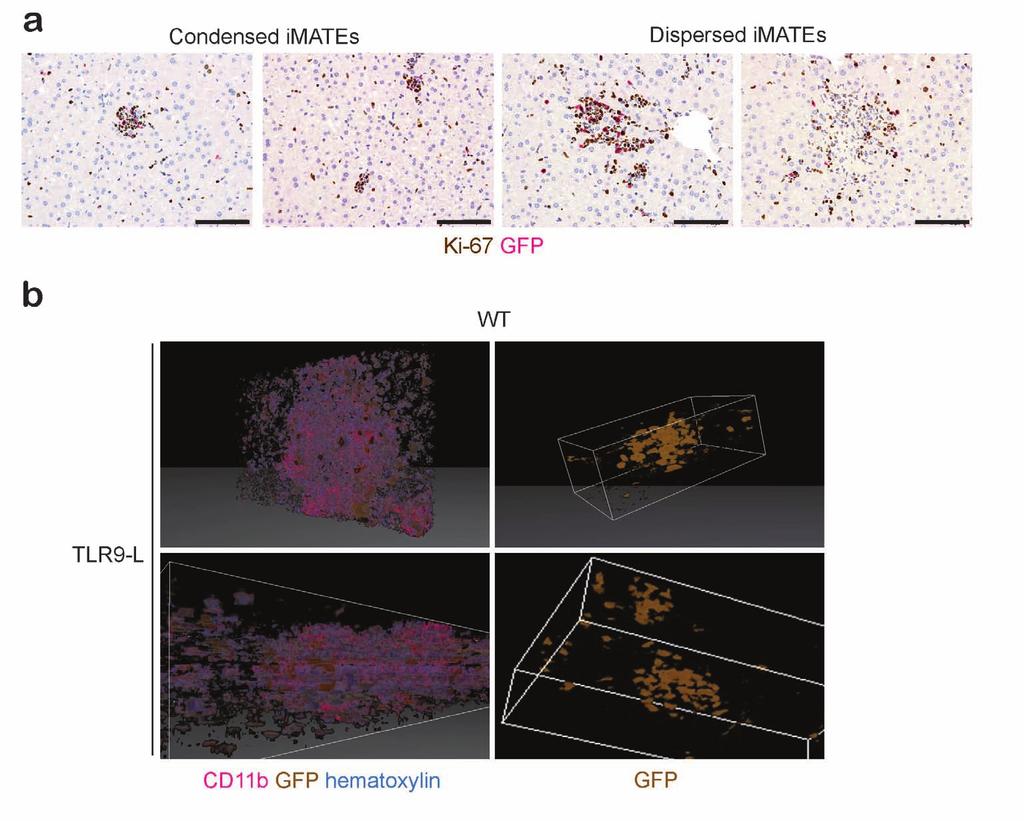
9 Supplementary Figure 4: Typical forms of imates. (a) Immunohistochemistry for GFP and Ki- 67 in the liver at d3 after TLR9- L- challenge and transfer of GFP + CTLs (3x10 6 ). Distinct forms of imates are shown: a condensed form with either few or many proliferating CTLs, a dispersed form with many proliferating CTLs and one form that was almost dissolved with hardly any Ki67 + CTLs. (b) 3D structures of imates derived from serial liver sections with immunohistochemistry for CD11b and GFP from mice treated as in (a). 3D reconstruction of imates from 30 serial sections was generated using the novel software µcore (microdimensions GmbH, München, Germany) using a Mirax Midi Slide Scanner (Carl Zeiss microimaging GmbH, München, Germany). The resultant virtual slide data was then loaded into µcore where individual sections were automatically detected and separated. A 3D reconstruction was created using image- based registration, a technique to compute a common coordinate system for two images based on the images content. Consecutive sections were registered to each other and care was taken to avoid error propagation and bad results due to micro- artifacts like folding or tears. To achieve high- quality reconstruction also on high magnification levels an initial reconstruction result on low- resolution images was propagated from low to high magnification levels inherently using the pyramidal structure of virtual slides. Volumetric information for imates was computed by using an ellipsoidal shape as an approximation. Principal axes were measured four times each in µcore resulting in means (a, b, c) and corresponding standard deviations (σ!, σ!, σ! ). Volume: V!""#$%&#' =!! πabc Total variance: σ =!! π bcσ! + acσ! + abσ!
10 Supplementary Figure 5
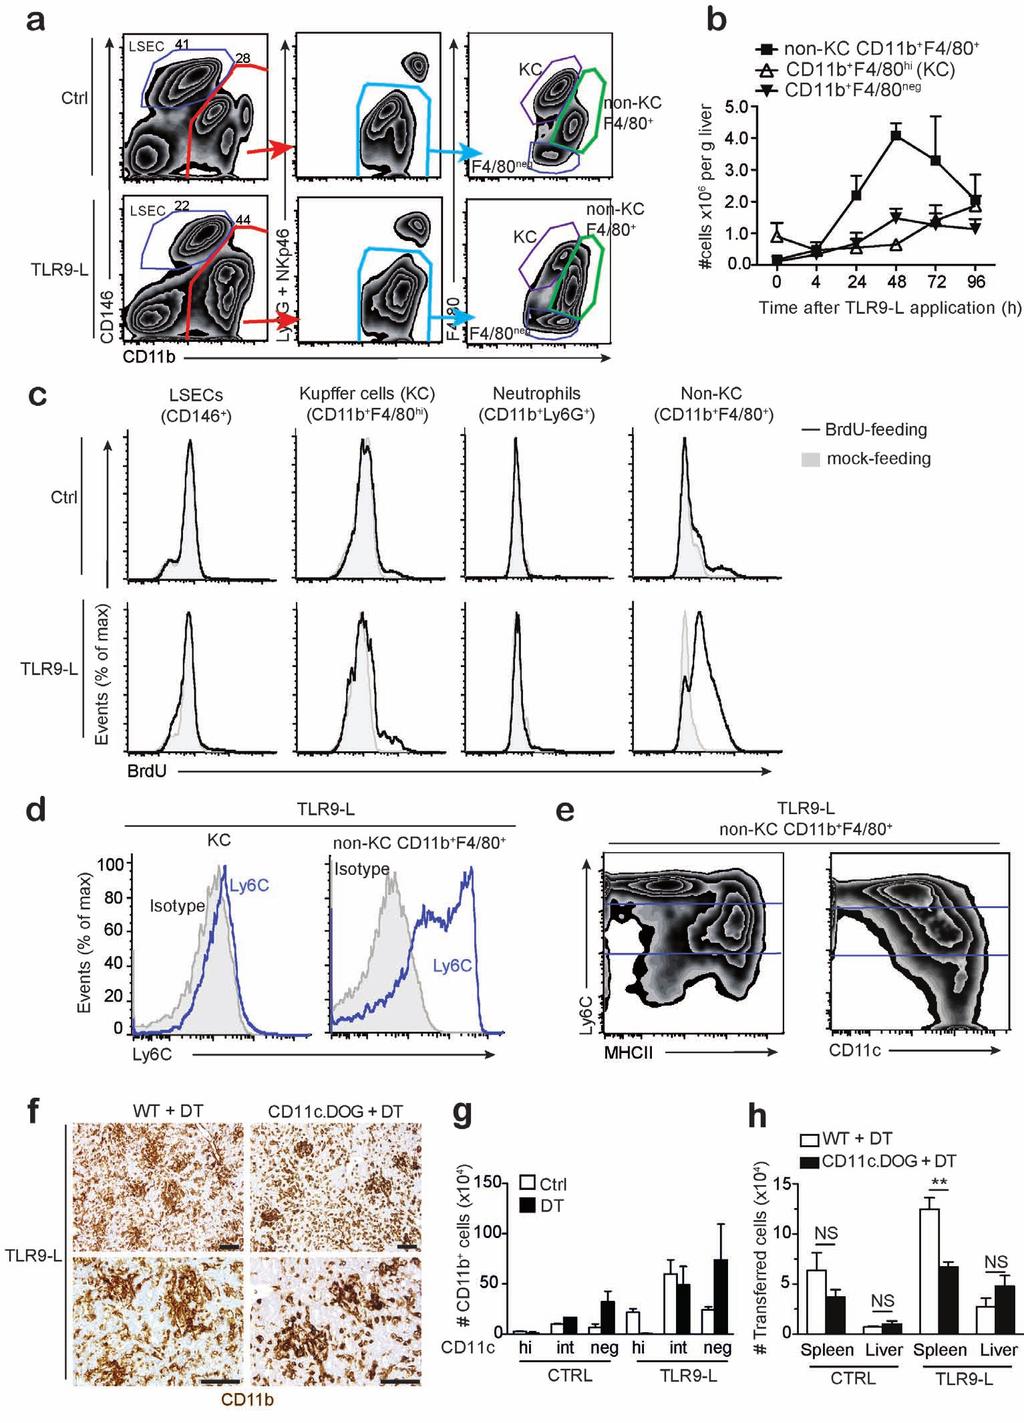
11 Supplementary Figure 5: Phenotypic and functional analysis of imate- forming cells. (a) Gating strategies for analysis of CD11b + cells in the liver at d3 after TLR9- L application. CD146 + (LSECs), NKp46 + (NK cells) and Ly6G + (neutrophils) cells were precluded from further analysis of CD11b + cells. The NKp46 - Ly6G + CD11b+ cells are further divided into Kupffer cells (F4/80 hi CD11b + ), non- KC F4/80 + CD11b + and F4/80 - CD11b + cells based on their expression levels of F4/80 and CD11b. (b) Kinetics of increase in numbers of Kupffer cells (F4/80 hi CD11b + ), non- KC F4/80 + CD11b + cells and F4/80 - CD11b + cells in liver after TLR9- L- challenge. (n=3 per time point). (c) BrdU- incorporation into the different hepatic cell populations at d3 after TLR9- L challenge. (d) Flow cytometric analysis of Ly6C expression by Kupffer cell or non- KC F4/80 + CD11b + cells from the liver of mice at d3 after TLR9- L treatment. (e) Flow cytometric analysis of Ly6C, MHC II or CD11c expression on non- KC F4/80 + CD11b + cells from the liver at d3 after TLR9- L treatment. (f) Immunohistochemistry for CD11b in the liver of wild- type (WT) or CD11c.DOG mice at d3 after TLR9- L challenge and daily treatment with diphtheria toxin (DT) (30ng/g body weight, i.p.). (g) Numbers of cells in subpopulations distinguished by different expression level of CD11c in non- KC F4/80 + CD11b + cells in the liver at d3 after TLR9- L challenge ± DT application (n=2 per group). (h) CTL expansion in the liver of wild- type or CD11c- DOG mice (C57BL/6N) at d3 after transfer of CFSE- labeled CTLs (C57BL/6N), TLR9- L challenge and daily DT treatment (n=3 per group). All the data are representative of two independent experiments. NS, not significant. *P < 0.05, **P < 0.01, ***P < (unpaired Student s t- test). (b, g, h; error bars, s.d.)
12 Supplementary Figure 6
13 Supplementary Figure 6: Relevance of OX40L for CTL expansion in the liver. (a) Flow cytometric analysis of CD28 and OX40 expression by freshly isolated naïve CD8 + T cells or CTLs after in vitro stimulation with anti- CD3 + anti- CD28 microbeads in the presence IL- 12p70 (5ng/mL). (b) 1:1 Ratio of CFSE- labeled wild- type CTLs (WT, CD ) and OX40 / (KO, CD ) CTLs before adoptive transfer into WT or Cd80- Cd86- DKO recipients. Before transfer, CTLs were CFSE- labeled (2µM) to allow in vivo tracking and detection of proliferation. (c) Dot plots showing percentage of WT or OX40 / CTLs among total CD8 + T cells in spleen or liver in WT mice at d3 after transfer and TLR9- L application. CFSE dilution profile of transferred CTLs shown in histograms. (d) Dot plots showing percentage of WT or OX40 / CTLs among total CD8 + T cells in spleen or liver of Cd80- Cd86- DKO mice at d3 after transfer and TLR9- L application. CFSE dilution profile of transferred CTLs shown in histograms. Data are representative of two independent experiments with 3 mice per group.
 Immunohistochemistry for CD11b + and CD8 + or Ki- 67 + and CD8 + cells in the liver at d9 after acute LCMV infection (2x10 4 pfu per mouse).")
14 Supplementary Figure 7 Supplementary Figure 7: Relevance of CCR2 + cells for control of acute LCMV infection. (a) Immunohistochemistry for CD11b + and CD8 + or Ki and CD8 + cells in the liver at d9 after acute LCMV infection (2x10 4 pfu per mouse). (b) Time kinetics of LCMV titers in blood of CCR2- CFP- DTR mice (TG) or non- transgenic littermates (Non- TG) after LCMV infection ± DT treatment (n=3-4 per group). Data are representative of 2 experiments. (b; error bars, s.d.)
15 Legends to supplementary video files Supplementary Video 1. & 2: Hepatic microvasculature and uptake of TLR9- L by sinusoidal cells. Liver intravital spinning- disc confocal microscopy in C57BL/6 mice at directly after TLR9- L treatment (10 µg per mouse i.v.). Mice were treated with anti- Ly6G 24h before imaging to eliminate CD11b + neutrophils from the circulation. TLR9- L was taken up by sinusoidal cells within 10 minutes after application (Video 1). There are few round CD11b + cells crawling or floating in sinusoids (Video 2). CD11b + cells are labeled with FITC- conjugated anti- CD11b (green); Kupffer cells labeled with PerCp- Cy5.5- conjugated anti- F4/80 (pink); TLR9- L labeled with Cy5 (blue); neutrophils (if remaining) labeled with PE- conjugated anti- Ly6G (red). Scale bars: 80 µm (video 1); 40 µm (video 2). Supplementary Video 3. & 4: Circulating CD11b + cells adhere in sinusoids after TLR9- L application. Liver imaging at 4h after receiving the same treatment as mentioned above. Increase in F4/80 - CD11b + cells appearing in sinusoids at 4h after TLR9- L application (Video 3). F4/80 - CD11b + cells firmly adhere to hepatic sinusoids but sinusoidal perfusion remains intact (Video 4). Scale bars: 80 µm (video 3); 40 µm (video 4). Supplementary Video 5 to 8: CD11b + cells form non- perfused structures, imates. At 24h after TLR9- L injection, F4/80 - CD11b + cells recruited from the blood but not F4/80 hi Kupffer cells form a non- perfused cell cluster (Video 5). At high magnification it is apparent that F4/80 - CD11b + cells firmly adhere within sinusoids and block sinusoidal blood perfusion; non- perfused areas can be identified by focusing at sinusoidal cells that have taken up fluorochrome- labeled TLR9- L (in blue), i.e. previously perfused areas (Video 6). At 48h, imates have grown in size and are still not perfused (Video 7 & 8). Scale bars: 80 µm (video 5 & 7); 40 µm (video 6 & 8). Supplementary Video 9: CD8 + T cells migrate slowly within imates. Transferred CD CD8 + T cells as well as endogenous CD8 + T cells were retained in imates and
16 migrated slowly within imates. CD11b + cells labeled with FITC- conjugated anti- CD11b (green); CD8 + T cells (both endogenous and transferred CD8 + T) labeled with PE- conjugated anti- CD8α (red); transferred CD8 + T cells labeled with allophycocyanin- conjugated anti- CD45.1 (blue); Kupffer cells labeled with Cy7- conjugated anti- F4/80 (pink). Scale bar: 80 µm. Supplementary Video 10-12: 3D structures of imates. 3D reconstruction of serial liver sections subjected to immunohistochemistry for detection of CD11b + cells (pink) and GFP + CTLs (brown) showing the different forms of imates.
Supplementary Information. Tissue-wide immunity against Leishmania. through collective production of nitric oxide
 Supplementary Information Tissue-wide immunity against Leishmania through collective production of nitric oxide Romain Olekhnovitch, Bernhard Ryffel, Andreas J. Müller and Philippe Bousso Supplementary
Supplementary Figure 1. Characterization of basophils after reconstitution of SCID mice
 Supplementary figure legends Supplementary Figure 1. Characterization of after reconstitution of SCID mice with CD4 + CD62L + T cells. (A-C) SCID mice (n = 6 / group) were reconstituted with 2 x 1 6 CD4
SUPPLEMENTARY INFORMATION
 doi:10.1038/nature10134 Supplementary Figure 1. Anti-inflammatory activity of sfc. a, Autoantibody immune complexes crosslink activating Fc receptors, promoting activation of macrophages, and WWW.NATURE.COM/NATURE
SUPPLEMENTARY INFORMATION
 doi:1.138/nature1554 a TNF-α + in CD4 + cells [%] 1 GF SPF 6 b IL-1 + in CD4 + cells [%] 5 4 3 2 1 Supplementary Figure 1. Effect of microbiota on cytokine profiles of T cells in GALT. Frequencies of TNF-α
Supplementary Materials for
 www.sciencemag.org/content/348/6241/aaa825/suppl/dc1 Supplementary Materials for A mucosal vaccine against Chlamydia trachomatis generates two waves of protective memory T cells Georg Stary,* Andrew Olive,
Endogenous TNFα orchestrates the trafficking of neutrophils into and within lymphatic vessels during acute inflammation
 SUPPLEMENTARY INFORMATION Endogenous TNFα orchestrates the trafficking of neutrophils into and within lymphatic vessels during acute inflammation Samantha Arokiasamy 1,2, Christian Zakian 1, Jessica Dilliway
Hua Tang, Weiping Cao, Sudhir Pai Kasturi, Rajesh Ravindran, Helder I Nakaya, Kousik
 SUPPLEMENTARY FIGURES 1-19 T H 2 response to cysteine-proteases requires dendritic cell-basophil cooperation via ROS mediated signaling Hua Tang, Weiping Cao, Sudhir Pai Kasturi, Rajesh Ravindran, Helder
Type of file: PDF Title of file for HTML: Supplementary Information Description: Supplementary Figures
 Type of file: PDF Title of file for HTML: Supplementary Information Description: Supplementary Figures Type of file: MOV Title of file for HTML: Supplementary Movie 1 Description: NLRP3 is moving along
Supplementary Figure 1 Chemokine and chemokine receptor expression during muscle regeneration (a) Analysis of CR3CR1 mrna expression by real time-pcr
 Analysis of CR3CR1 mrna expression by real time-pcr") Supplementary Figure 1 Chemokine and chemokine receptor expression during muscle regeneration (a) Analysis of CR3CR1 mrna expression by real time-pcr at day 0, 1, 4, 10 and 21 post- muscle injury. (b)
Supplementary Figure 1 Chemokine and chemokine receptor expression during muscle regeneration (a) Analysis of CR3CR1 mrna expression by real time-pcr at day 0, 1, 4, 10 and 21 post- muscle injury. (b)
SUPPLEMENTARY INFORMATION
 1. Supplementary Figures and Legends Supplementary Fig. 1. S1P-mediated transcriptional regulation of integrins expressed in OP/monocytoid cells. Real-time quantitative PCR analyses of mrna for two integrins,
Supplementary Figure 1. Nature Neuroscience: doi: /nn.4547
 Supplementary Figure 1 Characterization of the Microfetti mouse model. (a) Gating strategy for 8-color flow analysis of peripheral Ly-6C + monocytes from Microfetti mice 5-7 days after TAM treatment. Living
Supplemental Figure 1. Signature gene expression in in vitro differentiated Th0, Th1, Th2, Th17 and Treg cells. (A) Naïve CD4 + T cells were cultured
 Naïve CD4 + T cells were cultured") Supplemental Figure 1. Signature gene expression in in vitro differentiated Th0, Th1, Th2, Th17 and Treg cells. (A) Naïve CD4 + T cells were cultured under Th0, Th1, Th2, Th17, and Treg conditions. mrna
Supplemental Figure 1. Signature gene expression in in vitro differentiated Th0, Th1, Th2, Th17 and Treg cells. (A) Naïve CD4 + T cells were cultured under Th0, Th1, Th2, Th17, and Treg conditions. mrna
Supplementary Figure S1. Flow cytometric analysis of the expression of Thy1 in NH cells. Flow cytometric analysis of the expression of T1/ST2 and
 Supplementary Figure S1. Flow cytometric analysis of the expression of Thy1 in NH cells. Flow cytometric analysis of the expression of T1/ST2 and Thy1 in NH cells derived from the lungs of naïve mice.
% of live splenocytes. STAT5 deletion. (open shapes) % ROSA + % floxed
 % ROSA + % floxed") Supp. Figure 1. a 14 1 1 8 6 spleen cells (x1 6 ) 16 % of live splenocytes 5 4 3 1 % of live splenocytes 8 6 4 b 1 1 c % of CD11c + splenocytes (closed shapes) 8 6 4 8 6 4 % ROSA + (open shapes) % floxed
Supp. Figure 1. a 14 1 1 8 6 spleen cells (x1 6 ) 16 % of live splenocytes 5 4 3 1 % of live splenocytes 8 6 4 b 1 1 c % of CD11c + splenocytes (closed shapes) 8 6 4 8 6 4 % ROSA + (open shapes) % floxed
Nature Medicine: doi: /nm.3922
 Title: Glucocorticoid-induced tumor necrosis factor receptor-related protein co-stimulation facilitates tumor regression by inducing IL-9-producing helper T cells Authors: Il-Kyu Kim, Byung-Seok Kim, Choong-Hyun
Supplemental Table 1. Primer sequences for transcript analysis
 Supplemental Table 1. Primer sequences for transcript analysis Primer Sequence (5 3 ) Primer Sequence (5 3 ) Mmp2 Forward CCCGTGTGGCCCTC Mmp15 Forward CGGGGCTGGCT Reverse GCTCTCCCGGTTTC Reverse CCTGGTGTGCCTGCTC
Chronic variable stress activates hematopoietic stem cells
 SUPPLEMENTARY INFORMATION Chronic variable stress activates hematopoietic stem cells Timo Heidt *, Hendrik B. Sager *, Gabriel Courties, Partha Dutta, Yoshiko Iwamoto, Alex Zaltsman, Constantin von zur
Suppl Video: Tumor cells (green) and monocytes (white) are seeded on a confluent endothelial
 and monocytes (white) are seeded on a confluent endothelial") Supplementary Information Häuselmann et al. Monocyte induction of E-selectin-mediated endothelial activation releases VE-cadherin junctions to promote tumor cell extravasation in the metastasis cascade
Supplementary Information Häuselmann et al. Monocyte induction of E-selectin-mediated endothelial activation releases VE-cadherin junctions to promote tumor cell extravasation in the metastasis cascade
Supplementary Figure 1. Double-staining immunofluorescence analysis of invasive colon and breast cancers. Specimens from invasive ductal breast
 Supplementary Figure 1. Double-staining immunofluorescence analysis of invasive colon and breast cancers. Specimens from invasive ductal breast carcinoma (a) and colon adenocarcinoma (b) were staining
Supplementary Figure S1. PTPN2 levels are not altered in proliferating CD8+ T cells. Lymph node (LN) CD8+ T cells from C57BL/6 mice were stained with
 CD8+ T cells from C57BL/6 mice were stained with") Supplementary Figure S1. PTPN2 levels are not altered in proliferating CD8+ T cells. Lymph node (LN) CD8+ T cells from C57BL/6 mice were stained with CFSE and stimulated with plate-bound α-cd3ε (10µg/ml)
Supplementary Figure S1. PTPN2 levels are not altered in proliferating CD8+ T cells. Lymph node (LN) CD8+ T cells from C57BL/6 mice were stained with CFSE and stimulated with plate-bound α-cd3ε (10µg/ml)
W/T Itgam -/- F4/80 CD115. F4/80 hi CD115 + F4/80 + CD115 +
 F4/8 % in the peritoneal lavage 6 4 2 p=.15 n.s p=.76 CD115 F4/8 hi CD115 + F4/8 + CD115 + F4/8 hi CD115 + F4/8 + CD115 + MHCII MHCII Supplementary Figure S1. CD11b deficiency affects the cellular responses
B220 CD4 CD8. Figure 1. Confocal Image of Sensitized HLN. Representative image of a sensitized HLN
 B220 CD4 CD8 Natarajan et al., unpublished data Figure 1. Confocal Image of Sensitized HLN. Representative image of a sensitized HLN showing B cell follicles and T cell areas. 20 µm thick. Image of magnification
IL-34 is a tissue-restricted ligand of CSF1R required for the development of Langerhans cells and microglia
 Supplementary Figures IL-34 is a tissue-restricted ligand of CSF1R required for the development of Langerhans cells and microglia Yaming Wang, Kristy J. Szretter, William Vermi, Susan Gilfillan, Cristina
Supplementary Figure 1 Protease allergens induce IgE and IgG1 production. (a-c)
") 1 Supplementary Figure 1 Protease allergens induce IgE and IgG1 production. (a-c) Serum IgG1 (a), IgM (b) and IgG2 (c) concentrations in response to papain immediately before primary immunization (day
1 Supplementary Figure 1 Protease allergens induce IgE and IgG1 production. (a-c) Serum IgG1 (a), IgM (b) and IgG2 (c) concentrations in response to papain immediately before primary immunization (day
Supplementary Table 1
 Supplementary Table 1 Flow Cytometry Antibodies Antibody Fluorochrome Clone Vendor CD45 PE-cyanine 7 30-F11 D ioscience CD3 Pacific lue 17A2 iolegend (San Diego, CA) CD11b APC M1/70 iolegend (San Diego,
Figure S1 Generation of γ-gt DTR transgenic mice. (A) Schematic construct of the transgene. (B)
 Schematic construct of the transgene. (B)") Figure S1 Generation of γ-gt DTR transgenic mice. (A) Schematic construct of the transgene. (B) PCR identified expected hhb-egf band (left panel) and HA tag band (right) in kidneys of transgenic (TG) mice
Figure S1 Generation of γ-gt DTR transgenic mice. (A) Schematic construct of the transgene. (B) PCR identified expected hhb-egf band (left panel) and HA tag band (right) in kidneys of transgenic (TG) mice
In Vivo Imaging of Virological Synapses
 In Vivo Imaging of Virological Synapses Xaver Sewald 1, David G. Gonzalez 2, Ann M. Haberman 2, and Walther Mothes 1 * 1 Department of Microbial Pathogenesis, Yale University School of Medicine, New Haven,
a surface permeabilized
 a surface permeabilized RAW 64.7 P388D1 J774 b CD11b + Ly-6G - Blood Monocytes WT Supplementary Figure 1. Cell surface expression on macrophages and DCs. (a) RAW64.7, P388D1, and J774 cells were subjected
PHENOTYPIC DYNAMICS OF MICROGLIAL AND MONOCYTE-DERIVED CELLS IN GLIOBLASTOMA-BEARING MICE.
 SUPPLEMENTARY FIGURES, TABLES AND VIDEOS PHENOTYPIC DYNAMICS OF MICROGLIAL AND MONOCYTE-DERIVED CELLS IN GLIOBLASTOMA-BEARING MICE. Clément Ricard 1,2,3,4, Aurélie Tchoghandjian 2,4, Hervé Luche 5, Pierre
NK cell flow cytometric assay In vivo DC viability and migration assay
 NK cell flow cytometric assay 6 NK cells were purified, by negative selection with the NK Cell Isolation Kit (Miltenyi iotec), from spleen and lymph nodes of 6 RAG1KO mice, injected the day before with
Interferon γ regulates idiopathic pneumonia syndrome, a. Th17 + CD4 + T-cell-mediated GvH disease
 Interferon γ regulates idiopathic pneumonia syndrome, a Th17 + CD4 + T-cell-mediated GvH disease Nora Mauermann, Julia Burian, Christophe von Garnier, Stefan Dirnhofer, Davide Germano, Christine Schuett,
SUPPLEMENTARY FIGURES
 SUPPLEMENTARY FIGURES Supplementary Figure 1: Chemokine receptor expression profiles of CCR6 + and CCR6 - CD4 + IL-17A +/ex and Treg cells. Quantitative PCR analysis of chemokine receptor transcript abundance
SUPPORTING INFORMATIONS
 SUPPORTING INFORMATIONS Mice MT/ret RetCD3ε KO α-cd25 treated MT/ret Age 1 month 3 mnths 6 months 1 month 3 months 6 months 1 month 3 months 6 months 2/87 Survival 87/87 incidence of 17/87 1 ary tumor
and follicular helper T cells is Egr2-dependent. (a) Diagrammatic representation of the
 Diagrammatic representation of the") Supplementary Figure 1. LAG3 + Treg-mediated regulation of germinal center B cells and follicular helper T cells is Egr2-dependent. (a) Diagrammatic representation of the experimental protocol for the
Supplementary Figure 1. LAG3 + Treg-mediated regulation of germinal center B cells and follicular helper T cells is Egr2-dependent. (a) Diagrammatic representation of the experimental protocol for the
CD4 + T cells recovered in Rag2 / recipient ( 10 5 ) Heart Lung Pancreas
 Heart Lung Pancreas") a CD4 + T cells recovered in Rag2 / recipient ( 1 5 ) Heart Lung Pancreas.5 1 2 4 6 2 4 6 Ctla4 +/+ Ctla4 / Ctla4 / Lung Ctla4 / Pancreas b Heart Lung Pancreas Ctla4 +/+ Ctla4 / Ctla4 / Lung Ctla4 / Pancreas
a CD4 + T cells recovered in Rag2 / recipient ( 1 5 ) Heart Lung Pancreas.5 1 2 4 6 2 4 6 Ctla4 +/+ Ctla4 / Ctla4 / Lung Ctla4 / Pancreas b Heart Lung Pancreas Ctla4 +/+ Ctla4 / Ctla4 / Lung Ctla4 / Pancreas
Supplementary Figures
 Inhibition of Pulmonary Anti Bacterial Defense by IFN γ During Recovery from Influenza Infection By Keer Sun and Dennis W. Metzger Supplementary Figures d a Ly6G Percentage survival f 1 75 5 1 25 1 5 1
Supplemental Materials
 Supplemental Materials Programmed death one homolog maintains the pool size of regulatory T cells by promoting their differentiation and stability Qi Wang 1, Jianwei He 1, Dallas B. Flies 2, Liqun Luo
Therapeutic PD L1 and LAG 3 blockade rapidly clears established blood stage Plasmodium infection
 Supplementary Information Therapeutic PD L1 and LAG 3 blockade rapidly clears established blood stage Plasmodium infection Noah S. Butler, Jacqueline Moebius, Lecia L. Pewe, Boubacar Traore, Ogobara K.
sequences of a styx mutant reveals a T to A transversion in the donor splice site of intron 5
 sfigure 1 Styx mutant mice recapitulate the phenotype of SHIP -/- mice. (A) Analysis of the genomic sequences of a styx mutant reveals a T to A transversion in the donor splice site of intron 5 (GTAAC
Supplemental Figure 1
 Supplemental Figure 1 1a 1c PD-1 MFI fold change 6 5 4 3 2 1 IL-1α IL-2 IL-4 IL-6 IL-1 IL-12 IL-13 IL-15 IL-17 IL-18 IL-21 IL-23 IFN-α Mut Human PD-1 promoter SBE-D 5 -GTCTG- -1.2kb SBE-P -CAGAC- -1.kb
Tbk1-TKO! DN cells (%)! 15! 10!
! 15! 10!") a! T Cells! TKO! B Cells! TKO! b! CD4! 8.9 85.2 3.4 2.88 CD8! Tbk1-TKO! 1.1 84.8 2.51 2.54 c! DN cells (%)! 4 3 2 1 DP cells (%)! 9 8 7 6 CD4 + SP cells (%)! 5 4 3 2 1 5 TKO! TKO! TKO! TKO! 15 1 5 CD8
a! T Cells! TKO! B Cells! TKO! b! CD4! 8.9 85.2 3.4 2.88 CD8! Tbk1-TKO! 1.1 84.8 2.51 2.54 c! DN cells (%)! 4 3 2 1 DP cells (%)! 9 8 7 6 CD4 + SP cells (%)! 5 4 3 2 1 5 TKO! TKO! TKO! TKO! 15 1 5 CD8
Title of file for HTML: Supplementary Information Description: Supplementary Figures and Supplementary Table
 Title of file for HTML: Supplementary Information Description: Supplementary Figures and Supplementary Table Title of file for HTML: Peer Review File Description: Innate Scavenger Receptor-A regulates
a 10 4 Link et al. Supplementary Figure 1 Nature Immunology: doi: /ni.1842 Cells per mouse ( 10 5 ) TRPV2KO anti-gr1 anti-gr anti-f4/80
 TRPV2KO anti-gr1 anti-gr anti-f4/80") a 10 4 WT 10 4 TRPV2KO 10 3 10 3 anti-gr1 10 2 10 1 anti-gr1 10 2 10 1 10 0 10 0 10 1 10 2 10 3 10 4 anti-f4/80 42.3 45.2 10 0 10 0 10 1 10 2 10 3 10 4 anti-f4/80 10 4 10 4 40 42.5 anti-cd11b 10 3 10 2
a 10 4 WT 10 4 TRPV2KO 10 3 10 3 anti-gr1 10 2 10 1 anti-gr1 10 2 10 1 10 0 10 0 10 1 10 2 10 3 10 4 anti-f4/80 42.3 45.2 10 0 10 0 10 1 10 2 10 3 10 4 anti-f4/80 10 4 10 4 40 42.5 anti-cd11b 10 3 10 2
Eosinophils are required. for the maintenance of plasma cells in the bone marrow
 Eosinophils are required for the maintenance of plasma cells in the bone marrow Van Trung Chu, Anja Fröhlich, Gudrun Steinhauser, Tobias Scheel, Toralf Roch, Simon Fillatreau, James J. Lee, Max Löhning
Supplemental Information. CD4 + CD25 + Foxp3 + Regulatory T Cells Promote. Th17 Cells In Vitro and Enhance Host Resistance
 Immunity, Volume 34 Supplemental Information D4 + D25 + + Regulatory T ells Promote Th17 ells In Vitro and Enhance Host Resistance in Mouse andida albicans Th17 ell Infection Model Pushpa Pandiyan, Heather
Nature Immunology: doi: /ni Supplementary Figure 1. Cellularity of leukocytes and their progenitors in naive wild-type and Spp1 / mice.
 Supplementary Figure 1 Cellularity of leukocytes and their progenitors in naive wild-type and Spp1 / mice. (a, b) Gating strategies for differentiated cells including PMN (CD11b + Ly6G hi and CD11b + Ly6G
Adoptive immunotherapy induces CNS dendritic cell recruitment and antigen presentation during clearance of a persistent viral infection
 Published Online: 17 July, 2006 Supp Info: http://doi.org/10.1084/jem.20060039 Downloaded from jem.rupress.org on July 27, 2018 ARTICLE Adoptive immunotherapy induces CNS dendritic cell recruitment and
Cell isolation. Spleen and lymph nodes (axillary, inguinal) were removed from mice
 were removed from mice") Supplementary Methods: Cell isolation. Spleen and lymph nodes (axillary, inguinal) were removed from mice and gently meshed in DMEM containing 10% FBS to prepare for single cell suspensions. CD4 + CD25
Supplementary Methods: Cell isolation. Spleen and lymph nodes (axillary, inguinal) were removed from mice and gently meshed in DMEM containing 10% FBS to prepare for single cell suspensions. CD4 + CD25
Supplementary information to: Mechanism of lipopolysaccharide-induced skin edema formation in the mouse
 Supplementary information to: Mechanism of lipopolysaccharide-induced skin edema formation in the mouse Ivan Zanoni*, Renato Ostuni*, Simona Barresi, Marco Di Gioia, Achille Broggi, Barbara Costa, Roberta
Canberra, Australia). CD11c-DTR-OVA-GFP (B6.CD11c-OVA), B6.luc + and. Cancer Research Center, Germany). B6 or BALB/c.FoxP3-DTR-GFP mice were
. CD11c-DTR-OVA-GFP (B6.CD11c-OVA), B6.luc + and. Cancer Research Center, Germany). B6 or BALB/c.FoxP3-DTR-GFP mice were") Supplemental Materials and Methods Mice Female C57BL/6 (B6, I-E null, H-2 b ), BALB/c (H-2 d ) + ), FVB/N (H-2 q, I-E null, CD45.1 + ), and B6D2F1 (H-2 b/d ) mice were purchased from the Animal Resources
Supplemental Materials and Methods Mice Female C57BL/6 (B6, I-E null, H-2 b ), BALB/c (H-2 d ) + ), FVB/N (H-2 q, I-E null, CD45.1 + ), and B6D2F1 (H-2 b/d ) mice were purchased from the Animal Resources
SUPPLEMENTARY INFORMATION
 doi: 1.138/nature775 4 O.D. (595-655) 3 1 -ζ no antibody isotype ctrl Plated Soluble 1F6 397 7H11 Supplementary Figure 1 Soluble and plated anti- Abs induce -! signalling. B3Z cells stably expressing!
Serafino et al. Thymosin α1 activates complement receptor-mediated phagocytosis in human monocyte-derived macrophages. SUPPLEMENTARY FIGURES
 Supplementary Fig. S1. Evaluation of the purity and maturation of macrophage cultures tested by flow cytometry. The lymphocytic/monocytic cellular fraction was isolated from buffy coats of healthy donors
Nature Immunology: doi: /ni Supplementary Figure 1. Examples of staining for each antibody used for the mass cytometry analysis.
 Supplementary Figure 1 Examples of staining for each antibody used for the mass cytometry analysis. To illustrate the functionality of each antibody probe, representative plots illustrating the expected
Supplementary Figures
 Supplementary Figures Supplementary Figure 1. NKT ligand-loaded tumour antigen-presenting B cell- and monocyte-based vaccine induces NKT, NK and CD8 T cell responses. (A) The cytokine profiles of liver
Nature Medicine doi: /nm.3957
 Supplementary Fig. 1. p38 alternative activation, IL-21 expression, and T helper cell transcription factors in PDAC tissue. (a) Tissue microarrays of pancreatic tissue from 192 patients with pancreatic
Supplement Material. Spleen weight (mg) LN cells (X106) Acat1-/- Acat1-/- Mouse weight (g)
 LN cells (X106) Acat1-/- Acat1-/- Mouse weight (g)") Supplement Material A Spleen weight (mg) C Mouse weight (g) 1 5 1 2 9 6 3 2 5 2 1 5 Male LN cells (X16) 4 ** ** Female B 3 2 1 Supplemental Figure I. Spleen weight (A), Inguinal lymph node (LN) cell number
Supplement Material A Spleen weight (mg) C Mouse weight (g) 1 5 1 2 9 6 3 2 5 2 1 5 Male LN cells (X16) 4 ** ** Female B 3 2 1 Supplemental Figure I. Spleen weight (A), Inguinal lymph node (LN) cell number
well for 2 h at rt. Each dot represents an individual mouse and bar is the mean ±
 Supplementary data: Control DC Blimp-1 ko DC 8 6 4 2-2 IL-1β p=.5 medium 8 6 4 2 IL-2 Medium p=.16 8 6 4 2 IL-6 medium p=.3 5 4 3 2 1-1 medium IL-1 n.s. 25 2 15 1 5 IL-12(p7) p=.15 5 IFNγ p=.65 4 3 2 1
Supplemental Information. Aryl Hydrocarbon Receptor Controls. Monocyte Differentiation. into Dendritic Cells versus Macrophages
 Immunity, Volume 47 Supplemental Information Aryl Hydrocarbon Receptor Controls Monocyte Differentiation into Dendritic Cells versus Macrophages Christel Goudot, Alice Coillard, Alexandra-Chloé Villani,
Supplementary Figure 1
 Supplementary Figure 1 Identification of IFN-γ-producing CD8 + and CD4 + T cells with naive phenotype by alternative gating and sample-processing strategies. a. Contour 5% probability plots show definition
Supplementary Figures for TSC1 controls macrophage polarization to prevent inflammatory disorder by Linnan Zhu et al
 Supplementary Figures for TSC1 controls macrophage polarization to prevent inflammatory disorder by Linnan Zhu et al Suppl. Fig. 1 Tissue DN C Proteins kd TSC1-17 TSC 1 loxp bp -48-285 ctin PEMs Neutrophils
Generation of ST2-GFP reporter mice and characterization of ILC1 cells following infection
 Supplementary Figure 1 Generation of ST2-GFP reporter mice and characterization of ILC1 cells following infection with influenza virus. (a) ST2-GFP reporter mice were generated as described in Methods.
islets scored 1 week month months
 Supplementary Table 1. Sampling parameters for the morphometrical analyses Time (post- DT) Control mice (age-matched) α-cells mice pancreatic surface (mm 2 ) scored DT-treated mice islets scored mice pancreatic
Control GST GST-RAP. α2-mg. 170 kda. b-actin. 42 kda LRP-1
 % of max Supplementary Figure 1 Control GST GST-RP 17 kda α2-mg 42 kda b-actin Gate: CD11c+ (DCs) Gate: F4/8+ (Mfs) IgG Cd11cCre + Lrp1 fl/fl LRP-1 Supplementary figure 1. () MDCs were pretreated with
Supplemental Figure 1. Activated splenocytes upregulate Serpina3g and Serpina3f expression.
 Relative Serpin expression 25 2 15 1 5 Serpina3f 1 2 3 4 5 6 8 6 4 2 Serpina3g 1 2 3 4 5 6 C57BL/6 DBA/2 Supplemental Figure 1. Activated splenocytes upregulate Serpina3g and Serpina3f expression. Splenocytes
Supporting Information
 Supporting Information lpek et al. 1.173/pnas.1121217 SI Materials and Methods Mice. cell knockout, inos / (Taconic arms), Rag1 /, INγR /, and IL-12p4 / mice (The Jackson Laboratory) were maintained and/or
Supplementary Materials for
 immunology.sciencemag.org/cgi/content/full/2/16/eaan6049/dc1 Supplementary Materials for Enzymatic synthesis of core 2 O-glycans governs the tissue-trafficking potential of memory CD8 + T cells Jossef
Supplementary Figure 1. Example of gating strategy
 Supplementary Figure 1. Example of gating strategy Legend Supplementary Figure 1: First, gating is performed to include only single cells (singlets) (A) and CD3+ cells (B). After gating on the lymphocyte
Supplementary Figure 1. Efficient DC depletion in CD11c.DOG transgenic mice
 Supplementary Figure 1. Efficient DC depletion in CD11c.DOG transgenic mice (a) CD11c.DOG transgenic mice (tg) were treated with 8 ng/g body weight (b.w.) diphtheria toxin (DT) i.p. on day -1 and every
Supplementary Figure 1. Efficiency of Mll4 deletion and its effect on T cell populations in the periphery. Nature Immunology: doi: /ni.
 Supplementary Figure 1 Efficiency of Mll4 deletion and its effect on T cell populations in the periphery. Expression of Mll4 floxed alleles (16-19) in naive CD4 + T cells isolated from lymph nodes and
Liver-Resident Macrophage Necroptosis Orchestrates Type 1 Microbicidal Inflammation and Type-2- Mediated Tissue Repair during Bacterial Infection
 Liver-Resident Macrophage Necroptosis Orchestrates Type 1 Microbicidal Inflammation and Type-2- Mediated Tissue Repair during Bacterial Infection Camille Blériot, Théo Dupuis, Grégory Jouvion, Gérard Eberl,
Blocking antibodies and peptides. Rat anti-mouse PD-1 (29F.1A12, rat IgG2a, k), PD-
, PD-") Supplementary Methods Blocking antibodies and peptides. Rat anti-mouse PD-1 (29F.1A12, rat IgG2a, k), PD- L1 (10F.9G2, rat IgG2b, k), and PD-L2 (3.2, mouse IgG1) have been described (24). Anti-CTLA-4 (clone
Supplementary Methods Blocking antibodies and peptides. Rat anti-mouse PD-1 (29F.1A12, rat IgG2a, k), PD- L1 (10F.9G2, rat IgG2b, k), and PD-L2 (3.2, mouse IgG1) have been described (24). Anti-CTLA-4 (clone
Supplemental Materials for. Effects of sphingosine-1-phosphate receptor 1 phosphorylation in response to. FTY720 during neuroinflammation
 Supplemental Materials for Effects of sphingosine-1-phosphate receptor 1 phosphorylation in response to FTY7 during neuroinflammation This file includes: Supplemental Table 1. EAE clinical parameters of
Supplementary Figure 1: TSLP receptor skin expression in dcssc. A: Healthy control (HC) skin with TSLP receptor expression in brown (10x
 skin with TSLP receptor expression in brown (10x") Supplementary Figure 1: TSLP receptor skin expression in dcssc. A: Healthy control (HC) skin with TSLP receptor expression in brown (10x magnification). B: Second HC skin stained for TSLP receptor in brown
Supplementary Figure 1: TSLP receptor skin expression in dcssc. A: Healthy control (HC) skin with TSLP receptor expression in brown (10x magnification). B: Second HC skin stained for TSLP receptor in brown
SUPPLEMENTARY METHODS
 SUPPLEMENTARY METHODS Histological analysis. Colonic tissues were collected from 5 parts of the middle colon on day 7 after the start of DSS treatment, and then were cut into segments, fixed with 4% paraformaldehyde,
Supplementary Information
 Nature Immunology doi:1.138/ni.2477 Supplementary Information Capillary and arteriolar pericytes attract innate leukocytes exiting through venules and instruct them with pattern recognition and motility
pro-b large pre-b small pre-b CCCP (µm) Rag1 -/- ;33.C9HCki
 Rag1 -/- ;33.C9HCki") a TMRM FI (Median) b TMRM FI (Median) c 20 15 10 5 0 8 6 4 2 0 pro-b large pre-b small pre-b 0 10 20 30 40 50 60 70 80 90 100 TMRM (nm) pro-b large pre-b small pre-b 0 1 2 4 8 16 32 64 128 256 CCCP (mm)
a TMRM FI (Median) b TMRM FI (Median) c 20 15 10 5 0 8 6 4 2 0 pro-b large pre-b small pre-b 0 10 20 30 40 50 60 70 80 90 100 TMRM (nm) pro-b large pre-b small pre-b 0 1 2 4 8 16 32 64 128 256 CCCP (mm)
MATERIALS AND METHODS. Neutralizing antibodies specific to mouse Dll1, Dll4, J1 and J2 were prepared as described. 1,2 All
 MATERIALS AND METHODS Antibodies (Abs), flow cytometry analysis and cell lines Neutralizing antibodies specific to mouse Dll1, Dll4, J1 and J2 were prepared as described. 1,2 All other antibodies used
days days and gbt-i.cd Recipient 20
 gbt-i. GFP+ Resident memory cells: gbt-i.gfp+ Recruited memory cells: gbt-i.cd45.1+ 1 2-3 gbt-i. flu.gb sc. CD45.1+ Graft with gbt-i.gfp+ 1 Recipient 1 re- 3 36 Graft with gbt-i.gfp+ and gbt-i.cd45.1+
Nature Immunology: doi: /ni Supplementary Figure 1. Production of cytokines and chemokines after vaginal HSV-2 infection.
 Supplementary Figure 1 Production of cytokines and chemokines after vaginal HSV-2 infection. C57BL/6 mice were (a) treated intravaginally with 20 µl of PBS or infected with 6.7x10 4 pfu of HSV-2 in the
Spleen. mlns. E Spleen 4.1. mlns. Spleen. mlns. Mock 17. Mock CD8 HIV-1 CD38 HLA-DR. Ki67. Spleen. Spleen. mlns. Cheng et al. Fig.
 C D E F Mock 17 Mock 4.1 CD38 57 CD8 23.7 HLA-DR Ki67 G H I Cheng et al. Fig.S1 Supplementary Figure 1. persistent infection leads to human T cell depletion and hyper-immune activation. Humanized mice
Supporting Information
 Supporting Information Aldridge et al. 10.1073/pnas.0900655106 Fig. S1. Flow diagram of sublethal (a) and lethal (b) influenza virus infections. (a) Infection of lung epithelial cells by influenza virus
Supplemental Figure 1. IL-3 blockade with Fab CSL362 depletes plasmacytoid dendritic cells (pdcs), but not basophils, at higher doses.
, but not basophils, at higher doses.") Supplemental Figure 1. IL-3 blockade with Fab CSL362 depletes plasmacytoid dendritic cells (pdcs), but not basophils, at higher doses. Percentage of viable (A) pdcs (Sytox Blue-, Lin1-, HLADR+, BDCA2++)
Supplemental Figure 1. IL-3 blockade with Fab CSL362 depletes plasmacytoid dendritic cells (pdcs), but not basophils, at higher doses. Percentage of viable (A) pdcs (Sytox Blue-, Lin1-, HLADR+, BDCA2++)
Supplementary Figure 1. mrna expression of chitinase and chitinase-like protein in splenic immune cells. Each splenic immune cell population was
 Supplementary Figure 1. mrna expression of chitinase and chitinase-like protein in splenic immune cells. Each splenic immune cell population was sorted by FACS. Surface markers for sorting were CD11c +
SUPPLEMENTARY INFORMATION
 Supplemental Figure 1. Furin is efficiently deleted in CD4 + and CD8 + T cells. a, Western blot for furin and actin proteins in CD4cre-fur f/f and fur f/f Th1 cells. Wild-type and furin-deficient CD4 +
activation with anti-cd3/cd28 beads and 3d following transduction. Supplemental Figure 2 shows
 Supplemental Data Supplemental Figure 1 compares CXCR4 expression in untreated CD8 + T cells, following activation with anti-cd3/cd28 beads and 3d following transduction. Supplemental Figure 2 shows the
Supplementary Information:
 Supplementary Information: Follicular regulatory T cells with Bcl6 expression suppress germinal center reactions by Yeonseok Chung, Shinya Tanaka, Fuliang Chu, Roza Nurieva, Gustavo J. Martinez, Seema
Reviewers' Comments: Reviewer #1 (Remarks to the Author)
") Reviewers' Comments: Reviewer #1 (Remarks to the Author) The manuscript by Zhuang and colleagues characterizes in depth the phenotype, origin and role of mononuclear phagocytes infiltrating murine cardiac
Reviewers' Comments: Reviewer #1 (Remarks to the Author) The manuscript by Zhuang and colleagues characterizes in depth the phenotype, origin and role of mononuclear phagocytes infiltrating murine cardiac
Role of Tyk-2 in Th9 and Th17 cells in allergic asthma
 Supplementary File Role of Tyk-2 in Th9 and Th17 cells in allergic asthma Caroline Übel 1*, Anna Graser 1*, Sonja Koch 1, Ralf J. Rieker 2, Hans A. Lehr 3, Mathias Müller 4 and Susetta Finotto 1** 1 Laboratory
SUPPLEMENT Supplementary Figure 1: (A) (B)
 (B)") SUPPLEMENT Supplementary Figure 1: CD4 + naïve effector T cells (CD4 effector) were labeled with CFSE, stimulated with α-cd2/cd3/cd28 coated beads (at 2 beads/cell) and cultured alone or cocultured with
SUPPLEMENT Supplementary Figure 1: CD4 + naïve effector T cells (CD4 effector) were labeled with CFSE, stimulated with α-cd2/cd3/cd28 coated beads (at 2 beads/cell) and cultured alone or cocultured with
Supporting Information
 Supporting Information Desnues et al. 10.1073/pnas.1314121111 SI Materials and Methods Mice. Toll-like receptor (TLR)8 / and TLR9 / mice were generated as described previously (1, 2). TLR9 / mice were
The toll-like receptor 4 ligands Mrp8 and Mrp14 play a critical role in the development of autoreactive CD8 + T cells
 1 SUPPLEMENTARY INFORMATION The toll-like receptor 4 ligands Mrp8 and Mrp14 play a critical role in the development of autoreactive CD8 + T cells Karin Loser 1,2,6, Thomas Vogl 2,3, Maik Voskort 1, Aloys
Nature Immunology: doi: /ni Supplementary Figure 1. Huwe1 has high expression in HSCs and is necessary for quiescence.
 Supplementary Figure 1 Huwe1 has high expression in HSCs and is necessary for quiescence. (a) Heat map visualizing expression of genes with a known function in ubiquitin-mediated proteolysis (KEGG: Ubiquitin
<10. IL-1β IL-6 TNF + _ TGF-β + IL-23
 3 ns 25 ns 2 IL-17 (pg/ml) 15 1 ns ns 5 IL-1β IL-6 TNF
Nature Medicine: doi: /nm.2109
 HIV 1 Infects Multipotent Progenitor Cells Causing Cell Death and Establishing Latent Cellular Reservoirs Christoph C. Carter, Adewunmi Onafuwa Nuga, Lucy A. M c Namara, James Riddell IV, Dale Bixby, Michael
Supplementary Information
 Supplementary Information GADD34-deficient mice develop obesity, nonalcoholic fatty liver disease, hepatic carcinoma and insulin resistance Naomi Nishio and Ken-ichi Isobe Department of Immunology, Nagoya
Supplementary Figure 1. Deletion of Smad3 prevents B16F10 melanoma invasion and metastasis in a mouse s.c. tumor model.
 A B16F1 s.c. Lung LN Distant lymph nodes Colon B B16F1 s.c. Supplementary Figure 1. Deletion of Smad3 prevents B16F1 melanoma invasion and metastasis in a mouse s.c. tumor model. Highly invasive growth
ndln NK Cells (x10 3 ) Days post-infection (A/PR/8) *** *** *** Liver NK Cells (x10 4 ) Days post-infection (MCMV)
 Days post-infection (A/PR/8) *** *** *** Liver NK Cells (x10 4 ) Days post-infection (MCMV)") A mln NK Cells(x ) 6 1 * ndln NK Cells (x ) ns C Lung NK Cells(x ) 1 1 7 * D LN NK Cells (x ) 1 7 1 7 Days post-infection (A/PR/8) * * E Liver NK Cells (x ) 1 7 Days post-infection (A/PR/8) * * * 1 7 Days
A mln NK Cells(x ) 6 1 * ndln NK Cells (x ) ns C Lung NK Cells(x ) 1 1 7 * D LN NK Cells (x ) 1 7 1 7 Days post-infection (A/PR/8) * * E Liver NK Cells (x ) 1 7 Days post-infection (A/PR/8) * * * 1 7 Days
VEGFR2-Mediated Vascular Dilation as a Mechanism of VEGF-Induced Anemia and Bone Marrow Cell Mobilization
 Cell Reports, Volume 9 Supplemental Information VEGFR2-Mediated Vascular Dilation as a Mechanism of VEGF-Induced Anemia and Bone Marrow Cell Mobilization Sharon Lim, Yin Zhang, Danfang Zhang, Fang Chen,
Pearson r = P (one-tailed) = n = 9
 = n = 9") 8F4-Specific Lysis, % 1 UPN1 UPN3 8 UPN7 6 Pearson r =.69 UPN2 UPN5 P (one-tailed) =.192 4 UPN8 n = 9 2 UPN9 UPN4 UPN6 5 1 15 2 25 8 8F4, % Max MFI Supplementary Figure S1. AML samples UPN1-UPN9 show variable
8F4-Specific Lysis, % 1 UPN1 UPN3 8 UPN7 6 Pearson r =.69 UPN2 UPN5 P (one-tailed) =.192 4 UPN8 n = 9 2 UPN9 UPN4 UPN6 5 1 15 2 25 8 8F4, % Max MFI Supplementary Figure S1. AML samples UPN1-UPN9 show variable
L-selectin Is Essential for Delivery of Activated CD8 + T Cells to Virus-Infected Organs for Protective Immunity
 Cell Reports Supplemental Information L-selectin Is Essential for Delivery of Activated CD8 + T Cells to Virus-Infected Organs for Protective Immunity Rebar N. Mohammed, H. Angharad Watson, Miriam Vigar,