Regulation of virus-specific T cells in the lung during respiratory virus infections
|
|
|
- Elisabeth Knight
- 6 years ago
- Views:
Transcription

 thesis, University of Iowa, 21. http://ir.uiowa.edu/etd/83. Follow this and additional works at: http://ir.uiowa.edu/etd Part of the Microbiology Commons")
1 University of Iowa Iowa Research Online Theses and Dissertations Fall 21 Regulation of virus-specific T cells in the lung during respiratory virus infections Ross Bane Fulton University of Iowa Copyright 21 Ross Fulton This dissertation is available at Iowa Research Online: Recommended Citation Fulton, Ross Bane. "Regulation of virus-specific T cells in the lung during respiratory virus infections." PhD (Doctor of Philosophy) thesis, University of Iowa, Follow this and additional works at: Part of the Microbiology Commons
2 REGULATION OF VIRUS-SPECIFIC T CELLS IN THE LUNG DURING RESPIRATORY VIRUS INFECTIONS by Ross Bane Fulton An Abstract Of a thesis submitted in partial fulfillment of the requirements for the Doctor of Philosophy degree in Microbiology in the Graduate College of The University of Iowa December 21 Thesis Supervisor: Associate Professor Steven M. Varga
3 1 ABSTRACT The respiratory system forms a major mucosal interface with the external environment. Consequently, the respiratory tract is constantly exposed to inhaled foreign antigens, commensal microorganisms, and potential pathogens. The respiratory system has evolved a complex regulatory network designed to prevent unnecessary inflammation to harmless antigens and to limit immune-mediated damage to the fragile lung epithelium in response to infection. The lung maintains a default anti-inflammatory state that is coordinated by the respiratory epithelium, alveolar macrophages, dendritic cells, and regulatory Foxp3 + CD4 T cells (Tregs). It is likely that all of these cells influence the development of pathogen-specific T cell responses in the lung. Following infection with a respiratory virus, virus-specific CD8 T cells in the lung are inhibited in their ability to produce cytokines. Current studies suggest that this functional inactivation occurs following infection with respiratory viruses within the Paramyxoviridae family. The data presented here demonstrate that suppression of effector functions of virus-specific CD8 T cells in the lungs occurs following infection with several unrelated respiratory viruses. These results indicate that the functional inhibition of virus-specific T cell responses is not restricted to infection with viruses from the Paramyxoviridae family. Furthermore, I show data indicating that the functional inactivation of virus-specific CD8 T cells in the lungs occurs in the absence of infection. I also demonstrate for the first time that the lung environment also regulates the effector functions of virus-specific CD4 T cells. Inhibition of cytokine production by pulmonary T cells is reversible as stimulation with exogenous peptide-pulsed antigen-presenting cells rescues IFN-γ production. The inhibition of IFN-γ production by virus-specific T cells occurs in other organs such as the kidney. These data suggest that regulation of T cell cytokine production by peripheral tissues may serve as an important mechanism to prevent immunopathology and preserve normal tissue function.
4 2 Foxp3 + Tregs have been shown to inhibit conventional effector T cell responses in a large number of chronic infection models. However, their role during acute infections remains unclear. Examination of Foxp3 + Tregs during RSV infection showed that Tregs are rapidly recruited into the lungs and acquire an activated phenotype. Depletion of Foxp3 + Tregs prior to RSV infection revealed that Tregs facilitate the early recruitment of RSV-specific CD8 T cells from the draining lymph nodes to the lung and later limit the overall magnitude of the virus-specific CD8 T cell response. Depletion of Tregs increased TNF-α production by RSV-specific CD8 T cells and enhanced T-cell-mediated immunopathology. These data demonstrate that Foxp3 + Tregs play a major role in regulating CD8 T cell responses to respiratory virus infections. Collectively, the data presented here demonstrate that CD8 T cell responses to respiratory pathogens are tightly regulated within the lung environment. Abstract Approved: Thesis Supervisor Title and Department Date
5 REGULATION OF VIRUS-SPECIFIC T CELLS IN THE LUNG DURING RESPIRATORY VIRUS INFECTIONS by Ross Bane Fulton A thesis submitted in partial fulfillment of the requirements for the Doctor of Philosophy degree in Microbiology in the Graduate College of The University of Iowa December 21 Thesis Supervisor: Associate Professor Steven M. Varga
6 Graduate College The University of Iowa Iowa City, Iowa CERTIFICATE OF APPROVAL PH.D. THESIS This is to certify that the Ph.D. thesis of Ross Bane Fulton has been approved by the Examining Committee for the thesis requirement for the Doctor of Philosophy degree in Microbiology at the December 21 graduation. Thesis Committee: Steven M. Varga, Thesis Supervisor John T. Harty Thomas J. Waldschmidt Stanley Perlman Richard Roller
7 ACKNOWLEDGMENTS First, I would like to thank my thesis advisor Dr. Steve Varga for guiding me throughout the years and training me as a scientist. My thesis committee also provided excellent support and helped me through my thesis work. So thank you Dr. Harty, Dr. Perlman, Dr. Waldschmidt, and Dr. Roller for your time and dedication. Past and current lab members were also one of the largest factors in making my time here enjoyable. Dr. Matthew Olson was a great mentor and friend during my first years here in Iowa. Other fellow Varganauts that made lab worth coming to everyday include Dr. Elaine Castilow, Daniel McDermott, Stacey Hartwig, Kayla Weiss, Cory Knudson, and Paola Boggiatto. And finally, thank you to my family and my fiancé Sarah for their unending support and encouragement. ii
8 ABSTRACT The respiratory system forms a major mucosal interface with the external environment. Consequently, the respiratory tract is constantly exposed to inhaled foreign antigens, commensal microorganisms, and potential pathogens. The respiratory system has evolved a complex regulatory network designed to prevent unnecessary inflammation to harmless antigens and to limit immune-mediated damage to the fragile lung epithelium in response to infection. The lung maintains a default anti-inflammatory state that is coordinated by the respiratory epithelium, alveolar macrophages, dendritic cells, and regulatory Foxp3 + CD4 T cells (Tregs). It is likely that all of these cells influence the development of pathogen-specific T cell responses in the lung. Following infection with a respiratory virus, virus-specific CD8 T cells in the lung are inhibited in their ability to produce cytokines. Current studies suggest that this functional inactivation occurs following infection with respiratory viruses within the Paramyxoviridae family. The data presented here demonstrate that suppression of effector functions of virus-specific CD8 T cells in the lungs occurs following infection with several unrelated respiratory viruses. These results indicate that the functional inhibition of virus-specific T cell responses is not restricted to infection with viruses from the Paramyxoviridae family. Furthermore, I show data indicating that the functional inactivation of virus-specific CD8 T cells in the lungs occurs in the absence of infection. I also demonstrate for the first time that the lung environment also regulates the effector functions of virus-specific CD4 T cells. Inhibition of cytokine production by pulmonary T cells is reversible as stimulation with exogenous peptide-pulsed antigen-presenting cells rescues IFN-γ production. The inhibition of IFN-γ production by virus-specific T cells occurs in other organs such as the kidney. These data suggest that regulation of T cell cytokine production by peripheral tissues may serve as an important mechanism to prevent immunopathology and preserve normal tissue function. iii
9 Foxp3 + Tregs have been shown to inhibit conventional effector T cell responses in a large number of chronic infection models. However, their role during acute infections remains unclear. Examination of Foxp3 + Tregs during RSV infection showed that Tregs are rapidly recruited into the lungs and acquire an activated phenotype. Depletion of Foxp3 + Tregs prior to RSV infection revealed that Tregs facilitate the early recruitment of RSV-specific CD8 T cells from the draining lymph nodes to the lung and later limit the overall magnitude of the virus-specific CD8 T cell response. Depletion of Tregs increased TNF-α production by RSV-specific CD8 T cells and enhanced T-cell-mediated immunopathology. These data demonstrate that Foxp3 + Tregs play a major role in regulating CD8 T cell responses to respiratory virus infections. Collectively, the data presented here demonstrate that CD8 T cell responses to respiratory pathogens are tightly regulated within the lung environment. iv
10 TABLE OF CONTENTS LIST OF TABLES... viii LIST OF FIGURES... ix LIST OF ABBREVIATIONS... xi CHAPTER I. GENERAL INTRODUCTION...1 Respiratory syncytial virus...1 Regulation of lung homeostasis by the innate immune system...1 Airway epithelial cells...2 Dendritic cells...3 Alveolar macrophages...4 Regulatory T cell subsets...4 Regulatory CD8 T cells...5 IL-1-producing Foxp3 - CD4 T cells...7 Regulatory Foxp3 + CD4 T cells...8 The role of Tregs in immune system homeostasis...9 Tregs and infectious disease...1 Mechanisms of Treg Regulation...11 Control of Treg-mediated suppression...17 Activation of Tregs...2 Natural vs. Adaptive Tregs...23 Thesis Objectives...26 CHAPTER II. REGULATION OF CYTOKINE PRODUCTION BY VIRUS- SPECIFIC CD8 T CELLS IN THE LUNG...29 Abstract...29 Introduction...29 Materials and Methods...31 Mice...31 Virus propagation and infection of mice...31 Tissue isolation and preparation...32 T cell stimulation and cell staining...33 Tetramer staining...34 Adoptive transfer of TCR transgenic T cells...34 In vitro restimulation and cytokine ELISA...35 Transwell experiments...36 In vivo cytotoxicity assay...37 Data analysis...37 Results...38 Altered cytokine production by virus-specific CD8 T cells in the lung following acute pulmonary virus infection...38 Cytokine-producing CD8 T cells in the lung exhibit reduced degranulation...41 Exogenous peptide-pulsed APC are able to rescue cytokine production...42 Failure of pulmonary LCMV-specific TCR transgenic CD8 T cells to produce cytokines following direct ex vivo peptide stimulation...43 v
11 Pulmonary CD8 T cells produce less total IFN-γ than splenic CD8 T cells...45 Reduced cytokine production by pulmonary CD4 T cells...45 Direct cross-linking of the T cell receptor does not rescue IFN-γ production...47 Ex vivo inhibition of cytokine production by pulmonary CD8 T cells occurs via a contact-dependent mechanism...47 Pulmonary CD8 T cells exhibit decreased in vivo cytolytic function compared to splenic CD8 T cells...48 The lung environment inhibits cytokine production by CD8 T cells...49 Regulation of cytokine production by LCMV-specific CD8 T cells in various tissues...5 Discussion...51 CHAPTER III. FOXP3 + CD4 REGULATORY T CELLS LIMIT PULMONARY IMMUNOPATHOLOGY BY MODULATING THE CD8 T CELL RESPONSE DURING RESPIRATORY SYNCYTIAL VIRUS INFECTION...89 Abstract...89 Introduction...9 Materials and Methods...92 Viruses and infection of mice...92 Tissue isolation and preparation...92 Cell Surface Staining...93 Tetramer staining...93 Intracellular staining and BrdU...94 In vivo depletion of T cells...94 Peptide stimulation...95 Measurement of morbidity and airway resistance...95 Plaque assays...96 Histology...96 Data analysis...97 Results...97 Foxp3 + Tregs rapidly accumulate in the lungs and medlns during RSV infection...97 Proliferation of Foxp3 + Tregs during RSV infection...99 CD25 expression by Foxp3 + Tregs during RSV infection...1 Pulmonary Tregs acquire an activated phenotype during RSV infection...1 Pulmonary Tregs modulate trafficking molecules during infection...11 Depletion of Tregs delays virus clearance...12 Depletion of CD25 + Tregs delays the recruitment of RSV-specific CD8 T cells into the lung...13 Tregs limit disease severity during RSV infection...14 Depletion of Tregs enhances TNF-α production by CD8 T cells...15 Depletion of Tregs enhances T cell-mediated immunopathology...16 Discussion...17 CHAPTER IV. GENERAL DISCUSSION Mechanisms inhibiting the effector functions by pulmonary virusspecific CD8 T cells Activation of Foxp3 + Tregs during respiratory virus infections...15 vi
12 Treg regulation of the T cell response Delayed recruitment of virus-specific CD8 T cells to the lungs of Treg-depleted mice T cells contribute to enhanced immunopathology in Treg-depleted mice Summary of major findings Chapter II Chapter III REFERENCES vii
13 LIST OF TABLES Table 1. Production of IFN-γ by splenic and pulmonary P14 CD8 T cells following ex vivo stimulation...73 Table 2. Production of IFN-γ by splenic and pulmonary SMARTA CD4 T cells following ex vivo stimulation...78 viii
14 LIST OF FIGURES Figure 1. Regulatory mechanisms in the lung...27 Figure 2. Diminished IFN-γ production by pulmonary CD8 T cells following acute respiratory virus infection...57 Figure 3. Ratio of IFN-γ-producing to tetramer binding cells following RSV, vacvm2, and LCMV infections...59 Figure 4. Ratio of TNF-α-producing to tetramer binding cells following RSV, vacvm2, and LCMV infections...61 Figure 5. Decreased production of IFN-γ by pulmonary CD8 T cells is a consequence of the respiratory virus infection and is not epitope dependent...63 Figure 6. Pulmonary CD8 T cells do not differentiate into Tc2 cells following RSV, vacvm2, or LCMV infection...65 Figure 7. IFN-γ-producing pulmonary CD8 T cells exhibit reduced degranulation...67 Figure 8. Presentation of peptide by exogenous APC rescues IFN-γ production by CD8 T cells recovered from the lung...69 Figure 9. LCMV TCR transgenic CD8 T cells exhibit decreased cytokine production...71 Figure 1. Pulmonary CD8 T cells produce less IFN-γ protein relative to splenic CD8 T cells...74 Figure 11. CD4 T cells also exhibit decreased cytokine production following pulmonary virus infection...76 Figure 12. Activation of T cells via anti-cd3 mab does not increase IFN-γ production by T cells...79 Figure 13. Inhibition of cytokine production by pulmonary CD8 T cells occurs via a contact-dependent mechanism...81 Figure 14. Pulmonary CD8 T cells exhibit decreased in vivo antigen-specific target lysis compared to splenic CD8 T cells...83 Figure 15. The lung environment inhibits cytokine production by CD8 T cells...85 Figure 16. Reduced cytokine production by LCMV-specific CD8 T cells in peripheral tissues following ex vivo peptide stimulation...87 Figure 17. Foxp3 + Tregs accumulate in the lungs and medlns following RSV infection ix
15 Figure 18. Foxp3 + Tregs accumulate in the lungs and medlns during IAV infection Figure 19. C57BL/6NCr mice exhibit robust Treg responses to RSV and IAV infection Figure 2. Foxp3 + Tregs proliferate in response to RSV infection Figure 21. Foxp3 + Tregs modulate CD25 expression following RSV infection Figure 22. Pulmonary Tregs acquire an activated phenotype following RSV infection Figure 23. Pulmonary Tregs modulate trafficking molecules following RSV infection Figure 24. Depletion of CD25 + Tregs prior to and following infection with RSV Figure 25. Depletion of Tregs delays virus clearance Figure 26. Total numbers of cells in the medlns, lung parenchyma, and BAL of control or Treg-depleted mice Figure 27. Decreased early recruitment of RSV-specific CD8 T cells into the lungs in Treg-depleted mice as measured by tetramer Figure 28. Decreased early recruitment of RSV-specific CD8 T cells into the lungs in Treg-depleted mice as measured by IFN-γ production Figure 29. Depletion of Tregs exacerbates the severity of RSV-induced disease Figure 3. Increased inflammation and mucus in the lungs of Treg-depleted mice Figure 31. Increased TNF-α production by virus-specific CD8 T cells in the lungs, medlns, and spleens of Treg-depleted mice Figure 32. T cells contribute to RSV-induced disease in Treg-depleted mice x
16 LIST OF ABBREVIATIONS APC Antigen presenting cell atreg Adaptive Foxp3 + Treg BAL Bronchoalveolar lavage BFA Brefeldin A BMDC Bone marrow-derived dendritic cell BrdU 5-Bromo-2'-deoxyuridine CFSE Carboxyfluorescein succinimidyl ester CRAC Ca 2+ release-activated calcium CTLA-4 Cytotoxic T lymphocyte antigen 4 DC Dendritic cell ELISA Enzyme-linked immunosorbent assay ELISPOT Enzyme-linked immunosorbent spot FCS Fetal calf serum Foxp3 Forkhead box p3 GITR Glucocorticoid-induced tumor-necrosis-factor receptor-related protein HSV Herpes simplex virus i.n. Intranasal i.p. Intraperitoneal i.v. Intravenous IAV Influenza A virus ICOS Inducible co-stimulator ICOS Inducible co-stimulator ICS Intracellular cytokine staining IDO Indoleamine 2,3-dioxygenase IFN Interferon IL Interleukin IPEX Immune dysregulation, polyendocrinopathy, enteropathy X-linked syndrome LAG-3 Lymphocyte activation gene-3 LCMV Lymphocytic choriomeningitis virus LFA-1 Lymphocyte function-associated antigen 1 LN Lymph node LPS Lipopolysaccharide mab Monoclonal antibody MCP-1 Monocyte chemotactant protein-1 MedLN Mediastinal lymph nodes MFI Geometric mean fluorescence intensity MHC Major histocompatability complex Mtb Mycobacterium tuberculosis NFAT1 Nuclear factor of activated T cells 1 NK Natural killer NRP-1 Neuropilin-1 OVA Chicken ovalbumin p.i. Post-infection PAS Periodic acid-schiff PBL Peripheral blood lymphocytes PBS Phosphate buffered saline PD-1 Programmed death-1 PDL-1 Programmed death ligand-1 PEC Peritoneal exudate cells xi
17 Penh Enhanced pause PFU Plaque forming unit PGE 2 Prostaglandin E2 PKC-θ Protein kinase C-theta PMA Phorbol myristate acetate PVA Perivascular aggregates of leukocytes RAG Recombination-activating gene RSV Respiratory syncytial virus S1P 1 Sphingosine 1-phosphate receptor 1 SP Surfactant protein SV5 Simian virus 5 TCR T cell receptor TGF-β Transforming growth factor beta TLR Toll-like receptor TNF Tumor necrosis factor Treg Regulatory T cell Vacv Vaccinia virus WT Wild-type xii
18 1 CHAPTER I GENERAL INTRODUCTION Respiratory syncytial virus Respiratory syncytial virus (RSV) is an enveloped, single-stranded negative sense RNA virus that belongs to the family Paramyxoviridae, subfamily Pneumovirinae, and genera Pneumovirus (1). Other closely related Pneumoviruses include bovine RSV, ovine RSV, and pneumonia virus of mice. RSV infection is the leading cause of severe lower respiratory tract infections in infants and young children that is characterized by the development of bronchiolitis and wheezing (2). Infection with RSV is ubiquitous with virtually every child infected by the age of 3. Reinfection is common throughout life as sterilizing immunity is never fully established. RSV infection in healthy adults usually results in mild disease. However, RSV is a major cause of virus-induced severe respiratory disease in immunocompromised adults, adults with chronic cardiopulmonary disorders, and the elderly (2). RSV annually infects ~3-7% of elderly adults resulting in >15, hospitalization per year. It has been estimated that 78% of RSV-associated mortalities occur in adults over the age of 65 with an ~8% mortality rate that results in more that 1, deaths per year in the U.S. (2, 3). RSV infections are estimated to cost as much as 1 billion dollars each year in associated health care costs (3). Regulation of lung homeostasis by the innate immune system The respiratory tract forms a major mucosal interface with the external environment that is constantly exposed to inhaled foreign antigens, commensal microorganisms, and potential pathogens. In order to identify pathogens, immune cells in the lung must constantly sample inhaled antigens. The challenge for the immune system is to discriminate between harmless commensal microorganisms or inert antigens and rare pathogens that represent a threat to the host. The immune system has evolved a
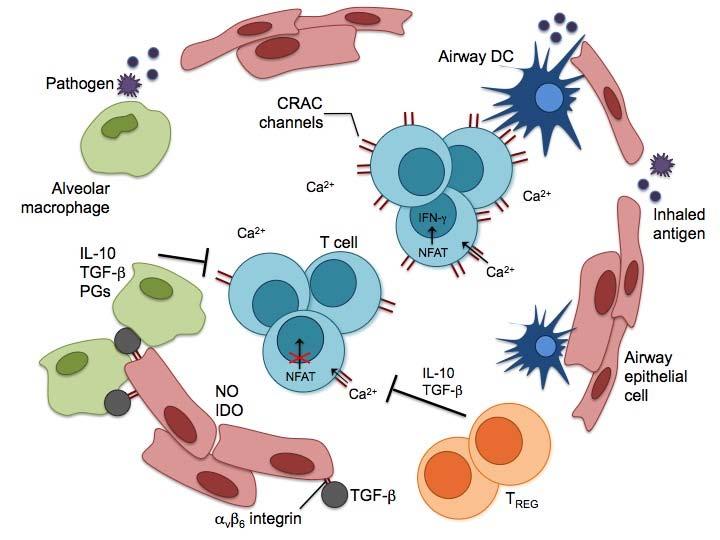
19 2 complex regulatory network designed to prevent unnecessary inflammation in response to inert antigens or commensal microorganisms that could result in excessive tissue damage without compromising host defense (4). This regulatory network includes airway epithelial cells, dendritic cells (DCs), alveolar macrophages, and regulatory T cells (Tregs) (Fig. 1). Upon exposure to a respiratory pathogen, danger signals override the default anti-inflammatory state of the lung and activate the innate and adaptive immune responses. Airway epithelial cells Airway epithelial cells are the first physical barriers against respiratory pathogens. Additionally, airway epithelial cells help maintain lung homeostasis by secreting multiple antimicrobial products such as mucins and surfactant proteins (SP). Mucins are a major component of epithelial mucus that is important in mucociliary clearance of pathogens (5, 6). SP-A and SP-D recognize and bind lipopolysaccharide (LPS) allowing them to act as opsonins for efficient phagocytosis of bacteria by macrophages, neutrophils, and DCs (7). SP-A and SP-D also recognize a variety of viruses, including RSV, influenza virus, human immunodeficiency virus, and herpes simplex virus (HSV) (7). SP-A or D can either promote an anti-inflammatory state or initiate a pro-inflammatory response (8). If the lectin domain of SP-A or D is bound to signal-inhibitory regulatory protein-α, proinflammatory signaling pathways are blocked and an anti-inflammatory state is maintained. However, if the lectin domain of SP-A or D is bound to a pathogen or host cell debris, the collagen-like region binds to the calreticulin-cd91 complex and initiates the production of inflammatory mediators. SP-A is also able to decrease Toll-like receptor (TLR) sensitivity either by blocking TLR agonists (e.g. LPS) from binding to the appropriate TLR or by inhibiting downstream TLR signaling (9). Finally, SP-A and D affect the adaptive T cell response by directly inhibiting T cell proliferation and indirectly by altering the maturation state and function of DCs, respectively (7).
20 3 Intraepithelial DCs and alveolar macrophages have close interactions with airway epithelial cells that carefully regulate their activation state. CD2, which is expressed on airway epithelia cells, is critical in maintaining immune homeostasis in the lungs (1). The CD2 receptor (CD2R) is expressed at high levels by alveolar macrophages and expression is further increased upon activation. CD2-CD2R interaction negatively regulates macrophage responsiveness to inflammatory stimuli. CD2 likely has regulatory effects on pulmonary DCs since they also express CD2R. Airway epithelial cells similarly use transforming growth factor-β (TGF-β) as yet another homeostatic mechanism. In the absence of danger signals, alveolar macrophages are locally inhibited by TGF-β that is presented by α v β 6 integrin on airway epithelial cells (11). In the absence of α v β 6 integrin, pulmonary macrophages are constitutively activated (12). Dendritic cells Intraepithelial DCs are the sentinels of the immune response to respiratory pathogens. Immature DCs constantly sample inhaled environmental antigens and migrate to the draining lymph nodes (LNs) where they present antigen-derived peptides to T cells (13, 14). Since the vast majority of inhaled antigens are harmless, the primary immunological outcome is tolerance (15, 16). Several subsets of DCs found both in the lung-draining mediastinal lymph nodes (medlns) and the lungs mediate tolerance to environmental antigens. In a model where mice were sensitized to chicken ovalbumin (OVA) via inhalation, CD8α - DCs in the draining LNs mediated T cell tolerance to OVA administered intraperitoneally (i.p.) (17). CD8α - DCs induced tolerance by producing interleukin (IL)-1 and by stimulating IL-1 production by CD4 T cells. The differentiation of tolerized OVA-specific CD4 T cells required DC co-stimulation of T cells via inducible co-stimulator (ICOS)-ligand and ICOS, respectively (18). Plasmacytoid DCs have also been shown to be crucial in establishing inhalation tolerance to environmental antigens (19). Lung-resident plasmacytoid DCs are capable of
21 4 acquiring antigen in the lungs and migrating to the draining LNs where they can mediate antigenic tolerance. Alveolar macrophages Alveolar macrophages play a major role in maintaining immune homeostasis in the lungs through their interactions with airway epithelial cells, DCs, and T cells. Alveolar macrophages make up >95% of immune cells in the steady-state airways of humans and mice where they sample inhaled antigens and sequester the majority of antigen from DCs (2, 21). Through interactions with airway epithelial cells and likely many other factors, alveolar macrophages enter an anti-inflammatory state with a high threshold for activation (22, 23). In contrast to macrophages residing within the lung parenchyma, in the absence of infection alveolar macrophages are poorly phagocytic and express lower levels of major histocompatability complex (MHC) class II and costimulatory molecules (24). Unlike respiratory DCs, alveolar macrophages do not migrate to the draining LNs to present antigen and instead regulate the activation and migration of DCs from the lung to the draining LNs (25, 26). Additionally, alveolar macrophages inhibit T cell activation through the production of nitric oxide, IL-1, prostaglandins, and TGF-β (4). However, once activated, alveolar macrophages become potent phagocytes that produce pro-inflammatory cytokines and help coordinate the ensuing innate immune response (4). Monocytes that are recruited into the lungs during an immune response exert effector functions and are not immediately re-educated by the anti-inflammatory lung environment (27). Regulatory T cell subsets In addition to regulation by the airway epithelium and the innate immune system, T cells help maintain lung homeostasis. A variety of Treg subsets have been described based on their generation, mechanisms of regulation, and the cytokines they produce (28-3). Two major subsets of CD4 Tregs can be identified by their expression of the
22 5 transcription factor forkhead box P3 (Foxp3). Within the Foxp3 + CD4 Treg subset, Tregs can be further divided into thymically derived natural Tregs and adaptive (or inducible) Tregs (atregs) that are generated from conventional CD4 T cells in the periphery (28). Foxp3 - Treg subsets include antigen-induced CD4 T cells that produce TGF-β, termed Th3 cells, and IL-1-producing CD4 T cells, termed Tr1 cells (3). Th3 cells were originally described in mice following oral tolerization to antigen (28). However, since CD4 T cells are rarely found to solely produce TGF-β, it is questionable whether this is truly a unique subset (28). CD8 Tregs have also been identified in a wide variety of disease models (31). As more CD4 and CD8 T cell subsets have been identified, it has become clear that there are many variations within each defined subset and that boundaries between these subsets are often blurred. Regulatory CD8 T cells There is ample evidence that CD8 T cells are able to suppress T cell responses in a variety of immunological settings including virus infections, tumor models, and in experimental autoimmune diseases (31). However, since the revitalization of the CD4 Treg field in 1995 by Sakaguchi et al. (32), advances in Foxp3 + CD4 Tregs have overshadowed CD8 Tregs (3, 31). Additionally, difficulties in phenotypically identifying CD8 Tregs and determining mechanisms of suppression have hampered progress (33). Furthermore, since Foxp3 + CD4 Tregs are potent regulators of the adaptive immune response, the concept of requiring a redundant CD8 Treg population has been questioned. However, recent research has begun to revitalize the CD8 Treg field. Unlike natural Foxp3 + CD4 Tregs, CD8 Tregs do not differentiate in the thymus and instead arise in the periphery in an antigen-specific manner when primed in lowinflammatory or subimmunogenic conditions. For instance, cross-presentation of antigen by apoptotic cells or introduction of antigen into immune-privileged sites such as the eye
23 6 induces CD8 Tregs that mediate immunological tolerance (31, 34). The presence or absence of co-stimulation can also result in the generation of CD8 Tregs. For example, immunization of mice with OVA and agonist anti-4-1bb monoclonal antibody (mab) induces CD8 Tregs that can suppress CD4 T cell proliferation (35, 36). CD8 Tregs that recognize self-peptides in the context of non-classical MHC class Ib molecules (HLA-E in humans and Qa-1 in mice) have been described in patients with multiple sclerosis and in mice with experimental autoimmune encephalomyelitis, a model for multiple sclerosis (37-39). CD8 Tregs generated during multiple sclerosis and experimental autoimmune encephalomyelitis can kill neuroantigen-specific CD4 T cells via peptide presented in the context of class Ib molecules (37-39). Since the expression of MHC class Ib molecules is upregulated on antigen presenting cells (APCs) and activated T cells, restriction of CD8 Treg responses to non-classical MHC molecules may focus CD8 T cell-mediated cytolysis to specific immune cells that are contributing to disease pathogenesis. Although the majority of evidence for the induction of CD8 Tregs comes from subimmunogenic conditions, a recent study showed that IL-1-producing effector CD8 T cells were induced in the lung during acute respiratory virus infection with influenza A virus (IAV) (4). Surprisingly, effector CD8 T cells in the lung were T-bet + and coproduced IL-1 and interferon (IFN)-γ. Blockade of the IL-1 receptor during IAV infection resulted in increased immune-mediated mortality suggesting that IL-1 produced by effector T cells is important in suppressing pulmonary inflammation during IAV infection. While CD8 T cells simultaneously produced IFN-γ and IL-1 ex vivo, further examination of the in vivo dynamics of cytokine production by these CD8 T cells will help explain this odd paradox. Interestingly, since IFN-γ has been shown to be necessary for the generation of CD8 Tregs and their suppressor function, IFN-γ produced by pulmonary CD8 T cells during IAV infection may actually serve an anti-inflammatory rather than a pro-inflammatory function (35, 41).
24 7 IL-1-producing Foxp3 - CD4 T cells Originally described as a Th2 cytokine, IL-1 is an anti-inflammatory and immunosuppressive cytokine that is produced by B cells, macrophages, DCs, as well as CD4 and CD8 T cells (42). The IL-1 receptor is expressed on most hematopoietic cell types and can be expressed on nonhematopoietic cells (43). The effects of IL-1 have been best documented on myeloid cells including monocytes, macrophages, and DCs where IL-1 can inhibit the production of a broad array of cytokines and chemokines, limit co-stimulatory molecule expression, and suppress cytolytic function by macrophages (29, 43). Most evidence suggests that IL-1 does not directly suppress the adaptive immune response but does so indirectly by modulating the activation of macrophages and DCs. The importance of IL-1 in maintaining immune tolerance is highlighted in IL-1-deficient mice that develop spontaneous colitis and inflammation in the lungs (44, 45). In many disease models, IL-1 is essential in limiting immunopathology in response to parasites (29, 44). In some cases, over-production of IL-1 promotes pathogen persistence by suppressing the adaptive immune response (46). CD4 T cells are an important source of IL-1. IL-1-producing CD4 T cells have been historically labeled as Tr1 cells. However, it has become increasingly clear that this characterization is insufficient since Th1, Th2, Th17, and Foxp3 + Tregs have all now been shown to be capable of producing IL-1 (44). For instance, IL-1 and IFN-γ co-producing CD4 T cells occur during infections that induce a strong Th1 response (29, 46). Such cells exist in humans chronically infected with either Mycobacterium tuberculosis (Mtb) or Borrelia burgdorferi. T-bet + Foxp3 - CD4 T cells that produce IFNγ are the primary source of IL-1 in mice acutely infected with IAV or chronically infected with Leishmania major, Toxoplasma gondii, or Trypanosoma cruzi (4, 46-48). Experiments using IFN-γ and IL-1 co-producing CD4 T cell clones indicate that whereas IFN-γ production is stably produced regardless of the activation state of the cells, IL-1 was produced much more rapidly by recently activated versus resting cells
25 8 (47). Thus, IL-1 produced by IFN-γ-producing CD4 T cells may provide negative feedback to limit the Th1 response. Alternatively, the amount of IL-1 produced by CD4 T cells during the acute stage of the infection may not be enough to counteract the effects of IFN-γ during peak production and is only suppressive when IFN-γ levels decrease. It is currently unclear if IL-1 concurrently produced by different CD4 T cell subsets has overlapping effects or if IL-1 has distinct non-overlapping effects depending on the cellular source. Regulatory Foxp3 + CD4 T cells Thymic central tolerance is designed to remove T cells expressing T cell receptors (TCRs) that recognize self too strongly (49). However, central tolerance is not perfect and autoreactive CD4 T cells that have escaped negative selection in the thymus can mediate autoimmunity. It has been known since the 198s that the adoptive transfer of CD4 + CD8 - thymocytes or peripheral CD4 T cells can prevent the development of autoimmunity (28). Within the CD4 T cell pool, depletion of CD5 high or CD45RC low cells resulted in the spontaneous activation of the remaining CD4 T cells (5, 51). These experiments demonstrated that there are autoreactive CD4 T cells that reside in the periphery and that a subpopulation of CD4 T cells is necessary to prevent their activation. A seminal study in 1995 by Sakaguchi et al. (32) revived interest in regulatory CD4 T cells. Importantly, Sakaguchi and colleagues identified the putative subset of CD5 high /CD45RC low regulatory cells as CD4 T cells constitutively expressing the IL-2Rα chain (CD25). This discovery allowed scientists to study Treg development and examine the multifaceted roles of Tregs in immune system homeostasis. A later study discovered that scurfin was the defective X-linked recessive gene in Scurfy mice, which die from CD4 T cell-mediated autoimmunity (52). The immunological and pathological similarities between Scurfy mice and humans with IPEX (immune dysregulation, polyendocrinopathy, enteropathy, X-linked syndrome), which comes from mutations in
26 9 the FOXP3 gene, led to the identification of the transcription factor Foxp3, a member of the forkhead/winged-helix family of transcription factors, as the master regulator of CD4 Treg function and development (53-55). In thymically derived natural Tregs, Foxp3 is turned on during the double positive stage and remains stably expressed in CD4 single positive thymocytes and peripheral CD4 T cells (56). Upon leaving the thymus, natural Foxp3 + Tregs are fully functional and do not require further differentiation. Foxp3 expression can also be induced in peripheral CD4 T cells under steady state conditions and during the generation of atregs, which will be discussed further below. Foxp3 expression by CD4 T cells is currently the most definitive marker for the identification of natural and atregs (28). Until recently, there was no definitive phenotypic marker to discriminate between natural and adaptive Foxp3 + CD4 Tregs. The transcription factor Helios is expressed in nearly all thymically derived Foxp3 + Tregs, but it is not expressed by antigen-specific Foxp3 + Tregs that are induced in vitro or in vivo by oral antigen (57). Thus, Helios may differentiate between the two Treg subsets. However, further validation is needed before Helios can be used as a definitive marker of atregs. In the following sections, unless otherwise stated, the term Treg will refer to Foxp3 + CD4 T cells. The role of Tregs in immune system homeostasis Natural Tregs are best known for their ability to prevent the activation of autoreactive CD4 T cells and maintain immune system homeostasis (28). However, Tregs have multifaceted roles in many other immunological settings. Tregs are vital in mediating tolerance to environmental antigens and preventing spontaneous inflammation in mucosal tissues (45). In the lungs, Tregs can prevent allergic reactions by mediating sensitization to inhaled allergens (58-6). Tregs also control the adaptive immune response to pathogens and can dictate the outcome of the infection (61). In contrast, Tregs often have a detrimental role in tumor immunology. Elimination of Tregs or
27 1 targeted deletion of the inhibitory molecule cytotoxic T lymphocyte antigen 4 (CTLA-4) in Tregs results in the clearance of tumors in mice (62-64). Due to the widespread and influential role of Tregs on the immune system, understanding how to manipulate the Treg response will have broad implications in treating immunological diseases. Tregs and infectious disease Tregs have a major role in controlling the immune response during infection. The innate and adaptive immune systems respond to infection by pathogens with a broad range of mechanisms including the production of pro-inflammatory cytokines, the recruitment of immune cells to the site of infection, and the generation of effector cells armed to clear the pathogen from the host. The immune response must be carefully balanced to promote efficient clearance of the pathogen with minimal immunopathology to the host. Too strong of a Treg response could limit the immune response at the cost of increasing pathogen-mediated disease and delaying pathogen clearance from the host (61, 65-68). Conversely, a weak Treg response can result in an overzealous immune response that can mediate excessive damage to host tissues (29). Since it is believed that natural Tregs recognize self-antigens (discussed in detail below), it seemed unlikely that Foxp3 + Tregs would have a role in regulating the immune response to infectious pathogens (61, 69). However, a study by Belkaid et al. (65) showed in a mouse model of Leishmania major infection that Tregs accumulated at the site of infection and suppressed the adaptive immune response (65). Since then, Foxp3 + Tregs have been shown to modulate the innate and adaptive immune responses to a wide variety of microbial infections including parasitic, fungal, bacterial, and viral infections (29). The overall conclusion from these studies is that Tregs limit the adaptive immune response, reduce immunopathology, and in some instances, delay pathogen clearance. Importantly, the majority of examples documenting a role for Tregs in immune responses to pathogens are from chronic infections. However, there is evidence that Tregs also play
28 11 an important role in controlling inflammation and the adaptive immune response during acute infections (7-73). In many cases Tregs delay pathogen clearance or help establish persistent infections. Tregs promote low level persistence of L. major in C57BL/6 mice by suppressing the adaptive T cell response at the site of infection via both IL-1-dependent and IL-1-independent mechanisms (65). Similarly, Plasmodium yoelii (substrain PyL) infection in BALB/c mice causes uncontrolled lethal parasitemia (67). Anti-CD25- mediated depletion of Foxp3 + Tregs prior to infection results in two distinct waves of parasitemia before the immune response clears the parasite. Interestingly, in contrast to infection with the PyL substrain, infection with the less virulent substrain PyNL induces a much weaker Treg response that does not prolong parasite clearance (74). Thus, some pathogens may use Tregs to promote their survival within the host. Similar outcomes where Tregs promote pathogen persistence in mice have been reported for infection with Mtb (66), Friend virus (75), and Litomosoides sigmodontis (76). In humans, inverse correlations between Foxp3 + Tregs and viral loads have been reported for hepatitis B virus and human T-lymphotropic virus type 1 infections (29). Mechanisms of Treg Regulation Identifying the mechanisms of suppression/regulation by Tregs has been a difficult challenge over the last decade. In vitro suppression assays were developed demonstrating that purified CD25 + CD4 T cells inhibited the proliferation of CD25 - CD4 T cells (77, 78). Since then, many different molecules have been identified that mediate Treg suppression (79). In summary, in vitro assays have shown that Tregs require TCR stimulation to become activated, but once activated they are then able to mediate bystander suppression without antigen-specificity or MHC restriction. In contrast to conventional CD4 T cells, Tregs are hypoproliferative in response to TCR stimulation. Tregs do not use immunoregulatory cytokines such as IL-1 or TGF-β and suppression
29 12 requires cell-cell contact as shown through the use of semi-permeable membranes. These in vitro studies have also identified a long list of cellular targets that are suppressed by Tregs (79). Whether Tregs suppress T cell activation directly or indirectly depends on whether soluble anti-cd3 mab and APCs are added to the in vitro culture or if platebound anti-cd3 mab is used in the complete absence of APCs. Furthermore, in vitro assays put Tregs in close proximity with cells of interest without regard for actual in vivo trafficking and localization of Tregs. Although these assays became widely accepted as a method to decipher the regulatory mechanisms used by Tregs, few regulatory pathways have been validated in vivo. It is also clear that Tregs behave and function much differently in vivo. For instance, in vivo Tregs are not anergic and proliferate in response to antigen just as well or better than conventional CD4 T cells (8). Tregs also use immunomodulatory cytokines in vivo that are not required in vitro (79). Now, one of the most important challenges in the Treg field is to sort through the vast array of potential mechanisms and cellular targets and to demonstrate which are utilized by Tregs in vivo. Since there are many other regulatory cell populations that may use similar mechanisms, approaches such as using mice with conditional deletion of genes in Foxp3 + cells are essential. Cytotoxic T lymphocyte antigen 4 CD4 Tregs uniquely express several surface molecules that likely have an important regulatory role in vivo. CTLA-4, a homolog of the co-stimulatory molecule CD28, inhibits T cell activation through several mechanisms (81). Activated T cells upregulate expression of CTLA-4 that subsequently outcompetes CD28 binding to CD8/86 (B7) on DCs and delivers inhibitory signals that are vital to inhibiting the proliferation and effector functions of activated T cells. CTLA-4 signaling through B7 on DCs can also induce production of immunosuppressive indoleamine 2,3-dioxygenase (IDO) (82, 83). Ligation of CTLA-4 on activated T cells expressing B7 can also override
30 13 TCR-dependent signals that arrest T cell motility and allow for stable T cell-apc interactions (84). Interestingly, although CTLA-4 was not implicated, two-photon intravital experiments have shown that Tregs reduce T cell-dc interactions in the draining lymph nodes following immunization (85, 86). CTLA-4 is a central mechanism used by Treg to maintain immune system homeostasis (63). Unlike Foxp3 - T cells, Tregs constitutively express CTLA-4 and further upregulate expression upon activation (87). In vitro suppression assays have shown that CTLA-4 expressed by Tregs blocks proliferation of T cells and down modulates expression of CD8 and CD86 on DCs (82). Mice with a conditional deletion of CTLA-4 in Foxp3 + cells die within 7-1 weeks from uncontrolled lymphoproliferation and systemic autoimmunity, demonstrating that CTLA-4 expressed by Tregs is required to maintain immune system homeostasis (63). Furthermore, CTLA-4-mediated immune homeostasis by Tregs is not redundant as elevated levels of CTLA-4 expression by conventional CD4 T cells (~3%) is not enough to suppress autoimmunity. However, expression of CTLA-4 by Foxp3 - cells is important since mice with Foxp3-specific deficiency in CTLA-4 survive at least 4-5 weeks longer that complete knockout mice. Mixed bone marrow chimeric mice containing bone marrow from wild-type (WT) and B7 -/- CTLA-4 -/- mice remain healthy, suggesting that Tregs can indirectly prevent the activation of autoreactive T cells by acting on APCs (88). Mice with the conditional deletion of CTLA-4 in Tregs have not been used to elucidate the relative role of CTLA-4- dependent Treg suppression of the immune response to pathogens. Other extracellular molecules involved in Treg suppression Tregs express a variety of other extracellular molecules that have primarily been implicated in Treg-mediated suppression of APCs. Lymphocyte activation gene-3 (LAG- 3) is expressed at higher levels on Tregs than conventional CD4 T cells (89). LAG-3 binds to MHC class II molecules with high affinity and induces an immunoreceptor
31 14 tyrosine-based activating motif inhibitory signaling pathway in immature DCs that prevents their activation and reduces their co-stimulatory capacity (9). Blockade of LAG-3 reduces the inhibitory capacity of Tregs both in vitro and in vivo (89). LAG-3 is not an essential mechanism used by Tregs to maintain homeostasis, though, as LAG-3- deficient mice do not develop autoimmunity (89). Unlike mice, in humans Tregs could use LAG-3 to directly suppress CD4 T cells expressing MHC class II (89). Neuropilin-1 (Nrp-1) is another surface molecule preferentially expressed by Tregs that alters the interaction between DCs and Tregs (79). Interaction between the integrin CD11a/CD18 on T cells and CD54 on DCs is vital for forming stable interactions during T cell activation (91). Nrp-1 further promotes the frequency and duration of T cell-dc contact most likely via homotypic interactions. Since Nrp-1 is expressed by the majority of Tregs but not by naïve Foxp3 - CD4 T cells, this may give Tregs a competitive advantage over naïve CD4 T cells in interacting with DCs and in responding to lower antigen levels (91). Increased interactions between Tregs and DCs could reduce the opportunity of naïve T cells to interact with DCs and also give the Treg response a head start over conventional T cells. CD39 is another regulatory molecule that is constitutively expressed by Tregs and not by Foxp3 - CD4 T cells (92). Intracellular ATP, which is at much higher concentrations than the extracellular environment, is released from damaged cells and acts as danger signal to the immune system. CD39 is an ectoenzyme that converts ATP to AMP that can be further dephosphorylated to adenosine by CD73, which is also expressed by Tregs. It has been proposed that Tregs can exert an anti-inflammatory effect on the immune response by mitigating ATP-driven danger signals. Finally, activated Tregs express latent TGF-β on their cell surface; however, most in vitro and in vivo studies suggest that TGF-β produced by Tregs is not important for suppressing the immune response and instead is important in the generation of atregs in response to infection (93). In summary, there are many possible contact-dependent
32 15 mechanisms that could be used by Tregs to regulate the quality of the interaction between naïve T cells and DCs. This approach to controlling the activation of T cells would allow Tregs to efficiently target relatively few APCs and control the initial events that are required for the activation of effector T cells. Cytokine-mediated suppression While in vitro suppression assays suggest that Tregs do not use immunomodulatory cytokines, there is strong in vivo evidence that this is not the case. IL-1 is an important inhibitory cytokine produced by Tregs at environmental interfaces. Early studies demonstrated that IL-1 produced by Tregs was required to prevent colitis upon transfer of CD45RB high CD4 T cells into lymphopenic mice (94, 95). In some cases, rather than acting as a suppressor cytokine, IL-1 may be important in Treg maintenance. In a mouse model of colitis, IL-1 produced by myeloid cells was essential for the maintenance of Foxp3 expression and thus the prevention of colitis by Tregs (96). IL-1 is also important in Treg-mediated tolerance of skin grafts (97) and in controlling allergic responses to inhaled antigens (59). In steady-state conditions, mice with IL-1 conditionally deleted in Foxp3-expressing cells develop spontaneous colitis and inflammation in the skin and lungs (45). However, in contrast to Foxp3-deficient mice or mice with a Foxp3-specific deficiency in CTLA-4, these mice do not develop systemic autoimmunity. IL-1-dependent suppression by Tregs has also been shown in a number of disease models. IL-1 is produced by Tregs in the central nervous system during experimental autoimmune encephalomyelitis and likely contributes to recovery from disease (98). IL-1 produced by Tregs also contributes to the suppression of the T cell response in the dermis of L. major-infected mice and consequently promotes persistent infection (65). Thus, IL-1 production by Tregs is influenced by the tissue environment and is important in modulating immune responses at mucosal interfaces.
33 16 IL-35 was recently identified as another suppressive cytokine produced by Tregs (99). Foxp3 targets transcription of Epstein-Barr-virus-induced gene 3 that binds to p35 (IL-12α) to form IL-35 (99, 1). IL-35 is constantly produced by Tregs at a basal level and production is increased following contact with conventional Foxp3 - CD4 T cells (11). IL-35 production by Tregs inhibits the in vitro proliferation of T cells and in vivo homeostatic proliferation of T cells in lymphopenic hosts (99). The introduction of IL- 35-producing Tregs also promotes the recovery of mice with established colitis. Since there are a limited number of studies on the inhibitory function of IL-35, it will be interesting to see if IL-35 produced by Tregs has a broad regulatory role in autoimmunity, in tolerance, and in immune responses to pathogens. Modulation of IL-2 by Tregs has been suggested as an inhibitory mechanism by Tregs. Early in vitro Treg suppression assays found that Tregs block transcription of IL- 2 in conventional CD4 T cells and thus limit their proliferation (77, 78). Given that the majority of Tregs constitutively express the IL-2Rα chain (CD25), it was also proposed that Tregs could limit the proliferation and survival of activated T cells by consuming IL- 2 (12). The in vivo relevance of these mechanisms of Treg suppression are controversial given that there is little evidence that Tregs limit IL-2 mrna in vivo and that Tregs can suppress IL-2R-deficient T cells in vivo (13). Furthermore, primary T cell responses can proceed in the absence of IL-2Rα, although this is not always the case (14). Collectively, these data suggest that IL-2 consumption by Tregs is not a primary regulatory mechanism (15). Treg cytolysis Tregs are capable of cytolysis of target cells including T cells, B cells, natural killer (NK) cells, monocytes, and DCs (79, 82). In vitro activated human CD25 high CD4 T cells express granzyme A and are capable of killing autologous T cells, CD14 + monocytes, and immature DCs (16). Treg-dependent killing is dependent on perforin
34 17 and the integrin CD18. In mice, tumor-resident Tregs can express granzyme B and may increase tumor burden by perforin-dependent cytolysis of tumor-specific effector T cells and NK cells (17). However, there is little in vivo evidence that Treg cytolysis is a common inhibitory mechanism. Control of Treg-mediated suppression Armed with a multitude of suppressive mechanisms, Tregs are important inhibitors of immune responses. Too much control by Tregs could prevent the activation of an appropriate immune response or limit an efficient response to a pathogen. There must be reversible regulation that can rapidly be tuned to provide negative feedback to Tregs. Multiple mechanisms have been described that reverse Treg-mediated suppression of effector T cells. These mechanisms include cytokines, co-stimulatory receptors, TLRs, and the strength of TCR signal received by naïve T cells (82). Cytokines and TLRs Pro-inflammatory cytokines are capable of blocking Treg suppression. A recent study demonstrated that tumor necrosis factor (TNF)-α directly inhibits Treg function by recruiting protein kinase C-θ (PKC-θ) to the immunological synapse (18). In contrast, PKC-θ recruitment to the synapse is required for conventional T cell activation. This method of Treg inhibition may have important clinical applications since PKC-θ inhibitor treatment of Tregs isolated from rheumatoid arthritis patients made Tregs resistant to TNF-α and improved in vitro suppression of responding CD4 T cells. In mice, Tregs treated with PKC-θ inhibitor were better able to provide in vivo protection from colitis. Multiple TLRs have a role in controlling Treg function. Direct signaling through TLR8 in human Tregs and TLR2 in murine Tregs can block their inhibitory functions while promoting their proliferation (19, 11). Treatment of immature DCs with TLR4 or TLR9 agonist (LPS and CpG, respectively) prior to their use in in vitro suppression assays ablated Treg inhibition of T cell proliferation (111). Reversion of suppression in
35 18 vitro did not depend on the expression of co-stimulatory molecules on DCs but was instead mediated by IL-6 that acted on responding T cells. IL-6 alone was not sufficient for reversion as other unidentified TLR-induced cytokines were also required. In vivo experiments indicated that IL-6 alleviates Treg inhibition; however, given that other immune cells express TLR4 and can produce IL-6, DCs may not be the primary source of IL-6. This role for IL-6 was substantiated in a murine asthma model where local blockade of IL-6 augmented the size of the Treg response and increased their inhibitory function (112). In the same study, patients with asthma had increased levels of soluble IL-6 receptor, suggesting that aberrant IL-6 production could be contributing to the inflammatory response. TLR9 may be particularly important in promoting efficient immune responses in the gut. Belkaid and colleagues showed that continual TLR9 stimulation by normal gut flora limited Treg frequencies in gut-associated lymphoid tissues and was important for optimal T cell responses against pathogens (113). Importantly, these studies demonstrate that the innate immune signals can instruct the activation of effector T cells by overriding Treg-mediated suppression and shifting the equilibrium between regulatory and effector T cells. Glucocorticoid-induced tumor-necrosis-factor receptorrelated protein Glucocorticoid-induced TNF receptor-related protein (GITR), a member of the TNF receptor superfamily, can also make responding T cells refractory to Treg inhibition (114, 115). GITR is constitutively expressed at high levels on thymic and peripheral Tregs and at low levels on Foxp3 - CD4 T cells, CD8 T cells, B cells, macrophages, and DCs (115). GITR expression is further upregulated on Foxp3 - CD4 T cells and CD8 T cells following antigen stimulation and on B cells, macrophages, and DCs when stimulated with LPS (116). GITR stimulation via an agonist mab (clone DTA-1) abrogates Treg-mediated suppression both in vitro and in vivo. Additional in vitro
36 19 experiments using combinations of WT and GITR-deficient Tregs and responding CD4 T cells demonstrated that DTA-1 mab ligation of GITR on responding T cells and not Tregs made responding T cells resistant to Treg-mediated suppression (116). GITR ligand, which is expressed on the cell surface of APCs, including B cells, macrophages, and DCs, is transiently upregulated after stimulation and then is down regulated within several days (117). The kinetics of GITR ligand expression indicate that ligation of GITR may function like IL-6 by transiently abrogating control by Tregs in order to allow for the priming of the T cell response. Then, as GITR expression wanes on effector T cells, they become receptive to inhibition by Tregs. Ligation of GITR also has costimulatory functions as it promotes proliferation by both conventional CD4 T cells and Tregs, and it enhances IL-2 and IFN-γ production by conventional CD4 T cells (116, 118). GITR is not critical to Treg function as GITR-deficient Tregs are suppressive in vitro (118). It is also not clear what effect the ligation of GITR on APCs has on their function. Although treatment with DTA-1 mab has many promising clinical applications, the exact in vivo mechanism is still unknown. Determining the in vivo mechanism may be complicated by the observation that DTA-1 mab may actually deplete some Tregs (116). OX4 OX4, another member of the TNFR superfamily, is constitutively expressed by the majority of Tregs and is transiently upregulated on conventional CD4 and CD8 T cells after antigen stimulation (119). OX4 ligand is primarily expressed on professional APCs such as B cells and DCs. OX4 is an important co-stimulatory molecule for CD4 and CD8 T cell proliferation, survival, memory development, and recall responses (119). Engagement of OX4 on Tregs using an agonistic mab has been shown to reduce their suppressive capacity in vitro and Tregs pretreated with agonist OX4 mab were no longer able to control graft versus host disease in vivo (12). It has also been shown that
37 2 treatment of tumor-bearing mice with agonist OX4 mab mitigates Treg inhibition of DC migration out of tumors, allowing for the de novo priming of tumor-specific CD8 T cells (121). Additional studies have shown that disruption of OX4/OX4 ligand signaling can reduce disease severity during experimental autoimmune encephalomyelitis, diabetes, transplantation, colitis, arthritis, asthma, allergy, and IAV infection (119). Activation of Tregs The requirements for the activation of Tregs, especially in response to foreign pathogens, have been elusive. It is currently believed that natural Tregs primarily recognize self-antigens (122). The TCR repertoires between conventional CD4 T cells and Tregs are largely separate with some overlap, although this claim is somewhat controversial (123, 124). In steady-state conditions, the continuous interactions of Tregs with self-peptides in the periphery may be required to maintain inhibition of autoreactive CD4 T cells. Due to their positive selection for TCR with higher affinity to self-antigens, Tregs can recognize peptides at lower concentrations than conventional CD4 T cells, which may decrease their need for co-stimulation and promote a constant state of activation (28). How Tregs become activated in response to foreign pathogens is more difficult to explain. Several hypotheses are outlined below. Non-specific activation of Tregs The activation of Tregs may be innate-like such that Tregs respond immediately and non-specifically through danger signals recognized by pattern recognition receptors. Tregs isolated from lymph nodes uniquely express some TLRs (TLR4, 5, 7, and 8) that are not expressed on conventional CD4 T cells, and all CD4 T cells express TLR1, 2, and 6 (125). In vitro, exposure to the TLR4 ligand LPS induces the proliferation of CD25 + Tregs, promotes their survival, and enhances their suppressive capacity. As described earlier, these results are contrary to Pasare et al. showing that LPS exposure to DCs
38 21 triggers production of IL-6 that inhibits suppression by Tregs (111). This disparity is likely because Pasare et al. purified, cultured, and activated DCs with LPS prior to their addition to cultures containing Tregs and responding T cells. In vivo, the amount and timing of TLR agonists such as LPS could shift the balance of Treg activation and suppression of Treg function. It is unknown if pro-inflammatory signals in the absence of cognate peptide are sufficient for their full activation. Alternatively, if Tregs are maintained in a constant state of activation via interaction with self-antigen/mhc class II, danger signals or pro-inflammatory cytokines could provide the extra stimulation necessary to drive a heightened state of activation. Antigen-specific activation of Tregs If the TCR repertoire of Tregs is primarily restricted to self-antigens, Tregs may recognize foreign antigens that are cross-reactive with self. This hypothesis is less likely given that Tregs respond to such a wide variety of pathogens and there is no experimental evidence that widespread cross-reactivity occurs (61, 69). Several studies have documented that Tregs respond to pathogens with antigen specificity (29). Belkaid and colleagues showed that CD25 high CD4 T cells isolated from the draining LNs of C57BL/6 mice chronically infected with L. major proliferated in response to L. major-infected bone marrow-derived DCs (BMDCs) (126). Importantly, MHC class II-deficient BMDCs or activation of BMDCs with LPS or anti-cd4 mab did not induce proliferation of Tregs, and Tregs isolated from sites distal from the infection did not proliferate when cultured with infected BMDCs. One caveat to these experiments is that purified CD25 high CD4 T cells likely contained contaminating Foxp3 - CD4 T cells that could have produced factors such as IL-2 that promoted proliferation of Foxp3 + cells. Furthermore, it is impossible to discern if the responding Tregs existed prior to infection (i.e. natural Tregs) or if they were generated in the periphery (i.e. atregs).
39 22 Belkaid et al. defined the CD25 high CD4 T cells isolated from L. major-infected mice as natural Tregs because they suppressed in vitro cytokine production by responding CD4 T cells and they maintained Foxp3 expression when transferred into lymphopenic hosts that were infected with L. major (126). However, further work by Belkaid and others have shown that the peripheral generation of atregs (phenotypically indistinguishable from natural Tregs) may be common, especially in chronic infections that provide low level inflammation (61). A recent study found that although there was no evidence for the conversion of naïve polyclonal CD4 T cells or Foxp3 - TCR transgenic CD4 T cells into Foxp3 + atreg during Mtb infection, Tregs proliferated in the lung-draining LNs in response to Mtb (127). Since the window of Treg proliferation occurred with similar timing to the arrival of Mtb antigen to the LNs, the authors concluded that the responding Tregs were Mtb-specific and that they were present prior to infection. However, they can still not rule out that these antigen-specific Tregs are atregs that were derived from peripheral Foxp3 - CD4 T cells. As further discussed in the next section, most of the evidence for the induction of atregs comes from antigen stimulation in subimmunogenic/low inflammatory conditions and during persistent infections, which both L. major and Mtb establish. Alternatively, the TCR repertoire of natural Tregs may not be as distinct from atregs as previously believed. In order to examine TCR diversity, most studies have reduced the number of possible TCR arrangements by fixing the TCRβ chain or limiting TCR rearrangement by restricting TCRα usage to a transgenic minigene (122, 128). While these approaches reduce the number of TCR rearrangements to a more manageable size, they might not faithfully represent the actual TCR repertoires used by Foxp3 + and Foxp3 - CD4 T cells in nonmanipulated mice. Furthermore, by examining the most common TCRs used by either subset, overlap between less common TCRs could be hidden (123). Pacholczyk et al. (27) revisited these caveats by examining infrequently used TCRs. They found that the majority of TCR sequences were shared between Foxp3 + and Foxp3 - CD4 T cells.
40 23 However, while the same TCR was often shared between the two populations, the frequency of a given TCR between populations varied significantly, still supporting the hypothesis that the overall TCR pools used by Tregs and conventional CD4 T cells are predominately disparate. These data raise the possibility that the TCR repertoire of natural Tregs may not be so unique from Foxp3 - CD4 T cells and thus may not be solely restricted to self-antigens. Natural vs. Adaptive Tregs Until recently, Foxp3 + Tregs were believed to all be thymically derived and to recognize self-antigens. However, there are now multiple examples where Tregs appear to respond to pathogens with antigen specificity (61, 129). These observations may in part be explained by the generation of atreg. In contrast to thymically derived natural Tregs, atregs are induced extrathymically from Foxp3 - CD4 T cells when primed with foreign cognate antigen in unique conditions (129). Adaptive Tregs generated in vivo stably upregulate Foxp3 expression, phenotypically resemble natural Tregs, and gain regulatory functions similar to natural Tregs. There is some evidence that natural and atregs synergistically control the immune response; whether these two populations have distinct roles has yet to be determined. Conditions required for the induction of atregs The generation of atreg occurs under a variety of conditions; however, a common denominator is the priming of CD4 T cells in subimmunogenic conditions (129). Most examples for the generation of atregs occur in the context of a lymphopenic environment, during chronic infections, or following immunization of mice under low inflammatory conditions. Some of the initial studies reporting the generation of atreg found that a portion of Foxp3 - CD4 T cells upregulated Foxp3 when introduced into a lymphopenic environment (13, 131). Prolonged antigen exposure can also induce Foxp3 expression by CD4 T cells. For instance, the transfer of OVA-specific
41 24 recombination-activating gene (RAG)-deficient DO11 TCR transgenic CD4 T cells (which are unable to rearrange their endogenous TCR and thus do not contain natural Tregs) into lymphopenic mice that systemically secrete OVA results in autoimmune-like disease (132). However, mice that survive and recover have a population of DO11 CD4 T cells that are Foxp3 +. In lymphosufficient mice, TCR transgenic CD4 T cells specific to influenza hemagglutinin acquire Foxp3 expression with continual delivery of hemagglutinin peptide by an implanted osmotic pump or by treatment with peptide fused to anti-dec-25 antibodies, which targets the peptide to resting DEC-25 + DCs (133, 134). As a more physiological extension of these studies, natural exposure to antigen promotes the generation of atregs. Delivery of OVA orally or intranasally (i.n.) generates Foxp3 + DO11 CD4 T cells that are capable of providing immunological tolerance (131, 135, 136). There may be unique subsets of DCs that promote the generation of atregs. Several studies have shown that CD13 + DCs isolated from gut-associated LNs efficiently induce Foxp3 expression by CD4 T cells in vitro (131, 136). Relative to CD13 - DCs, CD13 + DCs were poor producers of pro-inflammatory cytokines such as TNF-α and IL-6 and they expressed high levels of TGF-β. In vitro conversion of CD4 T cells by CD13 + DCs was dependent on TGF-β and aided by the cofactor retinoic acid. Splenic CD8 + DEC25 + DCs may also be capable of generating atregs (137). Collectively, these studies indicate that certain DC subsets are uniquely designed to promote the de novo generation of atregs that regulate tolerance to environmental antigens. Similar subimmunogenic environments that favor the induction of atregs likely occur during chronic infections where there is sustained low inflammation or where antiinflammatory processes arise to counteract the initial inflammatory response. Several parasites such as Heligmosomoides polygyrus and malaria induce TGF-β production by DCs and macrophages that leads to the induction of atregs (138, 139). Chronic virus
42 25 infections such as hepatitis B virus and Friend virus have also been shown to induce atregs that may be caused by increased production of TGF-β (hepatitis B virus) or by infecting and preventing the full maturation of DCs (Friend virus) (14, 141). There is little experimental evidence that induction of atregs occurs during acute infections; however, a recent study showed that a small frequency of MHC class II tetramer + CD4 T cells were Foxp3 + during acute RSV infection (142). One important caveat is that the majority of studies demonstrating the generation of atregs use TCR transgenic CD4 T cells that recognize a single specificity. These studies are often conducted in lymphopenic mice or in transgenic mice that lack a polyclonal TCR repertoire. To address some of these concerns, one study created mixed bone marrow chimeras from WT and TCR transgenic mice such that the chimeras contained a low frequency of RAG-deficient TCR transgenic CD4 T cells out of the total CD4 T cell compartment (58). Oral administration of antigen still resulted in the conversion of atregs from the TCR transgenic T cells suggesting that the conversion observed in TCR transgenic mice is not an artifact of the system. Further examination of Helios expression in natural and atregs may help assess the relative contribution of the two subsets to the total Treg response (57). The generation of atregs may not be confined to subimmunogenic conditions. A recent intriguing study identified Foxp3 - CD4 T cells in the periphery of nonmanipulated mice that were precursors to Foxp3 + Tregs (143). Treg precursors expressed CD25 and were enriched in the CD62L int CD69 + subpopulation. CD62L int CD69 + CD4 T cells cultured in vitro with IL-2 caused the majority of these cells to upregulate Foxp3 expression. Adoptive transfer of these precursors into immunocompetent hosts resulted in some conversion (<2%) to Foxp3 + Tregs. These results are provocative because they argue that extra-thymic development of Tregs can occur under steady state conditions. It will be important to determine the antigen specificity of these Treg precursors (i.e. self
43 26 vs. nonself), to what extent they contribute to the peripheral pool, and what role they have in vivo. Factors required for atreg induction In vitro assays have clearly shown that Foxp3 - CD4 T cells have the potential to differentiate into Foxp3 + atregs (129, 144). The generation of atregs requires TCR stimulation with low co-stimulation and the presence of TGF-β and IL-2 (129, 134, 144). IL-2 is required for TGF-β to induce Foxp3 expression in vitro (145, 146). TGF-β may help promote Foxp3 expression by inhibiting the transcriptional repressor Gfi-1 and by activating Smad3, which binds the Foxp3 proximal promoter element Foxp3-CNS1 (146). Following TCR stimulation, TGF-β can also direct Foxp3 expression by preventing the recruitment of the transcriptional inactivator DNA methyltransferase I to the Foxp3 locus (147). Activated Tregs can express active TGF-β on their cell surface and promote the generation of atregs in vitro (93). Retinoic acid, a metabolite of vitamin A, also aids in the generation of atregs (131, 136, 148, 149). In the gut, CD13 + DCs express high levels of retinal dehydrogenases that convert vitamin A to retinoic acid (136). It has been proposed that retinoic acid promotes Foxp3 expression indirectly by suppressing Treg-antagonizing cytokine production by effector T cells (15) or by acting directly on atreg precursors, the mechanisms of which are not yet entirely clear (149, 151, 152). Thesis Objectives 1. To determine the conditions under which the effector functions of virus-specific T cells in the lung are inhibited. 2. To determine if Foxp3 + regulatory CD4 T cells respond to RSV infection. 3. To determine the role of Foxp3 + regulatory CD4 T cells in modulating the RSVspecific CD8 T cell response and in limiting immunopathology during infection.
44 27 Figure 1. Regulatory mechanisms in the lung. DCs are the primary sentinels of the immune response. Myeloid DCs constantly sample inhaled antigens and are responsible for immune surveillance. Plasmacytoid DCs help establish inhalation tolerance to inert antigens. Airway epithelial cells produce molecules such as mucins and surfactants that are important in regulating the innate immune response. They also produce inhibitory molecules such as nitric oxide, IDO, and a variety of other immunosuppressive cytokines. Airway epithelial cells and alveolar macrophages have developed a unique homeostatic cycle to ensure the proper activation of macrophages. TGF-β linked the α v β 6 integrin expressed on epithelial cells suppresses macrophages when in close contact. However, upon receiving signals through TLRs, macrophages can suppress expression of α v β 6 and break TGF-β-mediated inhibition. This relationship between airway epithelial cells and alveolar macrophages is crucial for maintaining an anti-inflammatory environment. Alveolar macrophages are capable of producing anti-inflammatory molecules such as IL- 1, TGF-β, and prostaglandins that can act on both DCs and T cells. Foxp3 + Tregs are essential in maintaining homeostasis of the immune system, preventing spontaneous inflammation in the lungs, and are important in establishing tolerance to inhaled antigens. As a method to limit collateral damage by effector CD8 T cells responding to a pathogen, intracellular calcium levels can be regulated in CD8 T cells by decreasing the expression levels of Ca 2+ release-activated calcium (CRAC) channels. Decreased uptake of extracellular calcium reduces the activation of transcription factors such as NFAT that are required for effector functions such a cytokine production.
45 28
46 29 CHAPTER II REGULATION OF CYTOKINE PRODUCTION BY VIRUS-SPECIFIC CD8 T CELLS IN THE LUNG Abstract Inflammation and the elimination of infected host cells during an immune response often causes local tissue injury and immunopathology which can disrupt the normal functions of tissues such as the lung. Here I show that both virus-induced inflammation and the host tissue environment combine to influence the capacity of virusspecific CD4 and CD8 T cells to produce cytokines in various tissues. Impaired production of cytokines such as IFN-γ and TNF-α by antigen-specific T cells is more pronounced in peripheral tissues such as the lung and kidney as compared to secondary lymphoid organs such as the spleen or LNs. I also demonstrate that tissues regulate cytokine production by memory T cells independent of virus infection, as memory T cells that traffic into the lungs of naïve animals exhibit a reduced capacity to produce cytokines following direct ex vivo peptide stimulation. Furthermore, I show that cytokine production by antigen-specific memory CD4 and CD8 T cells isolated from the lung parenchyma can be rescued by stimulation with exogenous peptide-pulsed APCs. My results suggest that the regulation of T cell cytokine production by peripheral tissues may serve as an important mechanism to prevent immunopathology and preserve normal tissue function. Introduction CD8 T cells control acute virus infections through the secretion of cytokines and the lysis of infected cells ( ). Acute infection of mice with lymphocytic choriomeningitis virus (LCMV) induces a massive activation and expansion of CD8 T cells (157, 158). Early studies suggested much of this expansion was not virus-specific because the primary technology at the time for quantifying virus-specific T cells, limiting
47 3 dilution analysis, could only account for approximately 1% of the activated T cells as being virus-specific ( ). Direct ex vivo visualization of antigen-specific CD8 T cells using MHC class I tetramers and flow cytometry led to the landmark discovery that the majority of the activated T cells in secondary lymphoid organs following an acute LCMV infection were virus-specific (158). Antigen-specific effector and memory CD8 T cells can also be identified by their production of IFN-γ, the primary effector cytokine released by CD8 T cells. Thus, the surprising tetramer results were confirmed using functional assays such as enzyme-linked immunosorbent spot (ELISPOT) or intracellular cytokine staining (ICS) for IFN-γ following short-term in vitro stimulation with virusderived immunodominant peptides (157, 158). These three complementary approaches yielded similar, but not identical numbers of virus-specific T cells in secondary lymphoid organs such as the spleen (157, 158). Recent evidence has suggested that virus-specific CD8 T cells in the lung may become impaired in their ability to secrete cytokines such as IFN-γ or TNF-α following acute infection ( ). RSV infection of mice induces the expansion of a virusspecific CD8 T cell population in the lung that can be readily identified via MHC class I tetramer staining (164, ). Interestingly, substantially fewer RSV-specific T cells could be identified using ICS to detect IFN-γ production (164, 166, 17). These results suggested that RSV-specific cells were functionally impaired in their ability to make cytokines. Additional studies performed using either simian virus 5 (SV5) or pneumonia virus of mice have yielded similar results and suggest that the reduced cytokine production by virus-specific T cells may only occur after infection by members of the Paramyxoviridae family of viruses (165, 167). I evaluated the virus-specific T cell response following acute intranasal infection with three unrelated viruses: 1) RSV, a ssrna virus; 2) LCMV, an ambisense ssrna virus; and 3) vaccinia virus (vacv), a large dsdna virus. I show that decreased cytokine production by virus-specific pulmonary CD8 T cells occurs during the acute immune
48 31 response to RSV and vacv but does not occur during acute LCMV infection. However, once the acute infection is resolved, pulmonary memory CD8 T cells exhibit decreased cytokine production following respiratory infection with each of these unrelated viruses. Surprisingly, using adoptive transfer of antigen-specific CD8 T cells into naïve recipients, I show that cells that enter the lung exhibit decreased ex vivo cytokine production suggesting that the local tissue environment may suppress the production of cytokines in vivo. Importantly, I demonstrate that cytokine production by antigenspecific CD4 and CD8 T cells recovered from the lung parenchyma can be rescued by in vitro stimulation with exogenous peptide-pulsed antigen-presenting cells. Analysis of multiple tissues revealed that regulation of cytokine production by antigen-specific T cells may serve as a potential mechanism to limit local tissue injury and prevent immunopathology. Materials and Methods Mice BALB/cAnNCr and C57BL/6NCr mice between 6-8 weeks of age were purchased from the National Cancer Institute (Frederick, MD). C57BL/6 P14 mice (172) that express a CD8 Vα2 Vβ8.1 T cell-transgenic TCR specific to the GP epitope of LCMV and C57BL/6 SMARTA mice (173) that express a CD4 Vα2 Vβ8.3 T celltransgenic TCR specific to the GP 61-8 epitope of LCMV were gifts from Michael J. Bevan (University of Washington, Seattle, WA). All experimental procedures utilizing mice were approved by the University of Iowa s Animal Care and Use Committee. Virus propagation and infection of mice The Armstrong strain of LCMV was a gift from Raymond M. Welsh (University of Massachusetts Medical School, Worcester, MA) and was grown in BHK-21 cells
49 32 (American Type Culture Collection; ATCC, Manassas, VA). RSV A2 strain was a gift from Barney S. Graham (National Institutes of Health; NIH, Bethesda, MD) and was propagated in HEp-2 cells (ATCC). Recombinant vacv expressing the RSV M2 protein (vacvm2) (174) was a gift from Judy L. Beeler (U.S. Food and Drug Administration, Bethesda, MD) obtained via Thomas J. Braciale (University of Virginia, Charlottesville, VA). Recombinant vacv expressing the LCMV NP epitope (vacvnp) was obtained from John H. Harty via Peter Southern (175). Recombinant vacv were propagated in BSC-4 cells (ATCC). Mice were infected i.n. with 5x1 5 plaque forming units (PFU) of LCMV, 2.8x1 6 PFU of RSV, 3x1 6 PFU vacvm2, or 3x1 6 PFU vacvnp. Tissue isolation and preparation The bronchoalveolar lavage (BAL) was harvested from virus-infected mice by cannulation of the trachea and lavage with three successive washes with 1 ml of RPMI 164 (Gibco, Grand Island, NY) supplemented with 1 U/ml penicillin G, 1 mg/ml streptomycin sulfate, 2 mm L-glutamine (Gibco),.1 mm non-essential amino acids (Gibco), 1 mm sodium pyruvate (Gibco), 1 mm HEPES (Gibco), 5 x 1-5 M 2- mercaptoethanol (Sigma, St. Louis, MO), and 1% fetal calf serum (FCS) (Atlanta Biologicals, Lawrenceville, GA). After collecting the BAL, the lungs were perfused by gently pushing 5 mls of RPMI 164 media as supplemented above through the right ventricle of the heart. After removing the lungs, the lobes were cut into small pieces and pressed through a wire mesh screen (Cellector, Bellco Glass, Inc., Vineland, NJ). To create a single-cell suspension, spleens and LNs were harvested and pressed between the frosted ends of glass slides (Surgipath, Richmond, IL). All other organs were pressed through wire mesh screens to create single-cell suspensions. Lymphocytes from the liver and kidneys were isolated using Lympholyte-M (Cedarlane Laboratories, Ltd., Burlington, NC) as specified by the manufacturer.
50 33 T cell stimulation and cell staining Spleen and lung single-cell suspensions (1-2x1 6 cells) were incubated in 96-well round-bottom plates (Corning Inc., Corning, NY) for 5 hrs at 37 C with or without 1 µm of either NP peptide (RPQASGVYM) or M peptide (SYIGSINNI) in the presence of 1 µg/ml brefeldin A (BFA) (Sigma). All peptides were synthesized and purchased from Biosynthesis, Inc. (Lewisville, TX). Alternatively, virus-specific CD8 T cells were stimulated with EL-4 cells or irradiated (12, rads) P815 cells pulsed for one hour at 37 C with or without 1 µm of the appropriate peptide. EL-4 and P815 cells were washed twice with RPMI 164 media as supplemented above and combined with lung and spleen cells at a 2:1 or a 3:1 effector:target (E:T) ratio, respectively. CHB3 cells (176) (a gift from Gail Bishop; University of Iowa, Iowa City, IA) were pulsed for one hour at 37 C with or without 1 µm of GP 61-8 peptide (GLNGPDIYKGVYQFKSVEFD; Biosynthesis, Inc.) and combined with lung or spleen cells at a 1:1 E:T ratio. To stain for CD17a expression, cells were incubated with or without peptide for 5 hrs in the presence of 1 µm monensin (Sigma), anti-cd17a FITC (BD Pharmingen, San Jose, CA; clone 1D4B), and anti-fcγrii/iii mab (ebioscience; clone 93). In some cases T cells were stimulated for 5 hours at 37 C with 5 ng/ml phorbol myristate acetate (PMA; Sigma) and 5 ng/ml of ionomycin (Sigma) in the presence of 1 µg/ml BFA (Sigma). For anti-cd3 stimulations, cells were stimulated in 48-well plates that had 1 µg/ml plate-bound anti-cd3 for 5 hrs in the presence of BFA. After incubation, cells were washed with staining buffer (phosphate buffered saline [PBS], 2% FCS, and.2% sodium azide), blocked with purified anti-fcγrii/iii mab (clone 93; ebioscience, San Diego, CA), and were simultaneously stained with optimal concentrations of mabs against Thy1.2 FITC (clone ; ebioscience) and either CD8 PE-Cy7 (clone ; ebioscience) or CD4 PE-Cy7 (clone RM4.5; ebioscience) for 3 minutes at 4 C. In some experiments, cells were stained for activated caspase 3/7 using the Vybrant FAM Caspase-3 and -7 Assay Kit (Molecular Probes, Eugene, Oregon) according to the
51 34 manufacturer s instructions. Cells were then washed twice with staining buffer, fixed and erythrocytes lysed with FACS lysing solution (BD Pharmingen, San Jose, CA). Cells were subsequently incubated in permeabilization buffer (staining buffer containing.5% saponin; Sigma) for 1 minutes and stained with mabs specific to IFN-γ APC (clone XMG1.2; ebioscience), TNF-α PE (clone MP6-XT22; ebioscience), IL-1 PE (clone JES5-16E3; ebioscience), IL-4 PE (clone 11B11; ebioscience), and IL-5 APC (clone TRFK5; BD Pharmingen). Cells were washed an additional time with permeabilization buffer and again with staining buffer prior to analysis on a BD FACSCanto flow cytometer. Data was analyzed using FlowJo software (Tree Star Inc., Ashland, OR). Tetramer staining Single-cell suspensions prepared from the spleen and lung were washed with staining buffer and stained with optimal concentrations of M or NP specific APC-conjugated tetramers (obtained from the NIH Tetramer Core Facility, Atlanta, GA) and simultaneously blocked with purified anti-fcγrii/iii mab for 3 minutes at 4 C. After tetramer staining, cells were washed twice with staining buffer and stained for Thy1.2 FITC and CD8 PE-Cy7. Cells were washed and fixed prior to analysis on a BD FACSCanto flow cytometer. Data was analyzed using FlowJo software (Tree Star Inc.). Adoptive transfer of TCR transgenic T cells The frequency of TCR transgenic P14 CD8 T cells was determined by staining peripheral blood lymphocytes (PBL) with mabs specific for Thy1.1, CD8, Vα2 (Caltag Laboratories, Burlingame, CA), and Vβ8.1/8.2 (clone MR5-2; BD Pharmingen). The frequency of TCR transgenic SMARTA CD4 T cells was determined by staining PBL for Thy1.1, CD4, Vα2 (Caltag Laboratories), and Vβ8.3 (clone B3.3; BD Pharmingen). 1x1 3 Thy1.1 P14 CD8 T cells or 1x1 4 Thy1.1 SMARTA CD4 T cells in a total volume of 1 µl sterile PBS were adoptively transferred intravenously (i.v.) into naïve Thy1.2 C57BL/6NCr recipient mice. Within 24 hours post-transfer, mice were infected i.n. with
52 35 5x1 5 PFU LCMV. In one set of experiments, 1x1 4 P14 CD8 T cells were adoptively transferred i.v. into naïve Thy1.2 C57BL/6NCr mice that were subsequently infected with 5x1 5 PFU LCMV i.n. At 15 days post-infection (p.i.), spleen and lung cells were isolated and the frequency of P14 CD8 T cells was determined by flow cytometry as described above. Splenocytes were labeled for 1 minutes at 37 C with 25 µm carboxyfluorescein diacetate succinimidyl ester (CFSE; Molecular Probes) in PBS containing.1% bovine albumin (Sigma) and washed twice with supplemented RPMI 164 media containing 1% FCS. CFSE-labeled splenocytes and lung cells containing equal numbers of P14 CD8 T cells were mixed and ~2-3x1 6 total P14 CD8 T cells were adoptively transferred i.v. into naïve Thy1.2 C57BL/6NCr mice and allowed to rest for 7 days. In vitro restimulation and cytokine ELISA Spleens and lungs from C57BL/6NCr mice infected i.n. with 5x1 5 PFU LCMV between 4-6 days previously were harvested and prepared into single-cell suspensions as described above. Spleen and lung single-cell suspensions (1x1 6 cells) were incubated in 24-well plates (BD Falcon) in the presence or absence of 1 µm GP peptide (KAVYNFATC) for 48 hours at 37 C. Alternatively, cells were stimulated with irradiated (6, rads) EL-4 cells pulsed with 1 µm GP peptide as described above. Supernatants were subsequently harvested and stored at -8 C prior to analysis by enzyme-linked immunosorbent assay (ELISA) to quantify the amount of IFN-γ protein. Briefly, 96-well plates were coated over-night at 4 C with 2 µg/ml purified anti-ifn-γ (clone R4-6A2; ebioscience). Plates were washed 3x with PBS containing.1% Tween 2 (v/v) (Sigma-Aldrich) and subsequently blocked with RPMI 164 containing 1% FCS for 2 h at room temperature. Plates were washed 3x with PBS-Tween 2 before 5 µl of each sample and standards diluted in PBS containing 5% FCS were added to the wells. Plates were incubated at 4 C overnight, washed 3x with PBS-Tween 2, and then
53 36 secondary biotinylated anti-ifn-γ mab (clone XMG1.2, ebioscience) was applied. After incubating at room temperature for 2 h, plates were washed 3x with PBS-Tween 2 and incubated for 3 min at room temperature with 1 µg/ml avidin-peroxidase (Sigma- Aldrich) in.5 M phosphocitrate buffer (ph 5.). Plates were washed again and developed with 3,3,5,5 -tetramethylbenzidine (Sigma-Adrich) in.5 M phosphocitrate buffer (ph 5.) containing H 2 O 2 and then treated with 2 N H 2 SO 4 to stop the reaction. ELISA samples were analyzed using an Elx8 reader (BioTek Instruments) and data were examined using KC Junior (BioTek Instruments) software. Transwell experiments P14 CD8 T cells were adoptively transferred into naïve C57BL/6NCr mice and infected with LCMV i.n. Spleens and lungs (digested with collagenase and Dnase I) were harvested from mice >6 days p.i. Thy1.1 + P14 CD8 T cells were isolated from the lungs as follows: cells were stained with anti-thy1.1 PE and simultaneously blocked with purified anti-fcγrii/iii mab for 15 minutes at 4 C. Cells were washed twice with PBS containing 2% FCS and then stained with anti-pe microbeads according to the manufacturers instructions (Miltenyi Biotec, Auburn, CA). Cells were washed again and subsequently run through an automacs Separator (Miltenyi Biotec) using the posseld program. Unpurified spleen and lung cells from naïve C57BL/6NCr mice were peptidepulsed with 1 µm M peptide at 37 C for 1 hr and then washed 3 times with supplemented RPMI x1 3 purified P14 CD8 T cells and either 1x1 6 peptidepulsed spleen or lung cells were placed in the upper well of a Transwell permeable support (Corning) with a.4 µm pore size in 24-well plates. 1x1 6 peptide-pulsed spleen or lung cells were placed below the transwell. P14 CD8 T cells were stimulated for 5 hrs at 37 C in the presence of 1 µm and then stained for IFN-γ and TNF-α as described above.
54 37 In vivo cytotoxicity assay Naïve BALB/cAnNCr splenocytes were pulsed with either RSV M or control LCMV GP (GYCLTKWMI) peptide for 1 hr at 37 C and washed 3 times with supplemented RPMI 164. M and GP peptide-pulsed splenocytes were labeled with 5 µm and.5 µm CFSE, respectively, as described above. Both populations were then dual labeled with 3 µm PKH26 red fluorescent cell linker dye (Sigma) according to the manufacturer s instructions. Equal numbers of CFSE high and CFSE low cells were mixed and 1-2x1 7 total target cells were transferred i.v. into syngeneic BALB/cAnNCr mice that were naïve or infected with RSV 8 days earlier. Spleens and lungs were harvested 4 or 8 hrs post-transfer, lungs were digested with collagenase, and the relative frequencies of CFSE high and CFSE low cells within the PKH26 + population were examined via flow cytometry. The percent killing was calculated as follows: 1- (((percent of CFSE high cells in day 8 RSV mice/percent of CFSE low cells in day 8 RSV mice)/(percent of CFSE high cells in naïve mice/percent of CFSE low cells in naïve mice))*1). Data analysis Graphical analyses were performed using Prism (Graphpad Software Inc., San Diego, CA) and statistical analyses were performed using GraphPad InStat (Graphpad Software Inc.). Paired or unpaired Student t-tests (two-tailed) were used to compare groups with Gaussian distributions. One-way ANOVA with a Tukey-Kramer post-test was used to compare multiple groups to each other. One-way ANOVA with a Dunnett post-test was used to compare experimental groups to a single control group. P-values were considered significant when p<.5.
55 38 Results Altered cytokine production by virus-specific CD8 T cells in the lung following acute pulmonary virus infection Previous studies have shown that virus-specific pulmonary CD8 T cells are impaired in their ability to produce cytokines following acute respiratory infections with RSV (164, 166, 17), pneumonia virus of mice (165), or SV5 (167), all members of the Paramyxoviridae family of viruses. I first questioned if viruses unrelated to RSV would also induce the generation of virus-specific non-cytokine producing CD8 T cells in the lung. Consistent with previous work (164, 166, 17), following acute RSV infection a large proportion of RSV M specific CD8 T cells failed to produce IFN-γ following direct ex vivo peptide stimulation (Figs. 2A and 3A). As early as 8 days p.i., only ~5% of the M specific CD8 T cells in the lung parenchyma detected by tetramer staining produced IFN-γ following direct ex vivo peptide stimulation. In contrast, ~87% of the expected frequency of M specific splenic CD8 T cells produced IFN-γ, indicating that only a small proportion of the M specific CD8 T cells recovered from the spleen fails to produce IFN-γ upon direct ex vivo peptide stimulation. M specific CD8 T cells recovered from the lung airways (i.e. BAL) and the spleen exhibited similar frequencies of IFN-γ producing cells at day 8 p.i. By 3 and 6 days p.i., the proportion of M specific lung parenchymal and BAL CD8 T cells capable of producing IFN-γ continued to decline whereas the proportion in the spleen remained relatively constant (Figs. 2A and 3A). Additionally, in parallel with tetramer and IFN-γ staining, I tracked the production of TNF-α following direct ex vivo peptide stimulation. The frequency of M specific lung parenchyma CD8 T cells producing TNF-α was significantly (p<.1) lower relative to splenic CD8 T cells at all three time points (Fig. 4A). The proportion of M specific CD8 T cells in the BAL that produced TNF-α was not significantly lower than in the spleen until 3 days p.i. (Fig. 4A).
56 39 I next examined the virus-specific CD8 T cell responses following acute respiratory infections with the ambisence RNA arenavirus LCMV and the dsdna poxvirus vacv. Using a recombinant vacv expressing the RSV M2 protein (vacvm2), I analyzed the RSV M specific CD8 T cell response. Similar to RSV, acute respiratory infection with vacvm2 resulted in a population of CD8 T cells in the lung parenchyma that failed to produce IFN-γ upon direct ex vivo peptide stimulation (Figs. 2B and 3B). Whereas >95% of M specific splenic CD8 T cells produced IFN-γ at day 8 p.i. with vacvm2, only ~35% of the expected M specific CD8 T cells recovered from the lung parenchyma produced IFN-γ at this time point. The proportion of M specific CD8 T cells that produced IFN-γ further decreased by 3 and 6 days p.i. with vacvm2. In contrast to the lung parenchyma, in the BAL at day 8 p.i., the frequency of CD8 T cells that produced IFN-γ after direct ex vivo stimulation with M peptide was higher than the frequency of CD8 T cells that bound the M tetramer. As with RSV, I observed a significant (p<.1) decrease in the proportion of CD8 T cells from the BAL that produced IFN-γ in response to direct ex vivo peptide stimulation at days 3 and 6 p.i. (Figs. 2B and 3B). Additionally, the proportion of M specific CD8 T cells in the lung parenchyma that produced TNF-α was significantly (p<.1) lower as compared to the spleen (Fig. 4B). I did not observe a significant decrease in the proportion of TNF-α-producing CD8 T cells in the BAL until 3 days p.i. with vacvm2. The ability of pulmonary CD8 T cells to produce IFN-γ following acute i.n. infection with LCMV differed slightly from that of acute i.n. infection with either RSV or vacvm2 (Figs. 2C and 3C). At day 8 p.i. a similar frequency of CD8 T cells in the lung and BAL could be identified as LCMV-specific via tetramer staining vs. ICS for IFN-γ production. Because I observed similar results examining the M specific response after infection with RSV and after infection with a recombinant vacv expressing the RSV M2 protein, I questioned if the ability of pulmonary LCMV NP specific CD8 T cells to produce IFN-γ during acute respiratory infection was epitope dependent. At day
57 4 8 after acute respiratory infection with a recombinant vacv expressing the NP epitope (vacvnp), I noted a similar decrease in the proportion of IFN-γ-producing CD8 T cells from the lung parenchyma as I previously observed after i.n. infection with either RSV or vacvm2 (Fig. 5). These data indicate that the ability of lung parenchymal NP specific CD8 T cells to produce IFN-γ is a consequence of the acute LCMV respiratory infection. However, I did observe a decrease in the proportion of IFN-γproducing CD8 T cells recovered from the lung parenchyma and BAL at later time points following LCMV infection. By 3 and 6 days p.i., only ~3% of the expected NP specific CD8 T cells in the lung parenchyma produced IFN-γ. Interestingly, NP specific CD8 T cells in the BAL were better able to produce IFN-γ relative to the cells in the lung parenchyma at days 3 and 6 p.i. Similar to the RSV and vacvm2 infection models, at 3-9 days p.i. with LCMV, the majority of lung parenchymal and BAL CD8 T cells failed to produce TNF-α following direct ex vivo peptide stimulation (Fig. 4C). Thus, a higher frequency of CD8 T cells recovered from the lung parenchyma failed to produce IFN-γ and TNF-α following direct ex vivo peptide stimulation as compared to cells isolated from the lung airways or the spleen. I considered the possibility that the non-ifn-γ producing T cells could be producing cytokines other than IFN-γ. In vitro studies have demonstrated that in the presence of IL-4, CD8 T cells can switch to a Th2-like pattern of cytokine production (177, 178). However, I did not detect a population of CD8 T cells producing IL-4, IL-5, or IL-1 following infection with LCMV, vacvm2, or RSV (Fig. 6). Thus, the decreased frequency of pulmonary virus-specific IFN-γ-producing CD8 T cells was not a result of switching to an alternative Tc2 phenotype. My results instead suggest that the failure of pulmonary virus-specific CD8 T cells to produce IFN-γ and TNF-α following direct ex vivo peptide stimulation is not restricted to the Paramyxoviridae family of viruses. Instead, these data suggest that the failure of many antigen-specific CD8 T cells in the
58 41 lung parenchyma to produce IFN-γ and TNF-α may primarily be a result of the local tissue environment. Cytokine-producing CD8 T cells in the lung exhibit reduced degranulation I wanted to further examine the functional fitness of virus-specific CD8 T cells that were capable of producing IFN-γ following ex vivo peptide stimulation. In addition to the production of IFN-γ and TNF-α, CD8 T cells control many virus infections through the perforin/granzyme cytolytic pathway (179, 18). In order to kill effectively, a CD8 T cell must degranulate in order to release perforin and granzyme toward the target cell. I tested the ability of virus-specific CD8 T cells to degranulate upon ex vivo peptide stimulation by staining for extracellular CD17a (Lamp-1), a molecule present on cytotoxic granules that is exposed on the cell surface membrane during degranulation (181). Relative to the percent of splenic IFN-γ-producing CD8 T cells that were CD17a +, IFN-γ-producing CD8 T cells in the lung exhibited a decreased ability to degranulate (Fig. 7). At day 8 p.i. with RSV, 67% of splenic IFN-γ-producing CD8 T cells were able to degranulate whereas only 32% and 45% in the lung parenchyma and BAL, respectively, were able to degranulate (Fig. 7A and C). By day 3 p.i., M specific IFN-γ + CD8 T cells in the lung parenchyma and BAL were significantly (p<.1 and p<.5, respectively) reduced in their ability to degranulate relative to cells recovered from the spleen. At 8 days p.i. with vacvm2, 8% of splenic IFN-γ-producing CD8 T cells were capable of granule exocytosis compared to 28% in the lung parenchyma and 47% in the BAL (Fig. 7D). Consistent with my finding that LCMV NP specific lung CD8 T cells exhibited a higher proportion of antigen-specific cells capable of making IFN-γ at day 8 p.i., parenchymal CD8 T cells were better able to undergo granule exocytosis as compared to RSV or vacvm2 at day 8 p.i. (Fig. 7B and E). By day 6 p.i.,
59 42 9% of IFN-γ-producing NP specific CD8 T cells in the lung parenchyma were able to degranulate. However, the ability of CD8 T cells in the BAL to undergo granule exocytosis became significantly (p<.1) reduced. Importantly, these data demonstrate that relative to splenic CD8 T cells, even virus-specific pulmonary CD8 T cells that are able to produce IFN-γ exhibit a decreased ability to undergo granule exocytosis. Exogenous peptide-pulsed APC are able to rescue cytokine production MHC class I molecules are expressed on the cell surface of most nucleated cells in the body. Every host cell should be theoretically capable of presenting peptide to CD8 T cells and of eliciting a proper effector response. However, MHC class I levels may differ depending on the cell type, and lower expression levels in the lung relative to lymphoid tissues may provide suboptimal TCR-peptide/MHC stimulation. Alternatively, recent work has suggested that CD8 T cells may require interaction with professional APC within tissues to elicit effector functions ( ). Thus, another potential explanation for the reduced ability of virus-specific CD8 T cells isolated from the lung parenchyma to make cytokines is that they have not received proper stimulation by the endogenous tissue APC. To test if the lung-resident APC were providing insufficient activation signals to stimulate IFN-γ or TNF-α, I used exogenous peptide-pulsed APC to stimulate splenic and pulmonary CD8 T cells (Fig. 8). Stimulation with exogenous peptide-pulsed APC significantly (p<.1) increased IFN-γ production by CD8 T cells isolated from the spleen at 3 days p.i. with either RSV (Figs. 8A and B) or LCMV (Figs. 8C and D). These data indicate that direct ex vivo peptide stimulation of the spleen fails to stimulate all of the virus-specific CD8 T cells to produce IFN-γ. Interestingly, stimulation with exogenous peptide-pulsed APC significantly (p<.1) recovered IFN-γ production by CD8 T cells isolated from the lung parenchyma 3 day p.i. with RSV and LCMV but only from the BAL of LCMV-immune mice
60 43 (p<.5). In RSV-immune mice, exogenous peptide-pulsed APC stimulated 71% of lung parenchymal M specific CD8 T cells to produce IFN-γ, which represented a significant (p<.1) 2.5-fold increase in comparison to direct ex vivo peptide stimulation with endogenous APC (Figs. 8A and B). Following infection with LCMV, exogenous peptide-pulsed APC stimulated 74% of LCMV NP specific CD8 T cells recovered from the lung parenchyma to produce IFN-γ, which was a significant (p<.1) 2.1-fold increase as compared to direct ex vivo peptide stimulation alone (Figs. 8C and D). Interestingly, stimulation with exogenous peptide-pulsed APC had a slight effect on LCMV-specific BAL CD8 T cells. This suggests that the lack of cytokine production by virus-specific CD8 T cells in the BAL is not a consequence of insufficient activation by APC in the airways. I observed similar results in the spleen, lung parenchyma, and BAL following vacvm2 infection (Fig. 8E). Importantly, these data indicate that virus-specific CD8 T cells in the lung parenchyma are not irreversibly impaired. Failure of pulmonary LCMV-specific TCR transgenic CD8 T cells to produce cytokines following direct ex vivo peptide stimulation Down regulation of the TCR following stimulation or reorganization of the TCR and CD8 on the cell surface can both lead to decreased tetramer binding (185, 186). Consequently, I was unable to stain with tetramer and examine effector functions of virus-specific CD8 T cells within the same assay. In order to track an antigen-specific T cell population independent of tetramer staining, I utilized an adoptive transfer system using D b -restricted LCMV GP specific TCR transgenic P14 CD8 T cells. I adoptively transferred 1x1 3 Thy1.1 P14 CD8 T cells i.v. into naïve Thy1.2 C57BL/6NCr mice and challenged them i.n. with LCMV. At day 3 p.i., ~93% of P14 CD8 T cells in the spleen produced IFN-γ whereas only ~35% in the lung parenchyma and ~63% in the BAL produced IFN-γ (Fig. 9A and B). Additionally, by day 3 p.i. 89 ± 6% SD (n=11
61 44 mice, 3 separate experiments) of splenic P14 CD8 T cells co-produced TNF-α and IFN-γ. compared to 64 ± 11% SD (n=11 mice, 3 separate experiments) of P14 CD8 T cells in the lung parenchyma. Stimulation with exogenous peptide-pulsed APC resulted in equivalent IFN-γ production by splenic P14 CD8 T cells and a significant increase in IFN-γ production by P14 CD8 T cells in the lung parenchyma (p<.1) and BAL (p<.5) (Fig. 9A and B). PMA and ionomycin stimulation of P14 CD8 T cells recovered from the spleen, lung parenchyma, and BAL between 4 and 6 days p.i. with LCMV resulted in similar frequencies of IFN-γ production as compared to stimulation with exogenous peptide-pulsed APC (Table 1). Importantly, these data indicate that the antigen-specific T cells that enter the lung parenchyma are not anergic or irreversibly impaired. Furthermore, the inability of LCMV-specific CD8 T cells in the lung parenchyma to produce cytokines following direct ex vivo peptide stimulation can be rescued by stimulation with exogenous peptide-pulsed APC. Because I could never stimulate all of the P14 CD8 T cells recovered from the spleen or the lung to produce IFN-γ, I next assessed the proportion of apoptotic cells among the IFN-γ non-producing P14 CD8 T cells. Directly ex vivo, ~14% of P14 CD8 T cells recovered from the spleen and ~1% of P14 CD8 T cells obtained from the lung parenchyma stained positive for activated caspase 3/7 (Fig. 9C). Following direct ex vivo peptide stimulation, the majority of IFN-γ non-producing P14 CD8 T cells recovered from the spleen stained positive for activated caspase 3/7 (Fig. 9D and E). These data indicate that at least some of the IFN-γ non-producing P14 CD8 T cells obtained from the spleen are apoptotic and not a result of inadequate stimulation. In contrast to splenic P14 CD8 T cells, only a small proportion of IFN-γ non-producing P14 CD8 T cells recovered from the lung parenchyma stained positive for activated caspase 3/7. Importantly, the frequency of P14 CD8 T cells obtained from the spleen and lung that expressed activated caspase 3/7 did not increase after direct ex vivo peptide stimulation, indicating that apoptosis was not induced during stimulation. When P14
62 45 CD8 T cells from the spleen were stimulated with exogenous peptide-pulsed APC, the frequency of cells expressing the activated form of caspase 3/7 cells did not change. Similarly, stimulation of P14 CD8 T cells from the lung parenchyma with exogenous peptide-pulsed APC increased the frequency of IFN-γ-producing P14 CD8 T cells but did not alter the frequency of IFN-γ non-producing P14 CD8 T cells that stained positive for activated caspase 3/7. Pulmonary CD8 T cells produce less total IFN-γ than splenic CD8 T cells To verify that the reduced capacity of pulmonary CD8 T cells to produce IFN-γ would also impact the total amount of cytokine released, I measured total IFN-γ protein production by ELISA. Equivalent numbers of GP specific CD8 T cells (as determined by ICS for IFN-γ following stimulation with exogenous peptide-pulsed APC) cells from spleens and lungs of C57BL/6NCr mice infected i.n. with LCMV 4-6 days earlier were restimulated in vitro for 48 hours with either GP peptide or exogenous peptide-pulsed APC. Direct ex vivo peptide stimulation induced high levels of IFN-γ protein production by GP specific CD8 T cells in the spleen that was further enhanced by stimulation with exogenous peptide-pulsed APC (Fig. 1). In contrast, in vitro peptide stimulation did not result in detectable IFN-γ production by pulmonary CD8 T cells. Stimulation with exogenous peptide-pulsed APC resulted in detectable levels of IFN-γ protein. These results are consistent with Figs. 2 and 9 showing that virus-specific memory CD8 T cells in the lung exhibit a greatly diminished capacity to produce IFN-γ following direct ex vivo peptide stimulation. Reduced cytokine production by pulmonary CD4 T cells I reasoned that if respiratory viruses and/or the tissue environment had broad effects on dampening the immune response then virus-specific CD4 T cells would also exhibit a similar failure to produce cytokines. I adoptively transferred 1x1 4 LCMV
63 46 GP specific Thy1.1 SMARTA CD4 T cells into naïve Thy1.2 C57BL/6NCr mice followed by i.n. infection with LCMV. Similar to CD8 T cells, a higher proportion of SMARTA CD4 T cells recovered from the spleen produced IFN-γ upon direct ex vivo peptide stimulation relative to SMARTA CD4 T cells obtained from the lung. At day 3 p.i., ~74% of SMARTA CD4 T cells recovered from the spleen produced IFN-γ whereas only ~14% from the lung parenchyma and ~21% from the BAL produced IFN-γ (Figs. 11A and B). Consistent with published data (187), at day 3 p.i. 85 ± 11% SD (n=15 mice, 4 separate experiments) of splenic SMARTA CD4 T cells produced both IFN-γ and TNF-α following stimulation. In contrast, only 64 ± 11% SD (n=15 mice, 4 separate experiments) of SMARTA CD4 T cells isolated from the lung parenchyma produced both IFN-γ and TNF-α (p<.1). Stimulation with exogenous peptide-pulsed APC resulted in equivalent frequencies of IFN-γ-secreting SMARTA CD4 T cells in the spleen and significantly (p<.1) increased the proportion of IFN-γ-producing SMARTA CD4 T cells in the lung parenchyma (Fig. 11B). PMA and ionomycin stimulation of spleen, lung, and BAL cells resulted in frequencies of IFN-γ-producing SMARTA CD4 T cells similar to stimulation with exogenous peptide-pulsed APC (Table 2). Directly ex vivo, ~11% of SMARTA CD4 T cells from the spleen and ~9% of SMARTA CD4 T cells from the lung parenchyma stained positive for activated caspase 3/7 (Fig. 11C). These proportions did not change following direct ex vivo peptide stimulation, indicating that stimulation did not induce apoptosis (Fig. 11D). Similar to my results with P14 CD8 T cells, only a small proportion of SMARTA CD4 T cells from the lung parenchyma stained positive for activated caspase 3/7 (Fig. 11D). These data suggest that, like CD8 T cells, the majority of CD4 T cells recovered from the lung are inhibited in their ability to produce IFN-γ.
64 47 Direct cross-linking of the T cell receptor does not rescue IFN-γ production I next assessed if pulmonary CD8 T cells are inhibited in their ability to produce IFN-γ via signaling pathways proximal to the TCR or further downstream of the TCR. Cells from the spleen or lung of LCMV-immune mice that had received either P14 CD8 T cells or SMARTA CD4 T cells were stimulated ex vivo with plate-bound anti-cd3ε mab, which mediates TCR cross-linking, or PMA and ionomycin, which bypasses the TCR and induces downstream signaling. 7% of spleen-derived P14 CD8 T cells produced IFN-γ following stimulation with anti-cd3ε compared to >85% by peptide alone, exogenous peptide-pulsed APC, or PMA and ionomycin (Fig. 12A). However, only 14% of pulmonary P14 CD8 T cells produced IFN-γ following anti-cd3ε mab stimulation compared to 28% by peptide alone or >7% by either exogenous peptidepulsed APC or PMA and ionomycin. I observed a similar trend with SMARTA CD4 T cells (Fig. 12B). 37% of SMARTA CD4 T cells produced IFN-γ following stimulation with anti-cd3ε mab compared to 9% by peptide alone or >75% by exogenous peptidepulsed APC or PMA and ionomycin. Surprisingly, these data indicate that signaling induced by cross-linking of the TCR is inhibited during ex vivo stimulation while downstream signaling pathways are fully functional. Ex vivo inhibition of cytokine production by pulmonary CD8 T cells occurs via a contact-dependent mechanism I next sought to determine if ex vivo inhibition of cytokine production by pulmonary CD8 T cells occurs via a contact-dependent mechanism. Memory P14 CD8 T cells isolated from the lungs were placed in the upper chamber of a transwell along with unsorted peptide-pulsed spleen or lung cells from naïve C57BL/6NCr mice. Unsorted peptide-pulsed cells from the spleen or lung were also placed below the transwell in the same well. Soluble factors released by either spleen or lung cells in the lower chamber
65 48 had no effect on the production of IFN-γ or TNF-α by P14 CD8 T cells in the upper chamber during the 5 hr stimulation period (Fig. 13). Instead, the source of the APC, either the spleen or lung, influenced cytokine production by CD8 T cells. These data suggest that the lung tissue inhibits cytokine production in a contact-dependent manner. Pulmonary CD8 T cells exhibit decreased in vivo cytolytic function compared to splenic CD8 T cells Reduced degranulation by CD8 T cells suggested that pulmonary CD8 T cells had decreased cytolytic capabilities. In order to assess the in vivo cytolytic function of splenic and pulmonary CD8 T cells, RSV M CFSE high or control LCMV GP CFSE low peptide-pulsed syngeneic splenocytes were transferred into naïve or day 8 RSVinfected BALB/cAnNCr mice. At 4 and 8 hrs post-transfer, the percent killing of M peptide-pulsed targets in the lung was significantly (p<.1) lower than in the spleen (Fig. 14A-C). 4 hrs post-transfer, 55% of M peptide-pulsed targets had been eliminated in the spleen compared to 32% in the lung. Decreased killing by pulmonary CD8 T cells could not be explained by a simple decrease in the CD8 T cell to target ratio; in the spleen there was ~1 M specific CD8 T cell for every 1 target cells compared to ~2 M specific CD8 T cell for every 1 target cell in the lung (Fig. 14D). This does not exclude the possibility that the CD8 T cells in the lungs were in different anatomical locations than the circulating target cells. By 8 hrs post-transfer, the percent of antigen-specific killing had increased in both locations. However, there was still a substantial disparity in killing between the spleen and lung (8% in the spleen compared to 58% in the lung). This difference at 8 hrs may be an underestimate since target cells will have had a greater chance to circulate and be eliminated in secondary lymphoid organs. In conclusion, the observed ex vivo decrease in effector functions of CD8 T cells in the lungs translates into decreased in vivo peptide-specific cytolysis of target cells.
66 49 The lung environment inhibits cytokine production by CD8 T cells My results suggest that tissue endogenous APC recovered from the lung parenchyma fail to stimulate cytokine production by virus-specific memory T cells directly ex vivo regardless of the initial infecting virus. Because all three virus systems I examined demonstrated a similar reduction in the capacity of virus-specific CD8 T cells to produce IFN-γ following direct ex vivo peptide stimulation at day 3 p.i., I hypothesized that the lung environment in a naïve animal may also fail to optimally stimulate cytokine production by virus-specific T cells. To directly test this possibility, I adoptively transferred 1x1 4 Thy1.1 P14 CD8 T cells into naïve Thy1.2 C57BL/6NCr mice that were subsequently infected i.n. with LCMV. At day 15 p.i., ~95% of P14 CD8 T cells isolated from the spleen produced IFN-γ following direct ex vivo peptide stimulation (Fig. 15A). Consistent with data in Figs. 2C and 3C, only 69% of P14 CD8 T cells in the lung parenchyma produced IFN-γ following direct ex vivo peptide stimulation. Spleen and lung cells were then pooled from multiple mice and the splenocytes were labeled with CFSE (Fig. 15B). Splenocytes and lung cells containing equal numbers of P14 CD8 T cells were mixed at a 1:1 ratio and 2-3x1 6 total P14 CD8 T cells were adoptively transferred i.v. into naïve Thy1.2 C57BL/6NCr recipients. To control for the effects of CFSE on P14 T cells, CFSE-labeled splenocytes were mixed 1:1 with unlabeled splenocytes and adoptively transferred into naïve recipients. At 7 days posttransfer, spleens and lungs were harvested and cells were stimulated directly ex vivo with peptide or exogenous peptide-pulsed APC. In naïve mice that received unlabeled or CFSE-labeled spleen-derived P14 CD8 T cells, I observed equivalent survival and trafficking to the spleen, lung, and blood between both groups. Importantly, the same proportion of CFSE - and CFSE + P14 CD8 T cells that had trafficked into the spleen and lung produced IFN-γ following direct ex vivo peptide stimulation. As expected, ~96% of spleen-derived P14 CD8 T cells that had trafficked back into the spleen produced IFN-γ
67 5 upon direct ex vivo peptide stimulation (Figs. 15C and D). An equivalent frequency of P14 CD8 T cells produced IFN-γ when stimulated with exogenous peptide-pulsed APC. Interestingly, ~96% of lung-derived P14 CD8 T cells that had trafficked into the spleen produced IFN-γ upon direct ex vivo stimulation with peptide or upon stimulation with exogenous peptide-pulsed APC (Figs. 15C and D). In contrast, only ~48% of spleen- and lung-derived P14 CD8 T cells that had trafficked into the lung parenchyma produced IFN-γ following direct ex vivo peptide stimulation. Stimulation with exogenous peptidepulsed APC resulted in similar frequencies of IFN-γ-producing P14 CD8 T cells as compared to the spleen. Importantly, these data demonstrate that the decreased capacity of antigen-specific CD8 T cells isolated from the lung parenchyma to produce cytokines following direct ex vivo peptide stimulation occurs in the absence of virus infection and is instead a consequence of the lung tissue environment. In addition, these results demonstrate for the first time that virus-specific CD8 T cells that were isolated from the lung and adoptively transferred into naïve recipients regain their capacity to produce IFNγ after entry into the spleen. Regulation of cytokine production by LCMV-specific CD8 T cells in various tissues To determine if other peripheral tissues also regulate cytokine production by antigen-specific CD8 T cells, I examined P14 CD8 T cell cytokine production in multiple tissues following acute LCMV infection. In addition to the lung parenchyma, P14 CD8 T cells exhibited significantly (p<.1) reduced IFN-γ production in peripheral tissues such as in the PBL, kidneys, and heart at day 3 p.i. (Fig. 16). Interestingly, reduced cytokine production was not ubiquitous in peripheral sites; P14 CD8 T cells recovered from the inguinal and superficial cervical LNs, bone marrow, thymus, liver, and the peritoneal cavity exhibited a high proportion of antigen-specific CD8 T cells capable of producing IFN-γ. Similar to the lung parenchyma, stimulation with exogenous peptide-pulsed APC
68 51 significantly (p<.1) increased IFN-γ production by P14 CD8 T cells obtained from the kidney. In contrast, stimulation with exogenous peptide-pulsed APC did not significantly rescue IFN-γ production by P14 CD8 T cells recovered from the PBL and heart. Importantly, these data indicate that tissues differentially regulate IFN-γ production by antigen-specific CD8 T cells. Discussion Increasing evidence indicates that peripheral tissues can regulate multiple facets of innate and adaptive immunity (4, 23, 24, ). Previous studies have suggested that acute pulmonary infection with any one of several related viruses including RSV, SV5, and pneumonia virus of mice result in the functional impairment of virus-specific CD8 T cells obtained from either the lung parenchyma or the airways ( , 17, 192, 193). Several studies have indicated that the lung environment may directly regulate the ability of antigen-specific T cells to produce cytokines. For example, RSV challenge of LCMV-immune mice results in the diminished capacity of both RSV-specific and nonspecifically recruited LCMV-specific memory CD8 T cells to produce IFN-γ and TNF-α (166). Additionally, antigen-specific effector CD8 T cells that have been adoptively transferred into naïve recipients and traffic into the lung parenchyma exhibit within 48 hours a decreased capacity to produce IFN-γ following direct ex vivo stimulation (168). This result suggests that CD8 T cells that enter the lung are conditioned by the lung environment and may potentially enter an altered state of activation. Thus, it appears that the lung environment is directly responsible for regulating the ability of virus-specific T cells to produce cytokines. Here I demonstrate that acute respiratory infection with vacvm2 and LCMV, two viruses unrelated to RSV, also reduce the capacity of pulmonary memory CD8 T cells to produce IFN-γ and TNF-α following direct ex vivo peptide stimulation. Inhibition of cytokine production was not limited to CD8 T cells as pulmonary SMARTA CD4 T cells
69 52 following LCMV infection also exhibit a diminished ability to produce IFN-γ and TNF-α following direct ex vivo peptide stimulation. Interestingly, I did not observe a decrease in IFN-γ production by LCMV-specific CD8 T cells recovered from the lung parenchyma during the peak of the acute CD8 T cell response at day 8 p.i. These data suggest that acute LCMV infection may alter the lung inflammatory environment or modulate the capacity of pulmonary APC to stimulate CD8 T cells. LCMV infection may recruit or preferentially activate an APC population that is not present early after either RSV or vacvm2 infection. Thus, virus-induced inflammation can override the regulatory lung environment to stimulate the production of cytokines by pulmonary T cells. However, the effect of acute LCMV infection is transient because by day 3 p.i. the majority of LCMV-specific CD8 T cells recovered from the lung fail to produce IFN-γ following direct ex vivo peptide stimulation. This suggests that following resolution of the virus infection, the lung environment returns to its pre-infection state with regard to regulating the capacity of antigen-specific T cells to produce cytokines. The inability of virus-specific memory T cells to produce cytokines after entry into the lung could be due to active suppression or due to a lack of optimal stimulation. To address the possibility that pulmonary APC were not supplying sufficient activation signals during direct ex vivo peptide stimulation, I used exogenous peptide-pulsed APC to stimulate virus-specific T cells. I was able to rescue cytokine production by the majority of virus-specific memory T cells located in the lung parenchyma at 3 days after infection with each of the viruses I examined (Fig. 8). Importantly, these results demonstrate for the first time that T cells in the lung parenchyma are not irreversibly impaired. Interestingly, when I examined IFN-γ protein production 48 hrs following in vitro stimulation with either exogenous peptide or peptide-pulsed exogenous APC, I observed an even more profound deficiency in cytokine production as compared to my earlier results obtained using short-term ICS assays (Fig. 1 vs. Fig. 9). IFN-γ protein levels were actually below the limit of detection after stimulation of lung cells with
70 53 exogenous peptide (Fig. 1). It is possible that IFN-γ production by lung-derived CD8 T cells rapidly waned following initial peptide stimulation or that other cells in the culture consumed IFN-γ. While stimulation of lung cells with exogenous peptide-pulse APC substantially increased total IFN-γ production, total IFN-γ protein levels were still only a fraction of what was produced by splenocytes. These results suggest that per cell production of IFN-γ is decreased in pulmonary CD8 T cells compared to splenic CD8 T cells. Again, this could also reflect consumption of IFN-γ other immune cells or greater cell death of lung cells than splenic cells during the 48 hr culture. A recent study showed that nonfunctional SV5-specific CD8 T cells in the lungs exhibit decreased calcium flux due to reduced numbers of Ca 2+ release-activated calcium (CRAC) channels (193). This in turn leads to reduced activation and nuclear localization of the calcium-sensitive transcription factor nuclear factor of activated T cells 1 (NFAT1), which is responsible for regulating genes such as IFN-γ. However, stimulation with PMA and ionomycin did not increase IFN-γ production by SV5-specific CD8 T cells whereas I was able to restore IFN-γ production by LCMV-specific CD8 and CD4 T cells (Tables 1 and 2). This suggests that the mechanism regulating cytokine production by pulmonary CD8 T cells may be uniquely shaped by the specific virus infection. My data suggest that endogenous peptide-pulsed pulmonary APC may not be able to stimulate ex vivo cytokine production by virus-specific T cells as adequately as the endogenous APC present in the spleen. Alternatively, lung APC may be fully capable of stimulating a response; however, they may not be able to overcome active inhibition by the lung environment. Surprisingly, cross-linking of the TCR using plate-bound anti- CD3ε mab was not sufficient to overcome the inhibition on cytokine production whereas the lymphoma (EL-4 and CHB3) and mastocytoma (P815) cells that were used as APC could counteract the suppression. One possibility to account for this discrepancy is that these non-professional APC (except CHB3 cells, which are a transformed B cell line that could have professional APC qualities) could stimulate cytokine production by providing
71 54 additional co-stimulation that is not present on endogenous lung APC. Alternatively, they could be preventing the physical interaction of T cells and the factor(s) blocking TCR signaling. The possibility of cold inhibition seems more likely given the nonprofessional nature of the EL-4 and P815 cell lines. While the mechanism is not known at this time, it is clear that ex vivo cytokine production by pulmonary T cells is blocked proximal to the TCR as stimulation with PMA and ionomycin is able to bypass the block and trigger signaling further downstream from the TCR. The inhibition of cytokine production by antigen-specific T cells is not limited to the lung as my analysis of a number of peripheral tissues 3 days post-lcmv infection revealed that virus-specific CD8 T cells that have migrated into other tissues also fail to produce IFN-γ following direct ex vivo peptide stimulation (Fig. 16). I believe my findings have important consequences in the measure of virus-specific T cell responses using only functional readouts because the true virus-specific frequency will be underestimated. My results demonstrate that the amount of underestimate of the antigenspecific T cells response will differ greatly depending on the tissue being analyzed. Furthermore, inhibition of cytokine production by pathogen-specific T cells may be a more generalized means for the immune system to protect host tissues from immunopathology. The lung airways are a distinct compartment from the parenchyma and have broad phenotypic effects on T cells. In contrast to the lung parenchyma, stimulation with exogenous peptide-pulsed APC had little effect on cytokine production by virus-specific T cells obtained from the BAL, suggesting that the mechanism(s) of regulation of cytokine production by T cells in the airways might be distinct from that of the lung parenchyma. This concept is consistent with previous work demonstrating that cells that have migrated into the airways progressively lose various effector functions over time (166). It is currently unclear how the lung parenchyma and lung airways differentially regulate the effector functions of antigen-specific T cells. Following a respiratory virus
72 55 infection, the lung airways become enriched for virus-specific effector-like memory CD8 T cells lacking cell surface expression of CD62L, CD27, and CD127, which is opposite of memory CD8 T cells in secondary lymphoid tissues (194). Once entering the lung airways, memory CD8 T cells down-modulate expression of Ly6C and LFA-1 over the course of 1-2 days (195). LFA-1 is crucial for the formation of the immunological synapse between T cells and APC or target cells (196). Thus, it is possible that the reduced expression of integrins and/or costimulatory molecules on CD8 T cells in the BAL may further limit the ability of these cells to be efficiently stimulated by APC to produce cytokines. In contrast to the BAL, it appears to be easier to rescue cytokine production by antigen-specific CD8 T cells in the lung parenchyma. Active suppression of T cells by regulatory cytokines or through the actions of regulatory cells such CD4 Tregs or alveolar macrophages may also potentially explain my results (197-21). To further support the regulatory role of local tissue environments on immune responses, I showed using an adoptive transfer system that in the absence of respiratory virus infection, functional splenic-derived P14 CD8 T cells were reduced in their ability to produce cytokines when they entered into the lung parenchyma of naïve mice but not when they migrated back into the spleen (Fig. 15). Importantly, I also showed within the same experiment that P14 CD8 T cells isolated from the lung parenchyma that were reduced in their ability to produce cytokines following direct ex vivo peptide stimulation regained their capacity to produce cytokines when they trafficked into the spleen. These results demonstrate a direct role for tissue-specific regulation of cytokine production by CD8 T cells in the absence of infection. Only recently has research begun to suggest that tissue microenvironments play an important role in regulating the adaptive immune response. One clear benefit to regulating the adaptive immune response in peripheral tissues such as the lung would be to prevent tissue injury and preserve normal tissue function during an inflammatory immune response. Understanding how tissues regulate adaptive T cell responses will
73 56 provide us with novel therapeutic approaches to modulate immune responses and to prevent tissue damage caused by immunopathology.
74 57 Figure 2. Diminished IFN-γ production by pulmonary CD8 T cells following acute respiratory virus infection. BALB/cAnNCr mice were infected i.n. with (A) RSV, (B) vacvm2, or (C) LCMV. At 8, 3, and 6 days p.i., cells from the spleen, lung parenchyma, and BAL were stained with tetramer or stimulated with or without peptide in the presence of brefeldin A for 5 hrs at 37 C and subsequently stained for IFN-γ. Plots are gated on CD8 + Thy1.2 + cells. Bold numbers represent the percentages of tetramer + or IFN-γ + CD8 T cells; numbers in parenthesis signify the calculated percentage of IFNγ + /tetramer + CD8 T cells. Representative staining from 1 of 4 mice is shown. Similar results were obtained in 3 separate experiments.
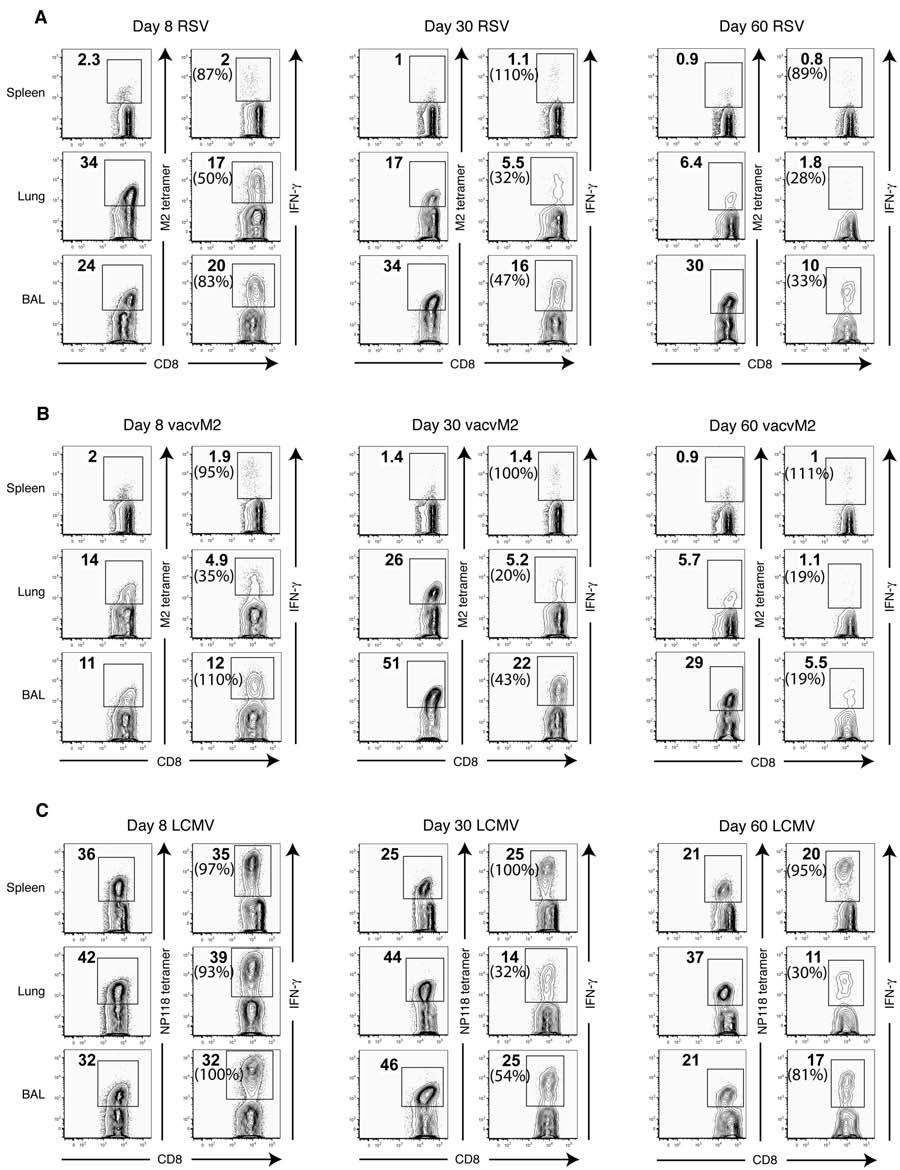
75 58
76 59 Figure 3. Ratio of IFN-γ-producing to tetramer binding cells following RSV, vacvm2, and LCMV infections. BALB/cAnNCr mice were infected i.n. with (A) RSV, (B) vacvm2, or (C) LCMV. Cells from the spleen, lung parenchyma, and BAL were stained with tetramer or for IFN-γ as described in Fig. 2. Data represent the mean ± SEM of 4-5 separate experiments with an n=4 mice per experiment. P-values were calculated within each time point by comparing lung parenchyma and BAL ratios to those of the spleen. Comparisons were made between the spleen and lung using paired student t tests. Since BAL samples were pooled from 4 mice per experiment, unpaired t tests were used to compare the spleen to the BAL. *p<.5, p<.1.
77 6 A IFN-! : M2 Tetramer ratio B IFN-! : M2 Tetramer ratio C IFN-! : NP118 Tetramer ratio RSV Spleen Lung BAL vacvm2 Spleen Lung BAL LCMV * Spleen Lung BAL Day 8 p.i. Day 3 p.i. Day 6 p.i.
78 61 Figure 4. Ratio of TNF-α-producing to tetramer binding cells following RSV, vacvm2, and LCMV infections. BALB/cAnNCr mice were infected i.n. with (A) RSV, (B) vacvm2, or (C) LCMV. At 8, 3, and 6 days p.i., cells from the spleen, lung parenchyma, and BAL were stained with tetramer or stimulated with or without peptide in the presence of brefeldin A for 5 hrs at 37 C and subsequently stained for TNF-α. Data represent the mean ± SEM of 4-5 separate experiments with an n=4 mice per experiment. P-values were calculated within each time point by comparing lung parenchyma and BAL ratios to those of the spleen. Comparisons were made between the spleen and lung using paired student t tests. Since BAL samples were pooled from 4 mice per experiment, unpaired t tests were used to compare the spleen to the BAL. *p<.5, p<.1.
79 62 A TNF-! : M2 Tetramer ratio B TNF-! : M2 Tetramer ratio C TNF-! : NP118 Tetramer ratio RSV Spleen Lung BAL vacvm2 Spleen Lung BAL LCMV Spleen Lung BAL * Day 8 p.i. Day 3 p.i. Day 6 p.i.
80 63 Figure 5. Decreased production of IFN-γ by pulmonary CD8 T cells is a consequence of the respiratory virus infection and is not epitope dependent. BALB/cAnNCr mice were infected i.n. with LCMV, vacvnp, or vacvm2. On day 8 p.i., cells from the spleen and lung parenchyma were stained with tetramer or for IFN-γ as described in Fig. 2. Data represent the mean ± SEM of 2 separate experiments with an n=4 mice per experiment. Comparisons were made between the spleen and the lung parenchyma using paired t tests. *p<.5, p<.1.
81 64 IFN-! : Tetramer ratio LCMV * vacvnp vacvm2 Spleen Lung
82 65 Figure 6. Pulmonary CD8 T cells do not differentiate into Tc2 cells following RSV, vacvm2, or LCMV infection. BALB/cAnNCr mice were infected i.n. with RSV, vacvm2, or LCMV and lungs were harvested 8 days p.i. Cells were stimulated with PMA and ionomycin and stained for (A) IL-1 (bold line) or isotype control (shaded) or (B) IL-4 and IL-5. Plots are gated on CD8 + Thy1.2 + cells. Plots are representative of 2 separate experiments with n=3 mice per experiment.
83 66 A RSV B Lung Lung Lung RSV LCMV vacvm IL LCMV vacvm Rat IgG1 Rat IgG IL IL-5
84 67 Figure 7. IFN-γ-producing pulmonary CD8 T cells exhibit reduced degranulation. BALB/cAnNCr mice were infected i.n. with RSV, vacvm2, or LCMV and tissues were harvested at days 8, 3, and 6 p.i. Cells were stimulated with or without peptide in the presence of monensin and anti-cd17a for 5 hrs at 37 C. (A and B) Representative CD17a staining on CD8 T cells from mice infected 8 days earlier with RSV (A) or LCMV (B) following peptide stimulation. (C-E) Data are shown as the percent of IFN-γ + CD8 T cells that were able to degranulate as determined by CD17a staining. Graphs are representative of 2-3 separate experiments with an n=4 mice per experiment. P-values were calculated within each time point by comparing lung parenchyma and BAL percentages to those of the spleen. Comparisons were made between the spleen and lung using paired student t tests. Since BAL samples were pooled from 4 mice per experiment, unpaired t tests were used to compare the spleen to the BAL. *p<.5, p<.1.


85 68 A B Spleen Lung Spleen Day 8 RSV no peptide peptide CD17a 2.7 Day 8 LCMV no peptide peptide IFN-! C % CD17a + of IFN-! + CD8 T cells D % CD17a + of IFN-! + CD8 T cells vacvm2 RSV Spleen Lung BAL Day 8 p.i. Day 3 p.i. Day 6 p.i. * Spleen Lung BAL Lung CD17a IFN-! E % CD17a + of IFN-! + CD8 T cells LCMV * Spleen Lung BAL
86 69 Figure 8. Presentation of peptide by exogenous APC rescues IFN-γ production by CD8 T cells recovered from the lung. BALB/cAnNCr mice were infected with RSV (A and B), LCMV (C and D), or vacvm2 (E) and tissues were harvested 3 days p.i. Irradiated P815 cells incubated with or without peptide were mixed with spleen or lung single cell suspensions at a 1:3 E:T ratio, stimulated for 5 hrs and stained for IFN-γ. Plots in (A) and (C) are gated on CD8 + Thy1.2 + cells and are representative of 2 separate experiments with an n=4 mice per experiment. Bold numbers represent the percentage of tetramer + or IFN-γ + CD8 T cells; numbers in parenthesis signify the percentage of IFN-γ + /tetramer + CD8 T cells. Data in (B), (D) and (E) represent the mean ± SEM from 2 separate experiments with an n=4 mice per experiment. Bold numbers represent the fold-increase of the means between treatment groups. Paired t tests were used to compare peptide alone to APC + peptide ratios within each tissue. n.s., not significant; *p<.5; p<.1.


87 7 A Day 3 RSV C Day 3 LCMV B IFN-! : M2 Tetramer ratio E IFN-! : M2 Tetramer ratio x RSV 2.5x n.s. Spleen Lung BAL 1.6x vacvm2 VacvM2 1.9x n.s. Spleen Lung BAL Peptide alone APC + peptide D IFN-! : NP118 Tetramer ratio x LCMV 2.1x 1.2x * Spleen Lung BAL
88 71 Figure 9. LCMV TCR transgenic CD8 T cells exhibit decreased cytokine production. 1x1 3 P14 TCR transgenic Thy1.1 + CD8 T cells were transferred i.v. into naïve Thy1.2 + C57BL/6NCr mice. At 3 days p.i. with LCMV, spleens and lungs were harvested. Cells were stimulated with or without peptide or peptide-pulsed EL-4 cells and stained for IFN-γ. (A) Plots are gated on donor CD8 + Thy1.1 + P14 T cells. Bold numbers represent the percentage of IFN-γ + CD8 P14 T cells. (B) Summary graph showing the mean ± SEM from a total of 4 separate experiments with an n=4 mice per experiment. (C) Cells were stained for caspase 3/7 directly ex vivo without peptide stimulation. Plots are gated on CD8 + Thy1.1 + P14 T cells. Data represent the mean ± SEM from a total of 2 separate experiments with an n=4 mice per experiment. (D and E) Cells were stimulated ex vivo with peptide alone or with peptide-pulsed EL-4 cells. Cells were stained for IFNγ and caspase 3/7. (D) Representative plots are gated on CD8 + Thy1.1 + P14 T cells. (E) Cumulative data represents the mean ± SEM from a total of 2 separate experiments with an n=4 mice per experiment. Statistical analyses were done using paired t tests. *p<.5, p<.1.


89 72 A B Peptide alone APC + peptide C Spleen Lung CD8 Caspase 3/7 % Caspase 3/7 + of P Spleen Lung % IFN-! + of P14 CD8 T cells D 1 * Spleen Lung BAL Lung Spleen Peptide alone APC + peptide Caspase 3/7 IFN-! E 1 IFN-! + Casp3/7 - IFN-! " Casp3/7 - IFN-! + Casp3/7 + IFN-! " Casp3/7 + n.s. % of P14 CD8 T cells Spleen (peptide) Spleen (APC) Lung (peptide) Lung (APC)
90 73 Table 1. Production of IFN-γ by splenic and pulmonary P14 CD8 T cells following ex vivo stimulation % IFN-γ of P14 CD8 T cells Tissue Peptide only APC + peptide PMA + ionomycin Spleen 91 ± 3 88 ± 5 88 ±6 Lung 29 ± 7 69 ± ± 6 BAL 37 ± ± 1 76 ± 5 Note: P14 CD8 T cells were adoptively transferred i.v. into naïve C57BL/6NCr mice prior to i.n. infection with LCMV. Cells were harvested from the indicated tissues between 4 and 6 days p.i. and stained for IFN-γ following ex vivo stimulation with peptide, peptidepulsed irradiated EL-4 cells, or PMA and ionomycin. Numbers represent the mean percentage of IFN-γ + P14 CD8 T cells ± SD. Spleen and lung results represent data from 3 separate experiments with 4 mice per experiment. BAL results represent a pool of 4 mice per experiment from 2 separate experiments. Statistical analyses comparing the APC + peptide or PMA + ionomycin groups to the peptide only group was done using one-way ANOVA with Dunnett post-tests. p<.1.
91 74 Figure 1. Pulmonary CD8 T cells produce less IFN-γ protein relative to splenic CD8 T cells. Lungs and spleens were harvested from C57BL/6NCr mice infected with LCMV 4-6 days previously and single cell suspensions were stimulated with GP peptide or peptide-pulsed irradiated EL-4 cells for 48 hours. Supernatants were then assayed for total IFN-γ protein by ELISA. Data represent the mean ± SEM from one of 2 separate experiments with an n=3 mice per experiment. The dashed line represents the limit of detection.
92 75 1 Peptide alone IFN-! (ng/ml) APC + peptide Spleen Lung
93 76 Figure 11. CD4 T cells also exhibit decreased cytokine production following pulmonary virus infection. 1x1 4 TCR transgenic Thy1.1 + CD4 SMARTA T cells were transferred i.v. into naïve Thy1.2 + C57BL/6NCr mice. At 3 days p.i. with LCMV, spleens and lungs were harvested, stimulated with or without peptide, and stained for IFN-γ. (A) Plots are gated on donor CD4 + Thy1.1 + SMARTA T cells. Bold numbers represent the percentage of IFN-γ + SMARTA CD4 T cells. (B) Summary graph showing the mean ± SEM from a total of 2 separate experiments with an n=4 mice per experiment. (C) Cells were stained for caspase 3/7 directly ex vivo without peptide stimulation. Plots are gated on CD4 + Thy1.1 + SMARTA T cells. The graph represents the mean ± SEM from 1 of 2 separate experiments with an n=3 mice per experiment. (D) Cells were stimulated ex vivo with peptide and then stained for IFN-γ and caspase 3/7. Plots are gated on CD4 + Thy1.1 + SMARTA T cells. Data show the mean ± SEM from a total of 2 separate experiments with an n=4 mice per experiment. Data in (B) and (C) were analyzed using paired t tests. n.s., not significant; *p<.5; p<.1.


94 77 A B % IFN-! + of SMARTA CD4 T cells Spleen Peptide alone APC + peptide Lung C 11 Spleen D Spleen Lung Lung CD8 Caspase 3/7 % Caspase 3/7 + of SMARTA Spleen n.s. Lung % of SMARTA CD4 T cells Caspase 3/7 IFN-! + Casp3/7 - IFN-! - Casp3/7 - IFN-! + Casp3/7 + IFN-! - Casp3/7 + Spleen Lung 11 IFN-!
95 78 Table 2. Production of IFN-γ by splenic and pulmonary SMARTA CD4 T cells following ex vivo stimulation % IFN-γ of SMARTA CD4 T cells Tissue Peptide only APC + peptide PMA + ionomycin Spleen 87 ± 3 89 ± 2 96 ± 2 Lung 9 ± 3 77 ± 6 88 ± 5 BAL 9 ±.5 61 ± 2 91 ± 2 Note: 1x1 4 SMARTA CD4 T cells were adoptively transferred i.v. into naïve C57BL/6NCr mice prior to i.n. infection with LCMV. Cells were harvested from the indicated tissues between 3 and 4 days p.i. and stained for IFN-γ following ex vivo stimulation with peptide, peptide-pulsed irradiated CHB3 cells, or PMA and ionomycin. Numbers represent the percentage of IFN-γ + SMARTA CD4 T cells ± SD. Spleen and lung results represent data from 2 separate experiments with 3 mice per experiment. BAL results represent a pool of 3 mice per experiment from 2 separate experiments. Statistical analyses comparing the APC + peptide or PMA + ionomycin groups to the peptide only group was done using one-way ANOVA with Dunnett post-tests. p<.1.
96 79 Figure 12. Activation of T cells via anti-cd3 mab does not increase IFN-γ production by T cells. (A) 1x1 3 Thy1.1 + P14 CD8 T cells were transferred i.v. into C57BL/6NCr mice that were subsequently infected with 2x1 6 PFU LCMV i.v. Spleens and lungs were harvested 5-6 days p.i. and cells were stimulated with 1 µg/ml plate-bound anti- CD3ε mab, peptide, peptide-pulsed EL-4 cells, or PMA and ionomycin and then stained for IFN-γ. Flow plots are gated on CD8 + Thy1.1 + P14 T cells. (B) 1x1 4 Thy1.1 + SMARTA CD4 T cells were transferred i.v. into C57BL/6NCr mice that were subsequently infected with 5x1 5 PFU LCMV i.n. Spleens and lungs were harvested 3-4 days p.i. and cells were stimulated as in (A) using peptide-pulsed CHB3 cells as APC and then stained for IFN-γ. Flow plots are gated on CD4 + Thy1.1 + SMARTA T cells. Data are representative of two separate experiments with n=3 mice per experiment. Data were analyzed using one-way ANOVA with Tukey-Kramer post-tests. Comparisons that are not shown were not significant. *p<.5, p<.1.
97 8 A Lung Spleen APC + PMA + anti-cd3 peptide peptide ionomycin IFN-! % IFN-! + of P14 CD8 T cells 1 anti-cd3 mab peptide 8 APC + peptide PMA and ionomycin CD8 Spleen Lung B Lung Spleen APC + PMA + anti-cd3 peptide peptide ionomycin CD4 IFN-! % IFN-! + of SMARTA CD4 T cells * 1 * Spleen Lung
98 81 Figure 13. Inhibition of cytokine production by pulmonary CD8 T cells occurs via a contact-dependent mechanism. 1x1 3 Thy1.1 + P14 CD8 T cells were transferred i.v. into C57BL/6NCr mice and infected i.n. with LCMV. Spleens and lungs were harvested >6 days p.i. Purified P14 CD8 T cells from the lungs were put in the top of a transwell with peptide-pulsed unsorted APC from either the spleens (shown as S) or lungs (shown as L) of the same mice. Peptide-pulsed APC from the spleen or lung were placed in the bottom of the transwell in media containing brefeldin A. P14 CD8 T cells were stimulated for 5 hrs at 37 C and then stained for IFN-γ and TNF-α. Cells in the top of the transwell are shown in brackets as the numerator and cells in the bottom are shown as the denominator. Data was analyzed using one-way ANOVA with Tukey-Kramer post-tests. n.s., not significant; *p<.5; p<.1.
99 82 % of P14 CD8 T cells Pre-sort [L+P14]/L n.s. [L+P14]/S [S+P14]/S [S+P14]/L n.s. n.s. Pre-sort [L+P14]/L [L+P14]/S [S+P14]/S [S+P14]/L n.s. IFN-!+ TNF-"+
100 83 Figure 14. Pulmonary CD8 T cells exhibit decreased in vivo antigen-specific target lysis compared to splenic CD8 T cells. In vivo cytolysis of RSV M peptide-pulsed (CFSE high PKH26 + ) or control LCMV GP (CFSE low PKH26 + ) naïve splenocytes was evaluated in BALB/cAnNCr mice infected with RSV 8 days earlier after either 4 or 8 hrs post-transfer i.v. Histograms showing cytolysis of peptide-pulsed targets in either the spleen (A) or lung (B) 8 hrs post-transfer. Cells were gated on the PKH26 + targets (top panels) and then frequencies of CFSE high and CFSE low were examined. Plots are representative of 2 separate experiments. (C) Percent killing of RSV peptide-pulsed targets in the spleen and lung 4 and 8 hrs post-transfer. (D) Ratios of the total numbers of RSV M tetramer + CD8 T cells to control LCMV GP peptide-pulsed targets were calculated 4 hrs post-transfer. Data are representative of 2-3 experiments for each time point. Statistical analysis in (C) was done using paired t tests. p<.1.
101 84 A Spleen B 6 4 Lung Naive Day 8 RSV Naive Day 8 RSV PKH PKH PKH CFSE CFSE C % Killing Spleen 4hr Lung 4hr Spleen 8hr Lung 8hr D E:T ratio Spleen Lung
102 85 Figure 15. The lung environment inhibits cytokine production by CD8 T cells. 1x1 4 Thy1.1 + P14 CD8 T cells were transferred i.v. into naïve Thy1.2 + C57BL/6NCr mice that were subsequently infected i.n. with LCMV. (A) At 15 days p.i., spleens and lungs from multiple mice were harvested, pooled, stimulated with or without peptide, and stained for IFN-γ. (B) Diagram of the overall experimental design. The pooled splenocytes were labeled with CFSE and mixed with lung cells containing equal numbers of P14 CD8 T cells. The mixture of cells was adoptively transferred i.v. into naïve Thy1.2 + C57BL/6NCr mice, which were then allowed to rest for 7 days. (C and D) Spleens and lungs were then harvested, stimulated with or without peptide, and stained for IFN-γ. Plots in (A) and (C) were gated on donor CD8 + Thy1.1 + P14 T cells. Data are representative of 2 separate experiments with an n=2 mice per experiment. Data in (D) represent the mean ± SEM from 2 separate experiments. Statistical analysis was done using paired t tests. *p<.5, p<.1.
103 86 D % IFN-! + P14 CD8 T cells Spleen * Spleen Lung % IFN-! + P14 CD8 T cells Lung Spleen Lung Peptide alone APC + peptide Origin Origin
104 87 Figure 16. Reduced cytokine production by LCMV-specific CD8 T cells in peripheral tissues following ex vivo peptide stimulation. 1x1 3 P14 TCR transgenic Thy1.1 + CD8 T cells were transferred i.v. into naïve Thy1.2 + C57BL/6NCr mice prior to infection with LCMV. At 3 days p.i., cells were harvested from various tissues and cells were stimulated with or without peptide or peptide-pulsed EL-4 cells and subsequently stained for IFN-γ. The data showing the mean ± SEM from a total of 2 separate experiments with an n=4 mice per experiment. The kidneys, heart, and PEC were pooled from 4 mice per experiment. Sup., superficial; PEC, peritoneal exudate cells. Statistical analysis comparing the percent IFN-γ in the spleen from peptide alone stimulation to all other sites and stimulations was done using a one-way ANOVA with a Dunnett post-test. p<.1.
105 88 Peptide alone APC + peptide 1 % IFN-! + of P14 CD8 T cells Spleen Inguinal LN Sup. Cervical LN Bone marrow Thymus PBL Lung Liver Kidney Heart PEC
106 89 CHAPTER III FOXP3 + CD4 REGULATORY T CELLS LIMIT PULMONARY IMMUNOPATHOLOGY BY MODULATING THE CD8 T CELL RESPONSE DURING RESPIRATORY SYNCYTIAL VIRUS INFECTION Abstract Regulatory Foxp3 + CD4 T cells prevent spontaneous inflammation in the lungs, inhibit allergic and asthma responses, and contribute to tolerance to inhaled allergens. Additionally, Tregs have previously been shown to suppress the CD8 T cell response during persistent virus infections. However, little is known concerning the role Tregs play in modulating the adaptive immune response during acute respiratory virus infections. I show following acute RSV infection that Foxp3 + CD4 Tregs rapidly accumulate in the lung-draining medlns and lungs. 5-Bromo-2 -deoxyuridine (BrdU)- incorporation studies indicate that Tregs undergo proliferation that contributes to their accumulation in the lymph nodes and lungs. Following an acute RSV infection, pulmonary Tregs modulate CD25 expression and acquire an activated phenotype characterized as CD11a high, CD44 high, CD43 glyco+, ICOS +, and CTLA-4 +. Surprisingly, in vivo depletion of Tregs prior to RSV infection results in delayed virus clearance concomitant with an early lag in the recruitment of RSV-specific CD8 T cells into the lungs. Additionally, Treg depletion results in exacerbated disease severity including increased weight loss, morbidity, and enhanced airway restriction. In Treg-depleted mice there is an increase in the frequency of RSV-specific CD8 T cells that co-produce IFN-γ and TNF-α, which may contribute to enhanced disease severity. These results indicate that pulmonary Tregs play a critical role in limiting immunopathology during an acute
107 9 pulmonary virus infection by influencing the trafficking and effector function of virusspecific CD8 T cells in the lungs and draining lymph nodes. Introduction The respiratory tract forms a major mucosal interface with the external environment and is constantly exposed to inert foreign antigens and pathogens. Thus, the lungs must discriminate between innocuous and pathogen-derived antigens in order to limit chronic inflammation and maintain proper lung function. To do so, the respiratory system establishes a default anti-inflammatory state that requires a higher activation threshold for pathogen-associated danger signals than non-mucosal surfaces (4). Once the threshold for innate immune activation is exceeded, the immune system must initiate an appropriately balanced immune response that eliminates the pathogen while limiting damage to the host lung tissue. Since the lung is not an organized lymphoid tissue, the cellular composition of the lung parenchyma and airways undergoes drastic changes during an immune response (2). Consequently, the lung epithelium is directly exposed to the inflammatory milieu and is therefore susceptible to immune-mediated damage. Thus, failure to tightly regulate the immune response to respiratory pathogens can lead to pulmonary pathology resulting in diminished lung function. There are multiple regulatory mechanisms in the lungs to control the immune response to respiratory pathogens (4). The initial regulatory barriers in place prior to the induction of an adaptive immune response include active suppression by epithelial cells (188) and alveolar macrophages (22). For instance, exposure of alveolar macrophages to TGF-β that is tethered to airway epithelial cells via the α v β 6 integrin serves to maintain macrophages in an anti-inflammatory state and increases the activation threshold of danger signals received through TLRs that are needed to induce an immune response. Additionally, CD4 Tregs are essential in regulating the adaptive immune response (129, 22). Tregs, which are identified by expression of the transcription factor Foxp3 that is
108 91 the master regulator of Treg function (54, 55), prevent spontaneous inflammation in the lungs (45, 63), control atopic and asthmatic responses (58), and play in important role in establishing mucosal tolerance to antigens (58, 129). In recent years, it has become appreciated that Tregs can regulate immune responses to pathogens (23). The majority of studies examining the role of Tregs during infections have been performed in the context of persistent or chronic infections (69, , 24). During chronic infections, Tregs have primarily been shown to limit immunopathology mediated by pathogenspecific T cells, and, in some cases, may promote pathogen persistence (66). Importantly, relatively little is known about the role of Tregs during acute virus infections. To better understand the role of Foxp3 + Tregs during acute respiratory virus infections, I examined the Treg response following acute RSV infection. I show that Foxp3 + Tregs rapidly proliferate and accumulate in the lungs and medlns during acute RSV infection. In contrast to Tregs in lymphoid compartments, the majority of which are CD25 +, the frequency of CD25 + Tregs in the lungs decreases following infection. In addition, the majority of pulmonary Tregs upregulate expression of the inhibitory molecule CTLA-4 and acquire an activated phenotype. I demonstrate that Tregs coordinate the early recruitment of virus-specific CD8 T cells into the lung tissue and airways, but also limit the magnitude of the CD8 T cell response and their ability to produce TNF-α, which likely reduces disease severity. My data indicate that Tregs play an important role in the regulation of the adaptive CD8 T cell response that is the primary cause of RSV-induced lung immunopathology.
109 92 Materials and Methods Viruses and infection of mice The A2 strain of RSV was a gift from B. S. Graham (National Institutes of Health; NIH, Bethesda, MD) and was propagated on HEp-2 cells (American Type Culture Collections; ATCC, Manassas, VA). IAV mouse-adapted A/PuertoRico/8/34 (H1N1) was a gift from K. L. Legge and was grown as previously described (25). BALB/cAnNCr mice between the ages of 6-8 weeks were purchased from the National Cancer Institute (Bethesda, MD). C57BL/6NCr Foxp3 gfp mice (56) were obtained with permission from Stanley Perlman. Mice were anesthetized with isofluorane and infected i.n. with 2-3 x 1 6 PFU of RSV or 1 tissue culture infectious units of A/PR/8/34. All experimental procedures were approved by the University of Iowa s Animal Care and Use Committee. Tissue isolation and preparation The BAL fluid and lung tissue were harvested from mice by cannulation of the trachea and lavage with three successive washes with 1 ml of RPMI 164 (Gibco) supplemented with 1 U/ml penicillin G, 1 mg/ml streptomycin sulfate, 2 mm L- glutamine (Gibco),.1 mm non-essential amino acids (Gibco), 1 mm sodium pyruvate (Gibco), 1 mm HEPES (Gibco), 5 x 1-5 M 2-mercaptoethanol (Sigma, St. Louis, MO), and 1% FCS (Atlanta Biologicals, Lawrenceville, GA). After perfusing the lungs with 5 ml of PBS via the right ventricle of the heart, lungs were cut into small pieces and digested in 4 ml of Hanks buffered salt solution with CaCl 2 and MgCL 2 (Gibco, Grand Island, NY) supplemented with 125 U/ml collagenase (Invitrogen, Carlsbad, CA) and 6 U/ml DNase I (Sigma, St. Louis, MO) for 3 min at 37 C. Lymph nodes were similarly digested in 1 ml of Hanks buffered salt solution containing collagenase and DNase I as described above. Lungs were then pressed through a wire mesh screen (Cellector; Bellco
110 93 Glass, Inc., Vineland, NJ) and spleens and lymph nodes were pressed between the frosted ends of glass slides (Surgipath, Richmond, IL) to prepare single-cell suspensions. Cell Surface Staining Single-cell suspensions (1 x 1 6 to 2 x 1 6 cells) were plated in 96-well roundbottom plates (Corning Inc., Corning, NY) and blocked with anti-fcγrii/iii mab (clone 93) and simultaneously stained with optimal concentrations of mabs specific for CD4 (clone RM4.5), CD8 (clone ), Thy1.2 (clone ), CD25 (clone PC61.5), CD45RB (clone C363.16A), CD11a (clone M17/4), CD44 (clone IM7), CD43 (glycosylated; clone 1B11), CD69 (clone H1.2F3), GITR (clone DTA-1), OX4 (clone OX-86), ICOS (clone 7E.17G9), CD62L (clone MEL-14), CD13 (clone M29), β7 (clone M293), and CD49d (clone R1-2). All mabs were obtained from ebioscience (San Diego, CA) except for CD43, CD13, and β7, which were obtained from BD Biosciences (San Jose, CA). Cells were stained for 3 min at 4 C, washed twice with cold staining buffer (PBS, 2% FCS, and.2% sodium azide), and subsequently fixed with FACS lysing solution (BD Biosciences). Samples were run on a Becton Dickinson FACSCanto flow cytometer and data were analyzed using FlowJo software (Tree Star Inc., Ashland, OR). Tetramer staining Cells were plated in 96-well round-bottom plates (Corning Inc., Corning, NY), washed with staining buffer, and stained with optimal concentrations of RSV M specific APC-conjugated tetramers (obtained from the NIH Tetramer Core Facility, Atlanta, GA) and simultaneously blocked with anti-fcγrii/iii mab for 3 min at 4 C. Cells were washed once with cold staining buffer, stained for cell surface CD8 and Thy1.2, and subsequently washed and fixed with FACS lysing solution prior to analysis by flow cytometry.
111 94 Intracellular staining and BrdU Cells were stained for Foxp3 using the mouse regulatory T cell staining buffer kit (ebioscience) according to the manufacturer s instructions. Briefly, following cell surface staining and fixation, cells were stained with optimal concentrations of mab specific to Foxp3 (clone FJK-16s; ebioscience), CTLA-4 (clone UC1-4B9; ebioscience), and Ki-67 (clone 35; BD Biosciences). Cells were subsequently washed twice with 1X permeabilization buffer and resuspended in staining buffer. For BrdU studies, mice were administered 2 mg BrdU (Sigma) i.p. and.8 mg i.n. in pharmaceutical-grade PBS (Gibco) 24 hrs prior to analysis. To detect BrdU incorporation, cells were first stained for Foxp3 followed by intracellular BrdU staining with mab specific to BrdU (clone PRB-1; ebioscience) using the BrdU Flow kit (BD Biosciences) according to the manufacturer s instructions. DNase I for BrdU staining was obtained from Sigma. Samples were analyzed using flow cytometry. In vivo depletion of T cells Hybridoma cells producing anti-cd25 mab (clone PC61) were a gift from Thomas Waldschmidt (University of Iowa). Hybridoma cells producing anti-cd4 (clone GK1.5) and anti-cd8 (clone 2.43) were a gift from John Harty (University of Iowa). All mabs were produced in CELLine CL 1 chambers (Integra, Hudson, NH) using HyClone SFM4MAb w/l-glutamine media (Thermo-Scientific, Waltham, MA) according to the manufacturer s instructions. All mabs were purified using a 5% ammonium sulfate precipitation and dialyzed with pharmaceutical-grade PBS. To deplete CD25 + CD4 T cells, naïve BALB/cAnNCr mice were administered 1 mg anti- CD25 mab (PC61) i.p. 3 days prior to infection. Mice were then infected with RSV i.n. and administered 5 µg anti-cd25 mab i.p. 2 days later. In experiments where CD4 and CD8 T cells were depleted, mice were treated with 5 µg anti-cd8 mab (clone 2.43) or anti-cd4 mab (clone GK1.5) 1 day prior to infection and 1 and 7 days p.i.
112 95 Control mice were administered the same amounts of rat IgG (Sigma) in parallel with anti-cd25, anti-cd4, or anti-cd8 mab treatments. To confirm depletion of CD25 + CD4 T cells, cells were stained for cell surface CD4, Thy1.2, CD25 (clone 7D4; ebioscience), and intracellular Foxp3. The 7D4 clone does not recognize the same epitope on CD25 as the PC61 mab used for depletion (32). Depletion of CD4 and CD8 T cells was confirmed by staining for CD4 (clone RM4-4) or CD8β (clone ebioh ; ebioscience) and in conjunction with Thy1.2. Peptide stimulation Single-cell suspensions derived from the spleen, medlns, lung, and BAL were plated in 96-well round-bottom plates (Corning Inc.) for 5 hr at 37 C with or without 1 µm of M peptide in the presence of 1 µg/ml BFA (Sigma). All peptide were synthesized and purchased from Biosynthesis, Inc. After incubation, cells were subsequently stained for cell surface CD8 and Thy1.2. After fixation with FACS lysing solution, cells were incubated in permeabilization buffer (staining buffer containing.5% saponin; Sigma) for 1 min and stained with optimal concentrations of anti-ifn-γ (clone XMG1.2; ebioscience) and anti-tnf-α (clone MP6-XT22; ebioscience). Cells were washed once with permeabilization buffer and again with staining buffer prior to analysis by flow cytometry. Measurement of morbidity and airway resistance Enhance pause (Penh) was measured using a whole body plethysmograph (Buxco Electronics, Sharon, CT). Penh values were recorded daily prior to and following infection with RSV. Breathing patterns were recorded for 5 minutes per mouse to obtain an average Penh value. Mice were weighed daily and clinical scores were assigned based on the following scale:, no apparent illness; 1, slightly ruffled fur; 2, ruffled fur; 3, ruffled fur and inactive; 4, ruffled fur, inactive, hunched posture; and 5, moribund or dead.
113 96 Plaque assays Lungs were harvested from RSV-infected mice on days 4, 6, and 7 p.i. Lungs were placed in 1 ml of serum-free RPMI 164 and homogenized using a tissue homogenizer (Ultra Turrax T25; IKA). Homogenates were centrifuged at 2 rpm for 1 min and the cell-free supernatants were snap frozen in liquid nitrogen before being stored at -8 C. Samples were thawed and dilutions of supernatant were incubated on Vero cells (ATCC) in 6-well plates (BD Falcon) for 1.5 h at 37 C with gentle rocking. Cells were subsequently overlaid with 4 ml of 1% agarose (SeaKem ME agarose; Cambrex) in Eagle s MEM (Cambrex), incubated for 5 days at 37 C, and overlaid again with 2 ml of 1% agarose in Eagle s MEM containing a final concentration of.1% neutral red (Sigma-Aldrich). Following incubation at 37 C for an additional 24 hrs, the number of plaques were counted. Histology Whole lungs with the heart attached were removed from control or Treg-depleted mice 7 days p.i. Lungs were placed in 1% formalin (Fisher Scientific) in a vacuum to remove air from the lungs. Fixed lungs were embedded in paraffin, sectioned at 4 µm thickness, and either H&E or periodic acid-schiff (PAS) stained by the University of Iowa Comparative Pathology Laboratory. Slides were blinded and scored by a boardcertified veterinary pathologist (D. Meyerholz, University of Iowa, Iowa City, IA). Stained sections were scored for perivascular aggregates of leukocytes (PVA) from 1 to 4 on a graded scale in which 1 represents normal parameters and 4 represents moderate to high cellularity. Interstitial disease (ID) was scored on the following scale: 1, within normal parameters; 2, mild, detectable focal to multifocal congestion, uncommon to small numbers of leukocytes and some atelectasis; 3, moderate, multifocal to coalescing congestion, leukocyte cellularity, and atelectasis with rare luminal leakage of cellular and fluid debris; 4, Severe, coalescing interstitial congestion, leukocytes, and atelectasis with
114 97 admixed extensive of loss of airspace and luminal accumulation of cellular and fluid debris. Edema was scored from 1 to 4 on a graded scale in which 1 represents no edema and 4 represents multiple fields having coalescing alveoli filled by pools of fluid. Mucus airway obstruction was scored on the following scale: 1, normal epithelium and no luminal accumulation; 2, epithelial mucinous hyperplasia with thin strands of mucus lining the airways; 3, epithelial mucinous hyperplasia with luminal mucus accumulation partially filling the airways; 4, epithelial mucinous hyperplasia with luminal mucus filling and obstructing the airways. Data analysis Graphical analysis was performed using Prism software (Graphpad Software Inc., San Diego, CA). Statistical analyses were performed using InStat software (Graphpad Software, Inc.). Comparisons between two groups with normal Gaussian distributions were analyzed using paired or unpaired t tests (two-tailed), a Welch corrected unpaired t test for data with significant differences in SD between groups, or a Mann-Whitney U test for data without Gaussian distributions. Within-group comparisons to baseline were analyzed using a one-way ANOVA with a Dunnett post-test to control for multiple comparisons. Overall trends in longitudinal data between groups were analyzed using two-way repeated-measures ANOVA. P values were considered significant when p<.5. Results Foxp3 + Tregs rapidly accumulate in the lungs and medlns during RSV infection Treg responses to pathogens have been extensively studied in the context of persistent or chronic infections (66, 69, 197, 24, 26). In contrast, much less is known concerning the role of Tregs during acute infections (7). Following acute infection of
115 98 BALB/cAnNCr mice with RSV, the frequency of CD4 T cells that were Foxp3 + increased in the lung airways (BAL), lung parenchyma, and lung-draining medlns (Figs. 17A-D). By day 4 p.i., 25% of CD4 T cells in the BAL were Foxp3 +, representing a ~5- fold increase in absolute numbers over naïve numbers (Figs. 17A and B). By day 8 p.i., the total number of Tregs in the BAL had increased 86-fold over naïve mice. The lung parenchyma also exhibited an increase in the frequency and total number of Tregs (Figs. 17A and C). By day 6 p.i. the frequency of CD4 T cells that were Foxp3 + more than doubled compared to naïve frequencies (17% compared to 7%) which represented a ~3- fold increase in total numbers of Tregs over naïve mice. Thus, following infection with RSV there was an early enrichment of Tregs in the BAL and lung parenchyma. In contrast, the frequency of Foxp3 + CD4 T cells in the medlns remained relatively constant except for an early increase on day 2 p.i. (Fig. 17D). However, the absolute number of Tregs rapidly increased during the first several days p.i., indicating that the accumulation of Tregs paralleled that of Foxp3 - CD4 T cells. In contrast to the lungs and medlns, I did not observe large fluctuations in the frequency or total number of Foxp3 + CD4 T cells in the spleen or PBL (Figs. 17E and F). Concomitant with clearance of RSV from the lungs by day 7 p.i. (171), the number of Tregs decreased in the BAL, lung parenchyma, medlns, and spleen (Figs 17B-E). By day 15 p.i., absolute number of Tregs in the lung parenchyma and spleen had nearly returned to baseline levels. The decline in Treg numbers was more prolonged in the BAL and medlns, but total numbers were similar to baseline levels at day 22 p.i. I observed an increase in the frequency of Foxp3 + CD4 T cells in the medlns and spleen by day 22 p.i. along with increased Treg numbers in the spleen (Figs. 17D and E), which is consistent with studies showing an increase in Foxp3 + Tregs in mice as they age (66, 27). The kinetics of the Treg response following respiratory virus infection were not entirely unique to RSV; I observed a similar rapid accumulation of Tregs in the lungs and medlns of BALB/cAnNCr mice infected with IAV (Fig. 18). The Treg response to IAV
116 99 was delayed by several days compared to RSV infection and increased numbers of Tregs were maintained in the lung parenchyma for a longer duration. Similar to RSV, the Treg response remained localized to the primary site of infection. Finally, the Treg response to RSV and IAV infection were not unique to BALB/cAnNCr mice. There were similar kinetics in the lungs and medlns following infection of C57BL/6 Foxp3 gfp mice (Fig. 19). Proliferation of Foxp3 + Tregs during RSV infection The accumulation of Foxp3 + Tregs in the medlns and lungs during RSV infection could be explained by the recruitment and/or proliferation of Tregs. To determine if Tregs proliferate in response to RSV infection, I examined BrdU incorporation in parallel with the proliferation marker Ki-67. Twenty-four hrs prior to analysis, naïve or RSV-infected BALB/cAnNCr mice were administered BrdU both i.p. and i.n. to ensure efficient incorporation of BrdU by proliferating cells in the lung parenchyma and BAL (28). Consistent with previous reports (58, 68, 29), prior to infection the percentage of Tregs that were Ki-67 + or BrdU + was significantly higher than conventional Foxp3 - CD4 T cells (p<.1 for all except Ki-67 frequencies in the BAL) (Fig. 2). Following RSV infection, there was an increase in the frequency of proliferating Tregs in the BAL, lung parenchyma, medlns, and spleen compared to naïve controls. By day 6 p.i., 78% and 69% of Tregs in the BAL and lung parenchyma, respectively, were Ki In the spleen there was a much smaller increase over naïve levels relative to the lungs and medlns. By day 15 p.i. the frequency of proliferating Tregs in the lungs, medlns, and spleen had decreased to levels comparable to naïve mice. Due to the relatively short 24 hr BrdU pulse, I consistently observed higher frequencies of Ki67 + compared to BrdU + CD4 T cells. Interestingly, I observed a higher percentage of Foxp3 + Tregs undergoing proliferation as compared to Foxp3 - CD4 T cells at all times examined. These results demonstrate that RSV infection induces local
117 1 proliferation of Tregs that contributes to the accumulation of Foxp3 + Tregs in the BAL, lung parenchyma, and medlns. CD25 expression by Foxp3 + Tregs during RSV infection Since Tregs were proliferating and presumably becoming activated in response to RSV infection, I next wanted to examine the phenotype of pulmonary Tregs following infection. Although IL-2 is essential for the peripheral maintenance of Tregs (14, 21), it has previously been shown that while the majority of Foxp3 + CD4 T cells are CD25 + in secondary lymphoid tissues, this frequency is decreased in the lungs (56). To determine if CD25 was modulated during the course of infection, I tracked CD25 expression by Foxp3 + Tregs (Fig. 21). The frequencies of CD25 + Foxp3 + Tregs in the medlns and spleen remained relatively stable at ~8% throughout the course of infection. As expected, in naïve mice 59% of Tregs in the lung parenchyma were CD25 +. In contrast, 74% of Tregs in the BAL of naïve mice were CD25 +, suggesting that Tregs in the lung airways may up-regulate CD25 expression or that CD25 + Tregs are preferentially recruited to or retained in the airways. Following infection, the percentage of CD25 + Tregs in the lung parenchyma dipped to 5% and remained relatively stable afterwards. In contrast to the lung parenchyma, ~7-75% of Tregs in the BAL remained CD25 + during the first 8 days of infection. The frequency then decreased to 54% by day 15 p.i. and 6% at day 5 p.i. before eventually returning to baseline levels at day 22. Pulmonary Tregs acquire an activated phenotype during RSV infection To further assess the activation phenotype of Tregs, I compared pulmonary Tregs from naïve or RSV-infected mice for markers commonly associated with T cell activation. Consistent with previous reports that Tregs from naïve mice display an effector cell phenotype (32, 211), >9% of pulmonary Tregs were CD45RB low and ~4% were high for the memory markers CD11a and CD44 (Fig. 22). Approximately 4% of
118 11 Tregs expressed the activation-associated glycoform of CD43 (CD43 glyco ) and the costimulatory receptor ICOS, a low frequency (3%) of Tregs expressed CD69 and >9% were GITR high and FR4 high. Although Tregs from naïve mice had an effector phenotype, low CD69 expression suggested that they have not be recently activated. CTLA-4 is an inhibitory homolog of CD28 that is constitutively expressed by a portion of Tregs and has been implicated as a regulatory mechanism used by Tregs (63, 87, 88, 212). In the lung parenchyma, 37% of Tregs were CTLA-4 +. Few Tregs expressed the inhibitory molecules LAG-3 and programmed death-1 (PD-1). However, 15% of Foxp3 + Tregs expressed programmed death ligand-1 (PDL-1). By day 6 p.i., pulmonary Tregs further down-regulated CD45RB expression, 7-8% became CD11a high and CD44 high, and there was a 2.5-fold increase in the geometric mean fluorescence intensity (MFI) of GITR compared to Tregs from the lung parenchyma of naïve mice (Fig. 22). I also observed a significant (p<.1) increase in the frequency of Tregs expressing CD43 glyco (7%), ICOS (81%), CTLA-4 (78%), CD69 (34%), and PDL-1 (62%) compared to Tregs from the lungs of naïve mice. There were minimal changes in LAG3 and PD-1 expression. These data further demonstrate that pulmonary Tregs are highly activated during acute RSV infection. Pulmonary Tregs modulate trafficking molecules during infection I also examined the modulation of trafficking molecules on pulmonary Tregs. In naïve mice, 23% of pulmonary Tregs did not express CD62L (Fig. 23). By day 6 p.i., 54% of Tregs in the lung parenchyma had low CD62L expression. The α E β 7 integrin has been shown to be important for Treg trafficking to sites of inflammation such as the skin and lungs (211, 213). The frequency of α E - and β 7 -expressing Tregs in the lung parenchyma increased from 3% and 45%, respectively, in naïve mice to 4% and 67%, respectively, by day 6 p.i. (Fig. 23). Compared to Foxp3 - CD4 T cells, expression of the
119 12 α E and β 7 integrin chains were primary restricted to Foxp3 + CD4 T cells, suggesting that α E β 7 may be important for Treg trafficking into the lungs during RSV infection. Additionally, the α 4 β 1 integrin (very late antigen-4) has been demonstrated to be important for trafficking of lymphocytes into bronchus-associated lymphoid tissue via vascular cell adhesion molecule-1 expressed on high endothelial venules (214). I observed an increase in the frequency of both Foxp3 + Tregs and Foxp3 - CD4 T cells expressing high levels of the α 4 integrin chain. Thus, the α 4 integrin chain may also be important in trafficking of both Treg and effector CD4 T cells into the lungs. Depletion of Tregs delays virus clearance Depletion of Tregs has been shown in most infection models to accelerate pathogen clearance due to enhanced T cell responses (65, 66, 69, 24). Therefore, I next determined if depletion of Tregs altered the rate of virus clearance in the lungs. Naïve mice were treated with anti-cd25 mab 3 days prior to RSV infection and treated a second time 2 days p.i. to ensure sustained depletion of CD25 + Tregs. At the time of infection, in the lung parenchyma there was an ~86% reduction in the percentage of Foxp3 + Tregs that were CD25 + as detected by the anti-cd25 mab clone 7D4 (Figs. 24A and B). This decrease corresponded with a ~6% reduction in the frequency of Foxp3 + CD4 T cells, consistent with the depletion of this population (Fig. 24C). The residual frequency of Foxp3 + Tregs was expected based on my previous observation that only 59% of Tregs in the lung express CD25 (Fig. 21). There were similar virus titers on days 4 and 6 p.i. in the lungs of control and Treg-depleted mice (Fig. 25). However, despite only being able to eliminate 6% of the Tregs in the lung via anti-cd25-mediated depletion, I observed a significant (p<.1) delay in virus clearance. These data suggest that the virus-specific CD8 T cell response, which is necessary to mediate clearance of RSV (215, 216), might be negatively impacted when Treg numbers are reduced during infection.
120 13 Depletion of CD25 + Tregs delays the recruitment of RSVspecific CD8 T cells into the lung Multiple studies have shown that Tregs limit the magnitude of pathogen-specific CD8 T cell responses (69, 7, 73, 217), which would appear to be at odds with my data demonstrating that virus-clearance is delayed in Treg-depleted mice. Therefore, I next sought to examine the impact of Treg depletion on the magnitude and kinetics of the RSV-specific CD8 T cell response. Consistent with the role of Tregs in limiting overall inflammation, there were significantly (p<.1) more total cells in the lung parenchyma of Treg-depleted mice at both days 6 and 8 p.i. (Fig. 26A). Total cell numbers in the BAL and medlns were similar between groups on both days examined. On days 6 and 8 p.i. there were increased numbers of CD4 T cells in the lung parenchyma and on day 8 p.i. there were more CD8 T cells in the lung parenchyma and medlns (Figs. 26B and C). There were also substantially more NK cells (CD3 - DX5 + ) 6 days p.i. and more B cells (CD19 + B22 + ) and neutrophils (Ly6C + Ly6G + CD11b + ) 8 days p.i. in the lung parenchyma of Treg-depleted mice (Fig. 26D). To determine the effect of Treg depletion on the RSV-specific CD8 T cell response, I enumerated antigen-experienced CD11a high CD44 high CD8 T cells in the medlns, lung parenchyma, and BAL (Fig. 27A) (218). In Treg-depleted mice there were significantly (p<.1) more CD11a high CD44 high CD8 T cells in the medlns on days 6 and 8 p.i. In contrast, there were significantly (p<.5) fewer CD11a high CD44 high CD8 T cells in the lung parenchyma on day 6 p.i. However, by day 8 there was a ~1.6-fold increase in the number of antigen-experienced CD8 T cells compared to control mice. This increase was reflective of the ~1.6-fold increase in total CD8 T cells (Fig. 26C). There was no statistical difference observed in the BAL between control and Tregdepleted mice. I next examined the immunodominant M specific CD8 T cell response. On day 6 p.i. there were similar frequencies and numbers of M tetramer-specific CD8 T
121 14 cells in the medlns of Treg-depleted mice compared to controls (Figs. 27B and C). As indicated by the decrease in CD11a high CD44 high CD8 T cells, there was a significant (p<.1) decrease in both the frequency and total number of M tetramer-specific CD8 T cells in the lung parenchyma of Treg-depleted mice at day 6 p.i. I also examined the M specific CD8 T cell response via IFN-γ production (Fig. 28). Following ex vivo peptide stimulation, I observed a higher percentage of IFN-γ + CD8 T cells in the medlns of Treg-depleted mice at day 6 p.i. The discrepancy in frequencies of M specific CD8 T cells in the medlns at day 6 p.i. as measured by tetramer or IFN-γ is likely a result of decreased tetramer binding to newly activated T cells due to rearrangement of surface TCRs (186). I observed similar differences compared to tetramer staining in the lung parenchyma and BAL in the percentage of IFN-γ + CD8 T cells. These data suggest that there is impaired egress of M specific CD8 T cells from the lung-draining LNs into the lungs. Importantly, these data argue against the possibility of non-specific depletion of activated CD8 T cells that have upregulated CD25 expression as the cause of the decrease in the M specific CD8 T cell response in the lungs. Furthermore, I observed similar frequencies and total numbers of M specific IFN-γ + CD8 T cells in the spleen at day 6 p.i. (Fig. 28C). By day 8 p.i. in Treg-depleted mice, total numbers of M tetramer-specific CD8 T cells were similar to (in the BAL) or exceeding (in the lung parenchyma and medlns) those of control mice, which is in agreement with evidence that Tregs limit the magnitude of the CD8 T cell response (7, 73, 217). These data suggest that Tregs are important in coordinating early trafficking of virus-specific CD8 T cells into the lung parenchyma and airways. Tregs limit disease severity during RSV infection Given the altered kinetics of CD8 T cell accumulation in the lung, I next assessed morbidity in Treg-depleted mice. Compared to control mice, Treg-depleted mice exhibited increased clinical illness on days 7 and 8 p.i. (Fig. 29A) accompanied with
122 15 increased weight loss (Fig. 29B). Whole body plethysmography can be used to measure airway resistance (Penh) (Fig. 29C). Mice depleted of Tregs exhibited a delayed rise in Penh compared to control mice. Increased Penh values were sustained in Treg-depleted mice that could not be simply accounted for by a single day delay (day 8 Treg-depleted vs. day 7 control, p=.2; day 9 Treg-depleted vs. day 8 control, p=.2). These data indicated that depletion of Tregs results in increased airway resistance during infection. Lungs from Treg-depleted mice had increased severity of perivascular aggregates of leukocytes that primarily consisted of lymphocytes (Fig. 3). Compared to control mice, the lung airways of Treg-depleted mice also had more severe epithelial mucinous hyperplasia with luminal mucus filling and obstructing the airways. Thus, Treg depletion results in increased disease during the late immune phase that coincides with the adaptive immune response. Depletion of Tregs enhances TNF-α production by CD8 T cells The exacerbated disease severity observed in Treg-depleted mice during RSV infection could be explained by delayed virus clearance and/or enhanced T cell-mediated immunopathology. In Treg-depleted mice, CD8 T cells could contribute to enhanced disease by producing increased amounts of the pro-inflammatory cytokine TNF-α. TNFα has been shown to be a major cause of illness during acute RSV infection (219). Following ex vivo peptide stimulation, higher frequencies of M specific CD8 T cells from Treg-depleted mice were capable of co-producing IFN-γ and TNF-α relative to control mice (Figs. 31A and B). Compared to control mice, a higher frequency of CD8 T cells isolated from the lung parenchyma and BAL of Treg-depleted mice co-produced IFN-γ and TNF-α on day 6 p.i. and from the medlns on both 6 and 8 days p.i. While there were lower total numbers of M specific CD8 T cells in the lungs day 6 p.i. (Figs. 27 and 28), this increase in TNF-α production translated into significantly
123 16 (p<.1) higher total numbers of M specific CD8 T cells capable of co-producing IFN-γ and TNF-α in the medlns, a trend toward increased total numbers in the spleen (p=.6), and similar numbers in the lung (Fig. 31D). Additionally, increased per cell production of TNF-α in Treg-depleted mice as indicated by MFI could further account for CD8 T cell-mediated disease. The MFI of TNF-α in Treg-depleted mice was substantially higher than in control mice; there was a ~1.5-fold and ~1.9-fold increase in the TNF-α MFI in the lung parenchyma and BAL, respectively, on day 6 p.i. (Figs. 31A and C). In the medlns there was a ~1.7-fold increase in TNF-α MFI on both 6 and 8 days p.i. Consequently, increased in vivo production of TNF-α in Treg-depleted mice would likely contribute to enhanced disease. Depletion of Tregs enhances T cell-mediated immunopathology To specifically examine whether CD8 or CD4 T cells contribute to increased disease severity in Treg-depleted mice, I depleted either CD8 or CD4 T cells in addition to depleting CD25 + Tregs prior to infection with RSV (Figs. 32A and B). The weight loss and elevated Penh observed during RSV infection in Treg-depleted mice was abrogated when CD8 T cells were also depleted (Figs. 32C and D). These data would be consistent with increased TNF-α production by CD8 T cells as the primary cause of enhanced disease. Surprisingly, depletion of CD4 T cells also abrogated any weight loss or increase in Penh. To examine whether CD4 T cells may contribute to the immunopathological CD8 T cell response in Treg-depleted mice, I examined the magnitude of the M specific CD8 T cell response 9 days p.i. Whereas the M specific CD8 T cell response in the spleen and lung parenchyma was larger in Tregdepleted mice, there was no increase in mice that had also been depleted of all CD4 T cells (Figs. 32E and F). This suggests that the enhanced CD8 T cell response observed in Treg-depleted mice requires aid from a Foxp3 - CD25 - CD4 T cell subset(s).
124 17 Discussion The majority of studies examining Foxp3 + Tregs during immune responses have focused on pathogens that establish chronic infections (69, , 24). Since depletion of Tregs prior to acute infection with LCMV, the most widely studied virus in viral immunology, did not appear to affect the CD8 T cell response (69), much of the focus has remained on chronic infection models. Regardless of the reasons, much less is known about the Treg response to pathogens during acute infections. In order to characterize the activation state of Tregs during acute RSV infection, I examined a broad panel of T cell activation markers. Given that IL-2 is important for the maintenance of Tregs in the periphery (14), it is curious that roughly half of Foxp3 + Tregs in the lungs do not express CD25. The high-affinity IL-2R is comprised of CD25 (IL-2Rα), CD122 (IL-2Rβ), and CD132 (γc). While IL-2 can still signal through the low-affinity IL-2 receptor comprised of the IL-2Rβ and γc chains, the low-affinity IL-2R is not sufficient for peripheral Treg maintenance as IL-2 or CD25 deficient mice have a drastic reduction (~5%) in the frequency of peripheral Tregs and suffer from severe autoimmunity (14, 21). After IL-2 binds the IL-2R, the complex is internalized and CD25 is recycled back to the cell surface. Since ~2% of Foxp3 + Tregs do not express CD25 at any given time, this may reflect a population of Tregs that recently bound IL-2. In preliminary experiments where I stained for intracellular CD25, there was no increase in the frequency of CD25 + Tregs, indicating that internalization of CD25 is not accounting for the ~2% of CD25 - Tregs. Furthermore, following depletion of Tregs with anti-cd25 mab, the CD25 - Treg population remained stable, which would not be expected if CD25 was recycled back to the cell surface. Alternatively, CD25 - Foxp3 + Tregs may be a stable population with unique regulatory properties from those of CD25 + Tregs. mrna expression profiles between CD25 - and CD25 + Tregs showed increased message for the co-stimulatory receptor ICOS and chemokine receptors (CCR2, CXCR3, CCR5), suggesting that this population may be enriched in tissue-homing Tregs (21).
125 18 Additional analysis of activation-associated molecules on Tregs during infection revealed that the vast majority of Tregs in the lungs exhibited an activated phenotype (CD11a high, CD44 high, CD43 glyco+, ICOS +, CTLA-4 + ) and the majority were CD62L - and expressed the α 4 and β 7 integrin chains. Relative to the Foxp3 + Treg population, the frequency of Foxp3 - CD4 T cells expressing these molecules was notably reduced. This is perhaps not unexpected since the conventional CD4 T cell response is likely made up of a diverse array of differentiated subsets and memory CD4 T cells non-specifically recruited into the lung. However, it has been suggested that some of the markers expressed by Tregs identify distinct populations with different inhibitory mechanisms or trafficking profiles. For instance, it has been suggested that expression of the α E integrin chain or ICOS may identify two functionally distinct subsets of Foxp3 + Tregs (114, 211, 213, 22, 221). Following RSV infection, the majority of Tregs in the lung parenchyma upregulated CTLA-4. Recent studies have shown that CTLA-4 expressed by Foxp3 + Tregs is required to maintain systemic tolerance (63, 88). However, in the context of an infection, it is unknown if Treg-specific expression of CTLA-4 is required to regulate T cell activation or if CTLA-4 expressed by non-regulatory T cells is sufficient. Since effector T cells also express CTLA-4 during infection, it is less clear to what extent CTLA-4 expressed by Tregs regulates T cell activation and proliferation. Further studies using CTLA-4 conditional knockout mice lacking CTLA-4 in Foxp3 + Tregs would help elucidate the role of Treg-associated CTLA-4 during RSV infection. While my data revealed that Tregs are activated during RSV infection, it is not clear what signals induce the activation of Tregs. This is especially unclear for natural Tregs, which are believed to recognize self-antigens (122, 24). If one assumes that the majority of the Foxp3 + Tregs responding to RSV infection are natural Tregs, there are several possible ways to explain their activation (69). One possibility is that natural Tregs recognize tissue-specific antigens in the context of non-tolerogenic inflammation caused by the infection. Another possibility is that natural Tregs recognize pathogen-
126 19 derived antigens. However, there is little evidence that there is broad cross-reactivity between pathogen- and self-derived antigens. Furthermore, since Tregs have been shown to respond to a wide variety of pathogens, the majority of which establish chronic infections, cross-reactivity would have to be the rule rather than the exception. In a third scenario, natural Tregs maybe non-specifically activated through recognition receptors such as TLRs or cytokines such as type I IFNs. Tregs express multiple TLRs including TLR4, 5, 7, and 8 (125). This may be an intriguing possibility in the case of RSV infection since the RSV F protein has been shown to induce TLR4 signaling (222). During certain conditions, antigen-specific adaptive Tregs can be generated in the periphery (129). Evidence for the development of atregs is strongest at mucosal sites such as the intestinal tract and the lungs (58, 113, 129). For instance, intranasal delivery of antigen results in the conversion of conventional Foxp3 - CD4 T cells into atregs that can prevent allergic inflammation (58, 223). In response to pathogens, the generation of atregs has been shown during persistent infections where antigen may be present in subimmunogenic conditions with low levels of inflammatory cytokines or low expression of costimulatory molecules (129). In contrast, acute infections may not provide the right type of environment that would require the additional regulation provided by atregs (23). There is evidence that a small frequency of Foxp3 + Tregs in the lungs is RSVspecific as determined by tetramers (142). However, since the frequency of RSV-specific tetramer + CD4 T cells identified in this study was small (<1% of the total CD4 T cells in the lung), it is difficult to extrapolate what fraction of Foxp3 + Tregs are RSV-specific. A recent study indicated that the transcription factor Helios is expressed in natural Tregs but not atregs (57). Examining Helios expression by Foxp3 + Tregs during RSV infection could help assess whether atregs are generated during acute respiratory infection. A caveat in using anti-cd25 mab (clone PC61) to deplete CD25 + Tregs is that it could non-specifically deplete pathogen-specific Tregs that transiently upregulate CD25 early after activation. I believe this to be unlikely in my RSV model for several reasons.
127 11 First, a common outcome for PC61 depletion of Tregs is an increase in the magnitude of the pathogen-specific CD8 T cell response (69), which I showed occurs by day 8 post- RSV infection (Figs. 27, 28, and 32). This outcome would not be likely if a substantial number of activated RSV-specific CD8 T cells were eliminated by PC61 mab early after activation. Second, PC61 depletion may only effectively target CD25 high cells (i.e. Tregs). In support of this, during RSV infection Ruckwardt et al. reported that the frequency of CD8 or Foxp3 - CD4 T cells that were CD25 + did not differ between control and PC61-treated mice (7). Foxp3 + Tregs are commonly implicated in the suppression of the adaptive immune response to pathogens as a way to limit immunopathology. However, there is evidence that Tregs coordinate innate and adaptive immune responses to pathogens. Tregs have been reported to promote the trafficking of effector immune cells to the primary site of infection during genital HSV-2 infection (224) and in CB6F1 hybrid mice during RSV infection (7). Conversely, Tregs may also be able to block trafficking by inhibiting expression of chemokine receptors (225). During RSV infection in Tregdepleted CB6F1 mice, there was a significant lag in the D b M specific CD8 T cell responses in the lungs compared to control mice. This lag in the virus-specific T cell response corresponded with decreased virus clearance in the lungs on days 6 and 7 p.i. My study substantiates this role of the Treg response in the RSV BALB/c mouse model. Importantly, my data offers the novel observation that there is an early accumulation of RSV-specific CD8 T cells in the lung-draining medlns of Treg-depleted mice, suggesting that there is delayed egress out of the medlns into the lungs. These findings suggest that Tregs help coordinate the early trafficking of activated CD8 T cells from the draining LNs into the lungs. Tregs may influence expression of chemokines in the lungs or chemokine receptors on virus-specific CD8 T cells. During RSV infection, CXCL1 has been shown to be important for the recruitment of virus-specific CD8 T cells into the lungs (226). Initial experiments did not reveal obvious differences in the chemokines
128 111 CXCL9, CXCL1, CXCL11, CCL3, and CCL5 in the lung parenchyma and BAL as a whole, but there may be more subtle differences in chemokines produced by specific immune cell populations. Alternatively, Tregs could influence expression levels of sphingosine 1-phosphate receptor-1 (S1P1) or its antagonist, CD69, on CD8 T cells in the draining LNs, which control their egress from the draining LNs into the periphery. Much of what is known about RSV-induced pathogenesis comes from studies in the BALB/c mouse model (215, 227). In this study I demonstrated that depletion of CD25 + Tregs prior to infection exacerbated disease severity. Given that I was only able to deplete ~6% of Foxp3 + Tregs, I believe that my results represent an underestimate of the overall effect that Tregs have in limiting pulmonary immunopathology. Alternatively, CD25 - Tregs may not be important in regulating the adaptive immune response. This study uniquely demonstrates that increased in vivo production of TNF-α by RSV-specific CD8 T cells could contribute to increased morbidity in Treg-depleted mice. While there was no major increase in TNF-α production by CD8 T cells reported in Treg-depleted CB6F1 mice during RSV infection (7), I observed notable increases in ex vivo production of TNF-α by CD8 T cells in the lungs and medlns of Treg-depleted mice. Whereas depletion of Tregs and CD8 T cells prior to RSV infection eliminated disease, CD4 T cell depletion also eliminated disease. Since CD4 depletion cancelled the increased magnitude of the CD8 T cell response seen in Treg-depleted mice, this indicates that loss of Treg-mediated regulation may affect the CD8 T cell response indirectly through other CD4 T cell subsets. RSV is the leading cause of severe lower respiratory virus infections in infants and is the second leading cause of virus-induced respiratory disease in the elderly and adults with chronic cardiopulmonary disorders or who are immunocompromised (2, 228). While CD8 T cells are important in RSV clearance from the lungs, they may also contribute to disease pathology (229), although to what extent remains controversial (228). In addition to inhibiting autoimmunity to self-antigens, it is increasingly evident
129 112 that Foxp3 + Tregs have an important role in regulating the adaptive immune response to pathogens (23). By better understanding the function of Tregs during acute respiratory virus infections, I will gain further insight of the mechanisms in place to regulate virusspecific T cell responses. This may lead to the ability of the T cell response to be manipulated to optimize virus clearance while minimizing immunopathology. It will be important to further expand these studies to other respiratory pathogens to better understand host-pathogen interactions and how Tregs regulate the immune response.
130 113 Figure 17. Foxp3 + Tregs accumulate in the lungs and medlns following RSV infection. BALB/cAnNCr mice were infected with RSV i.n. and cells from the BAL, lung parenchyma, medlns, spleen, and PBL were collected at the indicated times. (A) Representative Foxp3 and CD25 staining 6 days p.i. Plots are gated on CD4 + Thy1.2 + cells. (B-F) The percentage of CD4 T cells that are Foxp3 + (open squares, left y-axis) and the total number of Foxp3 + CD4 T cells (filled circles, right y-axis) were determined by flow cytometry. In (F), only the percentage of CD4 T cells that are Foxp3 + is shown. Numbers in the plots represent the fold-increase in the total number of Foxp3 + Tregs over naïve controls. The data for the spleen, medln, and PBL represent the mean ± SEM from 2 separate experiments at each time point with n=4 mice per experiment except for day 5, which represents 3 separate experiments. Data for the lung parenchyma and BAL represent data from 2 separate experiments on days 2, 8, 15, and 22; 3 experiments on days, 4, 5; and 4 experiments on day 6. BAL was pooled from 4 mice per experiment and divided by 4 to determine the total number of cells. Statistical analysis of total numbers of Tregs compared to baseline (day ) numbers was done on log 1 -transformed data using one-way ANOVA with Dunnett post-tests. *p<.5, p<.1.

131 114 A BAL Lung MedLN Spleen PBL Foxp CD B C D % Foxp3 + of CD4 T cells E % Foxp3 + of CD4 T cells BAL 86x * Day post-infection Spleen 1 7 * * Day post-infection Total # of Foxp3 + CD4 T cells Total # of Foxp3 + CD4 T cells % Foxp3 + of CD4 T cells F % Foxp3 + of CD4 T cells x Lung Day post-infection PBL Day post-infection Total # of Foxp3 + CD4 T cells % Foxp3 + of CD4 T cells MedLN 1.3x Day post-infection Total # of Foxp3 + CD4 T cells
132 115 Figure 18. Foxp3 + Tregs accumulate in the lungs and medlns during IAV infection. BALB/cAnNCr mice were infected with IAV i.n. and cells from the BAL, lung parenchyma, medlns, spleen, and PBL were collected at the indicated times. (A) Representative Foxp3 and CD25 staining 6 days p.i. Plots are gated on CD4 + Thy1.2 + cells. (B-F) The percentage of CD4 T cells that are Foxp3 + (open squares, left y-axis) and the total number of Foxp3 + CD4 T cells (filled circles, right y-axis) were determined by flow cytometry. In (F), only the percentage of CD4 T cells that are Foxp3 + is shown. Numbers in the plots represent the fold-increase in the total number of Foxp3 + Tregs over naïve controls. The data for the BAL, lung parenchyma, and medlns represent the mean ± SEM from 2 separate experiments at each time point with n=4 mice per experiment except for days and 6, which represent 3 separate experiments. Data for the spleen and PBL represent 2 experiments at each time point. BAL was pooled from 4 mice per experiment and divided by 4 to determine the total number of cells. Statistical analysis of total numbers of Tregs compared to baseline (day ) numbers was done on log 1 - transformed data using one-way ANOVA with Dunnett post-tests. *p<.5, p<.1.
133 116 A BAL Lung MedLN Spleen PBL Foxp CD BAL B C Lung D % Foxp3 + of CD4 T cells E % Foxp3 + of CD4 T cells x Day post-infection Spleen Day post-infection Total # of Foxp3 + Tregs Total # of Foxp3 + CD4 T cells % Foxp3 + of CD4 T cells F % Foxp3 + of CD4 T cells * PBL 2.6x Day post-infection Day post-infection Total # of Foxp3 + Tregs % Foxp3 + of CD4 T cells MedLN 9x Day post-infection Total # of Foxp3 + Tregs
134 117 Figure 19. C57BL/6NCr mice exhibit robust Treg responses to RSV and IAV infection. C57BL/6NCr mice were infected i.n. with RSV or IAV and cells from the BAL (A), lung parenchyma (B), medlns (C), spleen (D), and PBL (E) were collected at the indicated times. The total number of Foxp3 + CD4 T cells was determined by flow cytometry. The data from RSV-infected mice represents the mean ± SEM from 1-2 separate experiments at each time point with n=4 mice per experiment. The data from IAV-infected mice represent the mean ± SEM from 1 experiment at each time point. BAL was pooled from 4 mice per experiment and divided by 4 to determine the total number of cells. Statistical analysis of total numbers of Tregs compared to baseline (day ) numbers was done on log 1 -transformed data using one-way ANOVA with Dunnett post-tests. *p<.5, p<.1.
135 118 A B C Total # of Foxp3 + BAL 1 4 RSV PR Total # of Foxp Lung * Total # of Foxp MedLN Day post-infection Day post-infection Day post-infection D Total # of Foxp Spleen * E % Foxp3 + of PBL PBL Day post-infection Day post-infection
136 119 Figure 2. Foxp3 + Tregs proliferate in response to RSV infection. Naïve or RSVinfected BALB/cAnNCr mice were administered BrdU i.p. and i.n. and cells were harvested 24 hrs later at the times indicated. (A) Representative Ki-67 and BrdU staining from various times p.i. Plots are gated on CD4 + Thy1.2 + cells from the lungs. (B-E) The percentage of Foxp3 - (open symbols) or Foxp3 + (closed symbols) CD4 T cells that were BrdU + (circles) or Ki-67 + (squares) is shown for Tregs from the BAL (B), lung parenchyma (C), medlns (D), and spleen (E). Data represent the mean ± SEM from 4 separate experiments for BrdU data and 2 separate experiments for Ki-67 data at each time point with n=4 mice per experiment. BAL was pooled from 4 mice per experiment. Statistical analysis of the frequencies of BrdU + or Ki-67 + Foxp3 + Tregs compared to baseline levels (day ) was done using one-way ANOVA with Dunnett post-tests. p<.1.

137 12 A D D4 D6 D Foxp Ki BrdU B BAL C Lung Frequency Foxp3 + BrdU + Foxp3 + Ki Foxp3 - BrdU + Foxp3 - Ki Day post-infection D 1 8 MedLN Day post-infection E 1 8 Spleen Frequency Day post-infection Day post-infection
138 121 Figure 21. Foxp3 + Tregs modulate CD25 expression following RSV infection. BALB/cAnNCr mice were infected with RSV i.n. and the percentage of Foxp3 + Tregs expressing CD25 in the BAL, lung parenchyma, medlns, and spleen was determined at the times indicated. Data represent the mean ± SEM from 2-3 separate experiments except for data from day 22, which represents a single experiment. There were n=4 mice per experiment at each time point. BAL was pooled from 4 mice per experiment. Statistical analysis of the frequencies of CD25 + Tregs compared to baseline levels (day ) was done using one-way ANOVA with Dunnett post-tests. *p<.5, p<.1.
139 122 % CD25 + of Foxp * BAL Lung MedLN Spleen Day post-infection
140 123 Figure 22. Pulmonary Tregs acquire an activated phenotype following RSV infection. Cells from the lung parenchyma (post-bal) were stained for various markers and intracellular Foxp3. (A and C) Histogram plots are gated on Foxp3 + CD4 T cells from naïve mice (grey shaded) or from mice infected with RSV 6 days earlier (solid line). Vertical dotted lines indicate where gates were drawn based on isotype staining (CD43 glyco, ICOS, CD69, CTLA-4, LAG3, PD-1, and PDL-1) or for CD45RB, CD11a, CD44, GITR, and FR4 expression. CD43 glyco is the activation-associated glycoform of CD43. Plots are representative of data from 2 separate experiments. (B and D) Cumulative data from histograms showing marker expression by Foxp3 - ( ) and Foxp3 + ( ) CD4 T cells from the lungs of naïve or RSV-infected lungs 6 days p.i. Error bars represent the SEM. Data were analyzed using Welch corrected unpaired t tests. Relative to naïve mice within each subset (Foxp3 - or Foxp3 + ), all changes in percent expression of markers in RSV-infected mice were statistically significant (p<.1) except for changes in FR4 expression.
141 124 A CD45RB CD11a CD44 CD43 glyco ICOS Naive CD4 Foxp3 + D6 RSV CD4 Foxp3 + CD B 1 CD45RB low 1 CD11a high 1 CD43 glyco+ 1 CD44 high ICOS CD69 + % expression Naive RSV Naive RSV Naive RSV Naive RSV Naive RSV Naive RSV Naive RSV Naive RSV Naive RSV Naive RSV Naive RSV Naive RSV C GITR FR4 CTLA-4 LAG3 PD-1 PDL D 1 GITR high 1 FR4 high 1 CTLA LAG PD PDL Naive RSV Naive RSV Naive RSV Naive RSV Naive RSV Naive RSV Naive RSV Naive RSV Naive RSV Naive RSV Naive RSV Naive RSV
142 125 Figure 23. Pulmonary Tregs modulate trafficking molecules following RSV infection. Cells from the lung parenchyma (post-bal) were stained for various extracellular markers and intracellular Foxp3. (A) Histogram plots are gated on Foxp3 + CD4 T cells from naïve mice (grey shaded) or from mice infected with RSV 6 days earlier (solid line). Vertical dotted lines indicate where gates were drawn based on isotype staining (CD62L and CD13) or for β7 and CD49d expression. Plots are representative of data from 2 separate experiments. (B) Cumulative data from histograms showing marker expression by Foxp3 - ( ) and Foxp3 + ( ) CD4 T cells from the lungs of naïve or RSV-infected lungs 6 days p.i. Error bars represent the SEM. Data were analyzed using Welch corrected unpaired t tests. Relative to naïve mice within each subset (Foxp3 - or Foxp3 + ), all changes in percent expression of markers in RSV-infected mice were statistically significant (p<.1).
143 126 A Naive CD4 Foxp3 + D6 RSV CD4 Foxp3 + CD62L CD13 (! E ) " 7 integrin CD49d (! 4 ) B CD62L low CD13 + (! E ) " 7 integrin + CD49d + (! 4 ) % expression Naive RSV Naive RSV Naive RSV Naive RSV Naive RSV Naive RSV Naive RSV Naive RSV
144 127 Figure 24. Depletion of CD25 + Tregs prior to and following infection with RSV. CD25 + Tregs were depleted in BALB/cAnNCr mice prior to infection with RSV. (A) Representative depletion of CD25 + Tregs 3 days post-treatment of naïve mice with control IgG or anti-cd25 mab (clone PC61). Cells were stained with the anti-cd25 clone 7D4. Plots are gated on CD4 + Thy1.2 + cells. (B) The percent of Foxp3 + Tregs that are CD25 + in control or Treg-depleted mice. (C) The percent of CD4 T cells that are Foxp3 + in control or Treg-depleted mice. Data in (B and C) represent the mean ± SEM from 2 separate experiments with n=4 mice per experiment. Data were analyzed using unpaired t tests. p<.1.
145 128 A Spleen Control Treg-depleted Foxp3 % CD25 + of Foxp3 + cells Lung B CD25 (7D4) C Control Treg-depleted 6 8 % Foxp3 + of CD4 T cells Day post-infection Day post-infection
146 129 Figure 25. Depletion of Tregs delays virus clearance. Tregs were depleted in BALB/cAnNCr mice with anti-cd25 mab (clone PC61) treatment as described in Materials and Methods. Control mice received rat IgG. Following infection with RSV, virus titers were measured in the lungs of control or Treg-depleted mice. The dashed line represents the limit of detection. Data represent 2 separate experiments for day 4 and 6 p.i. and 4 separate experiments for day 7 p.i. with n=4 mice per experiment. Error bars represent the SEM. Data were analyzed using nonparametric Mann-Whitney U tests.
147 Control Treg-depleted PFU/gram of lung p< Day post-infection
148 131 Figure 26. Total numbers of cells in the medlns, lung parenchyma, and BAL of control or Treg-depleted mice. BALB/cAnNCr mice were depleted of Tregs prior to acute RSV infection. Total numbers of cells (A), CD4 T cells (B), and CD8 T cells (C) in the medlns, lung parenchyma, and BAL were determined in control or Treg-depleted mice on days 6 and 8 p.i. (D) Total numbers of B cells (CD19 + B22 + ), NK cells (CD3 - DX5 + ), and neutrophils (Ly6C + Ly6G + CD11b + ) were enumerated by flow cytometry in the lungs (post-bal) 6 and 8 days p.i. Data in (A) and (C) represent 5 experiments on day 6 p.i. and 2 experiments on day 8 p.i. with n=4 mice per experiment. Data in (B) and (D) represent 2 experiments with n=4 mice per experiment. Error bars represent the SEM. All data were log 1 transformed prior to statistical analysis with unpaired t tests. *p<.5, p<.1.
149 132 A Total # of cells B Total # of CD4 T cells 1 8 Control Treg-depleted MedLN 6 8 Day p.i. 6 8 Day p.i Lung 6 8 Day p.i. 1 7 * 6 8 Day p.i BAL 6 8 Day p.i. 6 8 Day p.i. C Total # of CD8 T cells D Total # MedLN Lung BAL * Day p.i. Day p.i. Day p.i. B cells NK cells Neutrophils * Day p.i. Day p.i. Day p.i.
150 133 Figure 27. Decreased early recruitment of RSV-specific CD8 T cells into the lungs in Treg-depleted mice as measured by tetramer. BALB/cAnNCr mice were depleted of Tregs prior to acute RSV infection. (A) Total numbers of CD11a high CD44 high CD8 T cells were determined in the medlns, lung parenchyma, and BAL 6 and 8 days p.i. Cells from the medlns and lung parenchyma of naïve mice were used to determine the gating for CD11a high CD44 high CD8 T cells in RSV-infected mice. Data represent 5 experiments on day 6 p.i. and 2 experiments on day 8 p.i. with n=4 mice per experiment. (B) Frequency of M tetramer + CD8 T cells from the medlns, lung, and BAL 6 days p.i. Plots are gated on CD8 + Thy1.2 + cells. (C) Frequency (top) and total numbers (bottom) of M tetramer + CD8 T cells in the medlns, lung parenchyma, and BAL 6 and 8 days p.i. MedLNs and lungs from naïve mice were used as controls for tetramer staining. Data represent 3 experiments on day 6 p.i. and 2 experiments on day 8 p.i. with n=4 mice per experiment. Error bars represent the SEM. Data were analyzed using unpaired t tests. Data were log 1 -transformed except for the top panel of (B) prior to analysis. *p<.5, p<.1.

151 134 A MedLN Lung BAL Total # of CD11a hi /CD44 hi CD8 T cells B Control Treg-depleted Control 1 7 Treg-depleted 6 8 Day p.i. 1 6 * 6 8 Day p.i Day p.i. MedLN Lung BAL CD8 M2 82 Tetramer C % M2 82 Tet + of CD8 T cells Total # of M2 82 Tet + CD8 T cells MedLN Control Treg-depleted 6 8 Day p.i Lung 6 8 Day p.i. * BAL * 6 8 Day p.i. * Day p.i Day p.i Day p.i.
152 135 Figure 28. Decreased early recruitment of RSV-specific CD8 T cells into the lungs in Treg-depleted mice as measured by IFN-γ production. BALB/cAnNCr mice were depleted of Tregs prior to acute RSV infection. Cells from the medlns, lung parenchyma, and BAL were stimulated ex vivo with M peptide and stained for intracellular IFN-γ. (A) Frequencies of IFN-γ + CD8 T cells from mice infected with RSV 6 days earlier. Plots are gated on CD8 + Thy1.2 + cells and are representative of 4 separate experiments. (B) Frequency (top) and total numbers (bottom) of IFN-γ + CD8 T cells in the medlns, lung parenchyma, and BAL 6 and 8 days p.i. Data represent 4 experiments on day 6 p.i. and 2 experiments on day 8 p.i. with n=4 mice per experiment. (C) Frequencies (left) and total numbers (right) of IFN-γ + M specific CD8 T cells in the spleen 6 days p.i. Data represent 2 experiments with n=4 mice per experiment. Error bars represent the SEM. Data were analyzed using unpaired t tests. Data were log 1 - transformed except for the top panel of (B) prior to analysis. *p<.5, p<.1.

153 136 A Control Treg-depleted B % IFN-! + of CD8 T cells Total # of IFN-! + CD8 T cells CD MedLN Lung BAL x * 6 8 Day p.i Day p.i MedLN Lung BAL 2.4x x 1.5x * * 6 8 Day p.i. 2.6x p=.6 2x p=.54 IFN-! C % IFN-! + of CD8 T cells 2. n.s Control Control Treg-depleted Treg-depleted Spleen Total # IFN-! + CD8 T cells (x1 5 ) 1.5 n.s Control Treg-depleted Day p.i Day p.i Day p.i.
154 137 Figure 29. Depletion of Tregs exacerbates the severity of RSV-induced disease. BALB/cAnNCr mice were depleted of Tregs prior to acute RSV infection. Mice were monitored daily for clinical illness (A), weight loss (B), and Penh (C). Airway resistance was assessed using a whole body plethysmograph. Data represent the mean ± SEM from 3 separate experiments with n=4 mice per experiment. Statistical analysis found a difference in weight loss and Penh (p=.51 and p<.1, respectively) in the overall trends between control and Treg-depleted mice using two-way repeated-measures ANOVA. Individual days in (A-C) were analyzed using nonparametric Mann-Whitney U tests. p<.1.
155 138 A Illness score Control Treg-depleted B Day post-infection % starting weight C Day post-infection Penh Day post-infection
156 139 Figure 3. Increased inflammation and mucus in the lungs of Treg-depleted mice. Whole lungs from control (A) or Treg-depleted mice (B) were collected, sectioned and either H&E or PAS stained. Sections were scored for perivascular aggregates of leukocytes (PVA), interstitial disease (ID), edema and mucus. On low magnification (original magnification 4x), control and Treg-depleted mice were distinguished by prominent perivascular inflammation (left panels) that was mostly composed of lymphoid cells (middle panels, original magnification 2x). Treg-depleted mice also had severe mucinous changes (right panels) with some airways completely obstructed by mucus (arrow). Insets in the right panels are PAS-stained serial sections that highlight magenta stained mucus in the airway lumen. (C) Cumulative histological scores. Images (A and B) and scores (C) are representative of 8 mice per group. All data were analyzed using nonparametric Mann-Whitney U tests.
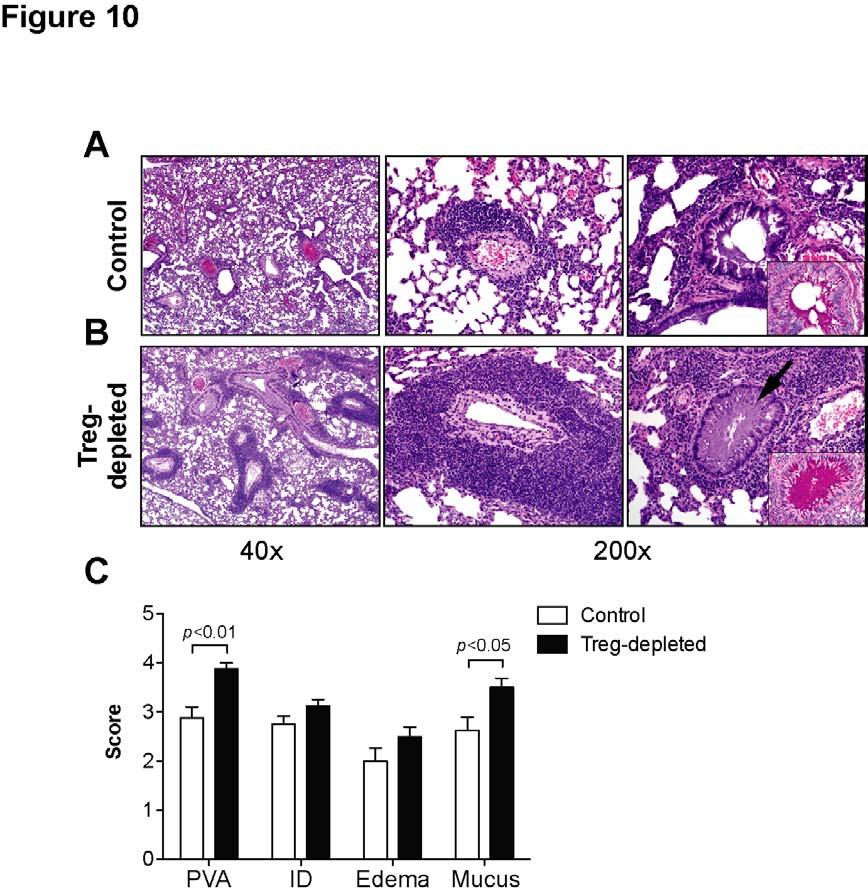
157 14
Effector mechanisms of cell-mediated immunity: Properties of effector, memory and regulatory T cells
 ICI Basic Immunology course Effector mechanisms of cell-mediated immunity: Properties of effector, memory and regulatory T cells Abul K. Abbas, MD UCSF Stages in the development of T cell responses: induction
T-cell activation T cells migrate to secondary lymphoid tissues where they interact with antigen, antigen-presenting cells, and other lymphocytes:
 Interactions between innate immunity & adaptive immunity What happens to T cells after they leave the thymus? Naïve T cells exit the thymus and enter the bloodstream. If they remain in the bloodstream,
Antigen Presentation and T Lymphocyte Activation. Abul K. Abbas UCSF. FOCiS
 1 Antigen Presentation and T Lymphocyte Activation Abul K. Abbas UCSF FOCiS 2 Lecture outline Dendritic cells and antigen presentation The role of the MHC T cell activation Costimulation, the B7:CD28 family
General Overview of Immunology. Kimberly S. Schluns, Ph.D. Associate Professor Department of Immunology UT MD Anderson Cancer Center
 General Overview of Immunology Kimberly S. Schluns, Ph.D. Associate Professor Department of Immunology UT MD Anderson Cancer Center Objectives Describe differences between innate and adaptive immune responses
T Cell Activation, Costimulation and Regulation
 1 T Cell Activation, Costimulation and Regulation Abul K. Abbas, MD University of California San Francisco 2 Lecture outline T cell antigen recognition and activation Costimulation, the B7:CD28 family
Central tolerance. Mechanisms of Immune Tolerance. Regulation of the T cell response
 Immunoregulation: A balance between activation and suppression that achieves an efficient immune response without damaging the host. Mechanisms of Immune Tolerance ACTIVATION (immunity) SUPPRESSION (tolerance)
Mechanisms of Immune Tolerance
 Immunoregulation: A balance between activation and suppression that achieves an efficient immune response without damaging the host. ACTIVATION (immunity) SUPPRESSION (tolerance) Autoimmunity Immunodeficiency
Immunological Tolerance
 Immunological Tolerance Introduction Definition: Unresponsiveness to an antigen that is induced by exposure to that antigen Tolerogen = tolerogenic antigen = antigen that induces tolerance Important for
Lecture outline. Immunological tolerance and immune regulation. Central and peripheral tolerance. Inhibitory receptors of T cells. Regulatory T cells
 1 Immunological tolerance and immune regulation Abul K. Abbas UCSF 2 Lecture outline Central and peripheral tolerance Inhibitory receptors of T cells Regulatory T cells 1 The immunological equilibrium:
Supplemental Table I.
 Supplemental Table I Male / Mean ± SEM n Mean ± SEM n Body weight, g 29.2±0.4 17 29.7±0.5 17 Total cholesterol, mg/dl 534.0±30.8 17 561.6±26.1 17 HDL-cholesterol, mg/dl 9.6±0.8 17 10.1±0.7 17 Triglycerides,
Immune Regulation and Tolerance
 Immune Regulation and Tolerance Immunoregulation: A balance between activation and suppression of effector cells to achieve an efficient immune response without damaging the host. Activation (immunity)
ACTIVATION AND EFFECTOR FUNCTIONS OF CELL-MEDIATED IMMUNITY AND NK CELLS. Choompone Sakonwasun, MD (Hons), FRCPT
, FRCPT") ACTIVATION AND EFFECTOR FUNCTIONS OF CELL-MEDIATED IMMUNITY AND NK CELLS Choompone Sakonwasun, MD (Hons), FRCPT Types of Adaptive Immunity Types of T Cell-mediated Immune Reactions CTLs = cytotoxic T lymphocytes
ACTIVATION AND EFFECTOR FUNCTIONS OF CELL-MEDIATED IMMUNITY AND NK CELLS Choompone Sakonwasun, MD (Hons), FRCPT Types of Adaptive Immunity Types of T Cell-mediated Immune Reactions CTLs = cytotoxic T lymphocytes
The Adaptive Immune Responses
 The Adaptive Immune Responses The two arms of the immune responses are; 1) the cell mediated, and 2) the humoral responses. In this chapter we will discuss the two responses in detail and we will start
Scott Abrams, Ph.D. Professor of Oncology, x4375 Kuby Immunology SEVENTH EDITION
 Scott Abrams, Ph.D. Professor of Oncology, x4375 scott.abrams@roswellpark.org Kuby Immunology SEVENTH EDITION CHAPTER 13 Effector Responses: Cell- and Antibody-Mediated Immunity Copyright 2013 by W. H.
Medical Virology Immunology. Dr. Sameer Naji, MB, BCh, PhD (UK) Head of Basic Medical Sciences Dept. Faculty of Medicine The Hashemite University
 Head of Basic Medical Sciences Dept. Faculty of Medicine The Hashemite University") Medical Virology Immunology Dr. Sameer Naji, MB, BCh, PhD (UK) Head of Basic Medical Sciences Dept. Faculty of Medicine The Hashemite University Human blood cells Phases of immune responses Microbe Naïve
Medical Virology Immunology Dr. Sameer Naji, MB, BCh, PhD (UK) Head of Basic Medical Sciences Dept. Faculty of Medicine The Hashemite University Human blood cells Phases of immune responses Microbe Naïve
Determinants of Immunogenicity and Tolerance. Abul K. Abbas, MD Department of Pathology University of California San Francisco
 Determinants of Immunogenicity and Tolerance Abul K. Abbas, MD Department of Pathology University of California San Francisco EIP Symposium Feb 2016 Why do some people respond to therapeutic proteins?
ACTIVATION OF T LYMPHOCYTES AND CELL MEDIATED IMMUNITY
 ACTIVATION OF T LYMPHOCYTES AND CELL MEDIATED IMMUNITY The recognition of specific antigen by naïve T cell induces its own activation and effector phases. T helper cells recognize peptide antigens through
T cell regulation of acute and chronic viral infection
 University of Iowa Iowa Research Online Theses and Dissertations Spring 2016 T cell regulation of acute and chronic viral infection Allison Fae Christiaansen University of Iowa Copyright 2016 Allison Fae
Immune response. This overview figure summarizes simply how our body responds to foreign molecules that enter to it.
 Immune response This overview figure summarizes simply how our body responds to foreign molecules that enter to it. It s highly recommended to watch Dr Najeeb s lecture that s titled T Helper cells and
The development of T cells in the thymus
 T cells rearrange their receptors in the thymus whereas B cells do so in the bone marrow. The development of T cells in the thymus The lobular/cellular organization of the thymus Immature cells are called
Immunology for the Rheumatologist
 Immunology for the Rheumatologist Rheumatologists frequently deal with the immune system gone awry, rarely studying normal immunology. This program is an overview and discussion of the function of the
Micro 204. Cytotoxic T Lymphocytes (CTL) Lewis Lanier
 Lewis Lanier") Micro 204 Cytotoxic T Lymphocytes (CTL) Lewis Lanier Lewis.Lanier@ucsf.edu Lymphocyte-mediated Cytotoxicity CD8 + αβ-tcr + T cells CD4 + αβ-tcr + T cells γδ-tcr + T cells Natural Killer cells CD8 + αβ-tcr
Micro 204 Cytotoxic T Lymphocytes (CTL) Lewis Lanier Lewis.Lanier@ucsf.edu Lymphocyte-mediated Cytotoxicity CD8 + αβ-tcr + T cells CD4 + αβ-tcr + T cells γδ-tcr + T cells Natural Killer cells CD8 + αβ-tcr
Cytokines modulate the functional activities of individual cells and tissues both under normal and pathologic conditions Interleukins,
 Cytokines http://highered.mcgraw-hill.com/sites/0072507470/student_view0/chapter22/animation the_immune_response.html Cytokines modulate the functional activities of individual cells and tissues both under
DNA vaccine, peripheral T-cell tolerance modulation 185
 Subject Index Airway hyperresponsiveness (AHR) animal models 41 43 asthma inhibition 45 overview 41 mast cell modulation of T-cells 62 64 respiratory tolerance 40, 41 Tregs inhibition role 44 respiratory
5/1/13. The proportion of thymus that produces T cells decreases with age. The cellular organization of the thymus
 T cell precursors migrate from the bone marrow via the blood to the thymus to mature 1 2 The cellular organization of the thymus The proportion of thymus that produces T cells decreases with age 3 4 1
Adaptive immune responses: T cell-mediated immunity
 MICR2209 Adaptive immune responses: T cell-mediated immunity Dr Allison Imrie allison.imrie@uwa.edu.au 1 Synopsis: In this lecture we will discuss the T-cell mediated immune response, how it is activated,
1. Overview of Adaptive Immunity
 Chapter 17A: Adaptive Immunity Part I 1. Overview of Adaptive Immunity 2. T and B Cell Production 3. Antigens & Antigen Presentation 4. Helper T cells 1. Overview of Adaptive Immunity The Nature of Adaptive
Structure and Function of Antigen Recognition Molecules
 MICR2209 Structure and Function of Antigen Recognition Molecules Dr Allison Imrie allison.imrie@uwa.edu.au 1 Synopsis: In this lecture we will examine the major receptors used by cells of the innate and
Autoimmunity. Autoimmunity arises because of defects in central or peripheral tolerance of lymphocytes to selfantigens
 Autoimmunity Autoimmunity arises because of defects in central or peripheral tolerance of lymphocytes to selfantigens Autoimmune disease can be caused to primary defects in B cells, T cells and possibly
T Lymphocyte Activation and Costimulation. FOCiS. Lecture outline
 1 T Lymphocyte Activation and Costimulation Abul K. Abbas, MD UCSF FOCiS 2 Lecture outline T cell activation Costimulation, the B7:CD28 family Inhibitory receptors of T cells Targeting costimulators for
Tolerance 2. Regulatory T cells; why tolerance fails. FOCiS. Lecture outline. Regulatory T cells. Regulatory T cells: functions and clinical relevance
 1 Tolerance 2. Regulatory T cells; why tolerance fails Abul K. Abbas UCSF FOCiS 2 Lecture outline Regulatory T cells: functions and clinical relevance Pathogenesis of autoimmunity: why selftolerance fails
Tolerance 2. Regulatory T cells; why tolerance fails. Abul K. Abbas UCSF. FOCiS
 1 Tolerance 2. Regulatory T cells; why tolerance fails Abul K. Abbas UCSF FOCiS 2 Lecture outline Regulatory T cells: functions and clinical relevance Pathogenesis of autoimmunity: why selftolerance fails
LESSON 2: THE ADAPTIVE IMMUNITY
 Introduction to immunology. LESSON 2: THE ADAPTIVE IMMUNITY Today we will get to know: The adaptive immunity T- and B-cells Antigens and their recognition How T-cells work 1 The adaptive immunity Unlike
T cell maturation. T-cell Maturation. What allows T cell maturation?
 T-cell Maturation What allows T cell maturation? Direct contact with thymic epithelial cells Influence of thymic hormones Growth factors (cytokines, CSF) T cell maturation T cell progenitor DN DP SP 2ry
Effector T Cells and
 1 Effector T Cells and Cytokines Andrew Lichtman, MD PhD Brigham and Women's Hospital Harvard Medical School 2 Lecture outline Cytokines Subsets of CD4+ T cells: definitions, functions, development New
Follicular Lymphoma. ced3 APOPTOSIS. *In the nematode Caenorhabditis elegans 131 of the organism's 1031 cells die during development.
 Harvard-MIT Division of Health Sciences and Technology HST.176: Cellular and Molecular Immunology Course Director: Dr. Shiv Pillai Follicular Lymphoma 1. Characterized by t(14:18) translocation 2. Ig heavy
Tolerance, autoimmunity and the pathogenesis of immunemediated inflammatory diseases. Abul K. Abbas UCSF
 Tolerance, autoimmunity and the pathogenesis of immunemediated inflammatory diseases Abul K. Abbas UCSF Balancing lymphocyte activation and control Activation Effector T cells Tolerance Regulatory T cells
Allergy and Immunology Review Corner: Chapter 19 of Immunology IV: Clinical Applications in Health and Disease, by Joseph A. Bellanti, MD.
 Allergy and Immunology Review Corner: Chapter 19 of Immunology IV: Clinical Applications in Health and Disease, by Joseph A. Bellanti, MD. Chapter 19: Tolerance, Autoimmunity, and Autoinflammation Prepared
Examples of questions for Cellular Immunology/Cellular Biology and Immunology
 Examples of questions for Cellular Immunology/Cellular Biology and Immunology Each student gets a set of 6 questions, so that each set contains different types of questions and that the set of questions
Advances in Cancer Immunotherapy
 Advances in Cancer Immunotherapy Immunology 101 for the Non-Immunologist Arnold H. Zea, PhD azea@lsuhsc.edu Disclosures No relevant financial relationships to disclose This presentation does not contain
Immunology Basics Relevant to Cancer Immunotherapy: T Cell Activation, Costimulation, and Effector T Cells
 Immunology Basics Relevant to Cancer Immunotherapy: T Cell Activation, Costimulation, and Effector T Cells Andrew H. Lichtman, M.D. Ph.D. Department of Pathology Brigham and Women s Hospital and Harvard
Immunology Lecture 4. Clinical Relevance of the Immune System
 Immunology Lecture 4 The Well Patient: How innate and adaptive immune responses maintain health - 13, pg 169-181, 191-195. Immune Deficiency - 15 Autoimmunity - 16 Transplantation - 17, pg 260-270 Tumor
The Immune System: Innate and Adaptive Body Defenses Outline PART 1: INNATE DEFENSES 21.1 Surface barriers act as the first line of defense to keep
 The Immune System: Innate and Adaptive Body Defenses Outline PART 1: INNATE DEFENSES 21.1 Surface barriers act as the first line of defense to keep invaders out of the body (pp. 772 773; Fig. 21.1; Table
The impact of robust memory T cell responses against respiratory syncytial virus
 University of Iowa Iowa Research Online Theses and Dissertations Spring 2015 The impact of robust memory T cell responses against respiratory syncytial virus Cory James Knudson University of Iowa Copyright
T cell and Cell-mediated immunity
 T cell and Cell-mediated immunity Lu Linrong ( 鲁林荣 ) PhD Laboratory of Immune Regulation Institute of Immunology Zhejiang University, it School of Medicine i Medical Research Building B815-819 Email: Lu.Linrong@gmail.com
Overview of the immune system
 Overview of the immune system Immune system Innate (nonspecific) 1 st line of defense Adaptive (specific) 2 nd line of defense Cellular components Humoral components Cellular components Humoral components
Innate immune regulation of T-helper (Th) cell homeostasis in the intestine
 cell homeostasis in the intestine") Innate immune regulation of T-helper (Th) cell homeostasis in the intestine Masayuki Fukata, MD, Ph.D. Research Scientist II Division of Gastroenterology, Department of Medicine, F. Widjaja Foundation,
Innate immune regulation of T-helper (Th) cell homeostasis in the intestine Masayuki Fukata, MD, Ph.D. Research Scientist II Division of Gastroenterology, Department of Medicine, F. Widjaja Foundation,
Prof. Ibtesam Kamel Afifi Professor of Medical Microbiology & Immunology
 By Prof. Ibtesam Kamel Afifi Professor of Medical Microbiology & Immunology Lecture objectives: At the end of the lecture you should be able to: Enumerate features that characterize acquired immune response
The Immune System. These are classified as the Innate and Adaptive Immune Responses. Innate Immunity
 The Immune System Biological mechanisms that defend an organism must be 1. triggered by a stimulus upon injury or pathogen attack 2. able to counteract the injury or invasion 3. able to recognise foreign
Chapter 10 (pages ): Differentiation and Functions of CD4+ Effector T Cells Prepared by Kristen Dazy, MD, Scripps Clinic Medical Group
: Differentiation and Functions of CD4+ Effector T Cells Prepared by Kristen Dazy, MD, Scripps Clinic Medical Group") FIT Board Review Corner September 2015 Welcome to the FIT Board Review Corner, prepared by Andrew Nickels, MD, and Sarah Spriet, DO, senior and junior representatives of ACAAI's Fellows-In-Training (FITs)
FIT Board Review Corner September 2015 Welcome to the FIT Board Review Corner, prepared by Andrew Nickels, MD, and Sarah Spriet, DO, senior and junior representatives of ACAAI's Fellows-In-Training (FITs)
Adaptive Immunity: Humoral Immune Responses
 MICR2209 Adaptive Immunity: Humoral Immune Responses Dr Allison Imrie 1 Synopsis: In this lecture we will review the different mechanisms which constitute the humoral immune response, and examine the antibody
There are 2 major lines of defense: Non-specific (Innate Immunity) and. Specific. (Adaptive Immunity) Photo of macrophage cell
 and. Specific. (Adaptive Immunity) Photo of macrophage cell") There are 2 major lines of defense: Non-specific (Innate Immunity) and Specific (Adaptive Immunity) Photo of macrophage cell Development of the Immune System ery pl neu mφ nk CD8 + CTL CD4 + thy TH1 mye
There are 2 major lines of defense: Non-specific (Innate Immunity) and Specific (Adaptive Immunity) Photo of macrophage cell Development of the Immune System ery pl neu mφ nk CD8 + CTL CD4 + thy TH1 mye
Question 1. Kupffer cells, microglial cells and osteoclasts are all examples of what type of immune system cell?
 Abbas Chapter 2: Sarah Spriet February 8, 2015 Question 1. Kupffer cells, microglial cells and osteoclasts are all examples of what type of immune system cell? a. Dendritic cells b. Macrophages c. Monocytes
T Cell Effector Mechanisms I: B cell Help & DTH
 T Cell Effector Mechanisms I: B cell Help & DTH Ned Braunstein, MD The Major T Cell Subsets p56 lck + T cells γ δ ε ζ ζ p56 lck CD8+ T cells γ δ ε ζ ζ Cα Cβ Vα Vβ CD3 CD8 Cα Cβ Vα Vβ CD3 MHC II peptide
Genetics. Environment. You Are Only 10% Human. Pathogenesis of IBD. Advances in the Pathogenesis of IBD: Genetics Leads to Function IBD
 Advances in the Pathogenesis of IBD: Genetics Leads to Function Pathogenesis of IBD Environmental Factors Microbes Scott Plevy, MD Associate Professor of Medicine, Microbiology & Immunology UNC School
Darwinian selection and Newtonian physics wrapped up in systems biology
 Darwinian selection and Newtonian physics wrapped up in systems biology Concept published in 1957* by Macfarland Burnet (1960 Nobel Laureate for the theory of induced immune tolerance, leading to solid
General information. Cell mediated immunity. 455 LSA, Tuesday 11 to noon. Anytime after class.
 General information Cell mediated immunity 455 LSA, Tuesday 11 to noon Anytime after class T-cell precursors Thymus Naive T-cells (CD8 or CD4) email: lcoscoy@berkeley.edu edu Use MCB150 as subject line
M.Sc. III Semester Biotechnology End Semester Examination, 2013 Model Answer LBTM: 302 Advanced Immunology
 Code : AS-2246 M.Sc. III Semester Biotechnology End Semester Examination, 2013 Model Answer LBTM: 302 Advanced Immunology A. Select one correct option for each of the following questions:- 2X10=10 1. (b)
1. The scavenger receptor, CD36, functions as a coreceptor for which TLR? a. TLR ½ b. TLR 3 c. TLR 4 d. TLR 2/6
 Allergy and Immunology Review Corner: Cellular and Molecular Immunology, 8th Edition By Abul K. Abbas, MBBS, Andrew H. H. Lichtman, MD, PhD and Shiv Pillai, MBBS, PhD. Chapter 4 (pages 62-74): Innate Immunity
The Adaptive Immune Response: T lymphocytes and Their Functional Types *
 OpenStax-CNX module: m46560 1 The Adaptive Immune Response: T lymphocytes and Their Functional Types * OpenStax This work is produced by OpenStax-CNX and licensed under the Creative Commons Attribution
Immune Tolerance. Kyeong Cheon Jung. Department of Pathology Seoul National University College of Medicine
 Immune Tolerance Kyeong Cheon Jung Department of Pathology Seoul National University College of Medicine Immune tolerance Unresponsiveness to an antigen that is induced by previous exposure to that antigen
The induction and regulation of CD4 T cells following respiratory syncytial virus infection
 University of Iowa Iowa Research Online Theses and Dissertations Spring 214 The induction and regulation of CD4 T cells following respiratory syncytial virus infection Kayla Ann Weiss University of Iowa
Test Bank for Basic Immunology Functions and Disorders of the Immune System 4th Edition by Abbas
 Test Bank for Basic Immunology Functions and Disorders of the Immune System 4th Edition by Abbas Chapter 04: Antigen Recognition in the Adaptive Immune System Test Bank MULTIPLE CHOICE 1. Most T lymphocytes
T cell and Cell-mediated immunity
 T cell and Cell-mediated immunity ( 第十章 第十二章第十二章 ) Lu Linrong ( 鲁林荣 ) PhD Laboratory of Immune Regulation Institute of Immunology Zhejiang University, School of Medicine Medical Research Building B815-819
Immunology - Lecture 2 Adaptive Immune System 1
 Immunology - Lecture 2 Adaptive Immune System 1 Book chapters: Molecules of the Adaptive Immunity 6 Adaptive Cells and Organs 7 Generation of Immune Diversity Lymphocyte Antigen Receptors - 8 CD markers
CELL BIOLOGY - CLUTCH CH THE IMMUNE SYSTEM.
 !! www.clutchprep.com CONCEPT: OVERVIEW OF HOST DEFENSES The human body contains three lines of against infectious agents (pathogens) 1. Mechanical and chemical boundaries (part of the innate immune system)
The Adaptive Immune Response. B-cells
 The Adaptive Immune Response B-cells The innate immune system provides immediate protection. The adaptive response takes time to develop and is antigen specific. Activation of B and T lymphocytes Naive
Necrotizing Enterocolitis: The Role of the Immune System
 Necrotizing Enterocolitis: The Role of the Immune System Patricia Denning, M.D. Associate Professor in Pediatrics Division of Neonatology Emory University School of Medicine What is NEC? What is NEC? Necrotizing
RAISON D ETRE OF THE IMMUNE SYSTEM:
 RAISON D ETRE OF THE IMMUNE SYSTEM: To Distinguish Self from Non-Self Thereby Protecting Us From Our Hostile Environment. Innate Immunity Acquired Immunity Innate immunity: (Antigen nonspecific) defense
SEVENTH EDITION CHAPTER
 Judy Owen Jenni Punt Sharon Stranford Kuby Immunology SEVENTH EDITION CHAPTER 16 Tolerance, Autoimmunity, and Transplantation Copyright 2013 by W. H. Freeman and Company Immune tolerance: history * Some
Immunology. T-Lymphocytes. 16. Oktober 2014, Ruhr-Universität Bochum Karin Peters,
 Immunology T-Lymphocytes 16. Oktober 2014, Ruhr-Universität Bochum Karin Peters, karin.peters@rub.de The role of T-effector cells in the immune response against microbes cellular immunity humoral immunity
All animals have innate immunity, a defense active immediately upon infection Vertebrates also have adaptive immunity
 1 2 3 4 5 6 7 8 9 The Immune System All animals have innate immunity, a defense active immediately upon infection Vertebrates also have adaptive immunity Figure 43.2 In innate immunity, recognition and
Immunological Aspects of Parasitic Diseases in Immunocompromised Individuals. Taniawati Supali. Department of Parasitology
 Immunological Aspects of Parasitic Diseases in Immunocompromised Individuals Taniawati Supali Department of Parasitology 1 Defense mechanism in human Th17 (? ) Acute Chronic Th1 Th 2 Intracellular Treg
Cell Mediated Immunity CELL MEDIATED IMMUNITY. Basic Elements of Cell Mediated Immunity (CMI) Antibody-dependent cell-mediated cytotoxicity (ADCC)
 Antibody-dependent cell-mediated cytotoxicity (ADCC)") Chapter 16 CELL MEDIATED IMMUNITY Cell Mediated Immunity Also known as Cellular Immunity or CMI The effector phase T cells Specificity for immune recognition reactions TH provide cytokines CTLs do the
Chapter 16 CELL MEDIATED IMMUNITY Cell Mediated Immunity Also known as Cellular Immunity or CMI The effector phase T cells Specificity for immune recognition reactions TH provide cytokines CTLs do the
Effector Mechanisms of Cell-Mediated Immunity
 Effector Mechanisms of Cell-Mediated Immunity Dr. Julia Rempel Section of Hepatology 789-3825 jdrempel@cc.umanitoba.ca 804D JBRC Topics: I. Types of Cell-Mediated Immunity II. Migration of Effector T Lymphocytes
Chapter 21: Innate and Adaptive Body Defenses
 Chapter 21: Innate and Adaptive Body Defenses I. 2 main types of body defenses A. Innate (nonspecific) defense: not to a specific microorganism or substance B. Adaptive (specific) defense: immunity to
T Cell Receptor & T Cell Development
 T Cell Receptor & T Cell Development Questions for the next 2 lectures: How do you generate a diverse T cell population with functional TCR rearrangements? How do you generate a T cell population that
Chapter 13: Cytokines
 Chapter 13: Cytokines Definition: secreted, low-molecular-weight proteins that regulate the nature, intensity and duration of the immune response by exerting a variety of effects on lymphocytes and/or
Cytokines (II) Dr. Aws Alshamsan Department of Pharmaceu5cs Office: AA87 Tel:
 Dr. Aws Alshamsan Department of Pharmaceu5cs Office: AA87 Tel:") Cytokines (II) Dr. Aws Alshamsan Department of Pharmaceu5cs Office: AA87 Tel: 4677363 aalshamsan@ksu.edu.sa Learning Objectives By the end of this lecture you will be able to: 1 Understand the physiological
Cytokines (II) Dr. Aws Alshamsan Department of Pharmaceu5cs Office: AA87 Tel: 4677363 aalshamsan@ksu.edu.sa Learning Objectives By the end of this lecture you will be able to: 1 Understand the physiological
Chapter 23 Immunity Exam Study Questions
 Chapter 23 Immunity Exam Study Questions 1. Define 1) Immunity 2) Neutrophils 3) Macrophage 4) Epitopes 5) Interferon 6) Complement system 7) Histamine 8) Mast cells 9) Antigen 10) Antigens receptors 11)
Chapter 1. Chapter 1 Concepts. MCMP422 Immunology and Biologics Immunology is important personally and professionally!
 MCMP422 Immunology and Biologics Immunology is important personally and professionally! Learn the language - use the glossary and index RNR - Reading, Note taking, Reviewing All materials in Chapters 1-3
CHAPTER 9 BIOLOGY OF THE T LYMPHOCYTE
 CHAPTER 9 BIOLOGY OF THE T LYMPHOCYTE Coico, R., Sunshine, G., (2009) Immunology : a short course, 6 th Ed., Wiley-Blackwell 1 CHAPTER 9 : Biology of The T Lymphocytes 1. 2. 3. 4. 5. 6. 7. Introduction
The Innate Immune Response
 The Innate Immune Response FUNCTIONS OF THE IMMUNE SYSTEM: Recognize, destroy and clear a diversity of pathogens. Initiate tissue and wound healing processes. Recognize and clear damaged self components.
Cellular Immune response. Jianzhong Chen, Ph.D Institute of immunology, ZJU
 Cellular Immune response Jianzhong Chen, Ph.D Institute of immunology, ZJU Concept of adaptive immune response T cell-mediated adaptive immune response I. Concept of immune response A collective and coordinated
I. Critical Vocabulary
 I. Critical Vocabulary A. Immune System: a set of glands, tissues, cells, and dissolved proteins that combine to defend against non-self entities B. Antigen: any non-self chemical that triggers an immune
Time course of immune response
 Time course of immune response Route of entry Route of entry (cont.) Steps in infection Barriers to infection Mf receptors Facilitate engulfment Glucan, mannose Scavenger CD11b/CD18 Allows immediate response
Regulation of anti-tumor immunity through migration of immune cell subsets within the tumor microenvironment Thomas F. Gajewski, M.D., Ph.D.
 Regulation of anti-tumor immunity through migration of immune cell subsets within the tumor microenvironment Thomas F. Gajewski, M.D., Ph.D. Professor, Departments of Pathology and Medicine Program Leader,
HLA and antigen presentation. Department of Immunology Charles University, 2nd Medical School University Hospital Motol
 HLA and antigen presentation Department of Immunology Charles University, 2nd Medical School University Hospital Motol MHC in adaptive immunity Characteristics Specificity Innate For structures shared
Innate Immunity II. Integration. Lindsay Nicholson Advanced Immunology L2
 Innate Immunity II Integration Lindsay Nicholson Advanced Immunology L2 l.nicholson@bristol.ac.uk Lecture 1 Defining Innate Immunity Recognition and effector mechanisms (I) Lecture 2 Recognition and effector
FOCiS. Lecture outline. The immunological equilibrium: balancing lymphocyte activation and control. Immunological tolerance and immune regulation -- 1
 1 Immunological tolerance and immune regulation -- 1 Abul K. Abbas UCSF FOCiS 2 Lecture outline Principles of immune regulation Self-tolerance; mechanisms of central and peripheral tolerance Inhibitory
Immune response to infection
 Immune response to infection Dr. Sandra Nitsche (Sandra.Nitsche@rub.de ) 20.06.2018 1 Course of acute infection Typical acute infection that is cleared by an adaptive immune reaction 1. invasion of pathogen
11/25/2017. THE IMMUNE SYSTEM Chapter 43 IMMUNITY INNATE IMMUNITY EXAMPLE IN INSECTS BARRIER DEFENSES INNATE IMMUNITY OF VERTEBRATES
 THE IMMUNE SYSTEM Chapter 43 IMMUNITY INNATE IMMUNITY EXAMPLE IN INSECTS Exoskeleton made of chitin forms the first barrier to pathogens Digestive system is protected by a chitin-based barrier and lysozyme,
TCR, MHC and coreceptors
 Cooperation In Immune Responses Antigen processing how peptides get into MHC Antigen processing involves the intracellular proteolytic generation of MHC binding proteins Protein antigens may be processed
7/6/2009. The study of the immune system and of diseases that occur as a result of inappropriate or inadequate actions of the immune system.
 Diseases of Immunity 2009 CL Davis General Pathology Paul W. Snyder, DVM, PhD Purdue University Acknowledgements Pathologic Basis of Veterinary Disease, 4 th Ed Veterinary Immunology, An Introduction 8
Innate Immunity. Hathairat Thananchai, DPhil Department of Microbiology Faculty of Medicine Chiang Mai University 2 August 2016
 Innate Immunity Hathairat Thananchai, DPhil Department of Microbiology Faculty of Medicine Chiang Mai University 2 August 2016 Objectives: Explain how innate immune system recognizes foreign substances
S. No Topic Class No Date
 S. No Topic Class No Date 1 Introduction 2 3 4 5 6 7 Fundamentals of Immunology Definitions and basic terms Types of immunity Organs of immune system Cells of immune system Innate immunity PAMPs PRRs Phagocytosis
Animal Models to Understand Immunity
 Animal Models to Understand Immunity Hussein El Saghire hesaghir@sckcen.be Innate Adaptive immunity Immunity MAPK and NF-kB TLR pathways receptors Fast Slow Non-specific Specific NOD-like receptors T-cell