Diagnostic Test. H. Risanto Siswosudarmo Department of Obstetrics and Gynecology Faculty of Medicine, UGM Jogjakarta. RS Sardjito
|
|
|
- Sibyl Newton
- 6 years ago
- Views:
Transcription

1 ب س م الل ه الر ح م ن الر ح يم RS Sardjito Diagnostic Test Gold standard New (test Disease No Disease Column Total Posi*ve a b a+b Nega*ve c d c+d Row Total a+c b+d N H. Risanto Siswosudarmo Department of Obstetrics and Gynecology Faculty of Medicine, UGM Jogjakarta
2 Diagnostic Test 1. Objective 1. Recognizing DT and screening. 2. Identifying diseases appropriate for screening. 3. Defining, calculating, and interpreting the sensitivity, specificity, positive predictive value and negative predictive value, false positive and false negative, SnNOUT and SpIN, LR + and LR- of a screening test. 4. Explaining the influence of prevalence of disease to predictive value. 5. Understanding side effects of a screening test. 6. Understanding an ROC curve. 2. Method 1. Lecture 2. Discussion 3. Computer computation
3 When screening is beneficial The disease is serious (e.g., cervical cancer). When treatment before symptoms occur is more effective than treatment that is delayed until symptoms appear. When the prevalence of disease in the DPCP is relatively high. The time interval between possible detection by screening and later detection after symptoms is the "detectable preclinical phase" or DPCP.
4 Characteristics of a Good Screening Test Inexpensive Easy to administer (easy to do, not complicated) Minimal discomfort (convenient) Reliable (consistent, reproducible) Valid (distinguishes diseased & non-diseased people) Characteristic of gold standard test The best test available Widely accepted (by all) Often expensive, or invasive
5 Basic Table: Two by two table Tes baru (tes diagnos5k) Sakit Gold standard Tidak sakit Total Posi*f a b a+b Nega*f c d c+d Total a+c b+d N Sensitivity: a/(a+c) PPV: a/(a+b) TP : a ; FP: b Specificity: d/(b+d) NPV: d/(c+d) Accuracy: (a+d)/n TN : d ; FN: c
6 Test validity Test validity is the ability of a screening test to accurately identify diseased and non-disease individuals. An ideal screening test is exquisitely sensitive (high probability of detecting disease) and extremely specific (high probability that those without the disease will screen negative). The validity of a screening test is based on its accuracy in identifying diseased and non-diseased persons. This can only be determined if the accuracy of the screening test is compared to some "gold standard" test. Gold standard test is a test that establishes the true disease status. The gold standard should be very accurate, but may be expensive and invasive
7 1. Sensitivity: The accurate the screening test in identifying disease in people who truly have the disease. The ability of the test to identify correctly those who have the disease. Proportion of people with disease who have a pos. test 2. Specificity The accuracy of the screening test in correctly classifying truly non-diseased people. The ability of the test to identify correctly those who DO NOT HAVE the disease Proportion of people without disease who have a neg. test
8 1. Positive predictive value (PPV): The proportion of people with positive test who actually HAVE the disease. If a person test is positive, what is the probability that she/he really has the disesae? PPV= a/(a+b) 2. Negative predictive value (NPV) The proportion of people with negative test who actually DO NOT HAVE the disease If a person test is negative, what is the probability that she/he really DOESN T HAVE the disease? NPV = d/(c+d)
9 1. SnNOUT When a test with a high SENsitivity is NEGative, it effectively rules OUT the disease 2. SpPIN When a test with high SPEcificity is POSitive, it effectively rules IN the disease.
10 Likelihood ratio 1. Likelihood ratio positive (LR+) The probability of a positive test in a person with the disease divided by the probability of a positive test in a person without the disease. LR(+) = Sensitivity / (1 Specificity) 2. Likelihood ratio negative (LR-) The probability of a negative test in a person with the disease, divided by the probability of a negative test in a person without the disease. LR (-) = (1 Sensitivity) / Specificity
11 Impact of likelihood ratio LR(+) LR( ) Impact on likelihood Excellent Very good Fair 1 1 Useless
12 Two important down sides to screening: 1. False positive (Exp: Breast ca on a young women). The probability is extremely low The sensitivity of mammography is low because younger women have denser breast tissue. Will be subjected to extreme anxiety and worry. May also undergo invasive diagnostic tests such as needle biopsy and surgical biopsy unnecessarily. Time consuming and costy
13 Two important down sides to screening: 2. False negative. They will be reassured that they don't have disease, when they really do. Delayed diagnosis Delayed treatment Increased morbidity and mortality Increased cost
14 Effect of prevalence on PPV Skrining pada donor darah perempuan yang prevalensi HIV (+) adalah 0,01% (hanya 10 HIV positif dari donor perempuan). Tes skrining memiliki sensitivitas 100% dan spesifisitas 95%. Berapa PPV nya? Perhatikan tabel berikut: Screening test HIV (+) Gold Standard HIV (- ) Total Column Tes (+) Tes (- ) Total Row PPV = 10/520 = 1,9%
15 Effect of prevalence on PPV, scenario II Skrining dilakukan pada laki-laki yang datang di klinik penyakit menular seksual yang prevalensi HIV (+) adalah 4 %. Tes skrining memiliki sensitivitas dan spesifisitas yang sama yakni masingmasing 100% dan 95%. Berapa PPV nya? Screening Gold Standard Total Column test HIV (+) HIV (- ) Tes (+) Tes (- ) Total Row PPV = 4000/4480 = 89%
16 Effect of prevalence on PPV, scenario II Skrining dilakukan pada pengguna obat suntik intravena yang prevalensi HIV (+) nya adalah 20%. Berapa PPV nya? Screening Gold Standard Total Column test HIV (+) HIV (- ) Tes (+) Tes (- ) Total Row PPV = / = 98.%
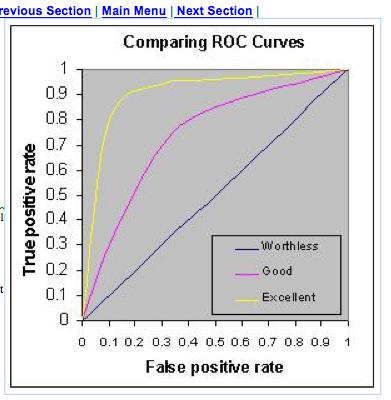
17 Receiver Operating Characteristic (ROC) Curve ROC curve is a plot of sensitivity (Y axis) versus 1- specificity ( X axis) The position of the ROC on the graph reflects the accuracy of the diagnostic test. It covers all possible thresholds (cut-off points). The ROC of random guessing lies on the diagonal line. It means that the test is worthless The ROC of a perfect diagnostic technique is a point at the upper left corner of the graph, where the TP proportion is 1.0 and the FP proportion is 0.
18 The Area Under the Curve (AUC), also referred to as index of accuracy (A), and it is an accepted traditional performance metric for an ROC curve. The higher the area under the curve the better prediction power the model has. AUC = 0.8 indicates good predictive power of the model.90-1 = excellent = good = fair = poor = fail
19
Statistics, Probability and Diagnostic Medicine
 Statistics, Probability and Diagnostic Medicine Jennifer Le-Rademacher, PhD Sponsored by the Clinical and Translational Science Institute (CTSI) and the Department of Population Health / Division of Biostatistics
Screening for Disease
 Screening for Disease An Ounce of Prevention is Worth a Pound of Cure. Actually, an ounce of prevention is better than a pound of cure, but if prevention hasn t been effective, perhaps early identification
7/17/2013. Evaluation of Diagnostic Tests July 22, 2013 Introduction to Clinical Research: A Two week Intensive Course
 Evaluation of Diagnostic Tests July 22, 2013 Introduction to Clinical Research: A Two week Intensive Course David W. Dowdy, MD, PhD Department of Epidemiology Johns Hopkins Bloomberg School of Public Health
ROC (Receiver Operating Characteristic) Curve Analysis
 Curve Analysis") ROC (Receiver Operating Characteristic) Curve Analysis Julie Xu 17 th November 2017 Agenda Introduction Definition Accuracy Application Conclusion Reference 2017 All Rights Reserved Confidential for INC
ROC (Receiver Operating Characteristic) Curve Analysis Julie Xu 17 th November 2017 Agenda Introduction Definition Accuracy Application Conclusion Reference 2017 All Rights Reserved Confidential for INC
Screening (Diagnostic Tests) Shaker Salarilak
 Shaker Salarilak") Screening (Diagnostic Tests) Shaker Salarilak Outline Screening basics Evaluation of screening programs Where we are? Definition of screening? Whether it is always beneficial? Types of bias in screening?
Screening (Diagnostic Tests) Shaker Salarilak Outline Screening basics Evaluation of screening programs Where we are? Definition of screening? Whether it is always beneficial? Types of bias in screening?
Questionnaire design. Questionnaire Design: Content. Questionnaire Design. Questionnaire Design: Wording. Questionnaire Design: Wording OUTLINE
 Questionnaire design OUTLINE Questionnaire design tests Reliability Validity POINTS TO CONSIDER Identify your research objectives. Identify your population or study sample Decide how to collect the information
Finding Good Diagnosis Studies
 Finding Good Diagnosis Studies n MESH Term Sensitivity and Specificity n Sensitivity prob that someone with disease will test positive (Pr [+ D]) true positive n Specificity prob that someone without the
Predictive Models for Healthcare Analytics
 Predictive Models for Healthcare Analytics A Case on Retrospective Clinical Study Mengling Mornin Feng mfeng@mit.edu mornin@gmail.com 1 Learning Objectives After the lecture, students should be able to:
Evidence-Based Medicine: Diagnostic study
 Evidence-Based Medicine: Diagnostic study What is Evidence-Based Medicine (EBM)? Expertise in integrating 1. Best research evidence 2. Clinical Circumstance 3. Patient values in clinical decisions Haynes,
BMI 541/699 Lecture 16
 BMI 541/699 Lecture 16 Where we are: 1. Introduction and Experimental Design 2. Exploratory Data Analysis 3. Probability 4. T-based methods for continous variables 5. Proportions & contingency tables -
The cross sectional study design. Population and pre-test. Probability (participants). Index test. Target condition. Reference Standard
. Index test. Target condition. Reference Standard") The cross sectional study design. and pretest. Probability (participants). Index test. Target condition. Reference Standard Mirella Fraquelli U.O. Gastroenterologia 2 Fondazione IRCCS Cà Granda Ospedale
The cross sectional study design. and pretest. Probability (participants). Index test. Target condition. Reference Standard Mirella Fraquelli U.O. Gastroenterologia 2 Fondazione IRCCS Cà Granda Ospedale
METHODS FOR DETECTING CERVICAL CANCER
 Chapter III METHODS FOR DETECTING CERVICAL CANCER 3.1 INTRODUCTION The successful detection of cervical cancer in a variety of tissues has been reported by many researchers and baseline figures for the
Introduction to Epidemiology Screening for diseases
 Faculty of Medicine Introduction to Community Medicine Course (31505201) Unit 4 Epidemiology Introduction to Epidemiology Screening for diseases By Hatim Jaber MD MPH JBCM PhD 15 +17-11- 2016 1 Introduction
Biosta's'cs Board Review. Parul Chaudhri, DO Family Medicine Faculty Development Fellow, UPMC St Margaret March 5, 2016
 Biosta's'cs Board Review Parul Chaudhri, DO Family Medicine Faculty Development Fellow, UPMC St Margaret March 5, 2016 Review key biosta's'cs concepts Understand 2 X 2 tables Objec'ves By the end of this
OCW Epidemiology and Biostatistics, 2010 Michael D. Kneeland, MD November 18, 2010 SCREENING. Learning Objectives for this session:
 OCW Epidemiology and Biostatistics, 2010 Michael D. Kneeland, MD November 18, 2010 SCREENING Learning Objectives for this session: 1) Know the objectives of a screening program 2) Define and calculate
Week 2 Video 3. Diagnostic Metrics
 Week 2 Video 3 Diagnostic Metrics Different Methods, Different Measures Today we ll continue our focus on classifiers Later this week we ll discuss regressors And other methods will get worked in later
Review. Imagine the following table being obtained as a random. Decision Test Diseased Not Diseased Positive TP FP Negative FN TN
 Outline 1. Review sensitivity and specificity 2. Define an ROC curve 3. Define AUC 4. Non-parametric tests for whether or not the test is informative 5. Introduce the binormal ROC model 6. Discuss non-parametric
Knowledge Discovery and Data Mining. Testing. Performance Measures. Notes. Lecture 15 - ROC, AUC & Lift. Tom Kelsey. Notes
 Knowledge Discovery and Data Mining Lecture 15 - ROC, AUC & Lift Tom Kelsey School of Computer Science University of St Andrews http://tom.home.cs.st-andrews.ac.uk twk@st-andrews.ac.uk Tom Kelsey ID5059-17-AUC
Sensitivity, Specificity, and Relatives
 Sensitivity, Specificity, and Relatives Brani Vidakovic ISyE 6421/ BMED 6700 Vidakovic, B. Se Sp and Relatives January 17, 2017 1 / 26 Overview Today: Vidakovic, B. Se Sp and Relatives January 17, 2017
Critical reading of diagnostic imaging studies. Lecture Goals. Constantine Gatsonis, PhD. Brown University
 Critical reading of diagnostic imaging studies Constantine Gatsonis Center for Statistical Sciences Brown University Annual Meeting Lecture Goals 1. Review diagnostic imaging evaluation goals and endpoints.
Diagnostic tests, Laboratory tests
 Diagnostic tests, Laboratory tests I. Introduction II. III. IV. Informational values of a test Consequences of the prevalence rate Sequential use of 2 tests V. Selection of a threshold: the ROC curve VI.
Clinical Decision Analysis
 Clinical Decision Analysis Terminology Sensitivity (Hit True Positive) Specificity (Correct rejection True Negative) Positive predictive value Negative predictive value The fraction of those with the disease
For more information about how to cite these materials visit
 Author(s): Rajesh Mangrulkar, M.D., 2013 License: Unless otherwise noted, this material is made available under the terms of the Creative Commons Attribution Non-commercial Share Alike 3.0 License: http://creativecommons.org/licenses/by-nc-sa/3.0/
Introduction to screening tests. Tim Hanson Department of Statistics University of South Carolina April, 2011
 Introduction to screening tests Tim Hanson Department of Statistics University of South Carolina April, 2011 1 Overview: 1. Estimating test accuracy: dichotomous tests. 2. Estimating test accuracy: continuous
Welcome to this four part series focused on epidemiologic and biostatistical methods related to disease screening. In this first segment, we will
 Welcome to this four part series focused on epidemiologic and biostatistical methods related to disease screening. In this first segment, we will discuss essential components for effective screening programs.
Worksheet for Structured Review of Physical Exam or Diagnostic Test Study
 Worksheet for Structured Review of Physical Exam or Diagnostic Study Title of Manuscript: Authors of Manuscript: Journal and Citation: Identify and State the Hypothesis Primary Hypothesis: Secondary Hypothesis:
Lecture 14 Screening tests and result interpretation
 Faculty of Medicine Epidemiology and Biostatistics الوبائيات واإلحصاء الحيوي (31505204) Lecture 14 Screening tests and result interpretation By Hatim Jaber MD MPH JBCM PhD 12-7-2017 1 1. Basic epidemiological
Christina Martin Kazi Russell MED INF 406 INFERENCING Session 8 Group Project November 15, 2014
 INFERENCING (HW 8) 1 Christina Martin Kazi Russell MED INF 406 INFERENCING Session 8 Group Project November 15, 2014 Page 2 The Clinical Decision Support System designed to utilize the Training Set data
Assessment of performance and decision curve analysis
 Assessment of performance and decision curve analysis Ewout Steyerberg, Andrew Vickers Dept of Public Health, Erasmus MC, Rotterdam, the Netherlands Dept of Epidemiology and Biostatistics, Memorial Sloan-Kettering
Supplemental Information
 ARTICLE Supplemental Information This section contains additional detail about alternative scores that were considered for the M-CHAT-R/F (see Supplemental Appendix), as well as additional information
ROC Curves (Old Version)
") Chapter 545 ROC Curves (Old Version) Introduction This procedure generates both binormal and empirical (nonparametric) ROC curves. It computes comparative measures such as the whole, and partial, area
Chapter 545 ROC Curves (Old Version) Introduction This procedure generates both binormal and empirical (nonparametric) ROC curves. It computes comparative measures such as the whole, and partial, area
VU Biostatistics and Experimental Design PLA.216
 VU Biostatistics and Experimental Design PLA.216 Julia Feichtinger Postdoctoral Researcher Institute of Computational Biotechnology Graz University of Technology Outline for Today About this course Background
Introduction to ROC analysis
 Introduction to ROC analysis Andriy I. Bandos Department of Biostatistics University of Pittsburgh Acknowledgements Many thanks to Sam Wieand, Nancy Obuchowski, Brenda Kurland, and Todd Alonzo for previous
About OMICS International
 About OMICS International OMICS International through its Open Access Initiative is committed to make genuine and reliable contributions to the scientific community. OMICS International hosts over 700
Hayden Smith, PhD, MPH /\ v._
 Hayden Smith, PhD, MPH.. + /\ v._ Information and clinical examples provided in presentation are strictly for educational purposes, and should not be substituted for clinical guidelines or up-to-date medical
Systematic Reviews and meta-analyses of Diagnostic Test Accuracy. Mariska Leeflang
 Systematic Reviews and meta-analyses of Diagnostic Test Accuracy Mariska Leeflang m.m.leeflang@amc.uva.nl This presentation 1. Introduction: accuracy? 2. QUADAS-2 exercise 3. Meta-analysis of diagnostic
STATISTICAL METHODS FOR DIAGNOSTIC TESTING: AN ILLUSTRATION USING A NEW METHOD FOR CANCER DETECTION XIN SUN. PhD, Kansas State University, 2012
 STATISTICAL METHODS FOR DIAGNOSTIC TESTING: AN ILLUSTRATION USING A NEW METHOD FOR CANCER DETECTION by XIN SUN PhD, Kansas State University, 2012 A THESIS Submitted in partial fulfillment of the requirements
ROC Curve. Brawijaya Professional Statistical Analysis BPSA MALANG Jl. Kertoasri 66 Malang (0341)
") ROC Curve Brawijaya Professional Statistical Analysis BPSA MALANG Jl. Kertoasri 66 Malang (0341) 580342 ROC Curve The ROC Curve procedure provides a useful way to evaluate the performance of classification
ROC Curve Brawijaya Professional Statistical Analysis BPSA MALANG Jl. Kertoasri 66 Malang (0341) 580342 ROC Curve The ROC Curve procedure provides a useful way to evaluate the performance of classification
EBM, Study Design and Numbers. David Frankfurter, MD Professor OB/GYN The George Washington University
 EBM, Study Design and Numbers David Frankfurter, MD Professor OB/GYN The George Washington University 1978? 1978 Best Picture of 1978 The Deer Hunter Universal Studios The 50th Academy Awards were held
ROC Curves. I wrote, from SAS, the relevant data to a plain text file which I imported to SPSS. The ROC analysis was conducted this way:
 ROC Curves We developed a method to make diagnoses of anxiety using criteria provided by Phillip. Would it also be possible to make such diagnoses based on a much more simple scheme, a simple cutoff point
(true) Disease Condition Test + Total + a. a + b True Positive False Positive c. c + d False Negative True Negative Total a + c b + d a + b + c + d
 Disease Condition Test + Total + a. a + b True Positive False Positive c. c + d False Negative True Negative Total a + c b + d a + b + c + d") Biostatistics and Research Design in Dentistry Reading Assignment Measuring the accuracy of diagnostic procedures and Using sensitivity and specificity to revise probabilities, in Chapter 12 of Dawson
Biostatistics and Research Design in Dentistry Reading Assignment Measuring the accuracy of diagnostic procedures and Using sensitivity and specificity to revise probabilities, in Chapter 12 of Dawson
Behavioral Data Mining. Lecture 4 Measurement
 Behavioral Data Mining Lecture 4 Measurement Outline Hypothesis testing Parametric statistical tests Non-parametric tests Precision-Recall plots ROC plots Hardware update Icluster machines are ready for
The recommended method for diagnosing sleep
 reviews Measuring Agreement Between Diagnostic Devices* W. Ward Flemons, MD; and Michael R. Littner, MD, FCCP There is growing interest in using portable monitoring for investigating patients with suspected
MAESTRO TRIAL FINAL RESULTS. Gisela L.G. Menezes, MD, PhD
 MAESTRO TRIAL FINAL RESULTS Gisela L.G. Menezes, MD, PhD MAESTRO Angiogenesis Metastasis How does OA work? Malignant Benign How does OA work? D O How does OA work? Optoacoustic Imaging Fibroadenoma IDC
RELIABILITY OF OPERATORS DURING THE VISUAL INSPECTION OF PRODUCED PARENTERAL DRUGS
 RELIABILITY OF OPERATORS DURING THE VISUAL INSPECTION OF PRODUCED PARENTERAL DRUGS F. Sadeghipour, A. Bugmann, V. Herrera, P. Bonnabry Geneva, 22 March 2006 11th Congress of the European Association of
Nicolaus Copernicus University in Torun Medical College in Bydgoszcz Family Doctor Department CANCER PREVENTION IN GENERAL PRACTICE
 Nicolaus Copernicus University in Torun Medical College in Bydgoszcz Family Doctor Department CANCER PREVENTION IN GENERAL PRACTICE A key mission for family medicine is preserving health and maximizing
Lecture 5. Contingency /incidence tables Sensibility, specificity Relative Risk Odds Ratio CHI SQUARE test
 Lecture 5 Contingency /incidence tables Sensibility, specificity Relative Risk Odds Ratio CHI SQUARE test Contingency tables - example Factor 2 Present + Absent - Total Factor 1 Present + a b a+b Absent
An Improved Patient-Specific Mortality Risk Prediction in ICU in a Random Forest Classification Framework
 An Improved Patient-Specific Mortality Risk Prediction in ICU in a Random Forest Classification Framework Soumya GHOSE, Jhimli MITRA 1, Sankalp KHANNA 1 and Jason DOWLING 1 1. The Australian e-health and
Diagnostic screening. Department of Statistics, University of South Carolina. Stat 506: Introduction to Experimental Design
 Diagnostic screening Department of Statistics, University of South Carolina Stat 506: Introduction to Experimental Design 1 / 27 Ties together several things we ve discussed already... The consideration
Chapter 10. Screening for Disease
 Chapter 10 Screening for Disease 1 Terminology Reliability agreement of ratings/diagnoses, reproducibility Inter-rater reliability agreement between two independent raters Intra-rater reliability agreement
Jenny Toonstra, PhD, ATC Mid-Atlantic Athletic Trainers Association (MAATA) Student Educational Program May 20, 2017
 Student Educational Program May 20, 2017") Jenny Toonstra, PhD, ATC Mid-Atlantic Athletic Trainers Association (MAATA) Student Educational Program May 20, 2017 Appreciate the role of evidence-based medicine in relation to clinical examination and
Jenny Toonstra, PhD, ATC Mid-Atlantic Athletic Trainers Association (MAATA) Student Educational Program May 20, 2017 Appreciate the role of evidence-based medicine in relation to clinical examination and
Various performance measures in Binary classification An Overview of ROC study
 Various performance measures in Binary classification An Overview of ROC study Suresh Babu. Nellore Department of Statistics, S.V. University, Tirupati, India E-mail: sureshbabu.nellore@gmail.com Abstract
Understanding diagnostic tests. P.J. Devereaux, MD, PhD McMaster University
 Understanding diagnostic tests P.J. Devereaux, MD, PhD McMaster University Goals Understand sensitivity and specificity inform why they are in general problematic Discuss likelihood ratios Inform pretest
An Introduction to ROC curves. Mark Whitehorn. Mark Whitehorn
 An Introduction to ROC curves Mark Whitehorn Mark Whitehorn It s all about me Prof. Mark Whitehorn Emeritus Professor of Analytics Computing University of Dundee Consultant Writer (author) m.a.f.whitehorn@dundee.ac.uk
MethodologicOverview of Screening Studies
 MethodologicOverview of Screening Studies Diana L. Miglioretti, PhD University of California Davis Thanks to William Black, MD for many of these slides! 1/11/17 RSNA CTMW 2017 1 Learning Objectives Understand
Meta-analysis of diagnostic research. Karen R Steingart, MD, MPH Chennai, 15 December Overview
 Meta-analysis of diagnostic research Karen R Steingart, MD, MPH karenst@uw.edu Chennai, 15 December 2010 Overview Describe key steps in a systematic review/ meta-analysis of diagnostic test accuracy studies
Evaluating Diagnostic Procedures. Einas Al-Eisa, MSc, PhD
 Evaluating Diagnostic Procedures Einas Al-Eisa, MSc, PhD Outline What is diagnosis? Relevance The ideal diagnostic test Validity of diagnostic tests Sensitivity Specificity Predictive value What is Diagnosis?
Evaluation of a rapid lateral flow immunoassay (STic Expert HIT) for the diagnosis of heparin-induced thrombocytopenia (HIT)
 for the diagnosis of heparin-induced thrombocytopenia (HIT)") Evaluation of a rapid lateral flow immunoassay (STic Expert HIT) for the diagnosis of heparin-induced thrombocytopenia (HIT) Liesbeth De Cooman and Katrien Devreese University Hospital Ghent Coagulation
Evaluation of a rapid lateral flow immunoassay (STic Expert HIT) for the diagnosis of heparin-induced thrombocytopenia (HIT) Liesbeth De Cooman and Katrien Devreese University Hospital Ghent Coagulation
Types of Biomedical Research
 INTRODUCTION & MEASUREMENT IN CLINICAL RESEARCH Sakda Arj Ong Vallipakorn, MD MSIT, MA (Information Science) Pediatrics, Pediatric Cardiology Emergency Medicine, Ped Emergency Family Medicine Section of
Cochrane Handbook for Systematic Reviews of Diagnostic Test Accuracy
 Cochrane Handbook for Systematic Reviews of Diagnostic Test Accuracy Chapter 10 Analysing and Presenting Results Petra Macaskill, Constantine Gatsonis, Jonathan Deeks, Roger Harbord, Yemisi Takwoingi.
THE USE OF PLEURAL FLUID CHOLESTEROL IN IDENTIFYING THE TYPE OF PLEURAL EFFUSION
 THE USE OF PLEURAL FLUID CHOLESTEROL IN IDENTIFYING THE TYPE OF PLEURAL EFFUSION Hyacinth D. Jumalon, MD, DPCP West Visayas State University Medical Center Iloilo City Region VI introduction - The first
INTRODUCTION TO MACHINE LEARNING. Decision tree learning
 INTRODUCTION TO MACHINE LEARNING Decision tree learning Task of classification Automatically assign class to observations with features Observation: vector of features, with a class Automatically assign
12/26/2013. Types of Biomedical Research. Clinical Research. 7Steps to do research INTRODUCTION & MEASUREMENT IN CLINICAL RESEARCH S T A T I S T I C
 Types of Biomedical Research INTRODUCTION & MEASUREMENT IN CLINICAL RESEARCH Sakda Arj Ong Vallipakorn, MD MSIT, MA (Information Science) Pediatrics, Pediatric Cardiology Emergency Medicine, Ped Emergency
Evaluation of diagnostic tests
 Evaluation of diagnostic tests Biostatistics and informatics Miklós Kellermayer Overlapping distributions Assumption: A classifier value (e.g., diagnostic parameter, a measurable quantity, e.g., serum
PERFORMANCE MEASURES
 PERFORMANCE MEASURES Of predictive systems DATA TYPES Binary Data point Value A FALSE B TRUE C TRUE D FALSE E FALSE F TRUE G FALSE Real Value Data Point Value a 32.3 b.2 b 2. d. e 33 f.65 g 72.8 ACCURACY
Evidence-based Imaging: Critically Appraising Studies of Diagnostic Tests
 Evidence-based Imaging: Critically Appraising Studies of Diagnostic Tests Aine Marie Kelly, MD Critically Appraising Studies of Diagnostic Tests Aine Marie Kelly B.A., M.B. B.Ch. B.A.O., M.S. M.R.C.P.I.,
Evalua&ng Methods. Tandy Warnow
 Evalua&ng Methods Tandy Warnow You ve designed a new method! Now what? To evaluate a new method: Establish theore&cal proper&es. Evaluate on data. Compare the new method to other methods. How do you do
Prostate Cancer. Biomedical Engineering for Global Health. Lecture Fourteen. Early Detection. Prostate Cancer: Statistics
 Biomedical Engineering for Global Health Lecture Fourteen Prostate Cancer Early Detection Prostate Cancer: Statistics Prostate gland contributes enzymes, nutrients and other secretions to semen. United
Cognitive Screening in Risk Assessment. Geoffrey Tremont, Ph.D. Rhode Island Hospital & Alpert Medical School of Brown University.
 Cognitive Screening in Risk Assessment Geoffrey Tremont, Ph.D. Rhode Island Hospital & Alpert Medical School of Brown University Outline of Talk Definition of Dementia and MCI Incidence and Prevalence
4.5% 4.0% 3.5% 3.0% 2.5% 2.0% 1.5% 1.0% 0.5% 0.0% < >80 Current Age (Yrs)
") Biomedical Engineering for Global Health Lecture Twelve Prostate Cancer Early Detection Prostate Cancer: Statistics Prostate gland contributes enzymes, nutrients and other secretions to semen. United States:
Biomedical Engineering for Global Health Lecture Twelve Prostate Cancer Early Detection Prostate Cancer: Statistics Prostate gland contributes enzymes, nutrients and other secretions to semen. United States:
Module Overview. What is a Marker? Part 1 Overview
 SISCR Module 7 Part I: Introduction Basic Concepts for Binary Classification Tools and Continuous Biomarkers Kathleen Kerr, Ph.D. Associate Professor Department of Biostatistics University of Washington
Data that can be classified as belonging to a distinct number of categories >>result in categorical responses. And this includes:
 This sheets starts from slide #83 to the end ofslide #4. If u read this sheet you don`t have to return back to the slides at all, they are included here. Categorical Data (Qualitative data): Data that
Let s look a minute at the evidence supporting current cancer screening recommendations.
 I m Dr. Therese Bevers, Medical Director of the Cancer Prevention Center and Professor of Clinical Cancer Prevention at The University of Texas MD Anderson Cancer Center. Today s lecture is on screening
COMP90049 Knowledge Technologies
 COMP90049 Knowledge Technologies Introduction Classification (Lecture Set4) 2017 Rao Kotagiri School of Computing and Information Systems The Melbourne School of Engineering Some of slides are derived
Glossary of Practical Epidemiology Concepts
 Glossary of Practical Epidemiology Concepts - 2009 Adapted from the McMaster EBCP Workshop 2003, McMaster University, Hamilton, Ont. Note that open access to the much of the materials used in the Epi-546
Comparing Two ROC Curves Independent Groups Design
 Chapter 548 Comparing Two ROC Curves Independent Groups Design Introduction This procedure is used to compare two ROC curves generated from data from two independent groups. In addition to producing a
Appraising Diagnostic Test Studies
 Appraising Diagnostic Test Studies Martin Bland Prof. of Health Statistics Dept. of Health Sciences University of York http://www-users.york.ac.uk/~mb55/msc/ Diagnostic Test Studies How well does a test
SISCR Module 7 Part I: Introduction Basic Concepts for Binary Biomarkers (Classifiers) and Continuous Biomarkers
 and Continuous Biomarkers") SISCR Module 7 Part I: Introduction Basic Concepts for Binary Biomarkers (Classifiers) and Continuous Biomarkers Kathleen Kerr, Ph.D. Associate Professor Department of Biostatistics University of Washington
SISCR Module 7 Part I: Introduction Basic Concepts for Binary Biomarkers (Classifiers) and Continuous Biomarkers Kathleen Kerr, Ph.D. Associate Professor Department of Biostatistics University of Washington
sickness, disease, [toxicity] Hard to quantify
![sickness, disease, [toxicity] Hard to quantify](/thumbs/80/80506400.jpg "sickness, disease, [toxicity] Hard to quantify") BE.104 Spring Epidemiology: Test Development and Relative Risk J. L. Sherley Agent X? Cause Health First, Some definitions Morbidity = Mortality = sickness, disease, [toxicity] Hard to quantify death Easy
BE.104 Spring Epidemiology: Test Development and Relative Risk J. L. Sherley Agent X? Cause Health First, Some definitions Morbidity = Mortality = sickness, disease, [toxicity] Hard to quantify death Easy
Estimation of Area under the ROC Curve Using Exponential and Weibull Distributions
 XI Biennial Conference of the International Biometric Society (Indian Region) on Computational Statistics and Bio-Sciences, March 8-9, 22 43 Estimation of Area under the ROC Curve Using Exponential and
Protein Structure & Function. University, Indianapolis, USA 3 Department of Molecular Medicine, University of South Florida, Tampa, USA
 Protein Structure & Function Supplement for article entitled MoRFpred, a computational tool for sequence-based prediction and characterization of short disorder-to-order transitioning binding regions in
Diagnostic accuracy of range of motion measurements in early symptomatic hip and/or knee osteoarthritis
 Chapter 1 Diagnostic accuracy of range of motion measurements in early symptomatic hip and/or knee osteoarthritis Jasmijn F.M. Holla, Marike van der Leeden, Leo D. Roorda, Sita M.A. Bierma-Zeinstra, Jurgen
Dr. Ruby Senie is Professor of Clinical Epidemiology and Sociomedical Sciences in the Mailman School of Public Health.
 Screening Introduction Screening is the examination of asymptomatic people in order to classify them as likely or unlikely to have a particular disease. Epidemiologists study the screening of diseases
2011 ASCP Annual Meeting
 Diagnostic Accuracy Martin Kroll, MD Professor of Pathology and Laboratory Medicine Boston University School of Medicine Chief, Laboratory Medicine Boston Medical Center Disclosure Roche Abbott Course
Bayes theorem, the ROC diagram and reference values: Definition and use in clinical diagnosis
 Special Lessons issue: in biostatistics Responsible writing in science Bayes theorem, the ROC diagram and reference values: efinition and use in clinical diagnosis Anders Kallner* epartment of clinical
STUDIES OF THE ACCURACY OF DIAGNOSTIC TESTS: (Relevant JAMA Users Guide Numbers IIIA & B: references (5,6))
)") STUDIES OF THE ACCURACY OF DIAGNOSTIC TESTS: (Relevant JAMA Users Guide Numbers IIIA & B: references (5,6)) Introduction: The most valid study design for assessing the accuracy of diagnostic tests is a
STUDIES OF THE ACCURACY OF DIAGNOSTIC TESTS: (Relevant JAMA Users Guide Numbers IIIA & B: references (5,6)) Introduction: The most valid study design for assessing the accuracy of diagnostic tests is a
Meta-analysis of Diagnostic Test Accuracy Studies
 GUIDELINE Meta-analysis of Diagnostic Test Accuracy Studies November 2014 Copyright EUnetHTA 2013. All Rights Reserved. No part of this document may be reproduced without an explicit acknowledgement of
Introduction. We can make a prediction about Y i based on X i by setting a threshold value T, and predicting Y i = 1 when X i > T.
 Diagnostic Tests 1 Introduction Suppose we have a quantitative measurement X i on experimental or observed units i = 1,..., n, and a characteristic Y i = 0 or Y i = 1 (e.g. case/control status). The measurement
4 Diagnostic Tests and Measures of Agreement
 4 Diagnostic Tests and Measures of Agreement Diagnostic tests may be used for diagnosis of disease or for screening purposes. Some tests are more effective than others, so we need to be able to measure
SYSTEMATIC REVIEWS OF TEST ACCURACY STUDIES
 Biomarker & Test Evaluation Program SYSTEMATIC REVIEWS OF TEST ACCURACY STUDIES Patrick MM Bossuyt Structure 1. Clinical Scenarios 2. Test Accuracy Studies 3. Systematic Reviews 4. Meta-Analysis 5.
Receiver operating characteristic
 Receiver operating characteristic From Wikipedia, the free encyclopedia In signal detection theory, a receiver operating characteristic (ROC), or simply ROC curve, is a graphical plot of the sensitivity,
Bioengineering and World Health. Lecture Twelve
 Bioengineering and World Health Lecture Twelve Four Questions What are the major health problems worldwide? Who pays to solve problems in health care? How can technology solve health care problems? How
Ultrasound: Improving Breast Cancer Detection
 Transcript Details This is a transcript of an educational program accessible on the ReachMD network. Details about the program and additional media formats for the program are accessible by visiting: https://reachmd.com/programs/advances-in-womens-health/ultrasound-improving-breast-cancerdetection/3514/
Pat Quigley,PhD,MPH,ARNP,CRRN,FAAN,FAANP. Associate Director, VISN 8 Patient Safety Center Associate Chief for Nursing Service/Research
 Pat Quigley,PhD,MPH,ARNP,CRRN,FAAN,FAANP Associate Director, VISN 8 Patient Safety Center Associate Chief for Nursing Service/Research E-Mail: patricia.quigley@med.va.gov 1 Overview Formulate measurable
1 Diagnostic Test Evaluation
 1 Diagnostic Test Evaluation The Receiver Operating Characteristic (ROC) curve of a diagnostic test is a plot of test sensitivity (the probability of a true positive) against 1.0 minus test specificity
ABSTRAK Korelasi anatara Index Massa Tubuh(IMT) dan tekanan darah pada penduduk di Desa Lebih Kecamatan Gianyar
 dan tekanan darah pada penduduk di Desa Lebih Kecamatan Gianyar") ABSTRAK Korelasi anatara Index Massa Tubuh(IMT) dan tekanan darah pada penduduk di Desa Lebih Kecamatan Gianyar Obesitas dapat membuat berbagai masalah kesehatan, salah satunya adalah peningkatan tekanan
ABSTRAK Korelasi anatara Index Massa Tubuh(IMT) dan tekanan darah pada penduduk di Desa Lebih Kecamatan Gianyar Obesitas dapat membuat berbagai masalah kesehatan, salah satunya adalah peningkatan tekanan
Biomedical Engineering for Global Health
 Four Questions Biomedical Engineering for Global Health Lecture Eleven What are the major health problems worldwide? Who pays to solve problems in health care? How can technology solve health care problems?
«àπ π â Õ μ «å «π Áß μâ π π ßæ π ª
 «æ å μ Ù-ı ªï Ë Ûapple Ë Ù μ.. -.. ÚııÙ Reg 4-5 Med J Vol. 30 No. 4 Oct - Dec 2011 π æπ åμâπ Original Article «μ»ÿ º æ.., Cheerawan Tansupaphon M.D., «.«. ß «π Thai Board of Diagnostic Radiology ÿà ß π
isk ncer 15 Weeks ical C tion c 1,000 Years! Lifetime Screening Cost
 BME 301 Lecture Twelve HPV Testing The DNAwithPap Test is FDA-approved for routine adjunctive screening with a Pap test for women age 30 and older. Digene http://www.digene.com http://www.digene.com/papx
BME 301. Lecture Twelve
 BME 301 Lecture Twelve HPV Testing The DNAwithPap Test is FDA-approved for routine adjunctive screening with a Pap test for women age 30 and older. Digene http://www.digene.com http://www.digene.com/papx