HIV in Alameda County
|
|
|
- Jeremy Stafford
- 6 years ago
- Views:
Transcription
1 HIV in Alameda County Annual lepidemiology i Dt Data Presentation ti to the CCPC July 22, 2015 Prepared By Richard Lechtenberg & Neena Murgai HIV Epidemiology and Surveillance Unit HIV in Alameda County: An Overview 220 new diagnoses, on average, in per 100,000 population per year 70.4% 82.5% linked to care within 90 days 5,649 people living with HIV disease (PLHIV) at yearend per 100,000 population 70.1% received any HIV care in % were virally suppressed at last measurement in /17/2015 1
2 On the agenda 1. Diagnosis and Prevalence A. By Demographics B. By Social Determinants of Health 2. The Continuum of HIV Care 1. Identify Epi 101 Recap A. the population/denominator B. the sub population/numerator 7/17/2015 2

 Right")
3 Most Measures = What defines the subpopulation? # # What defines the population?? Numerator Denominator May be called different names Fraction Proportion Percentage Rate May be expressed in different ways ½ % 5per 100,000 (instead of 0.005%) To understand the measure you need to understand both! Surveillance Database Right for PLHIV who are patients at Clinic A Right for all PLHIV (bigger denominator) Right for PLHIV who are patients at Clinic B 7/17/2015 3
4 1. Identify Epi 101 Recap A. the population/denominator B. the sub population/numerator 2. Beware A. the prosecutor s fallacy! The Prosecutor s Fallacy Defined The assumption that: The chances of A among B = The chances of B among A 7/17/2015 4


5 The Prosecutor s Fallacy Illustrated The fallacy: Most striped squares are grey. Most grey squares are striped. Chances that a square is grey among striped squares: 4/9 = 44.4% Chances that a square is striped among grey squares: 4/25 = 16% 1. Identify Epi 101 Recap A. the population/denominator B. the sub population/numerator 2. Beware A. the prosecutor s fallacy! B. association vs. causation 7/17/2015 5


6 Confounding: An example Question: Is Alaska s mortality rate different than Florida s? Mortality rate: 399 per 100, % 40% 30% 20% 10% 0% State < >64 Age The observed difference in mortality rates is confounded by age!? Not fair to compare them directly! 50% 40% 30% 20% 10% 0% Death < >64 Mortality rate: 1,069 per 100,000 SOURCE: Modules/EP/EP713_StandardizedRates/EP713_StandardizedRates3.html 1. Identify Epi 101 Recap A. the population/denominator B. the sub population/numerator 2. Beware A. the prosecutor s fallacy! B. association vs. causation C. small numbers 7/17/2015 6

7 Less Data Less Confidence in What the Data Says A caveat: Gender identity is not reliably captured in surveillance data because only sex assigned at birth is routinely captured in the medical record. To avoid underestimating the burden of HIV in the transgender community, breakdowns will be provided by sex assigned at birth. 7/17/2015 7


8 On the agenda 1. Diagnosis and Prevalence A. By Demographics B. By Social Determinants of Health 2. The Continuum of HIV Care 7/17/2015 8
9 HIV in Alameda County by the Numbers # new diagnoses, regardless of stage #new AIDS diagnoses # of PLHIV (at year end) , , , ,649 On the agenda 1. Diagnosis and Prevalence A. By Demographics B. By Social Determinants of Health 2. The Continuum of HIV Care 7/17/2015 9
10 Annual Diagnosis Rate per 100,000 Trends in New HIV Diagnosis Rates by Sex, Alameda County, Sex All Male Female NOTE: (1) Rates are 3 year average annual rates. (2) Sex refers to sex assigned at birth. (3) Grey areas are 95% confidence bands. Trends in New HIV Diagnosis Rates by Race/Ethnicity, Alameda County, All races African American White Race/Ethnicity Hispanic/Latino API Annual Diagnosis Rate per 100, NOTE: (1) Rates are 3 year average annual rates. (2) Grey areas are 95% confidence bands. NOT SHOWN: Other/unknown race (rates not calculable). 7/17/
 Rates are 3 year average annual rates.")
11 Trends in New HIV Diagnosis Rates by Sex & Race/Ethnicity, Alameda County, Race/Ethnicity All races African American White Hispanic/Latino API Male Female Ann nual Diagnosis Rate per 100, NOTE: (1) Rates are 3 year average annual rates. (2) Sex refers to sex assigned at birth. (3) Grey areas are 95% confidence bands. NOT SHOWN: Other/unknown race (rates not calculable). Trends in New HIV Diagnosis Rates by Age & Race/Ethnicity, Alameda County, NOTES: Analysis done by Poisson regression assuming a linear effect of time (on the log scale) and allowing for all 2 way interactions. 7/17/

12 7/17/
13 Key takeaways: Overall, diagnosis rates have decreased since 2006 The most notable declines have occurred among African American women African Americans and whites in their 30s and 50s Although increases have been seen in API in their 20s and 40s, rates among them remain low compared to other groups On the agenda 1. Diagnosis and Prevalence A. By Demographics B. By Social Determinants of Health 2. The Continuum of HIV Care 7/17/
14 Social Determinants of Health Factors such as Poverty Unemployment Education level Can have individual as well as community effects E.g., an individual s id health may be impacted dby their own wealth as well as that of their community Diagnosis Rates by Neighborhood Poverty Level, Alameda County % of Census Tract Residents Living Below Poverty % % % % % % Annual Diagnosis Rate per 100,000 NOTE: (1) Bar widths proportional to the fraction of the underlying population in the category (with the exception categories comprising <2% of the population, for which bars are enlarged for visibility). (2) A clustering algorithm was used to determine optimal category cut points. (3) The dashed line indicates the overall rate for the county as a whole. 7/17/
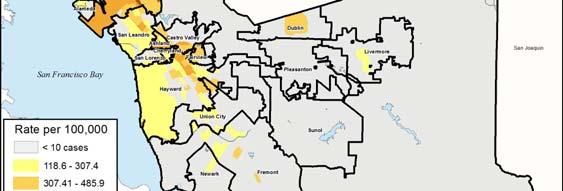
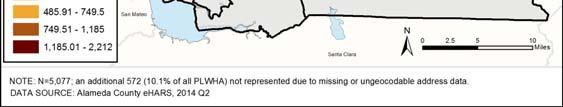
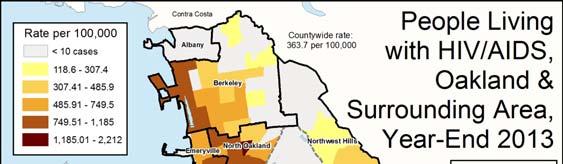
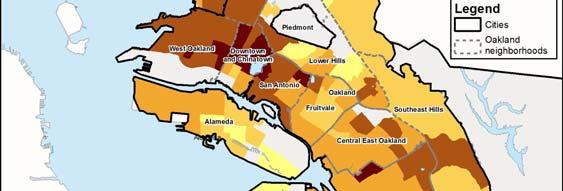
15 Prevalence by Neighborhood Poverty Level, Alameda County, Year End % of Census s Tract Residents Living Below Poverty % % % % % % % % Prevalence per 100,000 NOTE: (1) Bar widths proportional to the fraction of the underlying population in the category (with the exception categories comprising <2% of the population, for which bars are enlarged for visibility). (2) A clustering algorithm was used to determine optimal category cut points. (3) The dashed line indicates the overall rate for the county as a whole. Diagnosis Rates by Neighborhood Unemployment, Alameda County % of Census Tract Residents who are Unemployed % % % % % % Annual Diagnosis Rate per 100,000 NOTE: (1) Bar widths proportional to the fraction of the underlying population in the category (with the exception categories comprising <2% of the population, for which bars are enlarged for visibility). (2) A clustering algorithm was used to determine optimal category cut points. (3) The dashed line indicates the overall rate for the county as a whole. 7/17/
16 Prevalence by Neighborhood Unemployment, Alameda County, Year End % of Census s Tract Residents who are Unemployed % % % % % % % % Prevalence per 100,000 NOTE: (1) Bar widths proportional to the fraction of the underlying population in the category (with the exception categories comprising <2% of the population, for which bars are enlarged for visibility). (2) A clustering algorithm was used to determine optimal category cut points. (3) The dashed line indicates the overall rate for the county as a whole. Diagnosis Rates by Neighborhood Education Level, Alameda County % of fcensus Tract Residents with Less than a High School Education % % % % % % % Annual Diagnosis Rate per 100,000 NOTE: (1) Bar widths proportional to the fraction of the underlying population in the category (with the exception categories comprising <2% of the population, for which bars are enlarged for visibility). (2) A clustering algorithm was used to determine optimal category cut points. (3) The dashed line indicates the overall rate for the county as a whole. 7/17/
17 Prevalence by Neighborhood Education Level, Alameda County, Year End % of Census Tract Residents with Less than a High School Education % % % % % % % 0048% % Prevalence per 100,000 NOTE: (1) Bar widths proportional to the fraction of the underlying population in the category (with the exception categories comprising <2% of the population, for which bars are enlarged for visibility). (2) A clustering algorithm was used to determine optimal category cut points. (3) The dashed line indicates the overall rate for the county as a whole. Diagnosis Rates by Neighborhood Insurance Status, Alameda County % of Census Tract Residents who are Uninsured % % % % % % Annual Diagnosis Rate per 100,000 NOTE: (1) Bar widths proportional to the fraction of the underlying population in the category (with the exception categories comprising <2% of the population, for which bars are enlarged for visibility). (2) A clustering algorithm was used to determine optimal category cut points. (3) The dashed line indicates the overall rate for the county as a whole. 7/17/
18 Prevalence by Neighborhood Insurance Status, Alameda County, Year End % of Census s Tract Residents who are Uninsured % % % % % % 4-8.4% % Prevalence per 100,000 NOTE: (1) Bar widths proportional to the fraction of the underlying population in the category (with the exception categories comprising <2% of the population, for which bars are enlarged for visibility). (2) A clustering algorithm was used to determine optimal category cut points. (3) The dashed line indicates the overall rate for the county as a whole. Prevalence by Neighborhood Poverty Level and Race/Ethnicity, Alameda County, 2011 revalence per 100,000 Pr Race/Ethnicity African American API Hispanic/Latino White 0% 10% 20% 30% 40% 50% % of Census Tract Residents Living Below Poverty NOTE: A clustering algorithm was used to determine optimal category cut points. EXCLUSIONS: N=24 PLHIV <18 years of age. NOT SHOWN: N=183 PLHIV with other or unknown race/ethnicity. 7/17/
19 Prevalence by Neighborhood Unemployment and Race/Ethnicity, Alameda County, 2011 Pr revalence per 100, Race/Ethnicity African American API Hispanic/Latino White 0 0% 10% 20% 30% % of Census Tract Residents who are Unemployed NOTE: A clustering algorithm was used to determine optimal category cut points. EXCLUSIONS: N=24 PLHIV <18 years of age. NOT SHOWN: N=183 PLHIV with other or unknown race/ethnicity. Prevalence by Neighborhood Education Level and Race/Ethnicity, Alameda County, Race/Ethnicity African American API Hispanic/Latino White revalence per 100,000 Pr % 10% 20% 30% 40% 50% % of Census Tract Residents with Less than a High School Education NOTE: A clustering algorithm was used to determine optimal category cut points. EXCLUSIONS: N=24 PLHIV <18 years of age. NOT SHOWN: N=183 PLHIV with other or unknown race/ethnicity. 7/17/
20 Prevalence by Neighborhood Insurance Status and Race/Ethnicity, Alameda County, Race/Ethnicity African American API Hispanic/Latino White revalence per 100,000 Pr % 10% 20% 30% % of Census Tract Residents who are Uninsured NOTE: A clustering algorithm was used to determine optimal category cut points. EXCLUSIONS: N=24 PLHIV <18 years of age. NOT SHOWN: N=183 PLHIV with other or unknown race/ethnicity. Key takeaways: Diagnosis rates and prevalence generally increase with increasing neighborhood poverty and unemployment and with decreasing rates of insurance and education These associations appear to vary by race/ethnicity Appear to be less prominent among Latinos 7/17/
21 On the agenda 1. Diagnosis and Prevalence A. By Demographics B. By Social Determinants of Health 2. The Continuum of HIV Care The Continuum of HIV Care in Alameda County Among N=669 new diagnoses in * Among N=5,370 PLHIV in Alameda Co. for the entirety of 2013** 100% 90% 80% 70% 60% 50% 40% 30% 20% 10% 0% 82.5% 70.4% 70.1% 55.7% 44.5% Linked Retained Virally Suppressed *Of 682 total diagnoses, 13 died within 90 days and are excluded from analysis **Of 5,585 PLHIV at year end 2012, 42 are known to have died and an additional 173 to have moved out of Alameda County in ) Linkage defined as having a reported CD4 or VL ordered within 90 days or less of diagnosis; 2) Retention calculated using labs ordered in 2013; 3) Viral suppression defined as most recent VL in 2013 < 200 copies/ml 7/17/
22 Linkage to HIV Care in 90 days of Diagnosis by Sex, Alameda County, Including labs on the date of diagnosis? No Yes All (N=669) 70.4% 82.5% Male (N=573) 71.0% 82.9% Female (N=96) 66.7% 80.2% 0% 25% 50% 75% 100% Percent linked in 90 days or less NOTES: (1) Linkage defined as having CD4 and viral load tests. (2) Sex refers to sex assigned at birth. EXCLUSIONS: N=13 patients who died within 90 days of diagnosis. Linkage to HIV Care in 90 days of Diagnosis by Race/Ethnicity, Alameda County, Including labs on the date of diagnosis? No Yes All races (N=669) African American (N=277) White (N=161) Hispanic/Latino (N=149) 70.4% 70.4% 67.1% 73.2% 82.5% 81.2% 80.7% 86.6% API (N=65) 70.8% 83.1% 0% 25% 50% 75% 100% Percent linked in 90 days or less NOTE: Linkage defined as having CD4 and viral load tests. EXCLUSIONS: N=13 patients who died within 90 days of diagnosis. NOT SHOWN: N=17 patients with other/unknown race. 7/17/
23 Linkage to HIV Care in 90 days of Diagnosis by Age at Diagnosis, Alameda County, All ages (N=669) (N=34) (N=188) (N=158) (N=182) (N=84) 60 & over (N=22) Including labs on the date of diagnosis? No Yes 58.8% 70.2% 67.1% 70.4% 70.6% 70.3% 72.7% 82.5% 82.4% 81% 82.4% 81% 81.8% 90.5% 0% 25% 50% 75% 100% Percent linked in 90 days or less NOTE: Linkage defined as having CD4 and viral load tests. EXCLUSIONS: N=13 patients who died within 90 days of diagnosis. NOT SHOWN: N < 5 patients aged Engagement in HIV Care in 2013 by Sex Among PLHIV at Year End 2012, Alameda County Measure 1+ visit 2+ visits 90+ days apart All (N=5,370) 44.5% 70.1% Male (N=4,402) 45.6% 70.3% Female (N=968) 39.5% 69.1% 0% 20% 40% 60% 80% NOTE: (1) Care visits defined as having CD4 and viral load tests. (2) Sex refers to sex assigned at birth. EXCLUSIONS: PLHIV at year end 2012 who died (N=42) or moved (N=173) during /17/
24 Engagement in HIV Care in 2013 by Race/Ethnicity Among PLHIV at Year End 2012, Alameda County Measure 1+ visit 2+ visits 90+ days apart All races (N=5,370) African American (N=2,280) White (N=1,787) Hispanic/Latino (N=906) 44.5% 40.6% 48.8% 44.2% 70.1% 68.2% 72.9% 67.0% 51.1% API (N=231) 78.8% 0% 20% 40% 60% 80% NOTE: Care visits defined as having CD4 and viral load tests. EXCLUSIONS: PLHIV at year end 2012 who died (N=42) or moved (N=173) during NOT SHOWN: N=166 PLHIV with other/unknown race/ethnicity. Engagement in HIV Care in 2013 by Age Among PLHIV at Year End 2012, Alameda County Measure 1+ visit 2+ visits 90+ days apart All ages (N=5 5,370) 44.5% 70.1% (N=26) 42.3% 73.1% (N=392) 41.3% 71.4% (N=782) 38.1% 65.3% (N=1,646) 43.2% 68.7% (N=1,664) 47.4% 72.7% 7% 60 & over (N=848) 48.7% 71.2% 0% 20% 40% 60% 80% NOTE: (1) Care visits defined as having CD4 and viral load tests. (2) Age is at year end EXCLUSIONS: PLHIV at year end 2012 who died (N=42) or moved (N=173) during NOT SHOWN: N=12 PLHIV aged /17/
25 Most Recent Viral Load in 2013 by Sex Among PLHIV at Year End 2012, Alameda County Virologic Status Undetectable Suppressed Unsuppressed Only CD4 reported No CD4s or VLs reported All (N=5,370) Male (N=4,402) Female (N=968) 10% 20% 30% 40% 50% 60% 70% 80% 90% 100% NOTE: VL categories are defined as follows: Undetectable = 0 75 copies/ml, Suppressed = , Unsuppressed = 200+; Sex refers to sex assigned at birth EXCLUSIONS: PLHIV at year end 2012 who died (N=42 ) or moved (N=173) during 2012 Most Recent Viral Load in 2013 by Race/Ethnicity Among PLHIV at Year End 2012, Alameda County Virologic Status Undetectable Suppressed Unsuppressed Only CD4 reported No CD4s or VLs reported All races (N=5,370) African American (N=2,280) White (N=1,787) Hispanic/Latino (N=906) API (N=231) 10% 20% 30% 40% 50% 60% 70% 80% 90% 100% NOTE VL categories are defined as follows: Undetectable = 0 75 copies/ml, Suppressed = , Unsuppressed = 200+ EXCLUSIONS: PLHIV at year end 2012 who died (N=42 ) or moved (N=173) during 2012 NOT SHOWN: N=166 PLHIV with other/unknown race/ethnicity 7/17/
26 Most Recent Viral Load in 2013 by Age Among PLHIV at Year End 2012, Alameda County Virologic Status Undetectable Suppressed Unsuppressed Only CD4 reported No CD4s or VLs reported All ages (N=5,370) (N=26) (N=392) (N=782) (N=1,646) (N=1,664) 60 & over (N=848) 10% 20% 30% 40% 50% 60% 70% 80% 90% 100% NOTES: VL categories are defined as follows: Undetectable = 0 75 copies/ml, Suppressed = , Unsuppressed = 200+ EXCLUSIONS: PLHIV at year end 2012 who died (N=42 ) or moved (N=173) during 2012 NOT SHOWN: N=12 PLHIV aged 0 12 Key takeaways: Linkage Lowest among women and whites Highest among those in their 50s Retention in (any) care Lower among African Americans, Latinos, and those in their 30s in continuous care Lower among women, as well as the above groups Viral Suppression Lower among women, African Americans, and Latinos Increasingly common in older age groups 7/17/
27 Thank you! Contact withany questions or comments 7/17/
Missouri St. Louis TGA 2016 HIV Epidemiological Profile
 Missouri St. Louis TGA 2016 HIV Epidemiological Profile St. Louis TGA Part A Planning Council Prepared by the City of St. Louis Department of Health Center for Health Information, Research, and Planning
HIV in Alameda County,
 HIV in Alameda County, 2014-2016 Alameda County Public Health Department HIV Epidemiology & Surveillance Unit HIV in Alameda County, 2014-2016 March 2018 HIV Epidemiology and Surveillance Unit HIV STD
SCOPE OF HIV/AIDS IN MINNESOTA
 SCOPE OF HIV/AIDS IN MINNESOTA National Perspective Compared to the rest of the nation, Minnesota is considered to be a low- to-moderate HIV/AIDS incidence state. In 2013 (the most recent year for which
Epidemiology of HIV Among Women in Florida, Reported through 2014
 To protect, promote and improve the health of all people in Florida through integrated state, county, and community efforts. Created: 12/4/14 Revision: 1/27/15 Epidemiology of HIV Among Women in Florida,
State of Alabama HIV Surveillance 2014 Annual Report
 State of Alabama HIV Surveillance 2014 Annual Report Prepared by: Division of STD Prevention and Control HIV Surveillance Branch Contact Person: Richard P. Rogers, MS, MPH richard.rogers@adph.state.al.us
HIV/AIDS Epidemiology in Alameda County: State of the County Report
 Lake Merritt, Oakland,California HIV/AIDS Epidemiology in Alameda County: State of the County Report Muntu Davis, MD, MPH County Health Officer and Public Health Director Alameda County White House Office
State of Alabama HIV Surveillance 2013 Annual Report Finalized
 State of Alabama HIV Surveillance 2013 Annual Report Finalized Prepared by: Division of STD Prevention and Control HIV Surveillance Branch Contact Person: Allison R. Smith, MPH Allison.Smith@adph.state.al.us
Geospatial Targeting of Young HIV-infected Men who have Sex with Men (YMSM) in CNICS
 in CNICS") Geospatial Targeting of Young HIV-infected Men who have Sex with Men (YMSM) in CNICS Patrick Loose, Chief, SDHHS HIV, STD, and Hepatitis Branch Sheldon Morris M.D., M.P.H. University of California, San
Geospatial Targeting of Young HIV-infected Men who have Sex with Men (YMSM) in CNICS Patrick Loose, Chief, SDHHS HIV, STD, and Hepatitis Branch Sheldon Morris M.D., M.P.H. University of California, San
New Jersey HIV/AIDS Epidemiologic Overview, 2017 (Data based upon the HIV/AIDS Reporting System ehars, unless otherwise noted.)
") New Jersey HIV/AIDS Epidemiologic Overview, 2017 (Data based upon the HIV/AIDS Reporting System ehars, unless otherwise noted.) New Jersey Department of Health Division of HIV, STD, TB Services INTRODUCTION
New Jersey HIV/AIDS Epidemiologic Overview, 2017 (Data based upon the HIV/AIDS Reporting System ehars, unless otherwise noted.) New Jersey Department of Health Division of HIV, STD, TB Services INTRODUCTION
Behind the Cascade: Analyzing Spatial Patterns Along the HIV Care Continuum
 Behind the Cascade: Analyzing Spatial Patterns Along the HIV Care Continuum Kathleen Brady 1,2, M. Eberhart 1, A. Hillier 2, C. Voytek 2, M. Blank 2, I. Frank 2, D. Metzger, 2 B. Yehia 2 1 Philadelphia
HIV & AIDS Cases in Alameda County
 HIV & AIDS Cases in Alameda County Presentation to the CCPC August 24, 2011 Elaine Bautista & Alex Marr What is Epidemiology? The study of the distributions (who, where and when) and determinants (what
2.1 Increase 30 day linkage to 85% Statewide 83% (251/301) 84% Unknown 85% Ryan White (identified through EIS or Outreach) 84% (31/37) 90% (44/49) TBD
 84% Unknown 85% Ryan White (identified through EIS or Outreach) 84% (31/37) 90% (44/49) TBD") Objective Population Baseline (2016) 2017 2018 2019 2020 2021 Status 2021 Goal Goal 1: Reduce New HIV Infections Projected 1.1 Aware of HIV status Statewide 88% (1,100 people) 90% (1000 people) Met 90%
Objective Population Baseline (2016) 2017 2018 2019 2020 2021 Status 2021 Goal Goal 1: Reduce New HIV Infections Projected 1.1 Aware of HIV status Statewide 88% (1,100 people) 90% (1000 people) Met 90%
HIV EPIDEMIOLOGY IN NEW YORK CITY
 HIV EPIDEMIOLOGY IN NEW YORK CITY Ellen Weiss Wiewel, MHS HIV Epidemiology and Field Services Program New York City Department of Health and Mental Hygiene http://www.nyc.gov/html/doh/html/dires/hivepi.shtml
HAWAII 2015 HIV CARE CONTINUUM
 HAWAII 2015 HIV CARE CONTINUUM Fenfang Li, PHD, MPH Communicable Disease and Public Health Nursing Division State of Hawaii Department of Health January 16, 2018 UPDATED NATIONAL HIV/AIDS STRATEGY (NHAS)
State of Alabama AIDS Drug Assistance Program (ADAP) Quarterly Report
 Quarterly Report") State of Alabama AIDS Drug Assistance Program (ADAP) Quarterly Report This report reflects active clients currently enrolled in ADAP Full-pay Prescription Program (ADAP-Rx), Alabama s Insurance Assistance
State of Alabama AIDS Drug Assistance Program (ADAP) Quarterly Report This report reflects active clients currently enrolled in ADAP Full-pay Prescription Program (ADAP-Rx), Alabama s Insurance Assistance
Planning Council Meeting May 17, 2016 Yohannes Abaineh, MPH
 Ryan White Part A Program Services Client-Level Data Report FY2015 Planning Council Meeting May 17, 2016 Yohannes Abaineh, MPH Yohannes.abaineh@baltimorecity.gov Mission Improve the quality of life for
Data to Care: Improving Health Across the HIV Care Continuum in Colorado
 Data to Care: Improving Health Across the HIV Care Continuum in Colorado NASTAD Technical Assistance Meeting July 31, 2015 Maria Chaidez Statewide Linkage to Care Coordinator Quick Overview of CO As of
Bronx Community Health Dashboard: HIV and AIDS
 Bronx Community Health Dashboard: HIV and AIDS Created: 5/4/17 Last Updated: 3//19 See last slide for more information about this project. 1 Overview of HIV/AIDS in the Bronx Disparities exist in early
Illustrating HIV/AIDS in the United States Update
 Illustrating HIV/AIDS in the United States 2016 Update About AIDSVu AIDSVu is a compilation of interactive, online maps that allows users to visually explore the HIV epidemic in the U.S. alongside critical
Re-linkage and Retention in Care of HIV-diagnosed Persons presumed to be Out-of-Care Based on New York City Surveillance Data
 Re-linkage and Retention in Care of HIV-diagnosed Persons presumed to be Out-of-Care Based on New York City Surveillance Data Chi-Chi N. Udeagu, MPH Epidemiology and Field Services Program New York City
Uvalde HSDA Counties: Dimmitt, Edwards, Kinney, LeSalle, Maverick, Real, Uvalde, Val Verde, Zavala
 Uvalde HSDA Draft Uvalde HSDA Counties: Dimmitt, Edwards, Kinney, LeSalle, Maverick, Real, Uvalde, Val Verde, Zavala Epi Profile In the Uvalde HSDA, the number of new diagnoses has remained flat and stable
Public-Private Collaboration to Re-engage Out-of-Care Persons into HIV Care
 Public-Private Collaboration to Re-engage Out-of-Care Persons into HIV Care Chi-Chi Udeagu, MPH Jamie Huang, MPH Lil Eason Leonard Pickett New York City Department of Health and Mental Hygiene Adherence
Status of the HIV/AIDS Epidemic San Francisco
 Status of the HIV/AIDS Epidemic San Francisco Applied Research, Community Health, Epidemiology and Surveillance Branch Presented to HIV Health Services Planning Council July 2014 1 HIV/AIDS Surveillance
The Association of Socioeconomic Status and Late Stage Breast Cancer in Florida: A Spatial Analysis using Area-Based Socioeconomic Measures
 The Association of Socioeconomic Status and Late Stage Breast Cancer in Florida: A Spatial Analysis using Area-Based Socioeconomic Measures Jill Amlong MacKinnon, PhD Florida Cancer Data System University
Financial Incentives, Linkage to Care and Viral Suppression HPTN 065 (TLC-Plus) Study. Wafaa El-Sadr ICAP at Columbia University New York, NY
 Study. Wafaa El-Sadr ICAP at Columbia University New York, NY") Financial Incentives, Linkage to Care and Viral Suppression HPTN 065 (TLC-Plus) Study Wafaa El-Sadr ICAP at Columbia University New York, NY Outline of Presentation Background and study rationale Methods
Financial Incentives, Linkage to Care and Viral Suppression HPTN 065 (TLC-Plus) Study Wafaa El-Sadr ICAP at Columbia University New York, NY Outline of Presentation Background and study rationale Methods
Regional Collaboration to Optimize the Cascade: The Northwestern Public Health CFAR Consortium
 Regional Collaboration to Optimize the Cascade: The Northwestern Public Health CFAR Consortium Julie Dombrowski, MD, MPH Assistant Professor of Medicine, University of Washington Deputy Director, Public
Clinical Quality Management Program. April 25th, 2018 Katie Cobb & K.C. D'Onfro Senior Quality Management Coordinators Ryan White Services Division
 Clinical Quality Management Program April 25th, 2018 Katie Cobb & K.C. D'Onfro Senior Quality Management Coordinators Ryan White Services Division 1 Learning Objectives Epidemiological profile of the EMA/Part
Changes in viral suppression status among US HIV-infected patients receiving care
 CONCISE COMMUNICATION Changes in viral suppression status among US HIV-infected patients receiving care Nicole Crepaz a, Tian Tang b, Gary Marks a and H. Irene Hall a Objective: To examine changes in viral
USING A QUALITY IMPROVEMENT COHORT MODEL TO ACHIEVE HEALTH EQUITY
 USING A QUALITY IMPROVEMENT COHORT MODEL TO ACHIEVE HEALTH EQUITY Katrease Hale Ryan White Quality Manager Leanne F. Savola HIV/STI Programs Director OBJECTIVES Describe a Metro Detroit quality improvement
Disparity Data Fact Sheet General Information
 Disparity Data Fact Sheet General Information Tobacco use is a well-recognized risk factor for many cancers, respiratory illnesses and cardiovascular diseases within Michigan. rates have continued to decline
Ending the Epidemic in New York State
 Ending the Epidemic in New York State HIV Quality of Care Clinical and Consumer Advisory Committee Joint Meeting September 8, 2015 September 10, 2015 Defining the End of AIDS Goal Reduce from 3,000 to
In the Abilene HSDA, the number of new diagnoses has remained flat and stable for the past several years.
 DRAFT-Abilene HSDA Abilene HSDA Draft Abilene HSDA Counties: Brown, Callahan, Coleman, Comanche, Eastland, Fisher, Haskell, Jones, Kent, Knox, Mitchell, Nolan, Runnels, Scurry, Shackelford, Stephens, Stonewall,
San Francisco Medical Monitoring Project (MMP) Maree Kay Parisi Applied Research, Community Health Epidemiology and Surveillance
 Maree Kay Parisi Applied Research, Community Health Epidemiology and Surveillance") San Francisco Medical Monitoring Project (MMP) Maree Kay Parisi Applied Research, Community Health Epidemiology and Surveillance Medical Monitoring Project Overview National prospective Local data and
San Francisco Medical Monitoring Project (MMP) Maree Kay Parisi Applied Research, Community Health Epidemiology and Surveillance Medical Monitoring Project Overview National prospective Local data and
Substance Abuse Hospitalizations
 Substance Abuse Hospitalizations Every year thousands of in-patient treatments for tobacco, alcohol and other drugs are provided to residents of Contra Costa. People in living in Contra Costa are more
Disparities in HIV Care. Slides prepared by Kirk Fergus, Intern National Quality Center
 Disparities in HIV Care Slides prepared by Kirk Fergus, Intern National Quality Center At a glance At a glance MSM accounted for 61% of all new HIV infections in the U.S. in 2009, as well as nearly half
Data: Access, Sources, and Systems
 EXEMPLARY INTEGRATED HIV PREVENTION AND CARE PLAN SECTIONS Data: Access, Sources, and Systems REGION PLAN TYPE JURISDICTIONS HIV PREVALENCE Midwest Integrated state-only prevention and care plan State
COMBINING DATA SOURCES TO EVALUATE HIV HOUSING PROGRAMS: EXAMPLES
 COMBINING DATA SOURCES TO EVALUATE HIV HOUSING PROGRAMS: EXAMPLES FROM NEW YORK CITY HOPWA John Rojas, MPA, Director of Administration and Housing Laura Hollod, MPH, Senior Analyst New York City Department
State of Alabama HIV Surveillance 2012 Annual Report Finalized
 State of Alabama HIV Surveillance 2012 Annual Report Finalized Prepared by: Division of HIV/AIDS Prevention and Control HIV Surveillance Branch Contact Person: Allison R. Smith, MPH Allison.Smith@adph.state.al.us
AIR POLLUTION RISK & VULNERABILITY TO HEALTH IMPACTS: A LOOK AT WEST OAKLAND
 AIR POLLUTION RISK & VULNERABILITY TO HEALTH IMPACTS: A LOOK AT WEST OAKLAND AB 617 Community Air Protection Program Consultation Group Meeting March 26, 2018 Muntu Davis, MD, MPH Alameda County Health
Table of Contents. 2 P age. Susan G. Komen
 RHODE ISLAND Table of Contents Table of Contents... 2 Introduction... 3 About... 3 Susan G. Komen Affiliate Network... 3 Purpose of the State Community Profile Report... 4 Quantitative Data: Measuring
Ensure access to and compliance with treatment for low-income uninsured Virginia residents living with HIV/AIDS
 Public Health/ CHSB Lilibeth Grandas x1211 Sharron Martin x1239 Program Purpose Program Information Ensure access to and compliance with treatment for low-income uninsured Virginia residents living with
Negative Hepatitis C Reporting and Linkage to Care Outreach
 Negative Hepatitis C Reporting and Linkage to Care Outreach NASTAD 7 th National Hepatitis Technical Assistance Meeting November 28-30, 2017 Angelica Bocour, MPH Director of Viral Hepatitis Surveillance
CDRI Cancer Disparities Geocoding Project. November 29, 2006 Chris Johnson, CDRI
 CDRI Cancer Disparities Geocoding Project November 29, 2006 Chris Johnson, CDRI cjohnson@teamiha.org CDRI Cancer Disparities Geocoding Project Purpose: To describe and understand variations in cancer incidence,
Gender Disparities in Viral Suppression and Antiretroviral Therapy Use by Racial and Ethnic Group Medical Monitoring Project,
 Gender Disparities in Viral Suppression and Antiretroviral Therapy Use by Racial and Ethnic Group Medical Monitoring Project, 2009-2010 Linda Beer PhD, Christine L Mattson PhD, William Rodney Short MD,
Retention in HIV Care
 Retention in HIV Care Interpretation, interventions, & identifying those in need of support. Beverly Woodward, MSN, RN Division of Infectious Diseases Vanderbilt University Medical Center Objectives Why
EVALUATIONWEB 2014 DIRECTLY FUNDED CBO CLIENT-LEVEL DATA COLLECTION TEMPLATE
 General instructions for completing the EvaluationWeb Directly Funded CBO Client-Level Data Collection Template This data collection template is provided to assist community-based organizations that receive
HIV & HCV in TN: State of the State
 HIV & HCV in TN: State of the State Vanderbilt CCC HIV Symposium Nashville, TN / November 2, 2018 Carolyn Wester, MD, MPH TDH HIV/STD/VH Program Outline HIV Epidemiology HIV Continuum of Care HIV Vulnerability
San Francisco Department of Public Health Program Collaboration and Service Integration Surveillance Baseline Assessment
 Background and Purpose San Francisco Department of Public Health This syndemics assessment is the first step in developing a sustainable system of primary prevention and clinical care in San Francisco
HIV Viral Suppression, 37 States and the District of Columbia, 2014
 DOI 10.1007/s10900-017-0427-3 ORIGINAL PAPER HIV Viral Suppression, 37 States and the District of Columbia, 2014 Kristen L. Hess 1 H. Irene Hall 1 Published online: 18 September 2017 Springer Science+Business
How can new technologies and social media improve HIV prevention for gay and bisexual men?
 How can new technologies and social media improve HIV prevention for gay and bisexual men? May 8th, 2015 Patrick S. Sullivan, PhD Rollins School of Public Health Presentation Plan HIV in MSM Atlanta: A
Clinical and Behavioral Characteristics of HIV-infected Young Adults in Care in the United States
 Clinical and Behavioral Characteristics of HIV-infected Young Adults in Care in the United States Linda Beer, PhD, Christine L. Mattson, PhD, Joseph Prejean, PhD, and Luke Shouse, MD 10 th International
2014 County of Marin Fact Sheet: HIV/AIDS in Marin County
 2014 County of Marin Fact Sheet: HIV/AIDS in Marin County HIV/AIDS epidemiology data is from the enhanced HIV/AIDS Reporting System (ehars) maintained by the Office of AIDS. The data presented here are
Ensure access to and compliance with treatment for low-income uninsured Virginia residents living with HIV/AIDS
 Public Health/ CHSB Lilibeth Grandas x1211 Sharron Martin x1239 Program Purpose Program Information Ensure access to and compliance with treatment for low-income uninsured Virginia residents living with
FY Summary Report of the San Francisco Eligible Metropolitan Area. Quality Management Performance Measures
 San Francisco Department of Public Health HIV Health Services FY 14-15 Summary Report of the San Francisco Eligible Metropolitan Area Health Resource Service Administration s HIV/AIDS Bureau's Quality
2016 Houston HIV Care Services Needs Assessment: Profile of the Recently Released
 2016 Houston HIV Care Services Needs Assessment: Profile of the Recently Released Page 1 PROFILE OF THE RECENTLY RELEASED The Texas Department of Criminal Justice (TDCJ) estimates that 386 people living
Table of Contents. 2 P a g e. Susan G. Komen
 NEW HAMPSHIRE Table of Contents Table of Contents... 2 Introduction... 3 About... 3 Susan G. Komen Affiliate Network... 3 Purpose of the State Community Profile Report... 4 Quantitative Data: Measuring
Estimate of the Number of Persons Living with HIV in Massachusetts
 Estimate of the Number of Persons Living with HIV in Massachusetts Christian Hague, MPH Supervisor, HIV Surveillance Massachusetts Department of Public Health 2016 NATIONAL RYAN WHITE CONFERENCE ON HIV
HIV/AIDS EPIDEMIOLOGY. Rachel Rivera, MD Assistant Professor Infectious Diseases UT Southwestern Medical Center November 14, 2014
 HIV/AIDS EPIDEMIOLOGY Rachel Rivera, MD Assistant Professor Infectious Diseases UT Southwestern Medical Center November 14, 2014 HOUSEKEEPING ANNOUNCEMENTS AUDIO Can you hear us? You will be accessing
New SASI Analysis: In the Deep South, Significant Percentages of People Most Impacted by HIV Live Outside Large Urban Areas
 New SASI Analysis: In the Deep South, Significant Percentages of People Most Impacted by HIV Live Outside Large s Demonstrating a Need for Increased Federal Resources December 2018 http://southernaidsstrategy.org
Walworth County Health Data Report. A summary of secondary data sources
 Walworth County Health Data Report A summary of secondary data sources 2016 This report was prepared by the Design, Analysis, and Evaluation team at the Center for Urban Population Health. Carrie Stehman,
Improving Chicago's HIV Care Cascade:
 Improving Chicago's HIV Care Cascade: Year 1: Scaling up routine HIV testing Year 2: Exploring new uses for HIV surveillance data Chicago Site Project Summary November 19 th, 2012 Ron Lubelchek, MD Associate
WASHINGTON STATE COMPARISONS TO: KITSAP COUNTY CORE PUBLIC HEALTH INDICATORS May 2015
 WASHINGTON STATE COMPARISONS TO: KITSAP COUNTY CORE PUBLIC HEALTH INDICATORS This is a companion document to the Core Public Health Indicators that provides a comparison of to Washington State for the
National HIV/AIDS Strategy
 National HIV/AIDS Strategy WHERE CAN YOU FIT INTO THIS? ANNA KINDER, M.S.OTR/L Definition THE NATIONAL HIV/AIDS STRATEGY IS A FIVE-YEAR PLAN THAT DETAILS PRINCIPLES, PRIORITIES, AND ACTIONS TO GUIDE OUR
Integrating HIV Care into Primary Care Settings: Two paths to improving the HIV continuum
 Integrating HIV Care into Primary Care Settings: Two paths to improving the HIV continuum Christopher M. Bositis, MD, AAHIVS Donna Rivera, MSW Sandra Silva Greater Lawrence Family Health Center Lawrence,
Ensure access to and compliance with treatment for low-income uninsured Virginia residents living with HIV/AIDS
 Public Health/ CHSB Lilibeth Grandas x1211 Sharron Martin x1239 Program Purpose Program Information Ensure access to and compliance with treatment for low-income uninsured Virginia residents living with
2014 TUBERCULOSIS FACT SHEET A Profile of Mecklenburg County Reported Cases
 OVERVIEW T uberculosis (TB) is a disease caused by bacteria called Mycobacterium tuberculosis. TB usually affects the lungs, but it can also affect other parts of the body. TB is spread through the air
Epidemiologic Trends in HIV in Illinois. Prepared by Cheryl Ward for the 24 th Annual Illinois HIV/STD Conference
 Epidemiologic Trends in HIV in Illinois Prepared by Cheryl Ward for the 24 th Annual Illinois HIV/STD Conference October 28, 2015 Learning Objectives To describe epidemiologic trends in HIV/AIDS in Illinois
Linkage of hepatitis and HIV surveillance systems to improve completeness of injection drug use risk data for co-infected Floridians
 Linkage of hepatitis and HIV surveillance systems to improve completeness of injection drug use risk data for co-infected Floridians Shana Geary, MPH, CPH United States Conference on AIDS September 7,
Characteristics of Transgender Women Living with HIV Receiving Medical Care in the United States
 LGBT Health Volume 2, Number 00, 2015 ª Mary Ann Liebert, Inc. DOI: 10.1089/lgbt.2014.0099 ORIGINAL ARTICLE Characteristics of Transgender Women Living with HIV Receiving Medical Care in the United States
Strengthening Linkages: why & how to connect our dots
 Strengthening Linkages: why & how to connect our dots Sophy S. Wong, MD Medical Director, Bay Area & North Coast AETC Associate Clinical Professor of Medicine, UCSF Workshop objectives Why linkage matters
High Impact Prevention: Science, Practice, and the Future of HIV
 High Impact Prevention: Science, Practice, and the Future of HIV Jonathan Mermin, MD, MPH National Center for HIV/AIDS, Viral Hepatitis, STD, and TB Prevention Centers for Disease Control and Prevention
As you get settled. Downloading the pollev app and signing up for surveys as a participant. OR Texting SURVEYS to
 Get ready to participate in interactive polling by: Pointing your web browser to pollev.com/surveys As you get settled OR Texting SURVEYS to +17474443548 Downloading the pollev app and signing up for surveys
This slide set was produced by the Alameda County Public Health Department
 This slide set was produced by the Alameda County Public Health Department Community Assessment Planning an Evaluation (CAPE) Unit. One way that we work to achieve the ACPHD mission and vision is to monitor
Miami-Dade County HIV/AIDS Epidemiological Data. July 8, 2010
 Miami-Dade County HIV/AIDS Epidemiological Data July 8, 21 Data provided by the Florida Department of Health HIV/AIDS Surveillance Program Prepared by Behavioral Science Research EPI DATA HELPS US Fulfill
The following three slides provide a brief overview of the demographics characteristics of residents of Alameda County. For additional demographic
 This slide set was produced by the Alameda County Public Health Department (ACPHD) Community Assessment, Planning, and Evaluation (CAPE) Unit. One way that we work to achieve the ACPHD mission is to monitor
i EVALUATING THE EFFECTIVENESS OF THE TAKE CONTROL PHILLY CONDOM MAILING DISTRIBUTION PROGRAM by Alexis Adams June 2014
 i EVALUATING THE EFFECTIVENESS OF THE TAKE CONTROL PHILLY CONDOM MAILING DISTRIBUTION PROGRAM by Alexis Adams June 2014 A Community Based Master s Project presented to the faculty of Drexel University
HIV/AIDS Bureau Update
 HIV/AIDS Bureau Update Ryan White HIV/AIDS Program Clinical Conference New Orleans, LA December 15, 2015 Laura Cheever, MD, ScM Associate Administrator Department of Health and Human Services Health Resources
Table of Contents. 2 P age. Susan G. Komen
 NEVADA Table of Contents Table of Contents... 2 Introduction... 3 About... 3 Susan G. Komen Affiliate Network... 3 Purpose of the State Community Profile Report... 4 Quantitative Data: Measuring Breast
Measuring Equitable Care to Support Quality Improvement
 Measuring Equitable Care to Support Quality Improvement Berny Gould RN, MNA Sr. Director, Quality, Hospital Oversight, and Equitable Care Prepared by: Sharon Takeda Platt, PhD Center for Healthcare Analytics
Quantitative Data: Measuring Breast Cancer Impact in Local Communities
 Quantitative Data: Measuring Breast Cancer Impact in Local Communities Quantitative Data Report Introduction The purpose of the quantitative data report for the Southwest Florida Affiliate of Susan G.
Zero HIV infections Zero HIV deaths Zero HIV stigma. Stephanie Cohen, MD, MPH on behalf of the Getting to Zero Consortium
 Zero HIV infections Zero HIV deaths Zero HIV stigma Stephanie Cohen, MD, MPH on behalf of the Getting to Zero Consortium Number of New HIV Diagnoses Overall decline in new HIV diagnoses and death in San
Sentinel Events: AIDS Mortality. HIV-Related vs. Not HIV-Related death as categorized in HIV surveillance
 Sentinel Events: AIDS Mortality HIV-Related vs. Not HIV-Related death as categorized in HIV surveillance March 20, 2017 Outline Based on NYC DOHMH Reverse Continuum Work (Braunstein et al.) Difference
Table of Contents. 2 P age. Susan G. Komen
 WYOMING Table of Contents Table of Contents... 2 Introduction... 3 About... 3 Susan G. Komen Affiliate Network... 3 Purpose of the State Community Profile Report... 4 Quantitative Data: Measuring Breast
Wellness County Profile ROGERS
 Wellness County Profile 2018 ROGERS OKLAHOMA MAPS This image cannot currently be displayed. ROGERS Insurance Coverage Population 91,766 Unemployment Rate (2013-2015) High School Dropouts: Class
Wellness County Profile STEPHENS
 Wellness County Profile 2018 STEPHENS OKLAHOMA MAPS STEPHENS Insurance Coverage Population 44,090 Unemployment Rate (2013-2015) High School Dropouts: Class of 16 Uninsured Insured 15.9% Stephens
Wellness County Profile JOHNSTON
 Wellness County Profile 2018 JOHNSTON OKLAHOMA MAPS JOHNSTON Insurance Coverage Population 11,087 Unemployment Rate (2013-2015) High School Dropouts: Class of 16 Uninsured Insured 19.1% Johnston
Wellness County Profile CRAIG
 Wellness County Profile 2018 CRAIG OKLAHOMA MAPS CRAIG Insurance Coverage Population 14,625 Unemployment Rate (2013-2015) High School Dropouts: Class of 16 Uninsured Insured 18.1% Craig 5.6
Wellness County Profile GARFIELD
 Wellness County Profile 2018 GARFIELD OKLAHOMA MAPS GARFIELD Insurance Coverage Population 62,603 Unemployment Rate (2013-2015) High School Dropouts: Class of 16 Uninsured Insured 16.5% Garfield
2016 NYS HIV Quality of Care Review
 2016 NYS HIV Quality of Care Review A new way forward in four parts Bruce Agins, MD, MPH Medical Director NYSDOH AIDS Institute December 15, 2016 Ending the Epidemic: update! A 3-Point plan announced by
Wellness County Profile GARVIN
 Wellness County Profile 2018 GARVIN OKLAHOMA MAPS GARVIN Insurance Coverage Population 27,838 Unemployment Rate (2013-2015) High School Dropouts: Class of 16 Uninsured Insured 16.7% Garvin
Data Systems Across the Continuum Locating out of Care (LOOC) David Heal M.S.W. Washington State Department of Health July 30, 2015
 David Heal M.S.W. Washington State Department of Health July 30, 2015") Data Systems Across the Continuum Locating out of Care (LOOC) David Heal M.S.W. Washington State Department of Health July 30, 2015 Goals for Data to Care in WA Improve accuracy of surveillance data--washington
Data Systems Across the Continuum Locating out of Care (LOOC) David Heal M.S.W. Washington State Department of Health July 30, 2015 Goals for Data to Care in WA Improve accuracy of surveillance data--washington
Wellness County Profile BECKHAM
 Wellness County Profile 2018 BECKHAM OKLAHOMA MAPS BECKHAM Insurance Coverage Population 22,519 Unemployment Rate (2013-2015) High School Dropouts: Class of 16 Uninsured Insured 15.2% Beckham
Wellness County Profile SEMINOLE
 Wellness County Profile 2018 SEMINOLE OKLAHOMA MAPS SEMINOLE Insurance Coverage Population 25,207 Unemployment Rate (2013-2015) High School Dropouts: Class of 16 Uninsured Insured 18.9% Seminole
Wellness County Profile SEQUOYAH
 Wellness County Profile 2018 SEQUOYAH OKLAHOMA MAPS SEQUOYAH Insurance Coverage Population 41,294 Unemployment Rate (2013-2015) High School Dropouts: Class of 16 Uninsured Insured 18.1% Sequoyah
Wellness County Profile PAYNE
 Wellness County Profile 2018 PAYNE OKLAHOMA MAPS PAYNE Insurance Coverage Population 81,131 Unemployment Rate (2013-2015) High School Dropouts: Class of 16 Uninsured Insured 15.6% Payne 3.9
Implementation of testing (and other interventions along the Continuum of Care)
") Implementation of testing (and other interventions along the Continuum of Care) Jonathan Mermin, MD, MPH National Center for HIV/AIDS, Viral Hepatitis, STD, and TB Prevention U.S. Centers for Disease Control
Implementation of testing (and other interventions along the Continuum of Care) Jonathan Mermin, MD, MPH National Center for HIV/AIDS, Viral Hepatitis, STD, and TB Prevention U.S. Centers for Disease Control
CASINO REVENUE AND AMERICAN INDIAN HEALTH
 CASINO REVENUE AND AMERICAN INDIAN HEALTH The Link Between Tribal Gaming and the Health Status and Behaviors of American Indians Barbara Wolfe Jessica Jakubowski Robert Haveman Hannah Goble Marissa Courey
Child & Adolescent Mental Health Services Databook, FY08-09
 Clients Receiving County- Unique clients funded Mental Health Services 17,779 ANASAZI CLIENTS, Q2-4 ONLY 15,179 Age Unique clients % Living Arrangement* Unique clients % Age 0 to 5 1,907 10.7% House or
Wellness County Profile MCCLAIN
 Wellness County Profile 2018 MCCLAIN OKLAHOMA MAPS McCLAIN Insurance Coverage Population 38,682 Unemployment Rate (2013-2015) High School Dropouts: Class of 16 Uninsured Insured 15.3% McClain
Missouri Statewide Integrated HIV Prevention and Care Plan, including the Statewide Coordinated Statement of Need, CY
 Missouri Statewide Integrated HIV Prevention and Care Plan, including the Statewide Coordinated Statement of Need, CY 2017-2021 September 20, 2016 Developed through the collaborative efforts of the following