Bezzi et al., Supplementary Figure 1 *** Nature Medicine: doi: /nm Pten pc-/- ;Zbtb7a pc-/- Pten pc-/- ;Pml pc-/- Pten pc-/- ;Trp53 pc-/-
|
|
|
- Stephany Ray
- 6 years ago
- Views:
Transcription

![5 Pten pc-/- n=4 n=3 n=3 n=3 n=4 n=4 n=3 n=3 n=3 n=5 n=4 n=3 n=3 n=3 n=4 n=4 n=3 n=3 n=3 n=2 controls T cells 3 months Tumor Pten pc-/- ** * *** * pc-/- n=6 n=3 n=4 n=5 n=4 T cells [%] 3 2 1](/docs-images/77/76673295/images/1-1.jpg "controls B cells [%] 2 15 1 5 Pten pc-/- controls B cells [%] B cells 3 months Tumor Pten pc-/- n=6 n=3 n=4 n=5 n=4 6 4 2 controls Pten pc-/- Macrophages [%] 4 3 2 1 4 2 controls Pten pc-/- SSC")
1 Gr-1 Gr-1 Gr-1 Bezzi et al., Supplementary Figure 1 a Gr1-CD11b 3 months Spleen T cells 3 months Spleen B cells 3 months Spleen Macrophages 3 months Spleen c CD11b+/Gr1+ cells [%] 1 5 b T cells [%] controls Pten pc-/- n=4 n=3 n=3 n=3 n=4 n=4 n=3 n=3 n=3 n=5 n=4 n=3 n=3 n=3 n=4 n=4 n=3 n=3 n=3 n=2 controls T cells 3 months Tumor Pten pc-/- ** * *** * pc-/- n=6 n=3 n=4 n=5 n=4 T cells [%] controls B cells [%] Pten pc-/- controls B cells [%] B cells 3 months Tumor Pten pc-/- n=6 n=3 n=4 n=5 n= controls Pten pc-/- Macrophages [%] controls Pten pc-/- SSC FSC FSC Gr-1 Macrophages [%] Macrophages 3 months Tumor controls Pten pc-/- n=4 n=3 n=5 n=5 n=4 FSC DAPI CD45.2 CD11b d CD11b CD11b CD11b 1 Nature Medicine: doi:1.138/nm.4463
2 Supplementary Figure 1. Infiltration of the immune cells in spleen and the prostate tissue of respective mouse models at 3 months of age. (a) Percentage of Gr- 1+/CD11b+ cells, T cells (CD3+), B cells (CD19+/B22+) and macrophages (CD11b+/F4/8+) in spleen of control mice and respective prostate tumor models at 3 months of age. (b) Percentage of T cells (CD3+), B cells (CD19+/B22+) and macrophages (CD11b+/F4/8+) in the tumor of control mice and respective prostate tumor models at 3 months of age. The number of mice analyzed for (a) and (b) is indicated in the figure. All data in (a) and (b) are represented as mean ± SEM. Values of p<.5 were considered statistically significant. *P<.5; **P<.1; ***P<.1 by twotailed unpaired Student s t-test. (c) Gating strategy used for our immune landscape analysis. (d) Gating strategy for Gr-1+/CD11b+ cells. Representative flow cytometry blots of Gr-1+/CD11b+ cells in the prostate, and mice at 3 months of age. 2 Nature Medicine: doi:1.138/nm.4463

3 F4/8 CD4 FoxP3 CD44 Bezzi et al., Supplementary Figure 2 a Gr1-CD11b 6 months Spleen T cells 6 months Spleen B cells 6 months Spleen Macrophages 6 months Spleen CD11b+/Gr1+ cells [%] T cells [%] B cells [%] Macrophages [%] n=3 n=3 n=3 n=3 n=3 n=3 n=3 n=3 n=3 n=3 n=3 n=3 b CD11b+/Gr1+ cells [%] Gr1-CD11b 6 months Tumor T-cells 6 months Tumor ** p =.22 * p =.488 * p = * p =.228 T cells [%] B cells [%] B-cells 6 months Tumor Macrophages [%] Macrophages 6 months Tumor * p =.434 * p = n=4 n=5 n=3 n=4 n=5 n=3 n=4 n=3 n=3 n=4 n=4 n=3 c d e f DAPI negative, CD11b+ cells DAPI negative, CD3+ cells DAPI negative, CD45+ cells DAPI negative, CD8+ cells CD26 CD8 CD4 CD62L CD26+ of F4/8 cells (%) Ptenpc-/-; Trp53pc-/- % of CD3 + cells CD4+ CD3 cells CD8+ CD3 cells 3 FoxP3+ of CD45+ CD4+ cells (%) Ptenpc-/-; Trp53pc-/- CD44+ CD62L - of CD8+ cells (%) Ptenpc-/-; Trp53pc-/- Nature Medicine: doi:1.138/nm.4463
4 Supplementary Figure 2. Infiltration of the immune cells in spleen and the prostate tissue of respective mouse models at 6 months of age. (a) Percentage of Gr- 1+/CD11b+ cells, T cells (CD3+), B cells (CD19+/B22+) and macrophages (CD11b+/F4/8+) in spleen of prostate tumor models at 6 months of age. (b) Percentage of Gr-1+/CD11b+ cells, T cells (CD3+), B cells (CD19+/B22+) and macrophages (CD11b+/F4/8+) in the tumor of prostate cancer models at 6 months of age. The number of mice analyzed for (a) and (b) is indicated in the figure. (c,d,e,f) Representative flow cytometry blots (upper panel) and quantification of the indicated cell populations (lower panel) isolated from the prostate tumor of 6 months old Pten pc-/- ; mice (n=3). All data are represented as mean ± SEM. Values of p<.5 were considered statistically significant. *P<.5; **P<.1; ***P<.1 by two-tailed unpaired Student s t-test. Nature Medicine: doi:1.138/nm

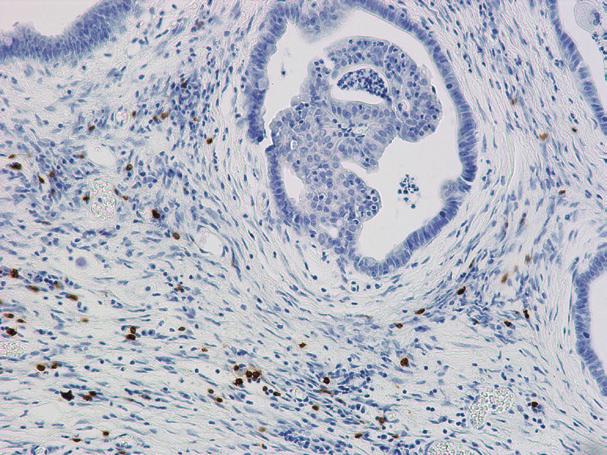
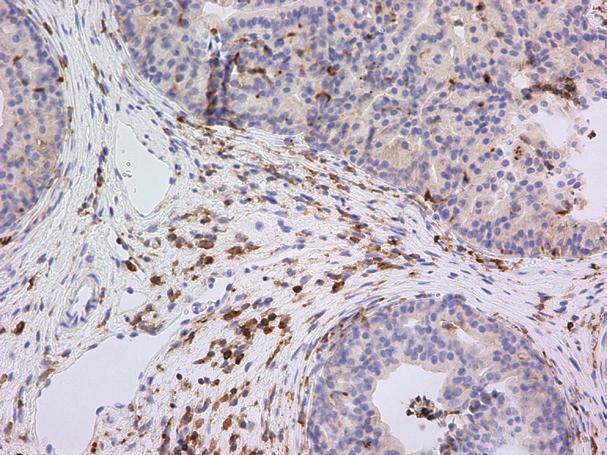
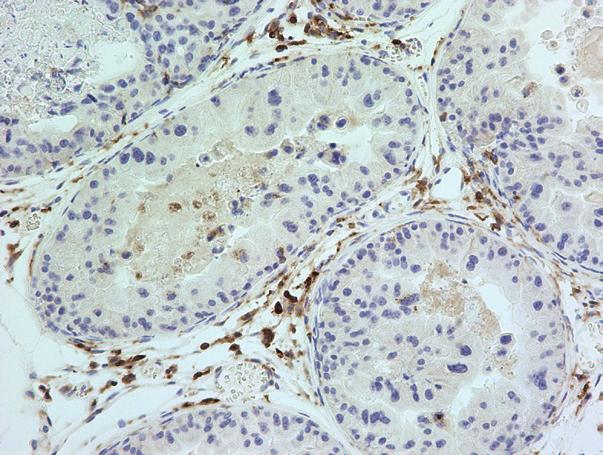
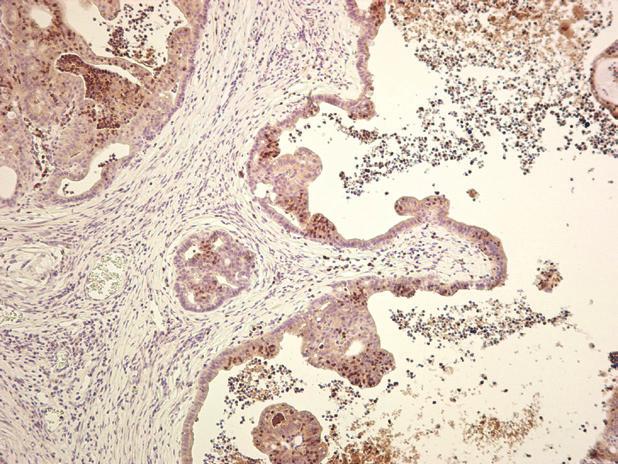
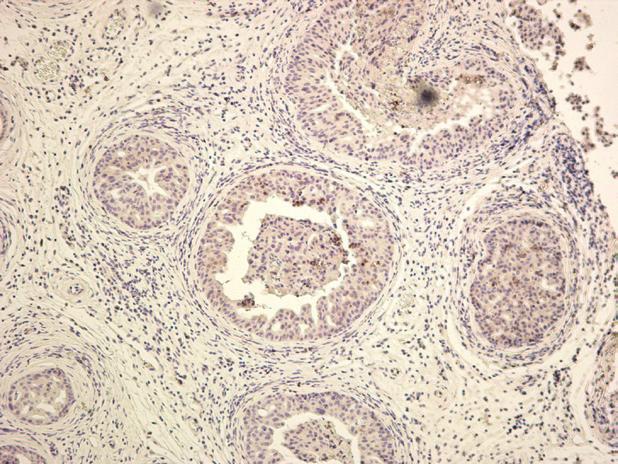
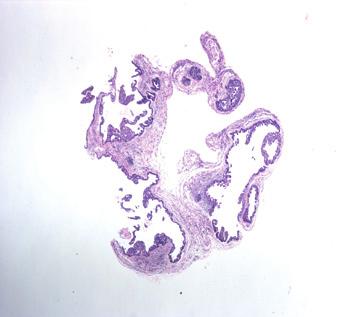
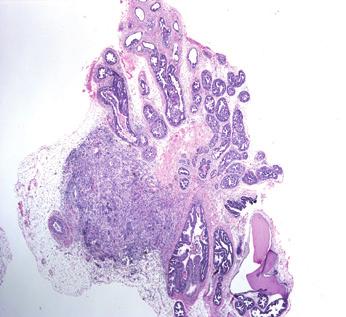
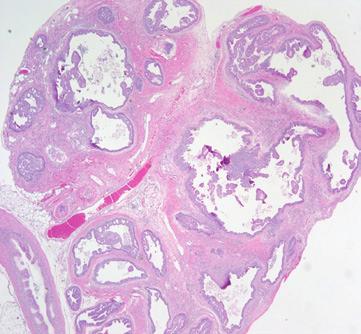
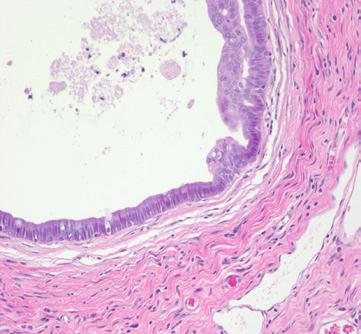
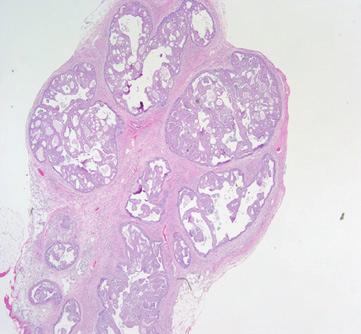
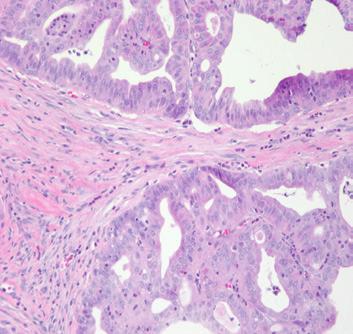
5 Bezzi et al., Supplementary Figure 3 Ptenpc-/-;Zbtb7apc-/- Ptenpc-/-;Trp53pc-/- Ptenpc-/-;Zbtb7apc-/- Ptenpc-/-;Trp53pc-/- IHC:Ly6G a IHC: CD3 IHC: CD45R (B22) b 5 Nature Medicine: doi:1.138/nm.4463
6 Supplementary Figure 3. Localization of immune cells in prostate tumor tissues. (a) IHC of the Ly6G epitope in and prostate tumors (anterior prostate lobes, at 3 month of age) shows that Ly6G+ cells are mainly localized in the lumen of prostate glands and are in close proximity to cancer cells (black arrows). Scale bars,.5 mm. (b) IHC of the CD45R (B22) and CD3 epitope in Pten pc-/- ; and prostate tumors at 3 months of age (anterior prostate lobes) shows that B cells and T cells are mainly localized in the stroma of prostate tumor tissue. Scale bars,.5 mm. Similar stainings have been observed in two mice for each genotype. Nature Medicine: doi:1.138/nm
![Bezzi et al., Supplementary Figure 4 a S1A8 b S1A9 IL1b S1A8 expression [AU] 1 8 6 4 2 expression [AU] 4 3 2 1 **p =.](/docs-images/77/76673295/images/7-0.jpg "28 expression [AU] 8 6 4 2 *p =.")
![458 expression [AU] 3 2 1 Peripheral Blood Intra-tumoral Pten pc-/- c S1A9 IL1b S1A8 6 *p =.347 8 ***p =.](/docs-images/77/76673295/images/7-1.jpg "2 3 expression [AU] 4 2 expression [AU] 6 4 2 expression [AU] 2 1 CD11b+Gr1+ Tumor (CD45-/CD49f+) CD11b+Gr1+ Tumor")

7 Bezzi et al., Supplementary Figure 4 a S1A8 b S1A9 IL1b S1A8 expression [AU] expression [AU] **p =.28 expression [AU] *p =.458 expression [AU] Peripheral Blood Intra-tumoral Pten pc-/- c S1A9 IL1b S1A8 6 *p = ***p =.2 3 expression [AU] 4 2 expression [AU] expression [AU] 2 1 CD11b+Gr1+ Tumor (CD45-/CD49f+) CD11b+Gr1+ Tumor (CD45-/CD49f+) CD11b+Gr1+ Tumor (CD45-/CD49f+) d 25K 25K 2K 2K SSC-A 15K FSC-A 15K 1K 53 1K 5K 5K SSC 5K 1K 15K 2K 25K FSC-A FSC FSC <Pacific Blue-A> DAPI 25K FSC-A 2K 15K 1K <PE-A> FSC 3.6 5K CD11b <PE-Cy7-A> Ly6C Ly6G <APC-Cy7-A> 7 Nature Medicine: doi:1.138/nm.4463
8 Supplementary Figure 4. Gr-1+/CD11b+ cells show a differential tumor promotive activity in and tumors. (a) Expression analysis of sorted Gr-1+/CD11b+ cells from Pten pc-/- (n=2), (n=2) and Pten pc-/- ; (n=2) tumors shows a specific upregulation of S1A8 in granulocytes from tumors. Data are represented as mean ± SEM. (b) Expression analysis of sorted Gr-1+/CD11b+ cells from peripheral blood (blood) (n=4) or Pten pc-/- ; tumors shows increase in expression of S1a9 (n=3), S1a8 (n=3) and Il1b (n=4) in granulocytes from the primary tumor site. (c) Expression analysis of sorted CD11b+/Gr1+ cells and tumor cells (CD45-/CD49f+) from tumors (n=3) shows specific expressions of S1a9, Il1b and S1a8 in Gr-1+/CD11b+ cells. All data are represented as mean ± SEM. Values of p<.5 were considered statistically significant. *P<.5; **P<.1; ***P<.1 by two-tailed unpaired Student s t-test. (d) Gating strategy for positivity of the Ly6G and Ly6C epitopes. Nature Medicine: doi:1.138/nm
9 Bezzi et al., Supplementary Figure 5 a 1 8 log FC Cxcl1 Cxcl2 Cxcl5 Cxcl1 Cxcl13 Cxcl14 Cxcl15 Cxcl16 Cxcl17 Pten pc-/- log FC 4 2 b Ccl2 Ccl6 Ccl12 Ccl7 Ccl8 Ccl9 Ccl2 Ccl28 Pten pc-/- Gene Symbol LogFC 1 Spink Reg3b Reg Reg3b Mia Muc Clca H Onecut Cxcl Onecut Krt Car Onecut F13Rik d c CXCL5 mrna expression expression [AU] CXCL5 **p =.22 Gr-1+/CD11b+ tumor cells (CD45-/CD49f+) ***p =.4 *p =.1 control Nature Medicine: doi:1.138/nm.4463
10 Supplementary Figure 5. CXCL5 expression is upregulated in tumors. (a) Expression analysis of chemokines from the CXC and CC family using microarray data obtained from prostate tumors (anterior lobes) from 3 months old Pten pc- /- and mice. (b) Gene rank list of upregulated genes in Pten pc-/- ; vs Pten pc-/- mice at 3 months measured by microarray. (c) Expression analysis of sorted intratumoral CD11b+/Gr1+ cells (n=2) and tumor cells (CD45- /CD49f+) (n=3) from tumors shows specific expressions of CXCL5 in tumor cells. (d) Expression analysis of CXCL5 in the prostate tissues of control (n=3), (n=3) mice and in prostate tumor tissue (anterior lobes) from Zbtb7a pc- /- (n=3) mice at 3 months of age by qrt-pcr. All data in (c) and (d) are represented as mean ± SEM. Values of p<.5 were considered statistically significant. *P<.5; **P<.1; ***P<.1 by two-tailed unpaired Student s t-test. Nature Medicine: doi:1.138/nm
11 Ly6C Ly6C Bezzi et al., Supplementary Figure 6 a 6 Bone Marrow (BM) Cells Control % of live cells 4 2 GM-CSF + IL6 GM-CSF + IL6 +CXCL5 GM-CSF + IL6 +CXCL17 Ly6G + Ly6C + Ly6G - Ly6C + b Bone Marrow (BM) Cells Gr1+ cells isolated from BM Relative Expression level (qpcr) Arg1 inos S1A8 S1A9 GM-CSF + IL6 GM-CSF + IL6 +CXCL5 GM-CSF + IL6 +CXCL17 IL1b IL1 CD4 Relative Expression level (qpcr) Arg1 inos S1A8 S1A9 GM-CSF + IL6 GM-CSF + IL6 +CXCL5 GM-CSF + IL6 +CXCL17 IL1b IL1 CD4 c Gr1+ cells isoleated from BM DAPI neg, CD11b+ gating Monocytes isolated from BM DAPI neg, CD11b+ gating Ly6G Ly6G 11 Nature Medicine: doi:1.138/nm.4463
12 Supplementary Figure 6. CXCL5 and CXCL17 are not major determinants of immature myeloid cell phenotype. (a) Ly6G+/Ly6C+ and Ly6G-/Ly6C+ flow analysis of BM cells culture for 4 days in GM-CSF, IL-6 supplemented medium plus either recombinant CXCL5 or recombinant CXCL17 (n=2 cell culture replicates). (b) qrt-pcr gene expression analysis of BM and Gr1+ cells from experiment in Supp. Fig. 6a and Fig.4a. Data are represented as mean of 3 cell culture replicates ± SEM. Values of p<.5 were considered statistically significant. *P<.5; **P<.1; ***P<.1 by twotailed unpaired Student s t-test. (c) Representative flow cytometry blots of Gr1+ cells and monocytes isolated from the bone marrow of healthy mice. Nature Medicine: doi:1.138/nm

13 Bezzi et al., Supplementary Figure 7 a IgG Pten pc-/-; 1A8 (3 ug) H&E b CXCR2i Vehicle Pten pc-/-; Pten pc-/-; Vehicle c Foxp3+ cells (%) **p = Vehicle CXCR2i 13 Nature Medicine: doi:1.138/nm.4463 CXCR2i
14 Supplementary Figure 7. Depletion of Gr-1+/CD11b+ cells decreases tumor burden in and mice. (a) mice (4 months of age) were treated with Ly6G-depletion antibody or control IgG antibody every other day for 1 days by intraperitoneal injection (3 ug/mouse) and tumor tissue was subjected to histological analysis. Black arrows show regions of reduced tumor burden. Scale bars,.2 mm. (b) Histological Analysis of and Trp53 pc- /- tumors (anterior prostate lobes) treated with Vehicle or SB2252 (CXCR2i) shows reduced tumor burden after CXCR2 inhibition (black arrows). Scale bars,.2 mm. (c) Flow cytometry analysis of prostate tumors after treatment with SB2252 (CXCR2i) (n=5) and vehicle (n=4) every day for 1 days by intraperitoneal injection. Data are represented as mean ± SEM. Values of p<.5 were considered statistically significant. *P<.5; **P<.1; ***P<.1 by two-tailed unpaired Student s t- test. Nature Medicine: doi:1.138/nm
![Bezzi et al., Supplementary Figure 8 a b pirak4 IKBalpha 3 *p=.392 **p=.96 1.5 *p =.15 ***p =.2 c normalized value [AU] 2 1.](/docs-images/77/76673295/images/15-0.jpg "8 Pten pc-/- IKBalpha normalized value [AU] d Pten pc-/- CXCL5 *p =.111 *p=.298 1..5. normalized value [AU].6.4.2 expression [AU] 1..5. Vehicle CXCR2i.")
15 Bezzi et al., Supplementary Figure 8 a b pirak4 IKBalpha 3 *p=.392 **p= *p =.15 ***p =.2 c normalized value [AU] Pten pc-/- IKBalpha normalized value [AU] d Pten pc-/- CXCL5 *p =.111 *p= normalized value [AU] expression [AU] Vehicle CXCR2i. vehicle CXCR2i 15 Nature Medicine: doi:1.138/nm.4463
16 Supplementary Figure 8. NFkB pathway is markedly activated through Gr- 1+/CD11b+ cells in tumors. (a) Gene Set Enrichment Analysis for NFkB targets using microarray data obtained from tumors derived from 3 month old Pten pc-/- and mice. (b) Protein level of pirak4 (normalized with total IRAK4) and IkBa (normalized with b-actin) in the prostate tumors of 3 month old Pten pc-/-,, and mice (n=3 for each genotype). (c) Protein level of IkBa (normalized with b-actin) in the prostate tumors treated with vehicle (n=2) or SB2252 (CXCR2i) (n=3) in mice. Full scans of the blots for (b) and (c) are in Supp. Figure 1a-d. (d) Expression of CXCL5 in the prostate tumors treated with vehicle (n=3) or SB2252 (CXCR2i) (n=4) in mice. All data in (b), (c) and (d) are represented as mean ± SEM. Values of p<.5 were considered statistically significant. *P<.5; **P<.1; ***P<.1 by two-tailed unpaired Student s t- test. Nature Medicine: doi:1.138/nm


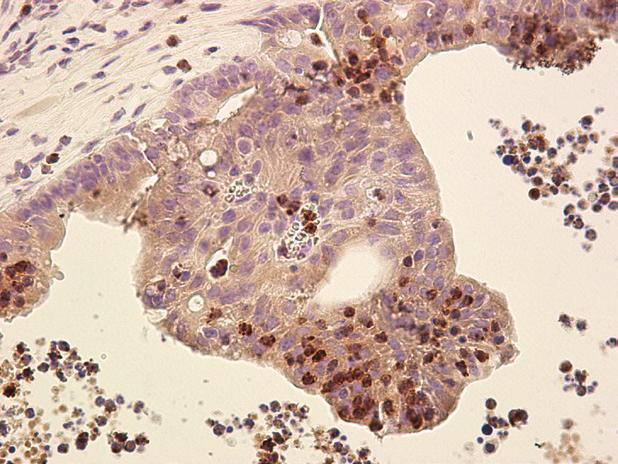
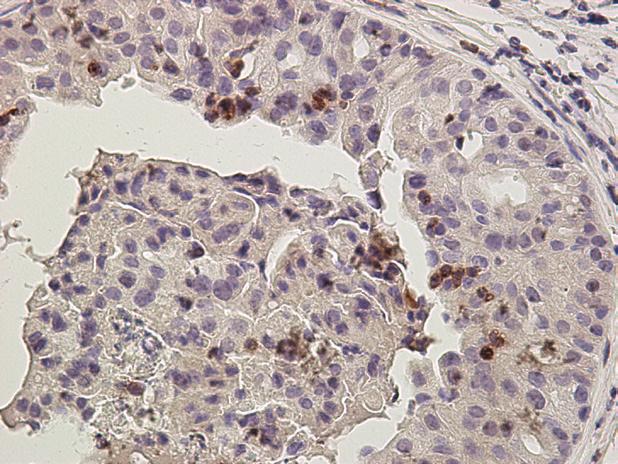
17 Bezzi et al., Supplementary Figure 9 a phospho ERK B-catenin Pten pc-/- b Early stage Later stage 17 Nature Medicine: doi:1.138/nm.4463
18 Supplementary Figure 9. Upregulation of phosho-erk and B-Catenin in Pten pc-/- ; mice. (a) Representative IHC of phospho-erk and b-catenin in Pten pc-/- (n=3) and (n=3) prostate tumors at 3 months of age (anterior prostate lobes). Scale bars,.1 mm. (b) Schematic representation of the three different immune landscapes observed in the, and mice. 18 Nature Medicine: doi:1.138/nm.4463

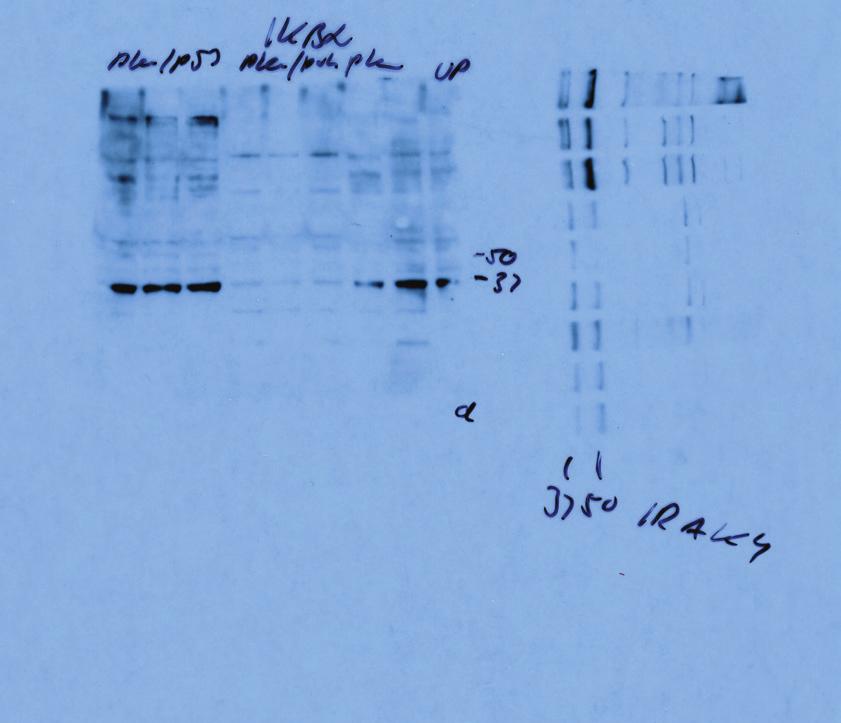
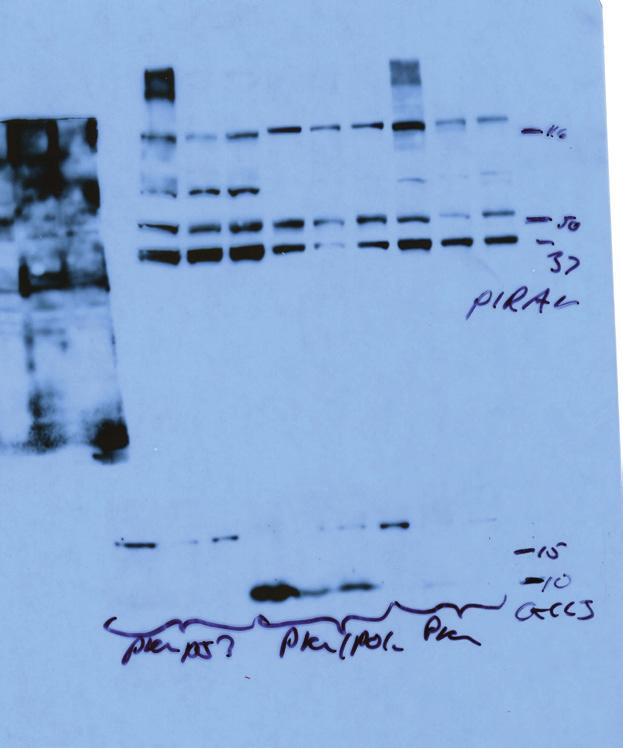
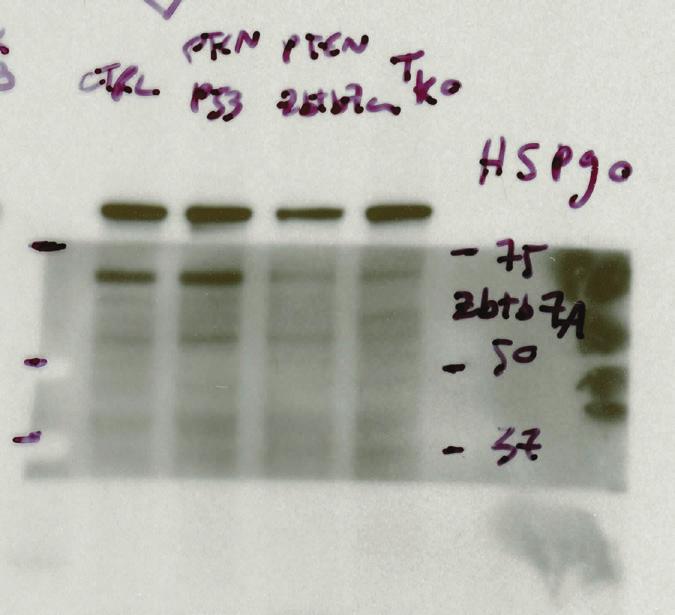
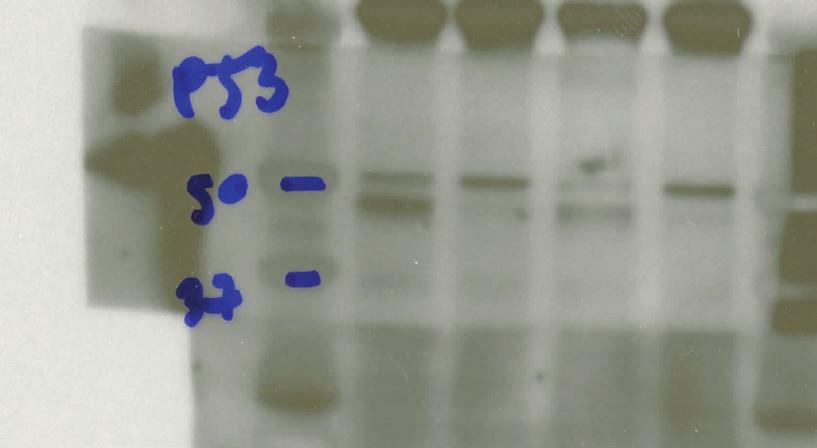
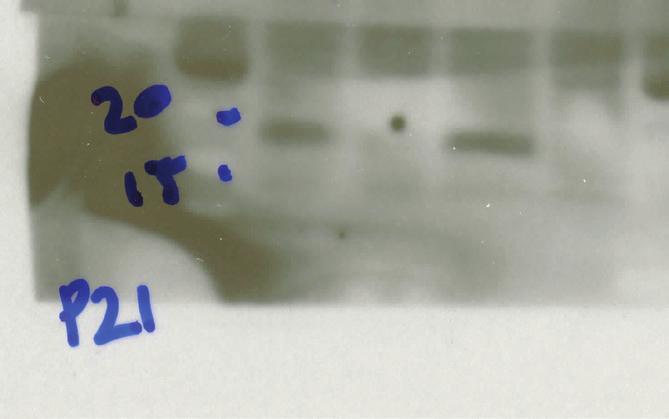
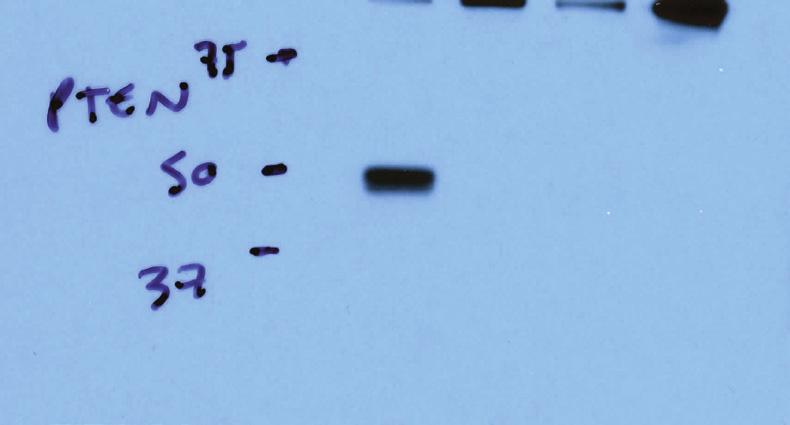
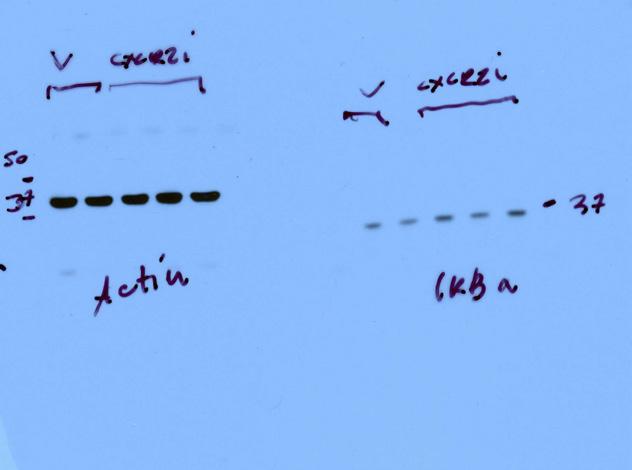
19 Bezzi et al., Supplementary Figure 1 a e b f c g h d 19 Nature Medicine: doi:1.138/nm.4463
20 Supplementary Figure 1. Full scans of all the blots. (a) Actin western blot for Figure 3b and Supp. Figure 8b and c. Protein lysates of prostate tumors were loaded in the following order: n=3, n=3, n=3 Pten pc-/- mice. For Figure 3b, the cropped image was horizontally flipped. (b) Upper blot: pirak4 western blot for Supp. Figure 8b. Lower blot: CXCL5 western blot for Figure 3b. Protein lysates of prostate tumors were loaded as in (a). For Figure 3b, the cropped image was horizontally flipped. (c) Left blot: IKBalpha western blot for Supp. Figure 8b. Right blot: IRAK4 western blot for Supp. Figure 8b. Protein lysates of prostate tumors were loaded as in (a). (d) Actin and IKBalpha western blot for Supp. Figure 8c. Protein lysates of prostate tumors were loaded in the following order: n=2 treated with vehicle, n=3 treated with SB2252 (CXCR2i). (e) Upper blot: HSP9 western blot for Figure 4d. Lower blot: ZBTB7a western blot for Figure 4d. Protein lysates of prostate organoids were loaded in the following order: wild type,, and. (f) Trp53 western blot for Figure 4d. Protein lysates of prostate organoids were loaded as in (d). (g) p21 western blot for Figure 4d. Protein lysates of prostate organoids were loaded as in (d). (h) PTEN western blot for Figure 4d. Protein lysates of prostate organoids were loaded as in (d). Nature Medicine: doi:1.138/nm
21 Supplementary Table 1. Tumor volumes (mm 3 ) of all the experiments in Figure 5. Genotype Treatment Age at baseline MRI (weeks) Baseline Volume Volume 2 weeks treatment Volume 4 weeks treatment Pten-Zbtb7a IgG Pten-Zbtb7a IgG Pten-Zbtb7a IgG Pten-Zbtb7a IgG Pten-Zbtb7a IgG Pten-Zbtb7a IgG Pten-Zbtb7a IgG Pten-Zbtb7a Anti-CXCL Pten-Zbtb7a Anti-CXCL Pten-Zbtb7a Anti-CXCL Pten-Zbtb7a Anti-CXCL Pten-Zbtb7a Anti-CXCL Pten-Zbtb7a Anti-CXCL Pten-Zbtb7a Anti-CXCL Pten-Zbtb7a Anti-CXCL Pten-Zbtb7a Anti-CXCL Genotype Treatment Age at baseline MRI (weeks) Baseline Volume Volume 3 weeks treatment Pten-Trp53 IgG Pten-Trp53 IgG Pten-Trp53 IgG Pten-Trp53 IgG Pten-Trp53 Anti-Gr Pten-Trp53 Anti-Gr Pten-Trp53 Anti-Gr Pten-Trp53 Anti-Gr Nature Medicine: doi:1.138/nm.4463
22 Genotype Treatment Age at baseline MRI (weeks) Baseline Volume Volume 3 weeks treatment Pten-Zbtb7a Vehicle Pten-Zbtb7a Vehicle Pten-Zbtb7a Vehicle Pten-Zbtb7a Vehicle Pten-Zbtb7a CXCR2i Pten-Zbtb7a CXCR2i Pten-Zbtb7a CXCR2i Pten-Zbtb7a CXCR2i Pten-Zbtb7a CXCR2i Pten-Zbtb7a CXCR2i Genotype Treatment Age at baseline MRI (weeks) Baseline Volume Volume 2 weeks treatment Pten-Pml Vehicle Pten-Pml Vehicle Pten-Pml Vehicle Pten-Pml CXCR2i Pten-Pml CXCR2i Pten-Pml CXCR2i Genotype Treatment Age at baseline MRI (weeks) Baseline Volume Volume 2 weeks treatment Pten-Trp53 Vehicle Pten-Trp53 Vehicle Pten-Trp53 Vehicle Pten-Trp53 Vehicle Pten-Trp53 Vehicle Pten-Trp53 CXCR2i Pten-Trp53 CXCR2i Pten-Trp53 CXCR2i Pten-Trp53 CXCR2i Pten-Trp53 CXCR2i Pten-Trp53 CXCR2i Pten-Trp53 CXCR2i Nature Medicine: doi:1.138/nm.4463
23 Supplementary Table 2. Gene signatures used for the analysis in Figure 6. PMN- Signature Mo-MDSC/M2 Macrophages-signature T Cell Signature CXCR4 CD14 CD8A CXCR2 CD124 CCL2 ITGAM CD45 CCL3 ITGAX CD11B CCL4 ANPEP CD33 CXCL9 CD14 ARG1 CXCL1 FUT4 IL1 ICOS CD33 CD4 GZMK CD34 CD32 IRF1 CD38 CD163 HLA-DMA ENTPD1 CD23 HLA-DMB PTPRC CD2R HLADOA CEACAM8 PD-L2 HLA-DOB CD8 CD68 CSF1R CD115 IL4R HLA-DR CSF3 CD25 CSF2 CCR2 CXCL8 CCL2 TNF FOXP3 CXCL12 CSF1R S1A8 S1A9 STAT1 STAT3 STAT5A ARG1 NOS2 CD274 TLR3 TLR4 TGFB1 IL1 IDO1 PDCD1 Nature Medicine: doi:1.138/nm

24 Supplementary Table 3. SNP analysis of 3 mice for each genotype analyzed. Nature Medicine: doi:1.138/nm
25 Supplementary Table 4. Primer sequences targeting mouse genes used for qrt- PCR. Gene Forward Reverse Actin CGTCGACAACGGCTCCGGCA TGGGCCTCGTCACCCACATAGG CCL1 CAGGATGTTGACAGCAAGAG CATCTTTCTGTAACACTGG CCL2 GGCCTGCTGTTCACAGTTG CTGCTGGTGATCCTCTTGTAG CCL3 CTGCAACCAAGTCTTCTCAG GCCGGTTTCTCTTAGTCAGG CCL4 CTTCTGTGCTCCAGGGTTCTC CTGTCTGCCTCTTTTGGTCAG CCL5 GCTGCTTTGCCTACCTCTCC TCGAGTGACAAACACGACTGC CCL7 GCTTTCAGCATCCAAGTGTG GACTACTGGTGATCCTTCTG CCL2 GCCTCTCGTACATACAGACGC CCAGTTCTGCTTTGGATCAGC CCL28 GTGTGTGGCTTTTCAAACCTCA TGCATGAACTCACTCTTTCCAG CXCL1 ACTGCACCCAAACCGAAGTC TGGGGACACCTTTTAGCATCTT CXCL2 CCAACCACCAGGCTACAGG GCGTCACACTCAAGCTCTG CXCL3 GATTTTGAGACCATCCAGAGC CTCTTCAGTATCTTCTTGATG CXCL5 TGCATTCCGCTTAGCTTTCT CAGAAGGAGGTCTGTCTGGA CXCL7 CACTTCATAACCTCCAGATC CACAGTGAACTCCTGGCCTGTAC CXCL9 GGAGTTCGAGGAACCCTAGTG GGGATTTGTAGTGGATCGTGC CXCL1 CCAAGTGCTGCCGTCATTTTC GGCTCGCAGGGATGATTTCAA CXCL12 GTAAACCAGTCAGCCTGAG GCTTTCTCCAGGTACTCTTG CXCL14 GGAAATGAAGCCAAAGTACC GATGAAGCGTTTGGTGCTCTG CXCL15 CAAGGCTGGTCCATGCTCC TGCTATCACTTCCTTTCTGTTGC CXCL16 GGACTGCTTTGAGCGCAAAG CTGAGTGCTCTGACTATGTG CXCL17 AGGTGGCTCTTGGAAGGTG GGTGACATCGTTTGAGAAATTGC IL1beta GAAATGCCACCTTTTGACAGTG TGGATGCTCTCATCAGGACAG S1A9 GCACAGTTGGCAACCTTTATG TGATTGTCCTGGTTTGTGTCC S1A8 AAATCACCATGCCCTCTACAAG CCCACTTTTATCACCATCGCAA Arg1 TTTTTCCAGCAGACCAGCTT AGAGATTATCGGAGCGCCTT inos TTCTGTGCTGTCCCAGTGAG TGAAGAAAACCCCTTGTGCT IL1 ATCGATTTCTCCCCTGTGAA TGTCAAATTCATTCATGGCCT CD4 GTCGGCTTCTTCTCCAATCAG CATCACGACAGGAATGACCAG Nature Medicine: doi:1.138/nm
26 Supplementary Table 5. Primer sequences targeting human genes used for qrt-pcr. Gene name Forward Reverse Actin TGGCACCCAGCACAATGAA CTAAGTCATAGTCCGCCTAGA CXCL5 CTGTTGGTGCTGCTGCTGCTG CGAACACTTGCAGATTACTG CXCL17 TGCTGCCACTAATGCTGATGT CTCAGGAACCAATCTTTGCACT p21 GACCTGTCACTGTCTTGTAC CTTCCTCTTGGAGAAGATCAG Nature Medicine: doi:1.138/nm
Supplementary Figure 1 Chemokine and chemokine receptor expression during muscle regeneration (a) Analysis of CR3CR1 mrna expression by real time-pcr
 Analysis of CR3CR1 mrna expression by real time-pcr") Supplementary Figure 1 Chemokine and chemokine receptor expression during muscle regeneration (a) Analysis of CR3CR1 mrna expression by real time-pcr at day 0, 1, 4, 10 and 21 post- muscle injury. (b)
Supplementary Figure 1 Chemokine and chemokine receptor expression during muscle regeneration (a) Analysis of CR3CR1 mrna expression by real time-pcr at day 0, 1, 4, 10 and 21 post- muscle injury. (b)
Supplementary Figure 1: TSLP receptor skin expression in dcssc. A: Healthy control (HC) skin with TSLP receptor expression in brown (10x
 skin with TSLP receptor expression in brown (10x") Supplementary Figure 1: TSLP receptor skin expression in dcssc. A: Healthy control (HC) skin with TSLP receptor expression in brown (10x magnification). B: Second HC skin stained for TSLP receptor in brown
Supplementary Figure 1: TSLP receptor skin expression in dcssc. A: Healthy control (HC) skin with TSLP receptor expression in brown (10x magnification). B: Second HC skin stained for TSLP receptor in brown
well for 2 h at rt. Each dot represents an individual mouse and bar is the mean ±
 Supplementary data: Control DC Blimp-1 ko DC 8 6 4 2-2 IL-1β p=.5 medium 8 6 4 2 IL-2 Medium p=.16 8 6 4 2 IL-6 medium p=.3 5 4 3 2 1-1 medium IL-1 n.s. 25 2 15 1 5 IL-12(p7) p=.15 5 IFNγ p=.65 4 3 2 1
sequences of a styx mutant reveals a T to A transversion in the donor splice site of intron 5
 sfigure 1 Styx mutant mice recapitulate the phenotype of SHIP -/- mice. (A) Analysis of the genomic sequences of a styx mutant reveals a T to A transversion in the donor splice site of intron 5 (GTAAC
Supplemental Table 1. Primer sequences for transcript analysis
 Supplemental Table 1. Primer sequences for transcript analysis Primer Sequence (5 3 ) Primer Sequence (5 3 ) Mmp2 Forward CCCGTGTGGCCCTC Mmp15 Forward CGGGGCTGGCT Reverse GCTCTCCCGGTTTC Reverse CCTGGTGTGCCTGCTC
SUPPLEMENTARY INFORMATION
 DOI: 1.138/ncb3355 a S1A8 + cells/ total.1.8.6.4.2 b S1A8/?-Actin c % T-cell proliferation 3 25 2 15 1 5 T cells Supplementary Figure 1 Inter-tumoral heterogeneity of MDSC accumulation in mammary tumor
Supplementary Table 1
 Supplementary Table 1 Flow Cytometry Antibodies Antibody Fluorochrome Clone Vendor CD45 PE-cyanine 7 30-F11 D ioscience CD3 Pacific lue 17A2 iolegend (San Diego, CA) CD11b APC M1/70 iolegend (San Diego,
Supplementary Figure 1. Dynamic Response of WT and mir-21 -/- mice to caerulein. (a) Representative histological sections of mouse pancreas stained
 Representative histological sections of mouse pancreas stained") Supplementary Figure 1. Dynamic Response of WT and mir-21 -/- mice to caerulein. (a) Representative histological sections of mouse pancreas stained with hematoxylin from caerulein-treated WT and mir-21
Supplementary Figure 1. Dynamic Response of WT and mir-21 -/- mice to caerulein. (a) Representative histological sections of mouse pancreas stained with hematoxylin from caerulein-treated WT and mir-21
Supplementary information. The proton-sensing G protein-coupled receptor T-cell death-associated gene 8
 1 Supplementary information 2 3 The proton-sensing G protein-coupled receptor T-cell death-associated gene 8 4 (TDAG8) shows cardioprotective effects against myocardial infarction 5 Akiomi Nagasaka 1+,
Supplementary Figures for TSC1 controls macrophage polarization to prevent inflammatory disorder by Linnan Zhu et al
 Supplementary Figures for TSC1 controls macrophage polarization to prevent inflammatory disorder by Linnan Zhu et al Suppl. Fig. 1 Tissue DN C Proteins kd TSC1-17 TSC 1 loxp bp -48-285 ctin PEMs Neutrophils
Targeting tumour associated macrophages in anti-cancer therapies. Annamaria Gal Seminar Series on Drug Discovery Budapest 5 January 2018
 Targeting tumour associated macrophages in anti-cancer therapies Annamaria Gal Seminar Series on Drug Discovery Budapest 5 January 2018 Macrophages: Professional phagocytes of the myeloid lineage APC,
Supplementary. presence of the. (c) mrna expression. Error. in naive or
 mrna expression. Error. in naive or") Figure 1. (a) Naive CD4 + T cells were activated in the presence of the indicated cytokines for 3 days. Enpp2 mrna expression was measured by qrt-pcrhr, infected with (b, c) Naive CD4 + T cells were activated
Figure 1. (a) Naive CD4 + T cells were activated in the presence of the indicated cytokines for 3 days. Enpp2 mrna expression was measured by qrt-pcrhr, infected with (b, c) Naive CD4 + T cells were activated
Supplemental Figure 1. Signature gene expression in in vitro differentiated Th0, Th1, Th2, Th17 and Treg cells. (A) Naïve CD4 + T cells were cultured
 Naïve CD4 + T cells were cultured") Supplemental Figure 1. Signature gene expression in in vitro differentiated Th0, Th1, Th2, Th17 and Treg cells. (A) Naïve CD4 + T cells were cultured under Th0, Th1, Th2, Th17, and Treg conditions. mrna
Supplemental Figure 1. Signature gene expression in in vitro differentiated Th0, Th1, Th2, Th17 and Treg cells. (A) Naïve CD4 + T cells were cultured under Th0, Th1, Th2, Th17, and Treg conditions. mrna
L1 on PyMT tumor cells but Py117 cells are more responsive to IFN-γ. (A) Flow
 Flow") A MHCI B PD-L1 Fold expression 8 6 4 2 Fold expression 3 2 1 No tx 1Gy 2Gy IFN Py117 Py117 Supplementary Figure 1. Radiation and IFN-γ enhance MHCI expression and PD- L1 on PyMT tumor cells but Py117 cells
A MHCI B PD-L1 Fold expression 8 6 4 2 Fold expression 3 2 1 No tx 1Gy 2Gy IFN Py117 Py117 Supplementary Figure 1. Radiation and IFN-γ enhance MHCI expression and PD- L1 on PyMT tumor cells but Py117 cells
Obesity alters the lung myeloid cell landscape to enhance breast cancer metastasis through IL5 and GM-CSF
 A RT I C L E S Obesity alters the lung myeloid cell landscape to enhance breast cancer metastasis through IL and GM-CSF Daniela F. Quail,7, Oakley C. Olson,7, Priya Bhardwaj, Logan A. Walsh, Leila Akkari,,,
Supplementary Figure 1. NAFL enhanced immunity of other vaccines (a) An over-the-counter, hand-held non-ablative fractional laser (NAFL).
 An over-the-counter, hand-held non-ablative fractional laser (NAFL).") Supplementary Figure 1. NAFL enhanced immunity of other vaccines (a) An over-the-counter, hand-held non-ablative fractional laser (NAFL). (b) Depiction of a MTZ array generated by NAFL. (c-e) IgG production
Supplementary Figure 1. NAFL enhanced immunity of other vaccines (a) An over-the-counter, hand-held non-ablative fractional laser (NAFL). (b) Depiction of a MTZ array generated by NAFL. (c-e) IgG production
Nature Immunology: doi: /ni Supplementary Figure 1. Huwe1 has high expression in HSCs and is necessary for quiescence.
 Supplementary Figure 1 Huwe1 has high expression in HSCs and is necessary for quiescence. (a) Heat map visualizing expression of genes with a known function in ubiquitin-mediated proteolysis (KEGG: Ubiquitin
Supplement Material. Spleen weight (mg) LN cells (X106) Acat1-/- Acat1-/- Mouse weight (g)
 LN cells (X106) Acat1-/- Acat1-/- Mouse weight (g)") Supplement Material A Spleen weight (mg) C Mouse weight (g) 1 5 1 2 9 6 3 2 5 2 1 5 Male LN cells (X16) 4 ** ** Female B 3 2 1 Supplemental Figure I. Spleen weight (A), Inguinal lymph node (LN) cell number
Supplement Material A Spleen weight (mg) C Mouse weight (g) 1 5 1 2 9 6 3 2 5 2 1 5 Male LN cells (X16) 4 ** ** Female B 3 2 1 Supplemental Figure I. Spleen weight (A), Inguinal lymph node (LN) cell number
Supplementary Materials for
 www.sciencetranslationalmedicine.org/cgi/content/full/8/352/352ra110/dc1 Supplementary Materials for Spatially selective depletion of tumor-associated regulatory T cells with near-infrared photoimmunotherapy
Supplementary Figure 1. Deletion of Smad3 prevents B16F10 melanoma invasion and metastasis in a mouse s.c. tumor model.
 A B16F1 s.c. Lung LN Distant lymph nodes Colon B B16F1 s.c. Supplementary Figure 1. Deletion of Smad3 prevents B16F1 melanoma invasion and metastasis in a mouse s.c. tumor model. Highly invasive growth
SUPPLEMENTARY INFORMATION
 doi:10.1038/nature10134 Supplementary Figure 1. Anti-inflammatory activity of sfc. a, Autoantibody immune complexes crosslink activating Fc receptors, promoting activation of macrophages, and WWW.NATURE.COM/NATURE
Eosinophils are required. for the maintenance of plasma cells in the bone marrow
 Eosinophils are required for the maintenance of plasma cells in the bone marrow Van Trung Chu, Anja Fröhlich, Gudrun Steinhauser, Tobias Scheel, Toralf Roch, Simon Fillatreau, James J. Lee, Max Löhning
Suppl Video: Tumor cells (green) and monocytes (white) are seeded on a confluent endothelial
 and monocytes (white) are seeded on a confluent endothelial") Supplementary Information Häuselmann et al. Monocyte induction of E-selectin-mediated endothelial activation releases VE-cadherin junctions to promote tumor cell extravasation in the metastasis cascade
Supplementary Information Häuselmann et al. Monocyte induction of E-selectin-mediated endothelial activation releases VE-cadherin junctions to promote tumor cell extravasation in the metastasis cascade
Supplemental Figure S1. RANK expression on human lung cancer cells.
 Supplemental Figure S1. RANK expression on human lung cancer cells. (A) Incidence and H-Scores of RANK expression determined from IHC in the indicated primary lung cancer subgroups. The overall expression
Pearson r = P (one-tailed) = n = 9
 = n = 9") 8F4-Specific Lysis, % 1 UPN1 UPN3 8 UPN7 6 Pearson r =.69 UPN2 UPN5 P (one-tailed) =.192 4 UPN8 n = 9 2 UPN9 UPN4 UPN6 5 1 15 2 25 8 8F4, % Max MFI Supplementary Figure S1. AML samples UPN1-UPN9 show variable
8F4-Specific Lysis, % 1 UPN1 UPN3 8 UPN7 6 Pearson r =.69 UPN2 UPN5 P (one-tailed) =.192 4 UPN8 n = 9 2 UPN9 UPN4 UPN6 5 1 15 2 25 8 8F4, % Max MFI Supplementary Figure S1. AML samples UPN1-UPN9 show variable
Supplementary Figures
 Supplementary Figures Supplementary Fig. 1. Galectin-3 is present within tumors. (A) mrna expression levels of Lgals3 (galectin-3) and Lgals8 (galectin-8) in the four classes of cell lines as determined
Nature Immunology: doi: /ni Supplementary Figure 1. Cytokine pattern in skin in response to urushiol.
 Supplementary Figure 1 Cytokine pattern in skin in response to urushiol. Wild-type (WT) and CD1a-tg mice (n = 3 per group) were sensitized and challenged with urushiol (uru) or vehicle (veh). Quantitative
Supplementary Figure 1. Repression of hepcidin expression in the liver of mice treated with
 Supplementary Figure 1. Repression of hepcidin expression in the liver of mice treated with DMN Immunohistochemistry for hepcidin and H&E staining (left). qrt-pcr assays for hepcidin in the liver (right).
Supplementary Figure 1. Flow cytometry panels used for BD Canto (A) and BD Fortessa (B).
 and BD Fortessa (B).") Intra Immune nalysis Surface Supplementary Figure 1. Flow cytometry panels used for D Canto () and D Fortessa (). Name Fluorochrome ID F488 PE PerCp-Cy5.5 PC Paclue PE-Cy7 PC-H7 Lympho* 1 CD56 CD8 CD16
Intra Immune nalysis Surface Supplementary Figure 1. Flow cytometry panels used for D Canto () and D Fortessa (). Name Fluorochrome ID F488 PE PerCp-Cy5.5 PC Paclue PE-Cy7 PC-H7 Lympho* 1 CD56 CD8 CD16
SUPPLEMENTARY FIGURES
 SUPPLEMENTARY FIGURES Supplementary Figure 1: Chemokine receptor expression profiles of CCR6 + and CCR6 - CD4 + IL-17A +/ex and Treg cells. Quantitative PCR analysis of chemokine receptor transcript abundance
W/T Itgam -/- F4/80 CD115. F4/80 hi CD115 + F4/80 + CD115 +
 F4/8 % in the peritoneal lavage 6 4 2 p=.15 n.s p=.76 CD115 F4/8 hi CD115 + F4/8 + CD115 + F4/8 hi CD115 + F4/8 + CD115 + MHCII MHCII Supplementary Figure S1. CD11b deficiency affects the cellular responses
Pathologic Stage. Lymph node Stage
 ASC ASC a c Patient ID BMI Age Gleason score Non-obese PBMC 1 22.1 81 6 (3+3) PBMC 2 21.9 6 6 (3+3) PBMC 3 22 84 8 (4+4) PBMC 4 24.6 68 7 (3+4) PBMC 24. 6 (3+3) PBMC 6 24.7 73 7 (3+4) PBMC 7 23. 67 7 (3+4)
Supplemental Information. Aryl Hydrocarbon Receptor Controls. Monocyte Differentiation. into Dendritic Cells versus Macrophages
 Immunity, Volume 47 Supplemental Information Aryl Hydrocarbon Receptor Controls Monocyte Differentiation into Dendritic Cells versus Macrophages Christel Goudot, Alice Coillard, Alexandra-Chloé Villani,
Supplementary Figure 1. mtor LysM and Rictor LysM mice have normal cellularity and percentages of hematopoe>c cells. a. Cell numbers of lung, liver,
 a. b. c. Supplementary Figure 1. mtor LysM and Rictor LysM mice have normal cellularity and percentages of hematopoe>c cells. a. Cell numbers of lung, liver, and spleen. b. Cell numbers of bone marrow
Supplemental Figure 1. Western blot analysis indicated that MIF was detected in the fractions of
 Supplemental Figure Legends Supplemental Figure 1. Western blot analysis indicated that was detected in the fractions of plasma membrane and cytosol but not in nuclear fraction isolated from Pkd1 null
Transduction of lentivirus to human primary CD4+ T cells
 Transduction of lentivirus to human primary CD4 + T cells Human primary CD4 T cells were stimulated with anti-cd3/cd28 antibodies (10 µl/2 5 10^6 cells of Dynabeads CD3/CD28 T cell expander, Invitrogen)
SUPPLEMENTARY METHODS
 SUPPLEMENTARY METHODS Histological analysis. Colonic tissues were collected from 5 parts of the middle colon on day 7 after the start of DSS treatment, and then were cut into segments, fixed with 4% paraformaldehyde,
Supplemental Figure 1
 Supplemental Figure 1 1a 1c PD-1 MFI fold change 6 5 4 3 2 1 IL-1α IL-2 IL-4 IL-6 IL-1 IL-12 IL-13 IL-15 IL-17 IL-18 IL-21 IL-23 IFN-α Mut Human PD-1 promoter SBE-D 5 -GTCTG- -1.2kb SBE-P -CAGAC- -1.kb
Supplementary Figure 1. Characterization of basophils after reconstitution of SCID mice
 Supplementary figure legends Supplementary Figure 1. Characterization of after reconstitution of SCID mice with CD4 + CD62L + T cells. (A-C) SCID mice (n = 6 / group) were reconstituted with 2 x 1 6 CD4
Figure S1 Generation of γ-gt DTR transgenic mice. (A) Schematic construct of the transgene. (B)
 Schematic construct of the transgene. (B)") Figure S1 Generation of γ-gt DTR transgenic mice. (A) Schematic construct of the transgene. (B) PCR identified expected hhb-egf band (left panel) and HA tag band (right) in kidneys of transgenic (TG) mice
Figure S1 Generation of γ-gt DTR transgenic mice. (A) Schematic construct of the transgene. (B) PCR identified expected hhb-egf band (left panel) and HA tag band (right) in kidneys of transgenic (TG) mice
Nature Immunology: doi: /ni Supplementary Figure 1. Cellularity of leukocytes and their progenitors in naive wild-type and Spp1 / mice.
 Supplementary Figure 1 Cellularity of leukocytes and their progenitors in naive wild-type and Spp1 / mice. (a, b) Gating strategies for differentiated cells including PMN (CD11b + Ly6G hi and CD11b + Ly6G
NK cells promote neutrophil recruitment in the brain during sepsisinduced. neuroinflammation
 NK cells promote neutrophil recruitment in the brain during sepsisinduced neuroinflammation Hao He 1, Tingting Geng 1, Piyun Chen 1, Meixiang Wang 1, Jingxia Hu 1, Li Kang 1, Wengang Song 1, * & Hua Tang
fl/+ KRas;Atg5 fl/+ KRas;Atg5 fl/fl KRas;Atg5 fl/fl KRas;Atg5 Supplementary Figure 1. Gene set enrichment analyses. (a) (b)
 (b)") KRas;At KRas;At KRas;At KRas;At a b Supplementary Figure 1. Gene set enrichment analyses. (a) GO gene sets (MSigDB v3. c5) enriched in KRas;Atg5 fl/+ as compared to KRas;Atg5 fl/fl tumors using gene set
KRas;At KRas;At KRas;At KRas;At a b Supplementary Figure 1. Gene set enrichment analyses. (a) GO gene sets (MSigDB v3. c5) enriched in KRas;Atg5 fl/+ as compared to KRas;Atg5 fl/fl tumors using gene set
Supplementary Table 1. The primers used for quantitative RT-PCR. Gene name Forward (5 > 3 ) Reverse (5 > 3 )
 Reverse (5 > 3 )") 770 771 Supplementary Table 1. The primers used for quantitative RT-PCR. Gene name Forward (5 > 3 ) Reverse (5 > 3 ) Human CXCL1 GCGCCCAAACCGAAGTCATA ATGGGGGATGCAGGATTGAG PF4 CCCCACTGCCCAACTGATAG TTCTTGTACAGCGGGGCTTG
770 771 Supplementary Table 1. The primers used for quantitative RT-PCR. Gene name Forward (5 > 3 ) Reverse (5 > 3 ) Human CXCL1 GCGCCCAAACCGAAGTCATA ATGGGGGATGCAGGATTGAG PF4 CCCCACTGCCCAACTGATAG TTCTTGTACAGCGGGGCTTG
SUPPLEMENTARY INFORMATION
 doi: 1.138/nature89 IFN- (ng ml ) 5 4 3 1 Splenocytes NS IFN- (ng ml ) 6 4 Lymph node cells NS Nfkbiz / Nfkbiz / Nfkbiz / Nfkbiz / IL- (ng ml ) 3 1 Splenocytes IL- (ng ml ) 1 8 6 4 *** ** Lymph node cells
Supplementary Figure 1. Antibiotic partially rescues mice from sepsis. (ab) BALB/c mice under CLP were treated with antibiotic or PBS.
 BALB/c mice under CLP were treated with antibiotic or PBS.") 1 Supplementary Figure 1. Antibiotic partially rescues mice from sepsis. (ab) BALB/c mice under CLP were treated with antibiotic or PBS. (a) Survival curves. WT Sham (n=5), WT CLP or WT CLP antibiotic
1 Supplementary Figure 1. Antibiotic partially rescues mice from sepsis. (ab) BALB/c mice under CLP were treated with antibiotic or PBS. (a) Survival curves. WT Sham (n=5), WT CLP or WT CLP antibiotic
Supplementary Figure 1. Successful excision of genes from WBM lysates and
 Supplementary Information: Supplementary Figure 1. Successful excision of genes from WBM lysates and survival of mice with different genotypes. (a) The proper excision of Pten, p110α, p110α and p110δ was
AP VP DLP H&E. p-akt DLP
 A B AP VP DLP H&E AP AP VP DLP p-akt wild-type prostate PTEN-null prostate Supplementary Fig. 1. Targeted deletion of PTEN in prostate epithelium resulted in HG-PIN in all three lobes. (A) The anatomy
X P. Supplementary Figure 1. Nature Medicine: doi: /nm Nilotinib LSK LT-HSC. Cytoplasm. Cytoplasm. Nucleus. Nucleus
 a b c Supplementary Figure 1 c-kit-apc-eflu780 Lin-FITC Flt3-Linc-Kit-APC-eflu780 LSK Sca-1-PE-Cy7 d e f CD48-APC LT-HSC CD150-PerCP-cy5.5 g h i j Cytoplasm RCC1 X Exp 5 mir 126 SPRED1 SPRED1 RAN P SPRED1
Nature Immunology: doi: /ni Supplementary Figure 1. Examples of staining for each antibody used for the mass cytometry analysis.
 Supplementary Figure 1 Examples of staining for each antibody used for the mass cytometry analysis. To illustrate the functionality of each antibody probe, representative plots illustrating the expected
Supplementary Figure 1. BMS enhances human T cell activation in vitro in a
 Supplementary Figure 1. BMS98662 enhances human T cell activation in vitro in a concentration-dependent manner. Jurkat T cells were activated with anti-cd3 and anti-cd28 antibody in the presence of titrated
Supplementary Figures
 Supplementary Figures mir-150 regulates obesityassociated insulin resistance by controlling B cell functions Wei Ying, Alexander Tseng, Richard Cheng-An Chang, Haiqing Wang, Yu-lieh Lin, Srikanth Kanameni,
Supplementary Figure 1
 Supplementary Figure 1 Supplementary Figure 1 Schematic depiction of the tandem Fc GDF15. Supplementary Figure 2 Supplementary Figure 2 Gfral mrna levels in the brains of both wild-type and knockout Gfral
Nature Immunology: doi: /ni Supplementary Figure 1. Production of cytokines and chemokines after vaginal HSV-2 infection.
 Supplementary Figure 1 Production of cytokines and chemokines after vaginal HSV-2 infection. C57BL/6 mice were (a) treated intravaginally with 20 µl of PBS or infected with 6.7x10 4 pfu of HSV-2 in the
Supplemental figure 1. PDGFRα is expressed dominantly by stromal cells surrounding mammary ducts and alveoli. A) IHC staining of PDGFRα in
 IHC staining of PDGFRα in") Supplemental figure 1. PDGFRα is expressed dominantly by stromal cells surrounding mammary ducts and alveoli. A) IHC staining of PDGFRα in nulliparous (left panel) and InvD6 mouse mammary glands (right
Supplemental figure 1. PDGFRα is expressed dominantly by stromal cells surrounding mammary ducts and alveoli. A) IHC staining of PDGFRα in nulliparous (left panel) and InvD6 mouse mammary glands (right
Supplementary Figure 1. mrna expression of chitinase and chitinase-like protein in splenic immune cells. Each splenic immune cell population was
 Supplementary Figure 1. mrna expression of chitinase and chitinase-like protein in splenic immune cells. Each splenic immune cell population was sorted by FACS. Surface markers for sorting were CD11c +
Supplementary Information Epigenetic modulation of inflammation and synaptic plasticity promotes resilience against stress in mice
 Supplementary Information Epigenetic modulation of inflammation and synaptic plasticity promotes resilience against stress in mice Wang et. al. IL-6 in plasma (pg/ml) Rac1/HPRT (% of control) PSD9/HPRT
Nature Immunology: doi: /ni.3412
 Supplementary Figure 1 Gata1 expression in heamatopoietic stem and progenitor populations. (a) Unsupervised clustering according to 100 top variable genes across single pre-gm cells. The two main cell
SUPPLEMENTARY INFORMATION
 1. Supplementary Figures and Legends Supplementary Fig. 1. S1P-mediated transcriptional regulation of integrins expressed in OP/monocytoid cells. Real-time quantitative PCR analyses of mrna for two integrins,
Supplementary Figure 1. Double-staining immunofluorescence analysis of invasive colon and breast cancers. Specimens from invasive ductal breast
 Supplementary Figure 1. Double-staining immunofluorescence analysis of invasive colon and breast cancers. Specimens from invasive ductal breast carcinoma (a) and colon adenocarcinoma (b) were staining
Title of file for HTML: Supplementary Information Description: Supplementary Figures and Supplementary Table
 Title of file for HTML: Supplementary Information Description: Supplementary Figures and Supplementary Table Title of file for HTML: Peer Review File Description: Innate Scavenger Receptor-A regulates
Supplementary Figure 1
 Supplementary Figure 1 a Percent of body weight! (%) 4! 3! 1! Epididymal fat Subcutaneous fat Liver SD Percent of body weight! (%) ** 3! 1! SD Percent of body weight! (%) 6! 4! SD ** b Blood glucose (mg/dl)!
Supplementary Information. Tissue-wide immunity against Leishmania. through collective production of nitric oxide
 Supplementary Information Tissue-wide immunity against Leishmania through collective production of nitric oxide Romain Olekhnovitch, Bernhard Ryffel, Andreas J. Müller and Philippe Bousso Supplementary
IL-34 is a tissue-restricted ligand of CSF1R required for the development of Langerhans cells and microglia
 Supplementary Figures IL-34 is a tissue-restricted ligand of CSF1R required for the development of Langerhans cells and microglia Yaming Wang, Kristy J. Szretter, William Vermi, Susan Gilfillan, Cristina
Supplementary information CD4 T cells are required for both development and maintenance of disease in a new model of reversible colitis
 Supplementary information CD4 T cells are required for both development and maintenance of disease in a new model of reversible colitis rasseit and Steiner et al. .. Supplementary Figure 1 % of initial
Type of file: PDF Title of file for HTML: Supplementary Information Description: Supplementary Figures
 Type of file: PDF Title of file for HTML: Supplementary Information Description: Supplementary Figures Type of file: MOV Title of file for HTML: Supplementary Movie 1 Description: NLRP3 is moving along
Supplementary Table 1 Clinicopathological characteristics of 35 patients with CRCs
 Supplementary Table Clinicopathological characteristics of 35 patients with CRCs Characteristics Type-A CRC Type-B CRC P value Sex Male / Female 9 / / 8.5 Age (years) Median (range) 6. (9 86) 6.5 (9 76).95
Eosinophils! 40! 30! 20! 10! 0! NS!
 A Macrophages Lymphocytes Eosinophils Neutrophils Percentage (%) 1 ** 4 * 1 1 MMA SA B C Baseline FEV1, % predicted 15 p = 1.11 X 10⁻⁹ 5 CD4:CD8 ratio 1 Supplemental Figure 1. Cellular infiltrate in the
pplementary Figur Supplementary Figure 1. a.
 pplementary Figur Supplementary Figure 1. a. Quantification by RT-qPCR of YFV-17D and YFV-17D pol- (+) RNA in the supernatant of cultured Huh7.5 cells following viral RNA electroporation of respective
Supplementary Figure 1 IMQ-Induced Mouse Model of Psoriasis. IMQ cream was
 Supplementary Figure 1 IMQ-Induced Mouse Model of Psoriasis. IMQ cream was painted on the shaved back skin of CBL/J and BALB/c mice for consecutive days. (a, b) Phenotypic presentation of mouse back skin
Supplementary Figure 1. Generation of knockin mice expressing L-selectinN138G. (a) Schematics of the Sellg allele (top), the targeting vector, the
 Schematics of the Sellg allele (top), the targeting vector, the") Supplementary Figure 1. Generation of knockin mice expressing L-selectinN138G. (a) Schematics of the Sellg allele (top), the targeting vector, the targeted allele in ES cells, and the mutant allele in
Supplementary Figure 1. Generation of knockin mice expressing L-selectinN138G. (a) Schematics of the Sellg allele (top), the targeting vector, the targeted allele in ES cells, and the mutant allele in
Nature Immunology: doi: /ni Supplementary Figure 1. RNA-Seq analysis of CD8 + TILs and N-TILs.
 Supplementary Figure 1 RNA-Seq analysis of CD8 + TILs and N-TILs. (a) Schematic representation of the tumor and cell types used for the study. HNSCC, head and neck squamous cell cancer; NSCLC, non-small
Supplementary Figure 1: Hsp60 / IEC mice are embryonically lethal (A) Light microscopic pictures show mouse embryos at developmental stage E12.
 Light microscopic pictures show mouse embryos at developmental stage E12.") Supplementary Figure 1: Hsp60 / IEC mice are embryonically lethal (A) Light microscopic pictures show mouse embryos at developmental stage E12.5 and E13.5 prepared from uteri of dams and subsequently genotyped.
Supplementary Figure 1: Hsp60 / IEC mice are embryonically lethal (A) Light microscopic pictures show mouse embryos at developmental stage E12.5 and E13.5 prepared from uteri of dams and subsequently genotyped.
Supplementary Figures
 Supplementary Figures Supplementary Figure 1 Characterization of stable expression of GlucB and sshbira in the CT26 cell line (a) Live cell imaging of stable CT26 cells expressing green fluorescent protein
Online supplement. Phenotypic, functional and plasticity features of classical and alternatively activated
 Online supplement Phenotypic, functional and plasticity features of classical and alternatively activated human macrophages Abdullah Al Tarique*, Jayden Logan *, Emma Thomas *, Patrick G Holt *, Peter
IL-6Rα IL-6RαT-KO KO. IL-6Rα f/f bp. f/f 628 bp deleted 368 bp. 500 bp
 STD H 2 O WT KO IL-6Rα f/f IL-6Rα IL-6RαT-KO KO 1000 bp 500 bp f/f 628 bp deleted 368 bp Supplementary Figure 1 Confirmation of T-cell IL-6Rα deficiency. (a) Representative histograms and (b) quantification
An epithelial circadian clock controls pulmonary inflammation and glucocorticoid action
 An epithelial circadian clock controls pulmonary inflammation and glucocorticoid action Supplementary Figure : Expression levels of toll-like receptor 4 (Tlr4) in muse lung does not change throughout the
SUPPLEMENTARY INFORMATION
 doi:1.138/nature1554 a TNF-α + in CD4 + cells [%] 1 GF SPF 6 b IL-1 + in CD4 + cells [%] 5 4 3 2 1 Supplementary Figure 1. Effect of microbiota on cytokine profiles of T cells in GALT. Frequencies of TNF-α
Supplementary Figure 1. A. Bar graph representing the expression levels of the 19 indicated genes in the microarrays analyses comparing human lung
 Supplementary Figure 1. A. Bar graph representing the expression levels of the 19 indicated genes in the microarrays analyses comparing human lung immortalized broncho-epithelial cells (AALE cells) expressing
Supplementary Figure S1. Flow cytometric analysis of the expression of Thy1 in NH cells. Flow cytometric analysis of the expression of T1/ST2 and
 Supplementary Figure S1. Flow cytometric analysis of the expression of Thy1 in NH cells. Flow cytometric analysis of the expression of T1/ST2 and Thy1 in NH cells derived from the lungs of naïve mice.
D CD8 T cell number (x10 6 )
") IFNγ Supplemental Figure 1. CD T cell number (x1 6 ) 18 15 1 9 6 3 CD CD T cells CD6L C CD5 CD T cells CD6L D CD8 T cell number (x1 6 ) 1 8 6 E CD CD8 T cells CD6L F Log(1)CFU/g Feces 1 8 6 p
IFNγ Supplemental Figure 1. CD T cell number (x1 6 ) 18 15 1 9 6 3 CD CD T cells CD6L C CD5 CD T cells CD6L D CD8 T cell number (x1 6 ) 1 8 6 E CD CD8 T cells CD6L F Log(1)CFU/g Feces 1 8 6 p
Supplemental Materials for. Effects of sphingosine-1-phosphate receptor 1 phosphorylation in response to. FTY720 during neuroinflammation
 Supplemental Materials for Effects of sphingosine-1-phosphate receptor 1 phosphorylation in response to FTY7 during neuroinflammation This file includes: Supplemental Table 1. EAE clinical parameters of
SUPPLEMENTARY MATERIAL
 SUPPLEMENTARY MATERIAL IL-1 signaling modulates activation of STAT transcription factors to antagonize retinoic acid signaling and control the T H 17 cell it reg cell balance Rajatava Basu 1,5, Sarah K.
Supplementary Figure 1: STAT3 suppresses Kras-induced lung tumorigenesis
 Supplementary Figure 1: STAT3 suppresses Kras-induced lung tumorigenesis (a) Immunohistochemical (IHC) analysis of tyrosine 705 phosphorylation status of STAT3 (P- STAT3) in tumors and stroma (all-time
Synergy of radiotherapy and PD-1 blockade in Kras-mutant lung cancer
 Supplementary Information Synergy of radiotherapy and PD-1 blockade in Kras-mutant lung cancer Grit S. Herter-Sprie, Shohei Koyama, Houari Korideck, Josephine Hai, Jiehui Deng, Yvonne Y. Li, Kevin A. Buczkowski,
SHREE ET AL, SUPPLEMENTAL MATERIALS. (A) Workflow for tumor cell line derivation and orthotopic implantation.
 Workflow for tumor cell line derivation and orthotopic implantation.") SHREE ET AL, SUPPLEMENTAL MATERIALS SUPPLEMENTAL FIGURE AND TABLE LEGENDS Supplemental Figure 1. Derivation and characterization of TS1-TGL and TS2-TGL PyMT cell lines and development of an orthotopic
SHREE ET AL, SUPPLEMENTAL MATERIALS SUPPLEMENTAL FIGURE AND TABLE LEGENDS Supplemental Figure 1. Derivation and characterization of TS1-TGL and TS2-TGL PyMT cell lines and development of an orthotopic
Supplementary Figure 1
 d f a IL7 b IL GATA RORγt h HDM IL IL7 PBS Ilra R7 PBS HDM Ilra R7 HDM Foxp Foxp Ilra R7 HDM HDM Ilra R7 HDM. 9..79. CD + FOXP + T reg cell CD + FOXP T conv cell PBS Ilra R7 PBS HDM Ilra R7 HDM CD + FOXP
Supplemental Information. Genomic Characterization of Murine. Monocytes Reveals C/EBPb Transcription. Factor Dependence of Ly6C Cells
 Immunity, Volume 46 Supplemental Information Genomic Characterization of Murine Monocytes Reveals C/EBPb Transcription Factor Dependence of Ly6C Cells Alexander Mildner, Jörg Schönheit, Amir Giladi, Eyal
% of live splenocytes. STAT5 deletion. (open shapes) % ROSA + % floxed
 % ROSA + % floxed") Supp. Figure 1. a 14 1 1 8 6 spleen cells (x1 6 ) 16 % of live splenocytes 5 4 3 1 % of live splenocytes 8 6 4 b 1 1 c % of CD11c + splenocytes (closed shapes) 8 6 4 8 6 4 % ROSA + (open shapes) % floxed
Supp. Figure 1. a 14 1 1 8 6 spleen cells (x1 6 ) 16 % of live splenocytes 5 4 3 1 % of live splenocytes 8 6 4 b 1 1 c % of CD11c + splenocytes (closed shapes) 8 6 4 8 6 4 % ROSA + (open shapes) % floxed
Supplementary Information. CSF-1R inhibition alters macrophage polarization and blocks glioma progression
 Supplementary Information CSF-R inhibition alters macrophage polarization and blocks glioma progression Stephanie M. Pyonteck *, Leila Akkari *, Alberto J. Schuhmacher *, Robert L. Bowman, Lisa Sevenich,
Supporting Information
 Supporting Information M1 macrophage-derived nanovesicles potentiate the anticancer efficacy of immune checkpoint inhibitors Yeon Woong Choo, 1, Mikyung Kang, 2, Han Young Kim, 1 Jin Han, 1 Seokyung Kang,
To compare the relative amount of of selected gene expression between sham and
 Supplementary Materials and Methods Gene Expression Analysis To compare the relative amount of of selected gene expression between sham and mice given renal ischemia-reperfusion injury (IRI), ncounter
Supplementary Figure 1 ITGB1 and ITGA11 increase with evidence for heterodimers following HSC activation. (a) Time course of rat HSC activation
 Time course of rat HSC activation") Supplementary Figure 1 ITGB1 and ITGA11 increase with evidence for heterodimers following HSC activation. (a) Time course of rat HSC activation indicated by the detection of -SMA and COL1 (log scale).
Supplementary Figure 1 ITGB1 and ITGA11 increase with evidence for heterodimers following HSC activation. (a) Time course of rat HSC activation indicated by the detection of -SMA and COL1 (log scale).
An interleukin-17-mediated paracrine network promotes tumor resistance to anti-angiogenic therapy
 CORRECTION NOTICE Nat. Med. 9, 111 113 (13) An interleukin-17-mediated paracrine network promotes tumor resistance to anti-angiogenic therapy Alicia S Chung, Xiumin Wu, Guanglei Zhuang, Hai Ngu, Ian Kasman,
Nature Genetics: doi: /ng Supplementary Figure 1
 Supplementary Figure 1 MSI2 interactors are associated with the riboproteome and are functionally relevant. (a) Coomassie blue staining of FLAG-MSI2 immunoprecipitated complexes. (b) GO analysis of MSI2-interacting
Supporting Information
 Supporting Information Idoyaga et al. 10.1073/pnas.0812247106 SSC a) Single cell suspension 99 Aqua b) Live cells 96 -W c) Singlets 92 -A CD19+ER119 d) CD19 ER119 cells 97 CD3 e) CD3 cells 27 f) DX5 cells
SUPPLEMENTARY INFORMATION
 doi:10.1038/nature12215 Supplementary Figure 1. The effects of full and dissociated GR agonists in supporting BFU-E self-renewal divisions. BFU-Es were cultured in self-renewal medium with indicated GR
Breast and pancreatic cancer interrupt IRF8-dependent dendritic cell development to overcome immune surveillance
 Washington University School of Medicine Digital Commons@Becker Open Access Publications Breast and pancreatic cancer interrupt IRF-dependent dendritic cell development to overcome immune surveillance
Supplementary Figure 1: Expression of NFAT proteins in Nfat2-deleted B cells (a+b) Protein expression of NFAT2 (a) and NFAT1 (b) in isolated splenic
 Protein expression of NFAT2 (a) and NFAT1 (b) in isolated splenic") Supplementary Figure 1: Expression of NFAT proteins in Nfat2-deleted B cells (a+b) Protein expression of NFAT2 (a) and NFAT1 (b) in isolated splenic B cells from WT Nfat2 +/+, TCL1 Nfat2 +/+ and TCL1 Nfat2
Supplementary Figure 1: Expression of NFAT proteins in Nfat2-deleted B cells (a+b) Protein expression of NFAT2 (a) and NFAT1 (b) in isolated splenic B cells from WT Nfat2 +/+, TCL1 Nfat2 +/+ and TCL1 Nfat2
Intracellular MHC class II molecules promote TLR-triggered innate. immune responses by maintaining Btk activation
 Intracellular MHC class II molecules promote TLR-triggered innate immune responses by maintaining Btk activation Xingguang Liu, Zhenzhen Zhan, Dong Li, Li Xu, Feng Ma, Peng Zhang, Hangping Yao and Xuetao