New Jersey Statewide Coordinated Statement of Need
|
|
|
- Wilfred McCoy
- 5 years ago
- Views:
Transcription

1 New Jersey Department of Health and Senior Services Division of HIV, STD and TB Services New Jersey Statewide Coordinated Statement of Need June 2013
2
3 Statewide Coordinated Statement of Need Introduction: The New Jersey Statewide Coordinated Statement of Need (SCSN) 2012 Document was produced by the New Jersey HIV/AIDS Planning Group (NJHPG) in coordination with the New Jersey Department of Health and Senior Services, Division of HIV, STD and TB Services (DHSTS). The purpose of this document is to provide a collaborative mechanism where the NJHPG and DHSTS can identify and address the most significant HIV service needs of People Living with HIV/AIDS (PLWHA) in New Jersey. The NJHPG includes representatives from all HIV/AIDS programs, service providers, consumers, Ryan White Parts and HIV planning bodies in the state of New Jersey. This model allows for maximum connection and effective linkage with all Ryan White Parts in New Jersey. The National HIV/AIDS Strategy (NHAS) is considered throughout this document to ensure that it s three goals are addressed and met: (1) reducing HIV incidence; (2) increasing access to care and optimizing health outcomes and (3) reducing HIV-related health disparities. The NJHPG is a collaboration, formed under the guidance and direction of DHSTS, that combines HIV care and treatment and HIV prevention planning efforts for the State of New Jersey. The group was formed in 2008, when DHSTS undertook the process of combining the existing planning bodies for HIV Prevention (New Jersey HIV Prevention Community Planning Group [CPG]) and Ryan White Part B (Statewide Coordinated Statement of Need Task Force [SCSN]). The group is responsible for directing the development of the SCSN Document, Part B Comprehensive Plan and the New Jersey Comprehensive HIV/AIDS Services Plan. 1 Background: The NJHPG worked closely with DHSTS to produce the SCSN Document for submission to the Health Resources and Services Administration (HRSA) as part of the Ryan White HIV/AIDS Treatment Extension Act of 2009 (PL111-87, October 30, 2009), Part B planning requirements. The NJHPG s HIV/AIDS Issues Committee (Issues Committee) was assigned to oversee the development of the document by the NJHPG Executive Committee. NJHPG support staff (Rutgers University Edward J. Bloustein School of Planning and Public Policy [EJBSPPP]), HIV Prevention Community Planning Support and Development Initiative (HPCPSDI) worked with the committee to develop an outline and timeline for completion of the document. Appendix I documents the names, affiliations, and geographic area(s) of HIV/AIDS involvement of individuals who participated in the development of the SCSN Document at the planning level (Issues Committee) and/or at the review and ratification level (full NJHPG membership). Both the Issues Committee and the NJHPG have members who represent HIV prevention; Ryan White Parts A, B, C, and D; service providers; HIV+ consumers and members of DHSTS staff. Methodology: HPCPSDI staff worked in collaboration with the Issues Committee to identify the types of data that needed to be collected for the SCSN Document. DHSTS staff worked with HPCPSDI staff to collect state and county level HIV/AIDS, co-morbidity and social determinates data.
4 Statewide Coordinated Statement of Need The Issues Committee developed a process for completing the document which included the following components: (1) data collection and review; (2) development of statewide and regional profiles; (3) review of profiles; (4) development of data driven recommendations; (5) review and approve recommendations and (6) approval of the final SCSN Document. 1. Data Collection and Review: The Issues Committee reviewed the data used in the 2009 SCSN Document and made recommendations about the types of data to be collected for the 2012 SCSN Document. Based upon the review, the committee recommended that data would be collected from the following sources: New Jersey s Ryan White Part A and Part B Planning Regions; New Jersey s Ryan White Part C, Part D and Part F grantees; DHSTS; NJHPG; Federal, state and county level sources including: (1) HRSA; (2) the Centers for Disease Control and Prevention (CDC); (3) the U.S. Census Bureau; (4) the U.S. Department of Justice and (5) the Social Security Administration Development of Statewide, Part A and Part B Regional Profiles: Using data from the above sources, HPCPSDI developed a draft SCSN Document that included statewide and regional profiles. The statewide and regional profiles included descriptions of: Geography of the area; Population estimates; Health planning indicators; Social determinates data; and HIV epidemic data. SCSN Part A and B Regional Profiles are included in Appendix II. 3. Review of Profiles: The Issues Committee reviewed the draft of the statewide and regional profiles, made suggested edits and approved the revised drafts. 4. Development of Data Driven Recommendations: Upon completion of the draft SCSN Document, the Issues Committee reviewed the 2009 Part B Comprehensive Plan s recommendations. Draft recommendations from the 2012 SCSN Document included updates on the implementation of 2009 recommendations as well as identifying current barriers or deficits in the HIV care and treatment and prevention programming for the state. 5. Review and Approval of Recommendations: The Issues Committee forwarded their draft recommendations to the NJHPG Executive Committee and DHSTS for review. Suggested changes were incorporated into the committee s draft recommendations and submitted to the full NJHPG for approval. 6. Approval of Final Document: The NJHPG reviewed the final SCSN Document and voted to approve the document for submission to DHSTS and HRSA in September 2012.
5 Challenges in Preparing the SCSN Document: The Issues Committee identified the following challenges in the development of the SCSN Document: Data Collection: There continues to be a lack of uniform data collection across the state. Due to differences in data collection and access to data, the committee was unable to present uniform service utilization information by race/ethnicity, gender, age and exposure category. Service Duplication: There is no statewide system available to assess the level of service duplication; and Lack of Co-Morbidity Data: There are no reliable data available on HIV and co-morbid conditions (e.g., the number of PLWHA that are homeless, mentally ill, substance abusers or co-infected with Hepatitis). 3
6 Statewide Coordinated Statement of Need Section I: Description of the State of New Jersey New Jersey has nine HIV/AIDS planning regions that include Part A funded Eligible Metropolitan Areas (EMA), Transitional Grant Areas (TGA) and Part B funded regions. The EMAs are located in Newark (including Essex, Morris, Sussex, Union and Warren Counties) and Philadelphia (including Burlington, Camden, Gloucester and Salem Counties). The TGAs are Bergen-Passaic, Jersey City and Middlesex-Somerset-Hunterdon. The Part B Regions are Atlantic-Cape May, Cumberland County, Mercer County and Monmouth-Ocean. The Legal Services of New Jersey s Poverty Benchmarks 2012: Assessing New Jersey s Progress in Combating Poverty released on May 20, 2012, found that poverty reached a record level in New Jersey. The report is compiled from the United States American Community Survey. Overall, the poverty rate, defined using federal guidelines, increased from 8.7% in 2009 to 10.3% in The report found that 2,054,000 New Jersey residents, or nearly one in four, lived below 200% of the Federal Poverty Level (FPL) in Approximately 380,000 New Jersey households, or one-eighth of New Jersey households, had difficulty at some time between 2008 and 2010 providing enough food for family members. The median household income in New Jersey fell for the second straight year in 2010 from $71,164 in 2008; to $69,571 in 2009; to $67,681 in This is the lowest median household income in New Jersey in six years. 4 New Jersey is an ethnically and economically diverse area that is largely urban and suburban. It is the only state in the nation where every county has been deemed urban by the Census Bureau s Combined Statistical Area. New Jersey is the sixth smallest state in the country (7,417 square miles). Despite its size, New Jersey is the most densely populated state in the nation with a population of 8,791,894 and a density of 1,185 people per square mile. Newark and Camden are two of the poorest cities in America, but New Jersey as a whole has the highest median household income among the states. This is largely due to the fact that New Jersey has many affluent suburbs of New York City and Philadelphia. Total Population: The total population within the 21 counties that comprise New Jersey is 8,791,894. Race/Ethnicity in New Jersey: The largest segment of the population residing in the state is White, non- Hispanic (59.3%), followed by Hispanic of any race (17.7%), Black, non-hispanic (12.8%) and Asian (8.2%). Gender: Women outnumber men in New Jersey, where 51.3% of the population is female and 48.7% of the population is male. Age: The majority of the population is between the ages of (8.0%) followed by (7.7%), (7.4%) and (6.8%). The median age of the population is 39. Table 1 shows the breakdown of New Jersey s population by age, according to the 2010 U.S. Census.
7 SECTION I: DESCRIPTION OF THE STATE OF NEW JERSEY Table 1: 2010 General Population Statistics Total Population (By Age Group) Estimate 8,791,894 Percent Under 5 541, to 9 564, to , to , to , to , to , to , to , to , to , to , to , to , to , to , to , and over 179, Source: U.S. Census 2010
8 Statewide Coordinated Statement of Need Section II: Social Determinates Data from the 2010 Census for the State of New Jersey Language: In New Jersey households, the majority of the population (70%) speaks English only. An additional 15% speak Spanish in their household. Educational Attainment: The majority of New Jersey residents (aged 25 years and older) are high school graduates (30%). Twenty-two percent (22%) hold a Bachelor s degree, 17% have some college but no degree and 13% have a graduate or professional degree. Nearly 90% of residents are high school graduates and above. Employment Status: The unemployment rate for New Jersey residents is 9% (New Jersey Labor and Workforce Development, 1/19/12). There is a disparity of unemployment among racial groups. Blacks have an unemployment rate of 17% followed by Hispanics (13%), Whites (10%) and Asians (8%). Median Household Income: There is a disparity of median household incomes among racial groups. Asians have a median household income of $94,575 followed by Whites ($72,665), Hispanics ($47,166) and Blacks ($45,825). The average median household income is $65, (U.S. Census Bureau, 2011) 6 Levels of Poverty: There was a disparity in levels of poverty among racial groups in the last 12 months. Hispanics have the largest percentage of individuals at 125% of the poverty level (26%) followed by Blacks (24%). Hispanics also have the largest percentage of individuals under 100% of the poverty level (20%) followed by Blacks (19%). Blacks have the largest percentage of individuals under 50% of the poverty level (10%) followed by Hispanics (8%). (U.S. Census Bureau, 2011) Households Receiving Government Assistance: Nearly 7% of households received Food Stamps/SNAP (Supplemental Nutritional Assistance Program) benefits within the past year. Nearly 3% of households have cash public assistance income. (U.S. Census Bureau, 2011) Housing: Owner-Occupied: Nearly 65% of housing in the state of New Jersey is owner-occupied. The median home value in 2010 was $339,200. (U.S. Census Bureau, 2011) Renter-Occupied: Thirty-three percent (33%) of housing is renter occupied, with a median monthly rent of $1,114 in There are 1,009,565 occupied units in New Jersey where rent is being paid. The majority of renters (45%) pay 35% or more of their income in rent. An additional 12% pay % of their income in rent. The traditional debt to income ratio for housing is 28%. (U.S. Census Bureau, 2011) Health Insurance: Coverage: Nearly 87% of New Jersey residents are covered by health insurance. The majority (72%) are covered under private insurance and 26% are covered under public insurance. A total of 1,876,091 individuals are enrolled in New Jersey Health Maintenance Organizations (HMOs). The largest number of residents who have no insurance coverage (13%) are under the age of 18. (U.S. Census Bureau, 2011) Coverage by Race and Place of Birth: Hispanics have the largest percentage of individuals who are uninsured (30%). Black, non-hispanics have the second highest percentage of uninsured individuals (15%), followed by White, non-hispanics (10%). Foreign born individuals are more likely to be uninsured (31%), versus native born individuals (9%). Of those who were foreign born and are not citizens, 47% were uninsured while only 14.1% of those who are naturalized are uninsured. (NJ Division of Medical Assistance and Health Services, 2012)
9 SECTION II: SOCIAL DETERMINATES DATA FROM THE 2010 CENSUS Medicaid Beneficiaries: The total number of New Jersey residents who receive Medicaid benefits is 1,282,184. Of those, 537,453 are adults. The largest percentage of adults enrolled in Medicaid are receiving Family Care benefits (239,623) followed by disability benefits (166,029) and benefits for the aging (83,326). There are 47,706 adults who are receiving general assistance. Medicare Beneficiaries: The largest percentage of residents receiving Medicare benefits are between the ages of (22.5%) followed by individuals between the ages of (20.3%). The majority of adults receiving Medicare benefits are receiving benefits for the aged, while 13.3% are receiving disability benefits. Incarcerated: There are 25,139 individuals in the New Jersey Department of Corrections (NJDOC) system (average daily population) in 14 correctional institutions throughout the state. There are an estimated 16,076 individuals incarcerated in local jails and other municipal confinement facilities. (NJ Department of Corrections, 2011) 7
10 Statewide Coordinated Statement of Need Section III: New Jersey Epidemiologic Profile: Data Comparison DHSTS is responsible for collecting and disseminating HIV/AIDS data. The following tables (Tables 2 4) document the differences in HIV/AIDS from the 2009 SCSN Document and 2011 DHSTS data. Table 2 - HIV/AIDS Prevalence Data 2009 SCSN Document (Various Dates) New Jersey has 34,470 PLWHA as of 12/31/2007. Updated Statistics (December 31, 2012) Total New Jersey has 36,648 PLWHA as of 12/31/ Total PLWHA 33,623 35,309 35,688 36,648 8 One in every 379 people in the state of New Jersey was living with HIV/AIDS as of 12/31/04. As of 12/31/07, the state of New Jersey had 17,655 people living with AIDS. One in every 240 people in the state of New Jersey was living with HIV/AIDS as of 12/31/12. Cumulative HIV/AIDS cases in New Jersey totaled 77,828 by the end of December Of these, 56,535 are AIDS cases and 21,293 are HIV (not AIDS) cases. New Jersey ranked 11th in diagnoses of HIV infection by area of residence in 2011 (1,156). New Jersey ranked 5th in the number of adults and adolescents living with a diagnosis of HIV in 2010 (36,126). New Jersey ranked 11th in AIDS diagnoses by area of residence in 2011 (764). New Jersey ranks 5th in the number of people living with AIDS (17,655). Of those living with HIV/ AIDS in New Jersey, 64% are male and 36% are female. New Jersey ranked 5th in the number of adults and adolescents living with an AIDS diagnosis in 2010 (19,407). Of those living with HIV/AIDS in New Jersey, 66% are male and 34% are female. Sources: NJ Department of Health Division of HIV/AIDS, STD and TB Services, 2012 CDC National Center for HIV/AIDS, Viral Hepatitis, STD, and TB Prevention, 2011
11 SECTION III: NEW JERSEY EPIDEMIOLOGIC PROFILE: DATA COMPARISON Table 2 - HIV/AIDS Prevalence Data (continued) Race/Ethnicity 2009 SCSN Document (Various Dates) Updated Statistics (December 31, 2012) Fifty-five percent (55%) of those living with HIV/AIDS are Black, non-hispanic followed by White, non-hispanic and Hispanic (22% respectively). Minorities account for 75% of adult/adolescent cumulative HIV/AIDS cases and 76% of all PLWHA. Fifty-three percent (53%) of those living with HIV/AIDS are Black, non- Hispanic followed by Hispanic (23%) and White, non-hispanic (22%). Race/Ethnicity White, non- Hispanic 7,347 7,750 7,903 8,044 Black, non- Hispanic 18,542 19,377 19,150 19,543 Hispanic 7,182 7,609 8,047 8,466 Other/ Unknown Total 33,623 35,309 35,688 36,648 As of 12/31/07 in New Jersey, the prevalence rate for Black, non-hispanics living with HIV/ AIDS was 1,599/100,000. As of 12/31/07 in New Jersey, the prevalence rate for Hispanics living with HIV/AIDS was 544/100,000. As of 12/31/07 in New Jersey, the prevalence rate for White, non-hispanics living with HIV/ AIDS was 137/100,000. As of 12/31/10 in New Jersey, the prevalence rate for Black, non-hispanics living with HIV/AIDS was 1,702/100,000. Race/Ethnicity Male Female Total No. % No. % No. % White 6, , , Black 11, , , Hispanic 5, , , Asian/Pac. Isl. 301 # 106 # 407 # Other/ Unknown 119 # 69 # 188 # Total 24, , , As of 12/31/10 in New Jersey, the prevalence rate for Hispanics living with HIV/AIDS was 517/100,000. As of 12/31/10 in New Jersey, the prevalence rate for White, non-hispanics living with HIV/AIDS was 152/100, Source: NJ Department of Health Division of HIV/AIDS, STD and TB Services, 2012
12 Statewide Coordinated Statement of Need Table 2 - HIV/AIDS Prevalence Data (continued) Mode of Exposure 2009 SCSN Document (Various Dates) In New Jersey, the mode of exposure for 27% of those living with HIV/AIDS in the state is IDU, for 39% it is Heterosexual contact, for 20% it is MSM, for 2% it is MSM/IDU. The remainder were classified as Other/Unknown. Updated Statistics (December 31, 2012) In New Jersey, the mode of exposure for 20% of those living with HIV/AIDS in the state is IDU, for 40% it is Heterosexual contact, for 23% it is MSM, for 3% it is MSM/IDU. The remaining 14% are classified as Other/Unknown. Exposure Category MSM 6,534 7,115 7,820 8,540 IDU 9,370 9,295 8,170 7,489 MSM/IDU Heterosexual contact 13,080 13,923 14,311 14,644 Mother with HIV+ 3,805 4,132 3,920 5,206 Other/Unknown 33,623 35,309 35,688 36, For women living with HIV/AIDS: Mode of Transmission Number IDU 3,296 Heterosexual contact 7,577 Other/Unknown 1,398 Total 12,271 For men living with HIV/AIDS: Mode of Transmission Number IDU 5,877 Heterosexual contact 5,943 MSM 6,836 MSM/IDU 834 Total 22,199 Modified Exposure Male Female Total Category No. % No. % No. % MSM 8, , IDU 4, , , MSM/IDU Heterosexual contact with partner(s): IDU , ,610 4 bisexual male HIV infection, risk Other/ Unknown 2, , , partner(s) of Unknown HIV risk 4, , , Other/Unknown 3, , , Total # of individuals 24, , , Source: NJ Department of Health Division of HIV/AIDS, STD and TB Services, 2012
13 SECTION III: NEW JERSEY EPIDEMIOLOGIC PROFILE: DATA COMPARISON Table 2 - HIV/AIDS Prevalence Data (continued) Age Group 2009 SCSN Document (Various Dates) Updated Statistics (December 31, 2012) Over two out of three PLWHA in New Jersey are 40 years of age or older. Age ,739 1,920 2,153 2, ,514 5,786 4,990 4, ,958 14,093 12,711 11,440 Over 49 10,677 12,829 15,336 17,673 Total 33,623 35,309 35,688 36,648 Age Group Number Under , , , , ,776 Total 34,199 Current Male Female Total Age No. % No. % No. % , , , , , , , , Over 49 11, , , Total 24, , , High Impact Cities 2009 SCSN Document (Various Dates) Updated Statistics (December 31, 2012) As of 12/31/07 in the 10 cities in New Jersey with the highest prevalence rate, 1 in every 43 African Americans was living with HIV/AIDS. This includes: 1 in every 33 in Atlantic City 1 in every 30 in Newark 1 in every 42 in Elizabeth 1 in every 43 in Jersey City 1 in every 47 in Paterson 1 in every 50 in East Orange 1 in every 55 in Irvington 1 in every 56 in Trenton 1 in every 74 in Plainfield 1 in every 92 in Camden City As of 12/31/12 in the 10 cities in New Jersey with the highest prevalence rate, 1 in every 41 African Americans was living with HIV/AIDS. This includes: 1 in every 31 in Newark 1 in every 32 in Atlantic City 1 in every 39 in Jersey City 1 in every 43 in East Orange 1 in every 44 in Paterson 1 in every 44 in Elizabeth 1 in every 49 in Irvington 1 in every 50 in Trenton 1 in every 66 in Plainfield 1 in every 78 in Camden City Source: NJ Department of Health Division of HIV/AIDS, STD and TB Services, 2012
14 Statewide Coordinated Statement of Need Table 3: New Jersey Adult/Adolescent Incidence Data 2009 SCSN Document (Various Dates) Updated Statistics (December 31, 2012) New Jersey had 1,639 people diagnosed with HIV/AIDS in Of those newly diagnosed with HIV/AIDS, 67% are male and 33% are female. Total New Jersey had 1,666 people diagnosed with HIV/AIDS in Of those newly diagnosed with HIV/AIDS, 76% are male and 24% are female. 12 Race/Ethnicity 2009 SCSN Document (Various Dates) Updated Statistics (December 31, 2010) Fifty-three percent (53%) of those newly diagnosed with HIV/AIDS are Black, non- Hispanic followed by Hispanic (23%) and White, non-hispanic (22%). In 2012, 48% of those newly diagnosed with HIV/AIDS in New Jersey were Black, non-hispanic followed by Hispanic (26%) and White, non-hispanic (24%). Male Female Total Race/Ethnicity No. % No. % No. % White Black Hispanic Asian/Pac. Isl Other/Unknown Total 1, , Source: NJ Department of Health Division of HIV/AIDS, STD and TB Services, 2012
15 SECTION III: NEW JERSEY EPIDEMIOLOGIC PROFILE: DATA COMPARISON Table 3: New Jersey Adult/Adolescent Incidence Data (continued) Mode of Exposure 2009 SCSN Document (Various Dates) The mode of exposure for 47% of those newly diagnosed with HIV/ AIDS in the state of New Jersey was Heterosexual contact, for 23% it was IDU, for 21% it was MSM, for 1% it was MSM/IDU. The remaining (18%) were classified as Other/Unknown. For women, the mode of transmission for IDU was 13%, Heterosexual contact with an IDU was 71% and 17% were classified as Other/Unknown. For men, the mode of transmission for IDU was 12%, for Heterosexual contact with an IDU was 47%, for MSM was 21%, for MSM/IDU was 1% and 18% were classified as Other/Unknown. Updated Statistics (December 31, 2012) Modified Exposure Male Female Total Category No. % No. % No. % MSM IDU MSM/IDU Heterosexual contact with partner(s): IDU bisexual male HIV infection, risk Other/ Unknown partner(s) of Unknown HIV risk Other/Unknown Total # of individuals 1, , Age Group 2009 SCSN Document (Various Dates) Updated Statistics (December 31, 2012) Age Group Number Proportion >1% % % % % Total 1, % Known Age Male Female Total at Diagnosis No. % No. % No. % Over Total 1, , Source: NJ Department of Health Division of HIV/AIDS, STD and TB Services, 2012
16 Statewide Coordinated Statement of Need Table 4: Co-morbid Conditions among PLWHA in New Jersey 2009 SCSN Document Updated Statistics (December 31, 2012) The rate of co-morbid infection with Tuberculosis (TB), per 100,000 cases of AIDS in New Jersey, is 5.5. In New Jersey in 2012, the rate of co-morbid infection with TB per 100,000 cases of HIV was TB-HIV Co-Infection in New Jersey : 14 Year Number Source: NJ Department of Health Division of HIV/AIDS, STD and TB Services, 2012
17 SECTION III: NEW JERSEY EPIDEMIOLOGIC PROFILE: DATA COMPARISON STI Data The STIs monitored by DHSTS are Syphilis (primary; secondary; early latent; late, late latent; congenital), Gonorrhea, Chlamydia and TB. Tables 5 and 6 document the differences in STI and TB rates from the 2009 SCSN Document and 2011 DHSTS data. Table 5: Comparison of STI Rates between 2009 SCSN Document and Current Data 2009 SCSN Document 2011 Data New Jersey has a Syphilis rate of 1.27 per 100,000. New Jersey has a primary and secondary Syphilis rate of 2.4 per 100,000. The state ranks 27th in the nation, below the national rate of 4.6 per 100,000. New Jersey has a Gonorrhea rate of 92.5 per 100,000. New Jersey has a Gonorrhea rate of 54.8 per 100,000. The state ranks 32nd in the nation, below the national rate of 99.1 per 100,000. New Jersey has a Chlamydia rate of per 100,000. New Jersey has a Chlamydia rate of per 100,000. The state ranks 43rd in the nation, below the national rate of per 100, Source: NJ Department of Health and Senior Services, 2011 Table 6: Comparison of TB Rates between 2009 SCSN Document and Current Data 2009 SCSN Document 2011 Data Sixty-six percent (66%) of TB cases in New Jersey occurred in foreign born persons. Seventy-six percent (77%) of TB cases in New Jersey occurred in foreign born persons. (CDC, 2010) TB cases by race/ethnicity 2005: White % Black % Hispanic % Asian % TB cases by race/ethnicity 2010 (Total: 405): White - 9.9% Black % Hispanic % Asian % Source: NJ Department of Health and Senior Services, 2011
18 Statewide Coordinated Statement of Need Trend Update from 2009 SCSN Document Table 7: Health Trends 2009 SCSN Document Trends Updated Statistics The level of new HIV infections is approximately 40% higher than earlier estimates. United States Data suggests that overall HIV incidence is relatively stable. (CDC) New Jersey New Jersey Epidemiologic data suggests that overall HIV incidence is relatively stable. 16 HIV incidence continues to disparately affect some subpopulations (gay/bisexual men of all races and African American men and women) Review of the New Jersey Epidemiologic data from 2006 to 2009 shows no significant change in HIV incidence overall. There was no significant change in incidence in any race/ethnicity group or risk group overall. United States In the United States, gay and bisexual men and other Men who have Sex with Men (MSM) remain the population most heavily affected by HIV in the United States. In the United States, there have been sharp increases in HIV among Asian and Hispanic MSM. The number of HIV diagnoses among each of these subgroups increased by about 140% and 60% respectively between 2009 and New Jersey In New Jersey, there has been a significant decrease in the mode of exposure for IDU (27% in 2009 and 3% in 2012). In New Jersey, there has been a slight decrease in the mode of exposure for Heterosexual contact (39% in 2009 and 32% in 2012). In New Jersey, three has been an increase in the mode of exposure for MSM (20% in 2009 and 30% in 2012). Sources: NJ Department of Health Division of HIV/AIDS, STD and TB Services, 2012 CDC National Center for HIV/AIDS, Viral Hepatitis, STD, and TB Prevention, 2011
19 SECTION III: NEW JERSEY EPIDEMIOLOGIC PROFILE: DATA COMPARISON HIV incidence continues to disparately affect some subpopulations (gay/bisexual men of all races and African American men and women) Table 7: Health Trends (continued) 2009 SCSN Document Trends Updated Statistics United States As of 2011, African Americans are the hardest hit by HIV and Latinos are also disproportionately affected. Possible factors may include: (1) higher proportions of young, Black MSM unaware of their infection than MSM of other racial/ethnic groups; (2) stigma of HIV and homosexuality, which can hinder utilization of HIV prevention services; limited access to health care, HIV testing and treatment; and higher rates of some STIs (e.g., Syphilis) which can facilitate HIV transmission and (3) young, Black gay and bisexual men are also more likely to have older sexual partners (among whom HIV prevalence is high), compared to MSM of other racial/ ethnic groups, and may underestimate their personal risk for HIV. ( docs/hiv-infections pdf) Of the total number of new HIV infections in women in the United States in 2011, 64% occurred in Blacks, 18% in Whites and 15% in Hispanics/Latinas. In 2011, the rate of new HIV infections in the United States among Black women was twenty times that of White women and over five times the rate among Hispanic/Latina women 17 New Jersey In 2012, the highest number of New Jersey women infected with HIV (47%) were reported as having partners of unknown HIV risk. In 2012, the highest number of New Jersey men infected with HIV (40%) were MSM. A high number of infections occur in young people. United States In 2011, the highest number of infections were reported in individuals between the ages of (7,005) followed by (6,485) and (5,389). For those aged 13 and under, there were 166 reported cases of HIV infection. There were 44 cases for individuals aged and 1,953 cases for ages New Jersey In 2012, the highest number of infections were reported for individuals between the ages of (26%) followed by and (25% each). Youth between the ages accounted for only 3% of diagnoses.
20 Statewide Coordinated Statement of Need There are higher rates of sexually transmitted disease. Table 7 - Health Trends (continued) 2009 SCSN Document Trends Updated Statistics United States The rate of Chlamydia infection per 100,000 persons was in 2011 which is an 8% increase since Gonorrhea prevalence in 2011 was per 100,000 persons, a 4% increase from 2010 rates. Young people have higher rates of sexually transmitted disease. Primary and Secondary Syphilis (P&S Syphilis) had a rate of 4.5 per 100,000 persons in 2011, which was unchanged from Though overall prevalence has remained somewhat constant, infections among women are declining where as infections among men (particularly MSM) are increasing. New Jersey From 1999 through 2008, New Jersey: 18 Reported that rates of acute Hepatitis A decreased by 47%. Reported that rates of acute Hepatitis B decreased by 18%. New Jersey ranked 32nd in the nation with 2.6 cases of P&S Syphilis per 100,000 persons in Men are disproportionately impacted (5.1 per 100,000 vs. 0.3 per 100,000 among women). New Jersey ranked 46th in the nation with cases of Chlamydia per 100,000 persons in There is a dramatic increase in teen pregnancy. New Jersey ranked 25th in the nation with 83.6 cases of Gonorrheal infections per 100,000 persons in United States The teenage birth rate declined 25% from , reaching a historic low of 31.3 births per 1,000 teens of years. New Jersey In 2011, New Jersey had the 5th lowest teen birth rate (18.7) in the nation. Sources: NJ Department of Health Division of HIV/AIDS, STD and TB Services, 2012 CDC National Center for HIV/AIDS, Viral Hepatitis, STD, and TB Prevention, 2011 CDC Morbidity and Mortality Weekly Report (MMWR), 2012
21 SECTION III: NEW JERSEY EPIDEMIOLOGIC PROFILE: DATA COMPARISON There are co-occurring epidemics of drug and substance abuse. Table 7: Health Trends (continued) 2009 SCSN Document Trends Updated Statistics United States HIV risk-behaviors were positively related to substance abuse and dependence, length of homelessness episodes and the self-reported need for substance abuse services. (Forney et al. 2007) It is estimated that the increased mortality attributable to substance abuse and other high-risk behaviors led to mean per-person survival losses of 8.33 years, even in the absence of HIV disease. (Losina et al. 2009) New Jersey Though IDU in New Jersey was once a major mode of exposure to HIV infection, there has been a downward trend from in the number of PLWHA exposed through IDU. The number of people living with HIV/AIDS who were exposed through male-to-male sex or Heterosexual contact has continued to increase. HIV incidence among gay and bisexual men has been on the rise since the early 90s and the data suggests a sustained increase in HIV incidence in MSM. About one third of new diagnoses are occurring among young people, aged less than 30 years. United States Gay and bisexual men and other MSM remain the population most heavily affected by HIV in the United States. New Jersey In New Jersey, there has been an increase in the mode of exposure for MSM (20% in 2009 and 30% in 2012). United States Thirty-seven percent (37%) of HIV diagnoses occurred among young people aged less than 30 years in New Jersey Twenty-nine percent (29%) of HIV diagnoses occurred among young people aged less than 30 years in Sources: NJ Department of Health Division of HIV/AIDS, STD and TB Services, 2012 CDC National Center for HIV/AIDS, Viral Hepatitis, STD, and TB Prevention, 2011
22 Statewide Coordinated Statement of Need Table 8: National Trends Identified By the CDC in Trends Identified by the CDC Updated Statistics Data suggests that overall HIV incidence is relatively stable. Benefits of HIV Prevention and Care and Treatment Programs: 20 Research indicates that the growing population of people with HIV and AIDS will lead to significant increases in new HIV infections if current prevention efforts are not intensified. Gay and bisexual men and other MSM remain the population most heavily affected by HIV in the United States. There have been sharp increases in HIV among young, Black MSM. By race and risk group, young, Black MSM are the only population in the United States to experience a statistically significant increase in new HIV infections from The difference between actual and projected HIV incidence in the United States occurred from 1991 to 2006 and resulted in an estimate of approximately 362,000 infections averted, which is within the range of previously published estimates. (Farnham et al, 2010) Recent studies (MMWR, ) show the average cost of treating each infected patient over their lifetime is $367,000. Early diagnosis and linkage into medical care slows the progression from HIV to AIDS and reduces the risk for transmission of the disease. The sooner an individual is tested and enters into medical treatment, the greater the cost savings. Gay and bisexual men and other MSM remain the population most heavily affected by HIV in the United States. (CDC) There have been sharp increases in HIV among young, Black MSM. By race and risk group, young, Black MSM are the only population in the United States to experience a statistically significant increase in new HIV infections from (CDC)
23 SECTION III: NEW JERSEY EPIDEMIOLOGIC PROFILE: DATA COMPARISON Table 9: Housing Trends 2009 SCSN Document Updated Statistics (2010) According to the statewide Point-in-Time count of the homeless that took place in January 2007, nine percent (9%) of homeless individuals in New Jersey have HIV/ AIDS (945). Supportive housing for homeless persons with HIV/AIDS and other chronic illnesses not only improves health outcomes, but also sharply reduces the use of costly emergency and inpatient health care services. Medical cost savings for formerly homeless participants with HIV and other chronic illnesses far exceeded the costs of a housing intervention. Homeless participants living with HIV who secured stable housing reported significant reductions in emergency room visits, hospitalizations, opportunistic infections and trading sex for resources. Housing assistance also decreases health disparities, while reducing overall public expense and making better use of limited public resources. According to the statewide Point-in-Time count of the homeless that took place on January 26, 2011, six percent (6%) of the 12,825 homeless men, women and children counted across the State of New Jersey had HIV/AIDS (652). Homeless respondents were less likely than housed respondents to report good or excellent health, less likely to have a self-reported CD4 count of 200 or above, less likely to have a self-reported undetectable viral load, more likely to have visited an emergency department in the past year, less likely to be taking HIV medications and less likely to have been treatment adherent in the past 48 hours. (Kidder et al, 2007) The findings of this randomized controlled trial demonstrate that a housing and case management program for chronically ill homeless adults reduced hospitalizations and emergency department visits. The magnitude of benefit was large. The most conservative analyses suggests a 29% reduction in hospital days and a 24% reduction in emergency department visits. (Sadowski et al, 2009) It has been estimated that the service reductions reported in this study translate into public cost reductions of $1,300 per person moving into permanent supportive housing per year for the first two years after move-in. (Martinez et al, 2006) Housing status was a significant predictor of health status, health care and emergency department use, use of HIV medications and HIV medication adherence. (Kidder et al, 2007) In a randomized trial, researchers found that housing hospitalized homeless HIV-positive individuals and providing them with intensive case management can increase the proportion surviving with intact immunity and decrease overall viral loads. (Buchanan et al, 2009) Homeless respondents were less likely than housed respondents to report good or excellent health, less likely to have a self-reported CD4 count of 200 or above, less likely to have a self-reported undetectable viral load, more likely to have visited an emergency department in the past year, less likely to be taking HIV medications and less likely to have been treatment adherent in the past 48 hours. (Kidder et al, 2007) 21
24 Statewide Coordinated Statement of Need Table 10: Recently Incarcerated Trends 2011 Statistics New York reported the largest percent of an incarcerated population (5.8%) who were HIV positive or had confirmed AIDS followed by Florida (3.6%), Maryland (2.5%), Massachusetts (2.4%), North Carolina (2.1%) and New Jersey (2.1%). (US DOJ, 2009) In 2008, there were a total of 520 inmates in custody of the state or federal prison authorities in New Jersey and reported to be HIV positive or to have confirmed AIDS. (US DOJ, 2009) Researchers in a four-year study of HIV-infected inmates released from the nation s largest state prison system, found that only five percent (5%) of released inmates filled a prescription for ART medications soon enough (i.e., within 10 days after release) to avoid treatment interruption. Furthermore, only 18% of inmates filled a prescription for ART medications within 30 days of release. Thirty percent (30%) did so within 60 days. (Baillargeon et al, 2009) Researchers found that at least 90% of former inmates experienced a treatment interruption. More than 70% had an interruption that lasted at least 30 days and more than 60% had an interruption that lasted at least 60 days. (Baillargeon et al, 2009) 22 Researchers found that HIV-infected inmates who received formal assistance with the completion and submission of ADDP applications had significantly higher rates of filling an ART prescription on release, compared with inmates who did not receive this service. (Baillargeon et al, 2009) Researchers also found that inmates released on parole had higher rates of filling an ART prescription at 30 and 60 days than those with a standard, unsupervised release. (Baillargeon et al, 2009) African Americans and Hispanics were less likely to have filled an ART prescription at 10 and 30 days after release, compared with non-hispanic Whites. (Baillargeon et al, 2009)
25 SECTION III: NEW JERSEY EPIDEMIOLOGIC PROFILE: DATA COMPARISON Table 11: Economic Trends 2009 SCSN Document Updated Statistics The unemployment rate is rising fast. The state government is grappling with a projected $1.7 billion budget shortfall this year and perhaps, as high as $5 billion next year. The job market has eroded measurably. In the first ten months of 2008 alone, New Jersey lost nearly 7,000 jobs and its unemployment rate rose, according to the state labor department. The state s unemployment rate declined over the month by 0.1%, resulting in a December rate of nine percent (9%). New Jersey s unemployment rate has trended lower over the past several months, dropping in four out of the last five months (NJLWD, 01/19/12). In July 2010, the state s nonpartisan Office of Legislative Services estimated a structural deficit of nearly $10.5 billion for fiscal year That figure represented the difference between projected revenues from existing sources and the amount needed to pay for all spending required by state law and maintain current program levels. New Jersey s unemployment rate has trended lower over the past several months, dropping in four out of the last five months. Preliminary estimates indicate that total nonfarm wage and salary employment in New Jersey increased by 400 jobs in December to a seasonally adjusted 3,881,100, as measured by the United States Bureau of Labor Statistics (BLS) through its monthly employer survey. Private sector employment was lower by 2,000 jobs, while public sector employment rose by 2,400 jobs over the month, due mainly to gains at the local government level (NJLWD, 01/19/12). A preliminary over-the-year analysis shows that from December 2010 to December 2011, private sector employment increased by 39,400 jobs, while public sector payrolls declined by 3,000 (NJLWD, 01/19/12). 23
26 Statewide Coordinated Statement of Need Table 12: Comprehensive Strategy Trends 2009 SCSN Document Updated Statistics According to the CDC s new estimates, communities of color account for a combined total of 65% of the approximately 56,300 new HIV infections occurring in the United States. Seventy-six percent (76%) of New Jersey s newly diagnosed HIV/AIDS population is Black, non-hispanic or Hispanic. According to the CDC, this new estimate is 40% higher than the CDC s earlier estimate of 40,000 infections per year. United States According to the CDC s new estimates, communities of color account for a combined total of 72% of the approximately 50,199 new HIV infections that occurred nationally in New Jersey Seventy-four percent (74%) of New Jersey s newly diagnosed HIV/AIDS population in 2012 was Black or Hispanic. United States Data suggests that overall, HIV incidence is relatively stable. New Jersey 24 New Jersey Epidemiologic data suggests that overall HIV incidence is relatively stable. Review of the New Jersey Epidemiologic data from 2009 to 2012 shows no significant change in HIV incidence overall. Incidence among IDU has decreased significantly between 2009 and There was no significant change in incidence in any other race/ethnicity group or risk group overall. Sources: NJ Department of Health Division of HIV/AIDS, STD and TB Services, 2012 CDC National Center for HIV/AIDS, Viral Hepatitis, STD, and TB Prevention, 2012
27 SECTION III: NEW JERSEY EPIDEMIOLOGIC PROFILE: DATA COMPARISON Unmet Need Estimates for 2010 The Epidemiologic Services Unit of DHSTS is responsible for providing the unmet need data for all Ryan White grantees in New Jersey. Table 13 contains the estimates of unmet need for people living with HIV and AIDS who were diagnosed before 2010 and alive through December 31, 2010 in the State of New Jersey (ehars data as of June 30, 2011). Individuals with HIV and AIDS who were incarcerated or resided in unknown counties at the time of diagnosis are not included in this analysis. Unmet need refers to the population of HIV infected individuals who are aware of their HIV status but are not engaged in adequate HIV related services. This is defined as having at least one HIV care-related viral load test (VL), CD4 count/percent and/or antiretroviral drug within a one-year period. Individuals who had at least one HIV care-related antiretroviral drug, a viral load test and/or CD4 test were considered to have been in care in Data sources used to determine the population in care included: 2010 Antiretroviral drug prescription claims from Medicaid; AIDS Drug Distribution Program (ADDP); General Assistance (GA); Pharmaceutical Assistance for the Aged and Disabled (PAAD); Senior Gold; Viral loads and CD4 counts from ehars; Vital status, demographics and other information from ehars; Social Security Administration Master Death File; United States Department of Health and Senior Services (USDHSS) National Death Index; and New Jersey Vital Statistics records 25 Results from Unmet Need Study for New Jersey: Of the 35,688 people living with HIV/AIDS in New Jersey as of December 31, 2010, 46% (35% of AIDS cases and 59% of HIV cases) show unmet need. Those with unmet need differ by gender, age, HIV/AIDS case status, race/ethnicity, mode of transmission and date of HIV diagnosis. Unmet need is higher for: Males than females; Hispanics than for Black, non-hispanics and White, non-hispanics; IDU, MSM and MSM/IDU than for Heterosexuals; Those aged and 40-49, than for those over 50 and those under 20; and Those diagnosed before 2000, than for those diagnosed between 2000 and Unmet need for primary medical care varies by gender, age, race/ethnicity, risk category, region of residence at the time of diagnosis, HIV/AIDS case status and year of HIV diagnosis. In all regions, as well as statewide, unmet need is greater among those diagnosed with HIV versus those diagnosed with AIDS; Hispanics are more likely to have unmet need in four of the nine planning regions (Atlantic-Cape May region, Cumberland County, South Jersey region and the Newark Eligible Metropolitan Area [EMA]);
28 Statewide Coordinated Statement of Need MSM are more likely to have unmet need in the Atlantic-Cape May region, South Jersey region and the Jersey City Transitional Grant Area (TGA); IDUs are more likely to have unmet need in the South Jersey region, Atlantic-Cape May region and Jersey City TGA; MSM/IDU are more likely to have unmet need in the Bergen-Passaic TGA, Cumberland County, South Jersey region, Middlesex-Somerset-Hunterdon TGA and Newark EMA; Those aged are more likely to be out of care (50% and over) in the Atlantic-Cape May region, Cumberland County, and South Jersey region; and Those aged are more likely to have unmet need in Cumberland County, Jersey City TGA and South Jersey region. Table 13: Unmet Need Trends SCSN Document Updated Statistics The statewide analysis indicated that of the 34,470 people living with HIV/AIDS in New Jersey as of 12/31/07, 49% (36% of AIDS cases and 65% of HIV cases) have unmet need. The statewide analysis indicated that as of 6/30/11, unmet need for New Jersey is 46% (35% of AIDS cases and 59% of HIV cases). Unmet need is higher for Hispanics than for Black, non-hispanics. Unmet need is higher for Black, non- Hispanics than for White, non-hispanics. Unmet need is higher for MSM and IDU, than for Heterosexuals. Unmet need is higher for Hispanics (50%) than for Black, non-hispanics (45%). Unmet need is higher for Black, non-hispanics (45%) than for White, non- Hispanics (44%). Unmet need is higher for MSM/IDU (51%), than for IDU (48%) and MSM (47%). Source: NJ Department of Health and Senior Services, 2011
29 SECTION IV: SERVICE SYSTEM Section IV: Service System Service System Continuum of Care: In the State of New Jersey, the continuum of care for HIV/AIDS encompasses not only the range of services, but the quality of services and the linkages that strengthen service delivery. The goal of DHSTS and the state s nine planning regions is to improve quality and add strategic linkages and collaborations that enable New Jersey to have an effective and efficient service delivery system. The continuum of care is a system of services (for counseling and testing, prevention and education and care and treatment), service linkages and collaborations that ensure a seamless service delivery system. The goal of the system is that services are available, appropriate, accessible and accountable to people living with and affected by HIV/AIDS in New Jersey. Services are prioritized, allocated and funded on a regional level, depending on availability of funding and whether or not the service is funded using Ryan White Parts A, B, C, D or F. Core Services: Core Services refer to those services deemed most necessary to ensure good medical outcomes for PLWHA. Outpatient/Ambulatory Health Services refers to the provision of professional diagnostic and therapeutic services rendered by a physician, physician s assistant, clinical nurse specialist or nurse practitioner in an outpatient setting. Settings include clinics, medical offices and mobile vans where clients generally do not stay overnight. Emergency room services are not considered outpatient settings. Services include diagnostic testing, early intervention and risk assessment, preventive care and screenings, practitioner examination, medical history taking, diagnosis and treatment of common physical and mental conditions, prescribing and managing medication therapy, education and counseling on health issues, well baby care, continuing care and management of chronic conditions and referral to and provision of specialty care (includes all medical subspecialties). Primary medical care for the treatment of HIV infection includes the provision of care that is consistent with the Public Health Service s guidelines. Such care must include access to antiretroviral and other drug therapies including prophylaxis and treatment of opportunistic infections and combination antiretroviral therapies. 27 AIDS Drug Distribution Program (ADDP) is a State administered program authorized under Part B of the Ryan White Program that provides FDA approved, HIV related medications to low income individuals with HIV disease who have limited or no coverage from private insurance, Medicaid, Medicare, Senior Gold, PAAD or additional sources of public funds. AIDS Pharmaceutical Assistance includes local pharmacy assistance programs implemented by Part A or Part B Grantees to provide HIV/AIDS medications to clients. This assistance can be funded with Part A grant funds and/or Part B base award funds. Local pharmacy assistance programs are not funded with ADDP earmark funding. Oral Health Care includes diagnostic, preventive and therapeutic services provided by general dental practitioners, dental specialists, dental hygienists and auxiliaries, and other trained primary care providers. Early Intervention Services (EIS) includes counseling individuals with respect to HIV/AIDS; testing (including tests to confirm the presence of the disease, tests to diagnose to extent of immune deficiency, tests to provide information on appropriate therapeutic measures); referrals; other clinical and diagnostic services regarding HIV/AIDS; periodic medical evaluations for individuals with HIV/AIDS and providing therapeutic measures.
30 Statewide Coordinated Statement of Need Health Insurance Premium and Cost Sharing is the provision of financial assistance for eligible individuals living with HIV to maintain a continuity of health insurance or to receive medical benefits under a health insurance program. This includes premium payments, risk pools, co-payments and deductibles. Home Health Care includes the provision of services in the home by licensed healthcare workers such as nurses and the administration of intravenous and aerosolized treatment, parenteral feeding, diagnostic testing and other medical therapies. Home and Community based Health Services include skilled health services furnished to the individual in the individual s home based on a written plan of care established by a case management team that includes appropriate health care professionals. Services include durable medical equipment; home health aide services and personal care services in the home; day treatment or other partial hospitalization services; home intravenous and aerosolized drug therapy (including prescription drugs administered as part of such therapy); routine diagnostic testing administered in the home and appropriate mental health and developmental and rehabilitation services. Inpatient hospital services, nursing home and other long term care facilities are NOT included. 28 Hospice services include room, board, nursing care, counseling, physician services and palliative therapeutics provided to clients in the terminal stages of illness in a residential setting including a nonacute care section of a hospital that has been designated and staffed to provide hospice services for terminal clients. Medical Case Management (including treatment adherence) are a range of client centered services that link clients with health care, psychosocial and other services. The coordination and follow-up of medical treatments is a component of medical case management. These services ensure timely and coordinated access to medically appropriate levels of health and support services and continuity of care, through ongoing assessment of the client s and other key family members needs and personal support systems. Medical case management includes the provision of treatment adherence counseling to ensure readiness for, and adherence to, complex HIV/AIDS treatments. Key activities include (1) initial assessment of service needs; (2) development of a comprehensive, individualized service plan; (3) coordination of services required to implement the plan; (4) client monitoring to assess the efficacy of the plan and (5) periodic re evaluation and adaptation of the plan as necessary over the life of the client. It includes client specific advocacy and/or review of utilization of services. This includes all types of case management including face to face, phone contact and any other forms of communication. Mental Health Services are psychological and psychiatric treatment and counseling services offered to individuals with a diagnosed mental illness, conducted in a group or individual setting, and provided by a mental health professional licensed or authorized within the State to render such services. This typically includes psychiatrists, psychologists and licensed clinical social workers. Medical Nutritional Therapy is provided by a licensed registered dietitian outside of a primary care visit and includes the provision of nutritional supplements. Medical nutritional therapy provided by someone other than a licensed/registered dietitian should be recorded under psychosocial support services. Substance Abuse Outpatient Treatment is the provision of medical or other treatment and/or counseling to address substance abuse problems (i.e., alcohol and/or legal and illegal drugs) in an outpatient setting, rendered by a physician or under the supervision of a physician or by other qualified personnel.
31 SECTION IV: SERVICE SYSTEM Support Services: Support services are necessary to ensure a comprehensive continuum of care and can include: Case Management (non-medical or community based) includes the provision of advice and assistance in obtaining medical, social, community, legal, financial and other needed services. Non-medical or community based case management does not involve coordination and follow-up of medical treatments, as medical case management does. Child Care services are the provision of care for the children of clients who are HIV positive while the clients attend medical or other appointments or Ryan White Program related meetings, groups or training. Emergency Financial Assistance is the provision of short term payments to agencies or the establishment of voucher programs to assist with emergency expenses related to essential utilities and housing when other resources are not available. Food Bank/Home Delivered Meals include the provision of actual food or meals. It does not include finances to purchase food or meals. Health Education/Risk Reduction is the provision of services that educate clients with HIV about HIV transmission and how to reduce the risk of HIV transmission. It includes the provision of information; including information dissemination about medical and psychosocial support services and counseling to help clients with HIV improve their health status. Housing Services are the provision of short term assistance to support emergency, temporary or transitional housing to enable an individual or family to gain or maintain medical care. Housing related referral services include assessment, search, placement, advocacy and the fees associated with them. Eligible housing can include both housing that does not provide direct medical or supportive services and housing that provides some type of medical or supportive services such as residential mental health services, foster care or assisted living residential services. Legal Services are the provision of services to individuals with respect to powers of attorney, do notresuscitate orders and interventions necessary to ensure access to eligible benefits including discrimination or breach of confidentiality litigation as it relates to services eligible for funding under the Ryan White Program. It does not include any legal services that arrange for guardianship or adoption of children after the death of their normal caregiver. Linguistics Services include the provision of interpretation and translation services. Medical Transportation includes conveyance services provided, directly or through voucher, to a client so that he or she may access health care services. Outreach refers to programs that have as their principal purpose identification of people with unknown HIV disease or those who know their status so that they may become aware of, and may be enrolled in, care and treatment services (i.e., case finding), not HIV counseling and testing nor HIV prevention education. These services may target high risk communities or individuals. Outreach programs must be planned and delivered in coordination with local HIV prevention outreach programs to avoid duplication of effort; be targeted to populations known through local epidemiologic data to be at disproportionate risk for HIV infection; be conducted at times and in places where there is a high probability that individuals with HIV infection will be reached; and be designed with quantified program reporting that will accommodate local effectiveness evaluation. Pediatric Developmental Assessment and Early Intervention Services are the provision of professional early interventions by physicians, developmental psychologists, educators and others in the psychosocial and intellectual development of infants and children. These services involve the assessment of an infant s or child s developmental status and needs in relation to the involvement with the education system including early assessment of educational intervention services. It includes the comprehensive assessment of infants and children, taking into account the effects of chronic conditions associated with HIV, drug exposure and other factors. Provision of information about access to Head Start services, appropriate educational settings for HIV affected clients and education/assistance to schools should also be reported in this category. 29
32 Statewide Coordinated Statement of Need Permanency Planning is the provision of services to help clients or families make decisions about placement and care of minor children after the parents/caregivers are deceased or are no longer able to care for them. Psychosocial Support Services are the provision of support and counseling activities, child abuse and neglect counseling, HIV support groups, pastoral care, caregiver support and bereavement counseling. Includes nutrition counseling provided by a non registered dietitian but excludes the provision of nutritional supplements. Referral for Health Care/Support Services is the act of directing a client to a service in person or through telephone, written or other type of communication. Referrals may be made within the non medical case management system by professional case managers, informally through support staff or as part of an outreach program. Rehabilitation includes services provided by a licensed or authorized professional in accordance with an individualized plan of care intended to improve or maintain a client s quality of life and optimal capacity for self care. Services include physical and occupational therapy, speech pathology and low vision training. 30 Respite Care is the provision of community or home based, non medical assistance designed to relieve the primary caregiver responsible for providing day to day care of a client with HIV/AIDS. Treatment Adherence Counseling is the provision of counseling or special programs to ensure readiness for, and adherence to, complex HIV/AIDS treatments by non medical personnel outside of the medical case management and clinical setting. Ryan White Part A Funded Services In the State of New Jersey, the planning bodies for Part A (Bergen-Passaic TGA, Jersey City TGA, Middlesex- Somerset-Hunterdon TGA, Newark EMA [including Essex, Morris, Sussex, Union and Warren Counties] and Philadelphia EMA [including Burlington, Camden, Gloucester, and Salem Counties]) have funded the following services within their regions: Primary HIV/AIDS Medical Care; Substance Abuse Treatment and Counseling; Nutritional Services; Dental Care; Mental Health Therapy and Counseling; Case Management; Housing; Transportation; Health Education and Risk Reduction; Outreach; Direct Emergency Assistance; Legal Assistance and Client Advocacy; Permanency Planning; Psychosocial Support; Prison Discharge Planning; Child Care; and Support Groups.
33 SECTION IV: SERVICE SYSTEM Ryan White Part B Funded Services In the State of New Jersey, DHSTS funds the following services within the Part B regions (Atlantic-Cape May, Cumberland, Mercer and Monmouth-Ocean): Outpatient and Ambulatory Medical Care; Housing; Oral Health; Mental Health; Medical Nutritional Therapy; Medical Case Management; Substance Abuse Treatment; Legal; Medical Transportation; Outreach; Psychosocial Support; and Treatment Adherence Counseling There are a total of 30 contractors who were funded to provide 12 services in FY2011. There were 17 grants, 3 Letters of Agreement (LOA) and 10 HIV Home Care Program LOAs. Ryan White Part C Funded Services 31 In New Jersey there are 10 Part C locations in urban centers with high concentrations of at-risk population groups including: VNA of Central Jersey Community Health Center, Red Bank; The Cooper Health Systems, Camden; University of Medicine and Dentistry in New Jersey (UMDNJ), Newark; St. Joseph s Hospital and Medical Center, Paterson; St. Francis Medical Center, Trenton; Hoboken Municipal Hospital Authority, Hoboken; Newark Community Health Centers Inc., Newark; St. Michael s Medical Center, Newark; UMDNJ, Robert Wood Johnson Medical School, Piscataway; and Neighborhood Health Services Corporation, Plainfield Part C Services include: Risk reduction counseling on prevention, antibody testing, medical evaluation and clinical care; Antiretroviral therapies, protection against opportunistic infections, ongoing medical, oral health, nutritional, psychosocial and other care for HIV-infected clients; Clinic based case management to ensure access to services and continuity of care for HIV-infected clients; and Attention to other health problems that occur frequently with HIV infection including TB and substance abuse.
34 Statewide Coordinated Statement of Need Ryan White Part D Funded Services The New Jersey Family Centers HIV Care Network (Part D Network) service the entire State of New Jersey. There are seven sites in the network including: UMDNJ, Francois-Xavier Bagnoud Center, Newark; Newark Beth Israel Medical Center, Newark; Cooper University Medical Center, Camden; Robert Wood Johnson Medical School, New Brunswick; Jersey City Medical Center, Jersey City; St. Joseph s Hospital and Medical Center, Paterson; and Jersey Shore University Medical Center, Neptune. Part D Services include: 32 Primary Medical Care; Support Services; Transportation; Child Care; HIV Specialty Care; Referral to Subspecialties; Mental Health; Gynecology services/prenatal care; Dental care, Hepatitis and TB screening; Laboratory tests; Treatment Adherence; Nutrition Counseling; Access to clinical trials and research; Inpatient Care; Immunizations; Co-located mother/child clinics; and Comprehensive HIV case management services. Ryan White Part F Funded Services The New York/New Jersey AIDS Education and Training Center (NY/NJ AETC) at the Columbia University Mailman School of Public Health funds five Local Performance Sites in New Jersey including: ID Care Associates, Hillsborough; Raritan Bay Medical Center, Perth Amboy; UMDNJ, François-Xavier Bagnoud Center, Newark; UMDNJ, Newark and Atlantic County; and Garden State Infectious Diseases Associates, Voorhees. This funding provides education and training support for: (1) physicians; (2) nurse practitioners; (3) nurses; (4) pharmacists; (5) oral health professionals and (6) others in the care and treatment of PLWHA. This funding primarily supports intensive clinical training and clinical consultation in the care and treatment of PLWHA.
35 SECTION V: SCSN HRSA REQUIREMENTS Section V: SCSN HRSA Requirements A. Description of Populations with HIV/AIDS (including a state epidemiologic profile) New Jersey 2012 Epi Profile Overview: Data was provided by the Department of Health and Senior Services, Division of HIV, STD and TB Services (DHSTS) Epidemiologic Services Unit to the New Jersey HIV/AIDS Planning Group (NJHPG). New Jersey ranks 11th among the states (including the District of Columbia) in the rate of HIV (not AIDS) infection among adults and adolescents in New Jersey also ranks fifth in the rate of adults and adolescents living with HIV in As of December 31, 2012, 77,828 cumulative HIV/AIDS cases have been reported in New Jersey including 1,374 pediatric cases (those <12 years of age) and 3,917 cases reported among inmates. More than half (41,842) of the cumulative cases have died, leaving 36,648 persons living with HIV/AIDS in New Jersey (including 1,822 inmates). HIV/AIDS by Race/Ethnicity Black/African Americans and Hispanics comprise just under one third (32.7%) of the population of New Jersey but account for 76% of Persons Living with HIV/AIDS (PLWHA). However, the disparity of HIV/AIDS among Black/African Americans and Hispanics relative to the population has been consistent in recent years. Disparities in HIV infection among Black/African Americans relative to the population are greater for females compared with males. The rate of HIV/AIDS per 100,000 population among Asian/Pacific Islanders in New Jersey remains the lowest by race/ethnicity among all groups including Whites, even though they represent almost nine percent of the total population. Hudson County, followed by Essex and Middlesex Counties, has the largest number of Asian/Pacific Islanders living with HIV/AIDS as of Essex County has the highest rate of HIV/AIDS for Asian/Pacific Islanders. 33 HIV/AIDS by Gender New Jersey ranked sixth among states in the rate of female AIDS diagnoses in Thirty-one percent (31%) of cumulative AIDS cases in NJ through 2011 are female compared to only 20% nationally. Although both the prevalence of HIV/AIDS among females and the percentage of cases diagnosed in recent years in New Jersey remains higher than the national average, both are declining. In recent years, about one-quarter of new AIDS diagnoses nationally are in females. In New Jersey, 25.5% of HIV/AIDS diagnoses in 2012 were female. As of December 31, 2012, 34% of persons living with HIV/AIDS in New Jersey are female. Nearly four out of five females living with HIV/AIDS are women of color.
36 Statewide Coordinated Statement of Need HIV/AIDS by Exposure Mode The percentage of HIV/AIDS diagnoses among Injection Drug Users (IDU) has decreased significantly. In 2000, 42% of new cases were attributed to IDU compared to only 3% in This is half the share of national HIV/AIDS diagnoses among IDU which was about 6% in Between 2000 and 2012 the percentage of diagnoses of HIV/AIDS among Men who have Sex with Men (MSM) increased from 23% to 30%. This is far lower than the national share of HIV/AIDS diagnoses among MSM which was more than 78% in The percentage of diagnoses of HIV/AIDS with High-Risk Heterosexual contact exposure has remained relatively constant, accounting for 30% of diagnoses in 2000 and 32% of those in This is almost triple the national share of HIV/AIDS diagnoses due to High-Risk Heterosexual contact which accounted for 12% of new cases in HIV/AIDS by Age More than two-thirds (67%) of individuals living with HIV/AIDS are persons aged 45 or older. 34 Between 2000 and 2012, there were shifts in age at HIV or AIDS diagnosis. Diagnoses among persons ages decreased from 74% in 2000, to 50% in In contrast, diagnoses for persons aged 49 and older increased during this time period. The most dramatic change in diagnoses by age group was seen among persons Diagnoses among this group more than tripled, rising from 9% in 2000 to 29% in Pediatric HIV/AIDS Cases New Jersey ranks seventh among the states in the estimated rate of children diagnosed with HIV infection in New Jersey also ranks third in the estimated cumulative number of AIDS cases among children as of Perinatal transmission has remained constant at around 3% (varying from 2-4%) since HIV/AIDS by Locality The overall HIV/AIDS prevalence rate as of December 31, 2012 is per 100,000 population in New Jersey. The overall rate of new HIV/AIDS diagnoses is 17.8 per 100,000 population in Prevalence is highest in Essex and Hudson Counties. More than 12 of every 1,000 persons in Essex County are living with HIV/AIDS as of December 31, Cities with the highest prevalence are Newark and East Orange respectively. More than 5% of the population of East Orange and Newark are living with HIV/AIDS as of HIV/AIDS prevalence is ten times higher in these cities than the statewide rate. The ten impact cities in New Jersey, in order of HIV/AIDS prevalence, are: (1) Newark; (2) East Orange; (3) Atlantic City; (4) Irvington; (5) Paterson; (6) Jersey City; (7) Trenton; (8) Plainfield; (9) Camden and (10) Elizabeth.
37 SECTION V: SCSN HRSA REQUIREMENTS Trends in HIV/AIDS Prevalence As of 2012, 53% of those living with HIV/AIDS are Black, non-hispanic followed by Hispanic (23%) and White, non-hispanic (22%); One in every 240 New Jersey residents is living with HIV/AIDS; One in every 657 White, non-hispanics is living with HIV/AIDS; One in every 185 Hispanics is living with HIV/AIDS; One in every 60 Black, non-hispanics is living with HIV/AIDS; Sixty-seven percent (67%) were age 45 or older; Twenty percent (20%) were exposed by IDU, 40% by heterosexual contact and 23% by MSM. Trends in National HIV/AIDS Incidence The annual number of new infections from 2008 to 2011 was stable overall with an estimated 50,199 new infections in the United States in 2011; Although the annual number of infections was stable from 2008 to 2011, there was a 9% increase in HIV incidence among people aged 13-29; The number of diagnoses of HIV among African-American MSM increased 24% from 2009 to A copy of the New Jersey Epidemiologic profile may be found in Appendix III. B. Description of Needs that Obstruct Access to Care for HIV Positive Individuals In June 2010, the Issues Committee held a series of six Town Hall meetings throughout New Jersey as part of a statewide gap analysis. The purpose of these meetings was to gather input from individuals in regional forums to address the HRSA mandate for the Early Identification of Individuals living with HIV/AIDS (EIIHA). HRSA Mandate: The mandate, disseminated in December 2009, calls for Part A Planning Councils to develop strategies for identifying those with HIV/AIDS who do not know their status, making them aware of their status and referring them into care. As early identification of persons who are unaware of their HIV status is linked with HIV prevention activities, HRSA called for collaboration with existing planning bodies to develop a strategy that will make persons aware of their HIV status. As part of the gap analysis required by the CDC, the NJHPG implemented regional Town Hall meetings to address the mandate for statewide planning purposes. The NJHPG held two Town Hall meetings in each of the three geographic regions of New Jersey: Northern Jersey (Newark and Hackensack); Central Jersey (New Brunswick and Trenton); and Southern Jersey (Atlantic City and Camden).
38 Statewide Coordinated Statement of Need Recruitment for the Town Hall meetings was aimed at two populations identified in the HRSA mandate: (1) individuals who do not know their HIV status and (2) individuals who are HIV+ but are not currently accessing HIV care. To recruit from these populations, the NJHPG marketed the Town Hall meetings through distribution of fliers (in English and Spanish) to non-hiv service providers, homeless shelters, soup kitchens, municipalities and county agencies. NJHPG members from each of the regions took the lead in recruitment efforts. The NJHPG also requested that brochures and fliers from agencies providing HIV counseling and testing, Ryan White care and treatment services, syringe access services and HIV prevention services throughout the state be available for distribution at the meetings. Town Hall Meeting Questions: Over the course of several months, the Issues Committee developed the following questions to address the HRSA mandate: 1. Why do you think people do not go for HIV Testing? 2. Where would you send folks to get HIV tested and other health information? For example: HIV Care, Syringe Access Programs (SAPs), STI, TB, etc. 3. Why do individuals in your community, who are HIV positive, don t get treatment for their HIV? 4. Do you have any ideas how to help us get people HIV tested and into HIV care? 36 The questions were translated into Spanish and Spanish language interpreters were available at each Town Hall meeting. Town Hall Meeting Results Stigma continues to be a barrier for HIV testing and care. Contributing Factors: Specific sites are known as places where people with AIDS go for services. Lack of agency staff to provide services in the community. Stigma exists within some HIV service agencies and as a result, clients are not treated with dignity and respect. Misconceptions in the community surrounding HIV positive individuals still exist. People are afraid that once diagnosed they would lose home, job, friends and family. Potential Solutions: Increased education and training opportunities for agency/hospital staff and the general public. Train providers to help combat stigma and promote HIV testing and HIV care and treatment in their own communities. Organizations and groups that encourage stigmatization should be challenged by citizen groups and governmental agencies. Disseminate information the community that taking HIV medication will not cause death (as happened in the early days of the epidemic when there were fewer HIV medications and people were diagnosed in the later stages of AIDS).
39 SECTION V: SCSN HRSA REQUIREMENTS Use patient navigators to help individuals through the HIV testing process and walk them through potential barriers within the HIV care system. Provide better signs at testing and care and treatment facilities to help individuals navigate through the building. Provide alternate hours and locations for HIV testing. Put the HIV/AIDS hotline number on bus and train schedules to market HIV testing. No statewide HIV testing marketing plan to make people aware that rapid testing only takes 20 minutes. Contributing Factors: There is no statewide marketing plan to advertise rapid testing. HIV is no longer considered an emergency and does not attract media attention. Potential Solutions: Develop a statewide marketing plan to advise people that HIV testing is easy, confidential and FREE. Develop a general media campaign in the state to make communities aware of HIV care and treatment services. Develop and promote culturally competent HIV education and testing events. Develop media messages for private MDs about HIV testing sites in their area as well as promoting universal HIV testing as part of routine care. 37 General lack of consumer education on HIV transmission and subsequent services. Contributing Factors: The general public still fears people who are HIV positive. People are afraid of knowing their HIV status and are fearful about what treatment entails. Potential Solutions: Use HIV positive individuals in providing education to consumers. Dispel fears of HIV testing and treatment. Staff should be trained and knowledgeable in newest medication regimens and treatment advances. Provide bilingual HIV testing services by culturally competent staff.
40 Statewide Coordinated Statement of Need STI clinics and HIV testing sites have lines for services and attract public attention. Contributing Factors: Only a limited number of people can be brought into the building at one time to be tested in some of the STI clinics and health departments. Lines often form outside of buildings that provide HIV testing. Potential Solutions: Conduct HIV testing at satellite sites, other than mobile vans, in the evening hours (after 5:00 p.m.) in locations that are convenient for the consumer. Use case managers or patient navigators to assist in alleviating red tape which causes delays in service provision. 38 Perceived lack of confidentiality. Contributing Factors: At each Town Hall meeting, participants described their city as a small community where family and friends are part of the HIV testing staff or work in clinics where testing occurs. Community agency staff members encourage testing and care outside of New Jersey when clients indicate they are afraid their confidentiality will be breached. Potential Solutions: Build collaborations that support interagency team building and highlight the importance of consumer confidentiality. Quality assurance measures are lacking. Contributing Factors: Some staff appear judgmental to clients. Programs are not aware of the barriers that clients face when accessing their services. Potential Solutions: Create surveys or forms that consumers can use to provide input regarding the services they receive. Create a report card for services based on consumer surveys and assessment tools.
41 SECTION V: SCSN HRSA REQUIREMENTS C. Outreach/Referral/Linkage to Care For Those Who Are Positive and Not in Care Referrals and Linkages: Referring HIV+ individuals to HIV prevention and care services is essential. Providing HIV testing without referral to services is not beneficial to the individual. All DHSTS funded programs are contractually required to develop linkage agreements with local service providers and provide referrals for medical care support services and prevention services for newly diagnosed HIV positive persons and high-risk negatives. All medical care appointments must be verified and verification procedures must be on record in each agency. This linkage and verification is included in the legal agreement between DHSTS and its funded HIV testing sites. Navigators will follow-up with newly diagnosed clients to ensure their appointments were kept. If the individual does not attend the initial appointment, the navigator will work with them to provide another referral or to make another appointment at an appropriate treatment facility. If the patient signs a medical records release form, their test results will be forwarded to the provider. Appointments and referrals for additional services such as mental health, substance abuse, Hepatitis and STI testing, housing and support services are also provided to the individual. Referrals and Linkages for Special Populations Incarcerated: Incarcerated individuals are referred to staff physicians for additional testing and care and treatment services. Counselors located in the prison provide individualized risk reduction and prevention counseling. Upon discharge, appointments for care and treatment services are made to an HIV clinic or private physician and to community organizations for prevention services. Counselors provide follow-up to ensure appointments are kept. For high-risk negative individuals, appointments to community organizations to promote safer behaviors will be provided. If the individual does not attend the initial appointment, the counselor will work with them to make another appointment for HIV care and treatment and prevention services. 39 Discharge Planning in FY2012: The Minority AIDS Initiative (MAI) has provided funds for a service initiative for discharge planning and patient navigator follow-up to the post-incarcerated population. New Jersey sees a disproportionate rate of incarceration among minority populations. Minority populations are also disenfranchised and socially marginalized. Testing data indicates that up to 3% of the incarcerated population is HIV+. When discharged, this population returns to their former communities without a connection to medical attention, supportive services or preventative care. This unique initiative was designed, implemented and funded where applicable in order to reach the post-incarcerated population and engage them in services. The discharge planning program, implemented in mid-2009, continues to be an effective modality in engaging and retaining the recently incarcerated population in care. This initiative targets known HIV positive, minority inmates. When the prison officials announce that this program is offered, no HIV+ prisoner about to be discharged is turned away. The program links pre-discharged, seropositive inmates, 70% of whom are minorities, with medical care and other supportive services in their communities upon release from prison. They are followed in the community for up to six months, postdischarge, to ensure compliance with medical services. The intent is to bridge the inmates successful reentry into the community and to actively support medical compliance and safe behaviors during this critical reintegration period. MAI funds are only one source of funding for this statewide program. Funds are allocated from a variety of sources including Ryan White Parts A and B, prevention, general state and private funds. All of New Jersey s nine Ryan White planning regions have prison discharge planning built into their comprehensive care programs and must allocate funding towards this initiative as part of their continuum of care. Inmates are provided with appointments for services and signed up for ADDP, while still incarcerated, to facilitate care upon release.
42 Statewide Coordinated Statement of Need During the last twelve month period of MAI funding, 127 inmates continued with discharge planning services, 76 new inmates were admitted into the program and 17 were lost to follow-up. Of those inmates, 39 were discharged into the community and were followed for up to six months by the Discharge Planner to ensure that they were linked to services and remained in care. IDUs: IDUs need specialized programming to engage them into HIV care and treatment and prevention services. DHSTS developed the Access to Reproductive Care and HIV Services (ARCH) Nursing program to decrease the rate of perinatal HIV transmission by identifying and immediately linking all HIV infected pregnant IDUs to prenatal care and drug treatment. It is a nurse-led initiative, based on the Program Collaboration and Service Integration (PCSI) model that offers HIV prevention, health promotion, reproductive health services and linkages to medical care through all five urban community based SAPs in New Jersey. The SAPs are located in Atlantic City, Camden, Newark, Jersey City and Paterson with easy access to Part B and Part D funded medical care and other services. DHSTS also provides on-site rapid-rapid HIV testing at all five SAPs. The ARCH Nursing Program integrates Hepatitis B (HBV) and Hepatitis C (HCV) testing, STI testing and treatment for Gonorrhea and Chlamydia, TB screening, sexual risk harm reduction education, IDU harm reduction education, drug treatment assessment and referral, overdose prevention, wound evaluation and adult immunizations. 40 HIV Positive Individuals: DHSTS also offers Prevention with Positives (PwP) programming for persons newly diagnosed with HIV disease. PwP programming is based on the model of assisting those who are already infected to reduce risk behaviors that can transmit HIV, in addition to engaging and retaining those individuals in care. New Jersey has a long and well-established track record of providing science-based HIV PwP services. DHSTS first implemented its PwP initiative in 1999 to reduce infections through risk-reduction behavioral and counseling interventions, referral for Hepatitis A and B vaccinations and Hepatitis C testing and linkage of HIV positive clients to care and treatment networks. PwP programming employs a variety of critical components of behavioral change models such as: (1) increased HIV knowledge base; (2) increased risk reduction skills, communication and negotiation skills and (3) increased self-esteem and support for change efforts. D. Description of Individuals Who are Unaware of Their HIV Status DHSTS is committed to identifying individuals who are unaware of their HIV status as a component of the test and treat model to link individuals into HIV care and treatment and prevention programming. Of those living with AIDS in the United States, New Jersey is fifth in cumulative AIDS cases, third in cumulative pediatric AIDS cases and has one of the highest proportions of women living with AIDS. The identification of HIV positive individuals and their immediate linkage into medical services and prevention interventions correlates into saving on long term health costs for New Jersey. Recent studies (MMWR, ) show the average cost of treating each infected patient over their lifetime is $367,000. Early diagnosis and linkage into medical care slows the progression from HIV to AIDS and reduces the risk for transmission of the disease. The sooner an individual is tested and enters into medical treatment, the greater the cost savings. In compliance with the National HIV/AIDS Strategy (NHAS), DHSTS goal is to make all individuals aware of their HIV status. The objectives of this effort are to: (1) test individuals as part of routine medical care; (2) inform individuals of their HIV status; (3) link those who tested positive into care within eight hours or the next business day; (4) retain infected persons in care and (5) reduce the transmission of HIV disease. To reach these objectives, DHSTS is: (1) offering routine HIV testing in a variety of clinical and non-clinical venues; (2) testing using a Rapid-Rapid Testing Algorithm (RTA) (Appendix IV) so results are known within 20 minutes and (3) providing test results prior to the individual leaving the testing site. For individuals who are HIV
43 SECTION V: SCSN HRSA REQUIREMENTS positive, the goal is to link them into medical services within eight hours or the next business day. For individuals who test negative, the goal is to refer and link them into HIV prevention services. All testing sites use the Immediate Verification Program, where a point-of-care reactive rapid HIV test is verified with a second point-of-care rapid HIV test from a different manufacturer. The use of the RTA strengthens the state s effort in promoting testing as a part of routine health care. With rapid-rapid testing, positive test results are confirmed in less than 20 minutes. If an individual has two reactive test results, they are immediately linked to care, within eight hours or the next business day. The rapid-rapid testing strategy in New Jersey was initially targeted at locations showing a high prevalence of HIV/AIDS in venues used by a large number of individuals. In response to the National HIV/AIDS Strategy for the United States and the High-Impact HIV Prevention Strategy (from the CDC), DHSTS will be making a concentrated effort to test and treat in the following communities to reduce the rate of infection: Gay and Bisexual Men; African Americans; Hispanics/Latinos; IDU; and Transgender Individuals. 41 Use of the rapid-rapid testing strategy has also been proven to be a cost saving measure for the State of New Jersey. Before 2009, New Jersey publicly funded counseling and testing sites that used a single rapid test, followed by a Western Blot (WB) for confirmation. Using this method, 75% of the confirmed positive clients returned to receive test results. In an effort to improve the client notification rate at these centers, DHSTS implemented an RTA using a second, different rapid test to verify a preliminary positive. In 2008, 215 out of 247 clients with positive rapid HIV test results were confirmed positive by a WB. Ninety percent (90%) of clients were notified in an average of 11.4 days after their original test. In 2009, 152 out of 170 clients with one positive rapid test had a confirmatory second positive rapid test and were notified on the same day. The conclusion of the study indicated that the cost-effective strategy of achieving 100% notification of newly HIV positive clients happens 11.4 days earlier compared to standard testing. The cost of confirming a rapid test with a WB was $ and was lowered to $44.16 when using the RTA (Stevinson, K.; Martin, E.G.; Marcella, S.; and Paul, S., 2001). There are currently 29 state-funded counseling and testing programs in 18 county locations and more than 170 state registered sites where a person can be tested. In addition to traditional testing sites and private facilities, statefunded testing is currently available in non-traditional venues including: (1) college health centers; (2) community based organizations (CBOs); (3) drug treatment centers; (4) faith-based institutions; (5) halfway houses; (6) private health care providers; (7) senior facilities; (8) homeless shelters; (9) STI clinics; (10) TB clinics; (11) urgent care clinics; (12) juvenile detention centers and (13) runaway shelters. These innovative, non-traditional venues are part of DHSTS coordinated efforts to make all individuals aware of their HIV status.
44 Statewide Coordinated Statement of Need E. Needs of Special Populations Homeless: Individuals who are homeless have an increased need for HIV care and treatment and HIV prevention services. To address the special needs of this target population, New Jersey has six drop-in centers with special services for the homeless, sex workers and IDUs. In an effort to reduce the number of infections involving HIVinfected high-risk populations, drop-in centers offer the following HIV prevention services: street outreach to provide HIV prevention information, resources and support to targeted high-risk populations (IDUs, homeless and sex workers); individual level HIV prevention interventions (e.g., risk reduction counseling, condom and communication skills-building education) for clients who access the drop-in center; one-on-one prevention case management sessions for referred HIV positive and/or high-risk individuals, either through the drop-in center or through street outreach; HIV counseling and testing services for clients whose HIV status is unknown; and mental health counseling. 42 IDUs: The sharing of needles and other drug paraphernalia has been a major risk factor related to the transmission of HIV in the State of New Jersey. IDU accounted for more than 26% of HIV/AIDS cases in New Jersey in DHSTS and statewide planning groups have long recognized the need for comprehensive HIV prevention interventions for substance abusers. Interventions include addressing drug-related and high-risk sexual behaviors that put both IDUs and their partners at risk. IDUs must be provided the information, skills and support necessary to reduce their HIV risk. The use of sterile needles and syringes remains the safest, most effective approach for limiting HIV transmission for IDUs and their partners. To minimize the risk of HIV transmission, IDUs must be advised to always use sterile injection equipment; warned never to reuse needles, syringes and other injection equipment; and told that using syringes that have been cleaned with bleach or other disinfectants is not as safe as using new, sterile syringes. Strategies for HIV prevention for IDUs should include: providing access to SAPs; using community outreach programs to reach drug users on the streets; improving access to high quality substance abuse treatment programs; instituting HIV prevention programs in jails and prisons; providing health care for HIV-infected IDUs; and making HIV risk-reduction counseling and testing available for IDUs and their sex partners. Adolescents: There are a wide variety of behaviors that place adolescents are high-risk for contracting HIV including: Early Age of Sexual Initiation: The CDC s 2009 National Youth Risk Behavior Survey (YRBS) reported that many adolescents begin having sexual intercourse at an early age: 46% of high school students have had sexual intercourse and 5.9% reported their first sexual intercourse before the age of 13. Adolescents with older sex partners may be at increased risk for HIV. Effective HIV education needs to take place before adolescents engage in risky sexual behaviors.
45 SECTION V: SCSN HRSA REQUIREMENTS Male-to-Male Sex: Young gay, bisexual and other MSM, especially African American and Latinos, have high rates of new HIV infections. Young MSM (YMSM) are more likely to be unaware of their HIV infection and may be at high-risk because they have not had access to effective HIV interventions or prevention education. YMSM may also have increased risk factors for HIV (such as risky sexual behaviors) due to isolation and lack of support. Sexually Transmitted Infections (STIs): The presence of an STI greatly increases a person s likelihood of acquiring or transmitting HIV. Some of the highest STI rates in the country are among young people, especially young people of minority races and ethnicities. Substance Use: Adolescent substance users are more likely to engage in high-risk behaviors such as unprotected sex, when they are under the influence of drugs or alcohol. In addition, many YMSM are runaways, homeless or exchange sex for drugs, money and/or shelter increasing their risk of infection. Adolescents need culturally competent, age-appropriate information about HIV. This information should include: (1) reducing risk factors; (2) negotiating less risky sexual behaviors with one s partner and (3) the importance of HIV testing and where to get tested. Transgender: Transgender individuals are among the special populations at highest risk for HIV infection. Due to the lack of surveillance data being collected for this population, there is little information. Data from CDCfunded HIV testing programs show high percentages of newly identified HIV infections among transgenders. In 2009, about 4,100 of 2.6 million HIV testing events were conducted with someone who identified as transgender. Newly identified HIV infection was 3% among transgenders compared with 0.9% for males and 0.3% for females. Among transgender persons, the highest percentage of newly identified HIV infection was among Blacks (4%) and Hispanics (3%). More than half (52%) of testing events with transgender persons occurred in non-clinical settings. 43 There are many factors that contribute to the challenges of HIV prevention and HIV care and treatment for transgender individuals including: (1) difficulty in identifying individuals who are transgender without the use of a two-step data collection process (asking for sex assigned at birth and current gender identity); (2) high levels of drug and alcohol abuse in this population; (3) discrimination and social stigma leading to a lack of housing and health care and (4) participation in high-risk activities such as being a sex worker. The current version of ehars (November 2011) has the capacity to record transgender-specific information. Issues in tabulation of transgender data include: (1) lack of estimates of the size of the transgender population; (2) small cell sizes and (3) current HIV risk transmission categories do not collect data on the transgender population. However, the CDC has promised a Guidance for National HIV Surveillance Program: Working with Transgender- Specific Data that will be reviewed for inclusion in future reporting. F. Shortfalls in the Healthcare Workforce Gaps in Dental Care: Gaps in dental care for PLWHA have been identified in Ryan White funded needs assessments and priority setting processes throughout the State of New Jersey. Consumers continue to rate dental care as a top unmet need in HIV care and treatment. Having an adequate number of dentists available to provide dental care is vital, as private dental coverage is not an option for the majority of PLWHA and many dentists do not accept Medicaid clients. Another identified barrier is the lack of trained dentists who are willing to work with PLWHA. Trying to get an appointment in the limited pool of dental care providers is an additional barrier to accessing dental care which is a critical component of HIV care.
46 Statewide Coordinated Statement of Need Lack of HIV Care Providers Accepting Medicaid: PLWHA are finding it increasingly challenging to locate physicians and dentists who are willing to accept Medicaid patients. Payments to medical care providers are being decreased, while the number of patients enrolled in Medicaid continues to grow. Without a means to access care, many PLWHA may not seek out care, have longer waiting times for appointments or use hospital emergency rooms as their means of medical care. For physicians and dentists, low Medicaid reimbursement rates have long been an economic disincentive to serving low-income individuals. However, enrollment in Medicaid and other public programs has continued to increase while the amount of federal support for these programs continues to decline. G. A Description of How Input was Incorporated into the SCSN Document 44 The NJHPG worked closely with DHSTS to produce the SCSN Document for submission to the Health Resources and Services Administration (HRSA) as part of the Ryan White HIV/AIDS Treatment Extension Act of 2009 (PL111-87, October 30, 2009), Part B planning requirements. The NJHPG s HIV/AIDS Issues Committee (Issues Committee) was assigned to oversee the development of the document by the NJHPG Executive Committee. NJHPG support staff (Rutgers University Edward J. Bloustein School of Planning and Public Policy [EJBSPPP]), HIV Prevention Community Planning Support and Development Initiative (HPCPSDI) worked with the committee to develop an outline and timeline for completion of the document. Appendix I documents the names, affiliations and geographic area(s) of HIV/AIDS involvement of individuals who participated in the development of the SCSN Document at the planning level (Issues Committee) and/or at the review and ratification level (full NJHPG membership). Both the Issues Committee and the NJHPG have members who represent HIV prevention; Ryan White Parts A, B, C, D, and F; HIV+ consumers and members of DHSTS staff.
47 Appendix I APPENDIX I NJHPG Members as of May 17, 2012 HIV/AIDS Issues Committee Members as of May 17,
48 Statewide Coordinated Statement of Need NJHPG Members as of May 17, 2012 First Name Last Name Affiliation Geographic Area of HIV/AIDS Involvement 1 Mark S. Anderson Buddies of New Jersey Inc. Bergen-Passaic TGA, Part A 2 Jaime Betancourt Hyacinth AIDS Foundation Statewide 46 3 Eileen E. Birk St. Francis Medical Center Mercer County, Part B 4 Danielle Bush 5 Jerry C. Dillard North Jersey Community Research Initiative Coalition on AIDS of Passaic County NEMA, Part A 6 Deloris Dockrey Hyacinth AIDS Foundation Statewide 7 Loretta Dutton Division of HIV, STD and TB Services 8 Jean Haspel AtlantiCare Infectious Disease 9 Lourdez Hernandez 10 Jeanine Jones 11 Polly Jones N/A 12 Eddie Jumper 13 Carmen Lopez 14 Roseann Marone 15 Dwight Peavy 16 Elizabeth Perez 17 Shannon Preston New Jersey Association on Corrections AIDS Resource Foundation for Children/St. Clare s Social Services North Jersey Community Research Initiative Puerto Rican Organization for Community Education and Economic Development University of Medicine and Dentistry in New Jersey-Robert Wood Johnson Medical School Newark EMA HIV Health Services Planning Council Hudson County HIV Planning Council Visiting Nurse Association Health Group Bergen-Passaic TGA, Part A Statewide Atlantic-Cape May Counties, Part B Statewide NEMA, Part A Middlesex-Somerset-Hunterdon TGA, Part A NEMA, Part A NEMA, Part A Statewide; Middlesex-Somerset- Hunterdon TGA, Part A NEMA, Part A Hudson County TGA, Part A Statewide
49 Appendix I NJHPG Members as of May 17, 2012 First Name Last Name Affiliation Geographic Area of HIV/AIDS Involvement 18 Donald Ralph N/A Hudson County TGA, Part A 19 Dennis Rivera Check-Mate Inc. 20 Joy Robinson University of Medicine and Dentistry in New Jersey-Robert Wood Johnson Medical School, Eric B. Chandler Health Center 21 Leslie Roca-Soto South Jersey AIDS Alliance 22 Frank Ruiz N/A Monmouth/Ocean Counties, Part B Part C; Middlesex-Somerset- Hunterdon TGA, Part A Atlantic-Cape May and Cumberland Counties, Part B Middlesex-Somerset-Hunterdon TGA, Part A 23 Diana Santiago Horizon Health Center Hudson County TGA, Part A 24 Donna Schiller N/A 25 Sal Susino Making it Possible to End Homelessness, Imani Park Statewide; Hudson County TGA, Part A Middlesex-Somerset-Hunterdon TGA, Part A; Monmouth-Ocean Counties, Part B 26 Charlotte Tobias N/A Bergen-Passaic TGA, Part A 27 Wayde Toman United People Positive 28 Warren Triano-Davis Division of HIV, STD and TB Services Middlesex-Somerset-Hunterdon TGA, Part A Statewide 29 Karen Walker Paterson Counseling Center Inc. Bergen-Passaic TGA, Part A 30 Derrick Wallace North Jersey Community Research Initiative 31 Chas White Somerset Medical Center 32 Gary Paul Wright 33 Eric Wuethrich African American Office of Gay Concerns Visiting Nurse Association Health Group NEMA, Part A Middlesex-Somerset-Hunterdon TGA, Part A; Mercer County, Part B NEMA, Part A Monmouth-Ocean Counties, Part B 47
50 Statewide Coordinated Statement of Need HIV/AIDS Issues Committee Members as of May 17, 2012 First Name Last Name Affiliation Geographic Area of HIV/AIDS Involvement 1 Mark S. Anderson Buddies of New Jersey Inc. Bergen-Passaic TGA, Part A 2 Jaime Betancourt Hyacinth AIDS Foundation Statewide 48 3 Eileen E. Birk St. Francis Medical Center Mercer County, Part B 4 Patryce Burgess 5 Danielle Bush 6 Jerry C. Dillard New Jersey Women and AIDS Network North Jersey Community Research Initiative Coalition on AIDS of Passaic County Statewide NEMA, Part A 7 Deloris Dockrey Hyacinth AIDS Foundation Statewide 8 Loretta Dutton Division of HIV, STD and TB Services 9 Jean Haspel AtlantiCare Infectious Disease 10 Lourdez Hernandez 11 Polly Jones N/A 12 Eddie Jumper 13 Carmen Lopez 14 Roseann Marone New Jersey Association on Corrections North Jersey Community Research Initiative Puerto Rican Organization for Community Education and Economic Development University of Medicine and Dentistry in New Jersey-Robert Wood Johnson Medical School Bergen-Passaic TGA, Part A Statewide Atlantic-Cape May Counties, Part B Statewide Middlesex-Somerset-Hunterdon TGA, Part A NEMA, Part A NEMA, Part A Statewide; Middlesex-Somerset- Hunterdon TGA, Part A
51 Appendix I HIV/AIDS Issues Committee Members as of May 17, 2012 Last Name 15 Dwight Peavy 16 Elizabeth Perez 17 Shannon Preston 18 Joy Robinson Newark EMA HIV Health Services Planning Council Hudson County HIV Planning Council Visiting Nurse Association Health Group University of Medicine and Dentistry in New Jersey-Robert Wood Johnson Medical School, Eric B. Chandler Health Center 19 Leslie Roca-Soto South Jersey AIDS Alliance 20 Frank Ruiz N/A 21 Donna Schiller N/A NEMA, Part A Hudson County TGA, Part A Statewide Part C; Middlesex-Somerset- Hunterdon TGA, Part A Atlantic-Cape May and Cumberland Counties, Part B Middlesex-Somerset-Hunterdon TGA, Part A Statewide; Hudson County TGA, Part A 22 Charlotte Tobias N/A Bergen-Passaic TGA, Part A 23 Warren Triano-Davis Division of HIV, STD and TB Services Statewide 24 Karen Walker Paterson Counseling Center Inc. Bergen-Passaic TGA, Part A 25 Derrick Wallace Affiliation North Jersey Community Research Initiative 26 Chas White Somerset Medical Center 27 Eric Wuethrich Geographic Area of HIV/AIDS Involvement Visiting Nurse Association Health Group Geographic Area of HIV/AIDS Involvement NEMA, Part A Middlesex-Somerset-Hunterdon TGA, Part A; Mercer County, Part B Monmouth-Ocean Counties, Part B 49
52 Statewide Coordinated Statement of Need APPENDIX II 50 SCSN Regional Profiles
53 Appendix II: Regional Profiles Atlantic-Cape May Planning Region 51
54 Statewide Coordinated Statement of Need Section I: Description of the Atlantic-Cape May Planning Region The Part B Planning Region of Atlantic and Cape May Counties is one of nine HIV/AIDS planning regions in the State of New Jersey. Located along the southeastern New Jersey shore, the land area of the Part B Region is 806 square miles. Atlantic County: The County has a total area of 555 square miles with a population density of 425 per square mile. Cape May County: The County has a total area of 251 square miles with a population density of 386 per square mile. Total Population: The population of the Planning Region is 371,814. Atlantic County has a population of 274,549 and Cape May County has a population of 97, Race/Ethnicity: The majority of residents in the two counties are White, non- Hispanic (65% and 72%).Atlantic County has a larger percentage of Black/ African Americans (16%), Hispanic/Latinos (17%) and Asians (8%) than Cape May County. Atlantic County also has a larger percentage of individuals identifying as another race (7%) than Cape May County (6%). Atlantic County has a larger percentage of Hispanics/Latinos (17%) and does Cape May County. Table 1 shows the racial/ethnic breakdown of the Planning Region by county. Table 1: Race/Ethnicity in Planning Region Race Atlantic % Cape May % White 179, , Black or African American 44, , American Indian and Alaska Native 1,050 <1 1,255 <1 Asian 20, ,793 6 Native Hawaiian or Other Pacific Islander Other race 20, ,617 6 Hispanic/Latino 46, ,054 6 Gender: Within the counties of the Planning Region, the percentage of males (49%) and females (52%) in each county is similar. Age: In each of the counties, the majority of residents are between the ages of and
55 Appendix II: Regional Profiles Section II: Social Determinates Data for the Atlantic Cape May Planning Region Language: In Atlantic County, 76% of residents speak English only at home while 14% speak Spanish. Note: U.S. Census data on language is not available for Cape May County. Employment Status: In the Planning Region, the percentage of individuals over the age of 16 who are employed is 65%. Atlantic County has a higher percentage of individuals employed (66%) than Cape May County(61%). Median Household Income: The median household income in the Planning Region is $52,786. Cape May County has a higher median household income ($53,393) than Atlantic County ($52,571). Level of Poverty: In the Planning Region, 13.3% of individuals are living in poverty. The percentage of individuals living in poverty is higher in Atlantic County (14%) than Cape May County (11%). Households Receiving Government Assistance: The percentage of households in the Planning Region receiving cash public assistance is 3%. Nearly eight percent (8%) are receiving food stamps/snap benefits. Atlantic County has a higher percentage of households receiving cash public assistance income (4%) and food stamps/snap benefits (8%) than Cape May County (2% and 6% respectively). Housing ATLANTIC-CAPE MAY PLANNING REGION Owner Occupied vs. Renter-Occupied: Twenty-nine percent (29%) of houses in the Planning Region are owner-occupied. Cape May County has a higher percentage of owner occupied housing (73%) than Atlantic County (68%). Atlantic County has a higher percentage of renter-occupied housing (32%) than Cape May (26%). 53 Median Home Value: The median home value in the Planning Region is $284,633. Cape May has a higher median home value ($327,300) than Atlantic County ($238,400). Renters: The number of occupied units generating rent in the Planning Region is 33,936 and the median rent paid is $1,000. Atlantic County has a higher number of occupied units paying rent (24,733) than Cape May County (9,203). Cape May County has a higher monthly median rent ($1,007) than Atlantic County ($993). In the Planning Region, the majority of individuals (51%) are paying 35% or more of their income in rent. Atlantic County has a higher percentage of individuals (52%) paying 35% or more of their income in rent than Cape May County (47%). Homeless Population Point-In-Time Count ( ): Within the Planning Region, the homeless population is estimated at 729 individuals. Atlantic County has a higher estimate of homeless individuals (477) than Cape May County (252). Health Insurance Coverage: In the Planning Region, 88% of residents have health insurance. Of those with health insurance, 72% have private insurance and 31% are covered under public insurance. The percentage of those who have no health insurance is 12%. Both counties in the Planning Region have the same percentage of individuals with health insurance of some kind. Cape May County has a higher number of individuals who have private insurance (74%), than Atlantic County (71%). Cape May County also has a higher percentage of individuals with no health insurance (12%) than Atlantic County. Cape May has a higher number of individuals using public insurance (34%) than do Atlantic County residents (30%). Medicaid Beneficiaries: Within the Planning Region, 5,916 individuals are enrolled in Medicaid. Atlantic County has a higher number of individuals enrolled (4,465) than Cape May County (1,451). Incarcerated: Within the Planning Region, there are 2,139 offenders in correctional institutions. Atlantic County has a higher number of individuals incarcerated (1,768) than Cape May County (448).
56 Statewide Coordinated Statement of Need Section III: HIV/AIDS, STI and TB Data for the Atlantic-Cape May Planning Region DHSTS is responsible for collecting and disseminating HIV/AIDS data. All data is for calendar year 2008 based on NJ ehars data as of December 31, HIV New Diagnosis of HIV by Race/Ethnicity: The majority of new diagnoses of HIV are in Atlantic County (88%). Black, non-hispanics comprise 46% of new diagnoses followed by Hispanics (33%). Table 2: New Diagnoses of HIV (not AIDS) by Race/Ethnicity 54 Race White, non-hispanic Black, non-hispanic Hispanic Other/ Unknown Total % Atlantic Cape May Total % New Diagnoses of HIV by Gender: The majority of new diagnoses of HIV are male (54%). New Diagnoses of HIV by Age Group: The age ranges of (38%) and (33%) comprise the highest percentage of new infections in the Planning Region. Table 3: New Diagnoses of HIV (not AIDS) by Age Group County Total Atlantic Cape May Total % New Diagnoses of HIV by Transmission Mode: The highest percentage of individuals infected are through Heterosexual contact (46%) followed by MSM (38%) and IDU (17%). Table 4: New Diagnoses of HIV (not AIDS) by Transmission Mode County MSM IDU MSM/IDU Heterosexual contact Other/ Unknown Total % Atlantic Cape May Total %
57 Appendix II: Regional Profiles ATLANTIC-CAPE MAY PLANNING REGION New Diagnoses of HIV Over Five Year Period: The highest percentages of new infections were seen between By 2008, the percentage of those newly infected dropped to 12%. Table 5: New Diagnoses of HIV (not AIDS) During Five Year Period County Total % Atlantic Cape May Total % AIDS New Diagnoses of AIDS by Race/Ethnicity: The majority of new diagnoses of AIDS are in Atlantic County (88%). Black, non-hispanics comprise 58% of new diagnoses in the Planning Region followed by White, non- Hispanics (20%). Table 6: New Diagnoses of AIDS by Race/Ethnicity County White, non-hispanic Black, non-hispanic Hispanic Other/ Unknown Total % Atlantic Cape May Total % New Diagnoses of AIDS by Gender: The majority of new diagnoses of AIDS are male (52% in Atlantic County and 83% in Cape May County). The percentage of females diagnosed with AIDS in Atlantic County (48%) is similar to the percentage of males (52%). Table 7: New Diagnoses of AIDS by Gender County Male % Female % Total % Atlantic Cape May Total New Diagnoses of AIDS by Age Group: The age ranges of (44%) and (22%) comprise the highest percentage of new infections in the Planning Region. Table 8: New Diagnoses of AIDS by Age Group County Total Atlantic Cape May Total %
58 Statewide Coordinated Statement of Need New Diagnoses of AIDS by Transmission Mode: The highest percentage of individuals infected are through Heterosexual contact (42%) followed by IDU (32%), MSM and Other/Unknown (12% respectively). Table 9: New Diagnoses of AIDS by Transmission Mode County MSM IDU MSM/IDU Heterosexual contact Other/ Unknown Total % Atlantic Cape May Total % New Diagnoses of AIDS During Five Year Period: The highest percentage of new infections were seen in 2004 (25%). By 2008, the percentage of new infections dropped to 16%. Table 10: New Diagnoses of AIDS During Five Year Period County Total % Atlantic Cape May Total % HIV/AIDS New Diagnoses of HIV/AIDS by Race/Ethnicity: The majority of new diagnoses of HIV/AIDS are in Atlantic County (85%). Black, non-hispanics comprise 46% of new diagnoses followed by Hispanics (31%). Table 11: New Diagnoses of HIV/AIDS by Race/Ethnicity County White, non-hispanic Black, non-hispanic Hispanic Other/ Unknown Total % Atlantic Cape May Total % New Diagnoses of HIV/AIDS by Gender: The majority of new diagnoses of HIV/AIDS in the Planning Region are male (Atlantic County 56% and Cape May County 86%). Table 12: New Diagnoses of HIV/AIDS by Gender County Male % Female % Total % Atlantic Cape May Total
59 Appendix II: Regional Profiles ATLANTIC-CAPE MAY PLANNING REGION New Diagnoses of HIV/AIDS by Age Group: The age ranges of (33%), (31%) and (23%) comprise the highest percentage of new infections in the Planning Region. Table 13: New Diagnoses of HIV/AIDS by Age Group County Total Atlantic Cape May Total % New Diagnoses of HIV/AIDS by Transmission Mode: The highest percentage of individuals infected are through Heterosexual contact (48%) followed by MSM (29%). Table 14: New Diagnoses of HIV/AIDS by Transmission Mode County MSM IDU MSM/IDU Heterosexual contact Other/ Unknown Total % Atlantic Cape May Total % New Diagnoses of HIV/AIDS During Five Year Period: The highest percentage of new infections were seen in 2004 (24%). By 2008, the percentage of new infections dropped to 12%. Table 15: New Diagnoses of HIV/AIDS During Five Year Period County Total % Atlantic Cape May Total %
60 Statewide Coordinated Statement of Need Prevalence of Persons Living with HIV/AIDS Living with HIV/AIDS by Race/Ethnicity: Black, non-hispanics comprise 49% of individuals living with HIV/ AIDS in the Planning Region followed by White, non-hispanics (29%). County Table 16: Prevalence of Persons Living with HIV/AIDS by Race/Ethnicity Hispanic, all races Non-Hispanic, Black Non-Hispanic, White Other/ Unknown Total % unknown Total % Cape May Total % Living with HIV/AIDS by Gender: Of the 1,633 individuals living with HIV/AIDS in the Planning Region, 71% are male. Living with HIV/AIDS by Age Group: The age ranges of (43%) and 55+ (24%) comprise the highest percentage of new infections in the Planning Region. 58 Table 17: Prevalence of Persons Living with HIV/AIDS by Age Group County < Total % Atlantic Cape May Total % Living with HIV/AIDS by Transmission Mode: The highest percentage of individuals living with HIV/AIDS were infected through Heterosexual contact (39%) followed by IDU (26%) and MSM (25%). Table 18: Prevalence of Persons Living with HIV/AIDS by Transmission Mode County MSM IDU MSM/IDU Heterosexual Other/unknown Total % Atlantic Cape May Total %
61 Appendix II: Regional Profiles ATLANTIC-CAPE MAY PLANNING REGION STI Data The STIs monitored by DHSTS are Syphilis (primary; secondary; early latent; late, late latent; congenital), Gonorrhea, Chlamydia and Tuberculosis. STI Morbidity: Atlantic County has significantly more reported cases of Chlamydia, Gonorrhea, and Syphilis than Cape May County.. Table 19: Reported Sexually Transmitted Infection Morbidity in the Planning Region County Chlamydia Gonorrhea Syphilis: Primary, Secondary Syphilis: Early Latent Syphilis: Late, Late Latent Syphilis Congenital Atlantic Cape May Total TB Morbidity: TB morbidity in the Atlantic-Cape May Planning Region ranged from a high of 21 cases in 2008 to 11 cases in 2011 and Atlantic County consistently has more cases of TB than Cape May County Table 20: TB Morbidity Cases in the Planning Region 59 County Atlantic Cape May Total
62 Statewide Coordinated Statement of Need Unmet Need: DHSTS Epidemiologic Services Unit is responsible for providing the unmet need data for all Ryan White grantees in New Jersey. Estimates of unmet need are outlined for people living with HIV and AIDS who were diagnosed before 2010 and alive through December 31, 2010 in the Atlantic-Cape May Planning Region as of June 30, Individuals with HIV and AIDS who were incarcerated or resided in unknown counties at the time of diagnosis are not included in this analysis. Unmet need refers to the population of HIV infected individuals who are aware of their HIV status but are not engaged in adequate HIV related services. This is defined as having at least one HIV care-related viral load test (VL), CDC count/percent and/or antiretroviral drug within a one-year period. Individuals who had at least one HIV care-related antiretroviral drug, a viral load test and/or CD4 test were considered to have been in care in Unmet Need in the Atlantic-Cape May Planning Region Unmet need for the Planning Region is 48%. Unmet need by HIV/AIDS Status: 60 o o Atlantic County has a higher percentage of unmet need for those living with HIV (62%) than in Cape May County (53%). Cape May County has a higher percentage of unmet need for those living with AIDS (40%) than in Atlantic County (36%). Unmet need by Race/Ethnicity: o o In Atlantic County the highest percentage of unmet need is for Hispanics (53%) followed by Black, non-hispanics (48%) and White, non-hispanics (46%). In Cape May County, the highest percentage of unmet need is for Hispanics (63%) followed by White, non-hispanics (47%) and Black, non-hispanics (31%). Unmet need by Transmission Mode: o o Unmet need by transmission mode is highest for IDU (52%) followed by MSM (50%) and MSM /IDU (49%) in Atlantic County. Unmet need by transmission mode is highest for MSM and Heterosexual Contact (49% respectively) followed by IDU (43%) in Cape May County.
63 Appendix II: Regional Profiles Bergen-Passaic TGA 61
64 Statewide Coordinated Statement of Need Section I: Description of the Bergen Passaic TGA The Bergen-Passaic TGA is one of nine HIV/AIDS planning regions in the State of New Jersey. The land area of the TGA is 417 square miles. Bergen County: The County land area is 233 square miles with a population density of 3,884 per square mile. Passaic County: The County land area is 184 square miles with a population density of 2,715 per square mile. Total Population: The population of the TGA is 1,406,342. Bergen County has a population of 905,116 and Passaic County has a population of 501, Race/Ethnicity: The majority of residents in the two counties are White. Passaic County has a larger percentage of Black/African Americans (13%) than Bergen County (6%). Passaic County also has a larger Hispanic/ Latino population (37%) and Bergen County has a large Asian population (15%). Table 1 shows the racial/ethnic breakdown of the Planning Region by county. Table 1: Race/Ethnicity in Planning Region Race Bergen % Passaic % White 650, , Black or African American 52, , American Indian and Alaska Native 2,061 <1 3,348 <1 Asian 131, ,092 5 Native Hawaiian or Other Pacific Islander ,146 <1 Other Race 45, , Hispanic/Latino 145, , Gender: Within the TGA, the percentage of males and females in each county is similar (48% male and 52% female). Age: In both counties, the majority of residents are between the ages of (8% respectively). Passaic County also has a large number of residents who are between the ages of (8%)
65 Section II: Social Determinates Data for the Bergen-Passaic TGA Appendix II: Regional Profiles Language: In Bergen County, 62% of the residents speak English only at home while 14% speak Spanish. Passaic County has a higher percentage of residents that speak Spanish (34%). Employment Status: In the TGA, the percentage of individuals over the age of 16 who are employed is 65%. The percentage employed in each county is similar (Bergen 66% and Passaic 64%). Median Household Income: The median household income in the TGA is $69,051. Bergen County has a higher median household income ($77,389) than Passaic County ($53,993). Level of Poverty: Ten percent (10%) of the individuals in the TGA are living in poverty. The percentage of individuals living in poverty is higher in Passaic County (16%) than Bergen County (7%). Households Receiving Government Assistance: The percentage of households in the TGA receiving cash public assistance is 2%. Six percent (6%) are receiving food stamps/snap benefits. Passaic County has a higher percentage of households receiving cash public assistance income (3%) and food stamps/snap benefits (11%) than Bergen County (1% and 4% respectively). Housing BERGEN-PASSAIC TGA Owner Occupied vs. Renter-Occupied: Sixty-two percent (62%) of houses in the TGA are owner occupied. Bergen County has a higher percentage of owner occupied housing (66%) than Passaic County (55%). 63 Median Home Value: The median home value in the TGA is $431,529. Bergen County has a drastically higher median home value ($643,800) than Passaic County ($365,200). Renters: The number of occupied units generating rent in the TGA is 174, 944 and the median rent paid is $1,197. Bergen County has a higher number of occupied units paying rent (105,245) than Passaic County (69,699). Median monthly rents in each county are similar. In the TGA, the majority of individuals (48%) are paying 35% or more of their income in rent. Passaic County has a higher percentage of individuals (53%) paying 35% or more of their income in rent than Passaic County (44%). Table 2: Data on Rental Units, Median Monthly Rent Payments and Percentage of Renters Paying 35% or More of their Income on Rent by County Percentage of Renters County Number of Occupied Units Paying Rent Median Monthly Rent Paying 35% or More of Income on Rent Bergen 105,245 $1, Passaic 69,699 $1, Homeless Population Point-In-Time Count ( ): Within the TGA, the homeless population is estimated at 1,261 individuals. Bergen County has a higher estimate of homeless individuals (938) than Passaic County (323).
66 Statewide Coordinated Statement of Need Health Insurance Coverage: In the TGA, 85% of residents are reported to have health insurance. Of those with health insurance, 70% have private insurance and 24% are covered under public insurance. The percentage of those who have no health insurance is 15%. Both counties in the TGA have a similar percentage of individuals with health insurance of some kind. Passaic County has a higher percentage of individuals with public health insurance (32%), as well as a higher percentage of individuals with no health insurance (18%). Medicaid Beneficiaries: Within the TGA,14,480 individuals are enrolled in Medicaid. Passaic County has a higher number of individuals enrolled (10,364) than Bergen County (4,116). Incarcerated: Within the Planning Region, there are 2,980 offenders in correctional institutions. Passaic County has significantly more individuals who are incarcerated (2,073) than Bergen County (907). Section III: HIV/AIDS, STI and TB Data for the Bergen-Passaic TGA 64 DHSTS is responsible for collecting and disseminating HIV/ADIS data. All data is for calendar year 2012 based on NJ Department of Health Division of HIV/AIDS, STD and TB Services data as of December 31, HIV New Diagnoses of HIV by Race/Ethnicity: The majority of new diagnoses of HIV are in Passaic County (53%). Black, non-hispanics comprise 41% of new diagnoses in the TGA, followed by Hispanics (33%). Table 3: New Diagnoses of HIV (not AIDS) by Race/Ethnicity County White, non-hispanic Black, non-hispanic Hispanic Other/ Unknown Total % Bergen Passaic Total % New Diagnoses of HIV by Gender: The majority of new HIV diagnoses in the TGA are male (68%). New Diagnoses of HIV by Age Group: The age ranges of 13-24, and each account for 25% of new HIV infections in the TGA. Table 4: New Diagnoses of HIV (not AIDS) by Age Group County Total % Bergen Passaic Total % New Diagnoses of HIV by Transmission Mode: The highest percentage of individuals infected are through
67 Appendix II: Regional Profiles BERGEN-PASSAIC TGA Heterosexual contact (40%) followed by MSM (31%) and Other/Unknown (20%). Table 5: New Diagnoses of HIV (not AIDS) by Transmission Mode County MSM IDU MSM/IDU Heterosexual contact Other/ Unknown Total % Bergen Passaic Total % New Diagnoses of HIV Over Five Year Period: The highest percentage of new infections were seen between There was an increase in new infections between 2007 and Table 6: New Diagnoses of HIV During Five Year Period County Total % Bergen Passaic Total % AIDS New Diagnoses of AIDS by Race/Ethnicity: The majority of new diagnoses of AIDS in the TGA are in Passaic County (68%). Black, non-hispanics account for 45% of new diagnoses in the TGA followed by Hispanics (35%). Table 7: New Diagnoses of AIDS by Race/Ethnicity County White, non-hispanic Black, non-hispanic Hispanic Other/ Unknown Total % Bergen Passaic Total % New Diagnoses of AIDS by Gender: The majority of new diagnoses of AIDS are male (63%).
68 Statewide Coordinated Statement of Need New Diagnoses of AIDS by Age Group: The age ranges of (35%) and (29%) account for the highest percentage of new AIDS cases in the TGA. Table 8: New Diagnoses of AIDS by Age Group County Total % Bergen Passaic Total % New Diagnoses of AIDS by Transmission Mode: The highest percentage of individuals infected are through Heterosexual contact (51%) followed by IDU (23%) and MSM (15%). Table 9: New Diagnoses of AIDS by Transmission Mode 66 County MSM IDU MSM/IDU Heterosexual contact Other/ Unknown Total % Bergen Passaic Total % New Diagnoses of AIDS During Five Year Period: The highest percentage of new infections were seen in 2004 (26%). By 2008, the percentage of new infections had dropped to 16%. Table 10: New Diagnoses of AIDS During Five Year Period County Total % Bergen Passaic Total % Diagnosis HIV/AIDS New Diagnoses of HIV/AIDS by Race/Ethnicity: The majority of new diagnoses of HIV/AIDS were in Passaic County (56%). Black, non-hispanics accounted for 40% of new diagnoses in the TGA followed by Hispanics (34%). Table 11: New Diagnoses of HIV/AIDS by Race/Ethnicity County White, non-hispanic Black, non-hispanic Hispanic Other/ Unknown Total % Bergen Passaic Total %
69 Appendix II: Regional Profiles BERGEN-PASSAIC TGA New Diagnoses of HIV/AIDS by Gender: The majority of newly diagnosed HIV/AIDS cases in the TGA are male (71%). New Diagnoses of HIV/AIDS by Age Group: The age ranges with the highest diagnoses of new HIV/AIDS cases in the TGA are (28%), (23%) and (20%). Table 12: New Diagnoses of HIV/AIDS by Age Group County Total % Bergen Passaic Total % New Diagnoses of HIV/AIDS by Transmission Mode: The highest percentage of individuals infected with HIV/ AIDS are through Heterosexual contact (45%) followed by MSM (27%). Table 13: New Diagnoses of HIV/AIDS by Transmission Mode County MSM IDU MSM/IDU Heterosexual contact Other/ Unknown Total % Bergen Passaic Total % 27 8 < New Diagnoses of HIV/AIDS During Five Year Period: The highest percentage of new infections were seen in 2009 (23%). By 2012, the percentage of new infections dropped to 15%. The majority of new diagnoses during this time period were in Passaic County (61%). Table 14: New Diagnoses of HIV/AIDS During Five Year Period County Total % Bergen Passaic Total %
70 Statewide Coordinated Statement of Need Prevalence of Persons Living with HIV/AIDS Living with HIV/AIDS by Race/Ethnicity: The majority of those living with HIV/AIDS in the TGA are Black, non-hispanic (38%). Hispanics comprise the next highest percentage (32%) followed by White, non-hispanics (27%). County Table 15: Prevalence of Persons Living with HIV/AIDS by Race/Ethnicity Hispanic, all races Non-Hispanic, Black Non-Hispanic, White Other/ Unknown Total % Bergen Passaic Total % Living with HIV/AIDS by Gender: Of the 4,250 individuals living with HIV/AIDS in the TGA, 64% are male. 68 Living with HIV/AIDS by Age Group: The age range with the highest percentage of individuals living with HIV/AIDS in the TGA is (39%) followed by 55+ (31%). Table 16: Prevalence of Persons Living with HIV/AIDS by Age Group County < Total % Bergen Passaic Total % Living with HIV/AIDS by Transmission Mode: The highest percentage of individuals living with HIV/AIDS were infected through Heterosexual contact (40%) followed by MSM (24%) and IDU (18%). Table 17: Prevalence of Persons Living with HIV/AIDS by Transmission Mode County MSM IDU MSM/IDU Heterosexual Other/unknown Total % Bergen Passaic Total %
71 Appendix II: Regional Profiles BERGEN-PASSAIC TGA STI Data The STIs monitored by DHSTS are Syphilis (primary; secondary; early latent; late, late latent; congenital), Gonorrhea, Chlamydia and Tuberculosis. STI Morbidity: Passaic County has significantly more reported cases of Chlamydia and Gonorrhea than Bergen County. The number of reported cases of Syphilis are similar in each County. Table 18: Reported Sexually Transmitted Infection Morbidity in the TGA County Chlamydia Gonorrhea Syphilis: Primary, Secondary Syphilis: Early Latent Syphilis: Late, Late Latent Syphilis Congenital Bergen Passaic Total TB Morbidity: TB morbidity in the Bergen-Passaic TGA ranged from a high of 75 cases in 2010 to 53 cases in Bergen County consistently has a slightly higher number of reported cases of TB than Passaic County. 69 Table 19: TB Morbidity in the TGA County Bergen Passaic Total
72 Statewide Coordinated Statement of Need Unmet Need: DHSTS Epidemiologic Services Unit is responsible for providing the unmet need data for all Ryan White grantees in New Jersey. Estimates of unmet need are outlined for people living with HIV and AIDS who were diagnosed before 2010 and alive through December 31, 2010 in the Bergen-Passaic TGA as of June 30, Individuals with HIV and AIDS who were incarcerated or resided in unknown counties at the time of diagnosis are not included in this analysis. Unmet need refers to the population of HIV infected individuals who are aware of their HIV status but are not engaged in adequate HIV related services. This is defined as having at least one HIV care-related viral load test (VL), CDC count/percent and/or antiretroviral drug within a one-year period. Individuals who had at least one HIV care-related antiretroviral drug, a viral load test and/or CD4 test were considered to have been in care in Unmet Need in the Bergen-Passaic TGA Unmet need for the Planning Region is 43%. Unmet need by HIV/AIDS Status: 70 o o Passaic County has a higher percentage of unmet need for those living with HIV (56%) than in Bergen County (53%). Bergen County has a higher percentage of unmet need for those living with AIDS (39%) than in Passaic County (29%). Unmet need by Race/Ethnicity: o o In Bergen County, the highest percentage of unmet need is for Hispanics (50%) followed by Black, non-hispanics (48%) and White, non-hispanics (41%). In Passaic County, the highest percentage of unmet need is for Hispanics (45%) followed by Black, non- Hispanics (40%) and White, non-hispanics (36%). Unmet need by Transmission Mode: o o Unmet need by transmission mode in Bergen County is highest for MSM/IDU (72%) followed by IDU (48%) and MSM (44%). Unmet need by transmission mode in Passaic County is highest for MSM (43%) followed by IDU (41%) and Heterosexual contact (39%).
73 Appendix II: Regional Profiles Cumberland County Planning Region 71
74 Statewide Coordinated Statement of Need Section I: Description of the Cumberland County Planning Region The Part B Planning Region of Cumberland County is located in south central New Jersey. It is one of nine HIV/ AIDS planning regions in the State of New Jersey. The Cumberland County Planning Region was once part of the Part A Vineland-Millville-Bridgeton TGA. In 2010, the TGA lost it s Part A status and became a Part B Planning Region. Cumberland County: The County has a total land area of 555 square miles with a population density of 494 per square mile. Total Population: The population of the Planning Region is 156,898. Race/Ethnicity: The majority of residents in Cumberland County are White (63%). Hispanic/Latinos comprise 27% of the population. Table 1 shows the racial/ethnic breakdown of the Planning Region. Table 1: Race/Ethnicity in Planning Region 72 Race Cumberland % White 98, Black or African American 31, American Indian and Alaska Native 1,746 1 Asian 1,907 1 Native Hawaiian or Other Pacific Islander 59 0 Other Race 17, Hispanic/Latino 42, Gender: Within the Planning Region, the percentage of males and females is similar (52% male and 49% female). Age: The majority of residents in the Planning Region are between the ages of (4%). Section II: Social Determinates Data for the Cumberland County Planning Region Language: In the Planning Region, 75% of residents speak English only at home while 21% speak Spanish. Employment Status: In the Planning Region, the percentage of individuals over the age of 16 who are employed is 59%. Median Household Income: The median household income in the Planning Region is $51,619. Level of Poverty: Nearly 17% of the individuals in the Planning Regional living in poverty. Households Receiving Government Assistance: The percentage of households in the Planning Region receiving cash public assistance is 3%. Nearly 7% are receiving food stamps/snap benefits.
75 Appendix II: Regional Profiles CUMBERLAND COUNTY PLANNING REGION Housing Owner Occupied vs. Renter-Occupied: Sixty-seven percent (67%) of houses in the Planning Region are owner occupied. Median Home Value: The median home value in the Planning Region is $177,600. Renters: The number of occupied units generating rent in the Planning Region is 50,237 and the median rent paid is $903. The majority of individuals (58%) are paying 35% or more of their income in rent. Homeless Population Point-In-Time Count ( ): Within the Planning Region, the homeless population is estimated at 70 individuals. Health Insurance Coverage: In the Planning Region, 81% of residents are reported to have health insurance. Of those with health insurance, 54% have private insurance and 38% are covered under public insurance. The percentage of those who have no health insurance is 19%. Medicaid Beneficiaries: Within Cumberland County, there are 2,826 individuals enrolled in Medicaid. Incarcerated: Within the Planning Region, there are 689 offenders in correctional institutions. 73 Section III: HIV/AIDS, STI and TB Data for the Cumberland Planning Region DHSTS is responsible for collecting and disseminating HIV/ADIS data. All data is for calendar year 2012 based on NJ Department of Health Division of HIV/AIDS, STD and TB Services data as of December 31, HIV New Diagnoses of HIV by Race/Ethnicity: The majority of new diagnoses of HIV are Hispanics (45%) followed by Black, non-hispanics (36%). Table 2: New Diagnoses of HIV (not AIDS) by Race/Ethnicity County White, non-hispanic Black, non-hispanic Hispanic Other/ Unknown Total Cumberland % New Diagnoses of HIV by Gender: The majority of new diagnoses of HIV in the Planning Region are male (64%).
76 Statewide Coordinated Statement of Need New Diagnoses of HIV by Age Group: The age ranges of (36%) comprise the highest percentage of new cases followed by 35-44, and 55+ (18% respectively). Table 3: New Diagnoses of HIV (not AIDS) by Age Group County Total Cumberland % New Diagnoses of HIV by Transmission Mode: The highest percentages of individuals infected are through Heterosexual contact (55%) followed by MSM (27%) and Other/Unknown (18%). Table 4: New Diagnoses of HIV (not AIDS) by Transmission Mode County MSM IDU MSM/IDU Heterosexual contact Other/ Unknown Total Cumberland % New Diagnoses Over Five Year Period: The highest percentage of new infections were seen in 2005 (33%). The percentage of new infections dropped until 2008, when they climbed to a level similar to 2004 (22%). Table 5: New Diagnoses of HIV During Five Year Period County Total Cumberland % AIDS New Diagnoses of AIDS by Race/Ethnicity: The majority of new diagnoses of AIDS in the Planning Region are Black, non-hispanics and Hispanics (42% respectively). Table 6: New Diagnoses of AIDS by Race/Ethnicity County White, non-hispanic Black, non-hispanic Hispanic Other/ Unknown Total Cumberland % New Diagnoses of AIDS by Gender: The majority of new diagnoses of AIDS are male (63%).
77 Appendix II: Regional Profiles CUMBERLAND COUNTY PLANNING REGION New Diagnoses of AIDS by Age Group: The age ranges of (32%), and (26% respectively) account for the highest percentage of new AIDS cases in the Planning Region. Table 7: New Diagnoses of AIDS by Age Group County Total Cumberland % New Diagnoses of AIDS by Transmission Mode: The highest percentage of individuals infected are through Heterosexual contact (47%), MSM (26%) and IDU (16%). Table 8: New Diagnoses of AIDS by Transmission Mode County MSM IDU MSM/IDU Heterosexual contact Other/ Unknown Total Cumberland % New Diagnoses of AIDS During Five Year Period: The highest percentage of new infections were seen in 2004 (27%). By 2008, the percent of new infections dropped to 16%. 75 Table 9: New Diagnoses of AIDS During Five Year Period County Total Cumberland % HIV/AIDS New Diagnosis of HIV/AIDS by Race/Ethnicity: The majority of new HIV/AIDS diagnoses are Black, non- Hispanics and Hispanics (38% respectively) followed by White, non-hispanics (23%). County Table 10: New Diagnoses of HIV (not AIDS) by Race/Ethnicity White, non-hispanic Black, non-hispanic Hispanic Other/ Unknown Cumberland % Total New Diagnoses of HIV/AIDS by Gender: The majority of newly diagnosed HIV/AIDS cases are male (73%).
78 Statewide Coordinated Statement of Need New Diagnoses of HIV/AIDS by Age Group: The age ranges with the highest percentage of new HIV/AIDS diagnoses are and (27% respectively). Table 11: New Diagnoses of HIV/AIDS by Age Group County Total Cumberland % New Diagnoses of HIV/AIDS by Transmission Mode: The highest percentage of new HIV/AIDS diagnoses are through Heterosexual contact (50%) and MSM (31%). Table 12: New Diagnoses of HIV/AIDS by Transmission Mode County MSM IDU MSM/IDU Heterosexual contact Other/ Unknown Total Cumberland % New Diagnoses of HIV/AIDS During Five Year Period: The highest percentage of new infections were seen in 2009 (30%). A significant decline was reported in 2010 (14%); however, in 2012 the percentage of new infections rose to 16%. Table 13: New Diagnoses of HIV/AIDS During Five Year Period County Total Cumberland % Prevalence of Persons Living with HIV/AIDS Living with HIV/AIDS by Race/Ethnicity: The majority of those living with HIV/AIDS in the Planning Region are Black, non-hispanic (42%) followed by Hispanics (35%). Table 14: Prevalence of Persons Living with HIV/AIDS by Race/Ethnicity County Hispanic, all races Non-Hispanic, Black Non-Hispanic, White Other/ unknown Total Cumberland % Living with HIV/AIDS by Gender: Of the 552 individuals living with HIV/AIDS in the Planning Region, 62% are male.
79 Appendix II: Regional Profiles CUMBERLAND COUNTY PLANNING REGION Living with HIV/AIDS by Age Group: The age range with the highest percentage of individuals living with HIV/AIDS in the Planning Region are (39%) followed by 55+ (24%) and (23%). Table 15: Prevalence of Persons Living with HIV/AIDS by Age Group County < Total Cumberland % Living with HIV/AIDS by Transmission Mode: The highest percentage of individuals living with HIV/AIDS were infected through Heterosexual contact (43%) followed by IDU (22%) and MSM (20%). Table 16: Prevalence of Persons Living with HIV/AIDS by Transmission Mode County MSM IDU MSM/ IDU Heterosexual Other/unknown Total Cumberland % STI 77 The STIs monitored by DHSTS are Syphilis (primary; secondary; early latent; late, late latent; congenital), Gonorrhea, Chlamydia and Tuberculosis. STI Morbidity: Cumberland County has a high number of cases of Chlamydia and Gonorrhea. Table 17: Reported Sexually Transmitted Infection Morbidity in the Planning Region County Chlamydia Gonorrhea Syphilis: Primary, Secondary Syphilis: Early Latent Syphilis: Late, Late Latent Syphilis Congenital Cumberland TB Morbidity: TB morbidity in the Planning Region has remained stable over the past five years, ranging from a high of 8 in 2009 to a low of 4 in Table 18: TB Morbidity Cases in the Planning Region County Cumberland
80 Statewide Coordinated Statement of Need Unmet Need: DHSTS Epidemiologic Services Unit is responsible for providing the unmet need data for all Ryan White grantees in New Jersey. Estimates of unmet need are outlined for people living with HIV and AIDS who were diagnosed before 2010 and alive through December 31, 2010 in the Cumberland County Planning Region as of June 30, Individuals with HIV and AIDS who were incarcerated or resided in unknown counties at the time of diagnosis are not included in this analysis. Unmet need refers to the population of HIV infected individuals who are aware of their HIV status but are not engaged in adequate HIV related services. This is defined as having at least one HIV care-related viral load test (VL), CDC count/percent and/or antiretroviral drug within a one-year period. Individuals who had at least one HIV care-related antiretroviral drug, a viral load test and/or CD4 test were considered to have been in care in Unmet Need in the Cumberland County Planning Region Unmet need for the Planning Region is 47%. Unmet need by HIV/AIDS Status: 78 o Individuals living with HIV have a higher percentage of unmet need (66%) than those living with AIDS (33%). Unmet need by Race/Ethnicity: o Hispanics have a higher percentage of unmet need (57%) followed by Black, non-hispanics (45%) and White, non-hispanics (30%). Unmet need by Transmission Mode: o Unmet need by transmission mode is highest for MSM /IDU (57%) followed by IDU (47%) and MSM (46%).
81 Appendix II: Regional Profiles Jersey City TGA 79
82 Statewide Coordinated Statement of Need Section I: Description of the Jersey City TGA Hudson County (known as the Jersey City TGA) is one of nine planning regions in the State of New Jersey. The TGA is 46 square miles with a population density of 13,731 per square mile. Total Population: The population of the TGA is 634,266. Race/Ethnicity: The majority of residents (54%) are White. Hispanics/Latinos comprise 42% of the population. Black/African Americans and Asians each comprise 13% of the population. Table 1 shows the racial/ethnic breakdown of the Planning Region. Table 1: Race/Ethnicity in Planning Region 80 Race Hudson Percent White 342, Black or African American 83, American Indian and Alaska Native 4,081 <1 Asian 84, Native Hawaiian or Other Pacific Islander 344 <1 Other Race 90, Hispanic/Latino 267, Gender: Within the TGA, the percentage of males and females are identical (50% male and 50% female). Age: The majority of residents are between the ages of and (5% respectively) followed by (4%). Section II: Social Determinates Data for the Jersey City TGA Language: The percentage of residents who speak English only (40%) is identical to the percentage of residents who speak Spanish (40% respectively). Employment Status: In the TGA, the percentage of individuals over the age of 16 who are employed is 69%. Median Household Income: The median household income in the TGA is $54,817. Level of Poverty: Over 16% of the individuals in the TGA are living in poverty. Households Receiving Government Assistance: The percentage of households in the TGA receiving cash public assistance is 4%. Thirteen percent (13%) are receiving food stamps/snap benefits.
83 Appendix II: Regional Profiles JERSEY CITY TGA Housing Owner Occupied vs. Renter-Occupied: Thirty-two percent of houses in the TGA are owner occupied. Nearly 80% of housing in the TGA are rental units. Median Home Value: The median home value in the TGA is $352,600. Renters: The number of occupied units generating rent in the TGA is 151,411 and the median rent paid is $1,096. In the TGA, the majority of individuals (39%) are paying 35% or more of their income in rent. Homeless Population Point-In-Time Count ( ): Within the TGA, the homeless population is estimated at 480 individuals. Health Insurance Coverage: In the TGA, 77% of residents are reported to have health insurance. Of those with health insurance, 56% have private insurance and 28% are covered under public insurance. The percentage of those who have no health insurance is 23%. Medicaid Beneficiaries: Within the TGA, there are 9,423 individuals enrolled in Medicaid. Incarcerated: Within the Planning Region, there are 2,173 offenders in correctional institutions. 81 Section III: HIV/AIDS, STI and TB Data for the Jersey City TGA DHSTS is responsible for collecting and disseminating HIV/ADIS data. All data is for calendar year 2012 based on NJ Department of Health Division of HIV/AIDS, STD and TB Services data as of December 31, HIV New Diagnoses of HIV by Race/Ethnicity: Black, non-hispanics comprise 49% of new HIV diagnoses. Thirtyfive percent (35%) of the new diagnoses are Hispanic and 12% are White, non-hispanic. Table 2: New Diagnoses of HIV (not AIDS) by Race/Ethnicity County White, non-hispanic Black, non-hispanic Hispanic Other/ Unknown Total Hudson % New Diagnoses of HIV by Gender: The majority of new diagnoses of HIV in the TGA are male (70%).
84 Statewide Coordinated Statement of Need New Diagnoses of HIV by Age Group: The age ranges of (35%) and (28%) comprise the highest percentage of new infections in the TGA. Table 3: New Diagnoses of HIV (not AIDS) by Age Group County Total Hudson % New Diagnoses of HIV by Transmission Mode: The highest percentages of individuals infected are through Heterosexual contact (39%) followed by MSM (37%) and Other/Unknown (20%). Table 4: New Diagnoses of HIV (not AIDS) by Transmission Mode County MSM IDU MSM/IDU Heterosexual contact Other/ Unknown Total Hudson % New Diagnoses of HIV Over Five Year Period: The highest percentages of new infections were seen between 2005 and By 2008, the percentage of those newly infected dropped to 14%. Table 5: New Diagnoses of HIV During Five Year Period County Total Hudson % AIDS New Diagnoses of AIDS by Race/Ethnicity: The majority of new diagnoses of AIDS in the TGA are Black, non- Hispanic (54%) followed by Hispanic (31%) and White, non-hispanic (13%). Table 6: New Diagnoses of AIDS by Race/Ethnicity County White, non-hispanic Black, non-hispanic Hispanic Other/ Unknown Total Hudson % New Diagnoses of AIDS by Gender: The majority of new diagnoses of AIDS are male (69%).
85 Appendix II: Regional Profiles JERSEY CITY TGA New Diagnoses of AIDS by Age Group: The age ranges of (35%) and (31%) account for the highest percentage of new AIDS cases in the TGA. Table 7: New Diagnoses of AIDS by Age Group County Total Hudson % New Diagnoses of AIDS by Transmission Mode: The highest percentage of individuals infected are through Heterosexual contact (43%) followed by MSM (19%). Table 8: New Diagnoses of AIDS by Transmission Mode County MSM IDU MSM/IDU Heterosexual contact Other/ Unknown Total Hudson % New Diagnoses of AIDS During Five Year Period: The highest percentage of new infections were seen in 2007 (23%). By 2008, the percent of new infections dropped to 18%. 83 Table 9: New Diagnoses of AIDS During Five Year Period County Total Hudson % HIV/AIDS New Diagnoses of HIV/AIDS by Race/Ethnicity: The majority of new diagnoses of HIV/AIDS in the TGA are Black, non-hispanic (47%), Hispanic (36%) and White, non-hispanic (13%). Table 10: New Diagnoses of HIV/AIDS by Race/Ethnicity County White, non-hispanic Black, non-hispanic Hispanic Other/ Unknown Total Hudson % New Diagnoses of HIV/AIDS by Gender: The majority of newly diagnosed HIV/AIDS cases in the TGA are male (70%).
86 Statewide Coordinated Statement of Need New Diagnoses of HIV/AIDS by Age Group: The age ranges with the highest percentage of HIV/AIDS diagnoses in the TGA are (30%) and (28%). Table 11: New Diagnoses of HIV/AIDS by Age Group County Total Hudson % New Diagnoses of HIV/AIDS by Transmission Mode: The highest percentage of individuals infected are through Heterosexual contact (40%) and MSM (29%). Table 12: New Diagnoses of HIV/AIDS by Transmission Mode County MSM IDU MSM/IDU Heterosexual contact Other/ Unknown Total Hudson % New Diagnoses of HIV/AIDS During Five Year Period: HIV/AIDS diagnoses have remained relatively stable over the previous five years ranging from a high of 22% in to a low of 17% in Table 13: New Diagnoses of HIV/AIDS During Five Year Period County Total Hudson % Prevalence of Persons Living with HIV/AIDS Living with HIV/AIDS by Race/Ethnicity: The majority of those living with HIV/AIDS in the TGA are Hispanic (40%) and Black, non-hispanic (38%). Table 14: Prevalence of Persons Living with HIV/AIDS by Race/Ethnicity County Hispanic, all races Non-Hispanic, Black Non-Hispanic, White Other/ unknown Total Hudson % Living with HIV/AIDS by Gender: Of the 4,771 individuals living with HIV/AIDS in the TGA, 71% are male.
87 Appendix II: Regional Profiles JERSEY CITY TGA Living with HIV/AIDS by Age Group: The majority of individuals living with HIV/AIDS are in the age range of (37%) followed by 55+ (27%) and (22%). Table 15: Prevalence of Persons Living with HIV/AIDS by Age Group County < Total Hudson % Living with HIV/AIDS by Transmission Mode: The highest percentage of individuals living with HIV/AIDS were infected through Heterosexual contact (33%) and MSM (31%). Table 16: Prevalence of Persons Living with HIV/AIDS by by Transmission Mode County MSM IDU MSM/IDU Heterosexual Other/unknown Total Hudson % STI Data 85 The STIs monitored by DHSTS are Syphilis (primary; secondary; early latent; late, late latent; congenital), Gonorrhea, Chlamydia and Tuberculosis. STI Morbidity: The TGA has a high number of cases of Chlamydia and Gonorrhea. There is also a high incidence of Syphilis in various stages. Table 17: Reported Sexually Transmitted Infection Morbidity in the Planning Region County Chlamydia Gonorrhea Syphilis: Primary, Secondary Syphilis: Early Latent Syphilis: Late, Late Latent Syphilis Congenital Hudson TB Morbidity: TB morbidity in the TGA was reduced from a high of 69 cases in 2009 to a low of 38 cases in Table 18: TB Morbidity Cases in the Planning Region County Hudson
88 Statewide Coordinated Statement of Need Unmet Need: DHSTS Epidemiologic Services Unit is responsible for providing the unmet need data for all Ryan White grantees in New Jersey. Estimates of unmet need are outlined for people living with HIV and AIDS who were diagnosed before 2010 and alive through December 31, 2010 in the Jersey City TGA as of June 30, Individuals with HIV and AIDS who were incarcerated or resided in unknown counties at the time of diagnosis are not included in this analysis. Unmet need refers to the population of HIV infected individuals who are aware of their HIV status but are not engaged in adequate HIV related services. This is defined as having at least one HIV care-related viral load test (VL), CDC count/percent and/or antiretroviral drug within a one-year period. Individuals who had at least one HIV care-related antiretroviral drug, a viral load test and/or CD4 test were considered to have been in care in Unmet Need in the Jersey City TGA Unmet need for the TGA is 48%. Unmet need by HIV/AIDS Status: 86 o Individuals living with HIV have a higher percentage of unmet need (60%) than those living with AIDS (39%). Unmet need by Race/Ethnicity o Hispanics have a higher percentage of unmet need (49%) followed by White, non-hispanics (48%) and Black, non-hispanics (47%). Unmet need by Transmission Mode: o Unmet need by transmission mode is highest for MSM and IDU (51% respectively) followed by MSM/ IDU (48%) and IDU (41%)
89 Appendix II: Regional Profiles Mercer County Planning Region 87
90 Statewide Coordinated Statement of Need Section I: Description of the Mercer County Planning Region The Mercer County Part B Region is one of nine planning regions in the State of New Jersey, located in west central New Jersey. The land area of the Part B Region is 224 square miles with a population density of 1,632 per square miles. Total Population: The population of the Planning Region is 366,513. Race/Ethnicity: The majority of residents in Mercer County are White (61%). Black or African Americans comprise 20% of the population. Table 1 shows the racial/ethnic breakdown of the Planning Region. Table 1: Race/Ethnicity in Planning Region 88 Race Mercer County % White 225, Black or African American 74, American Indian and Alaska Native 1,194 <1 Asian 32,752 9 Native Hawaiian or Other Pacific Islander 295 <1 Other Race 22,856 6 Hispanic/Latino 55, Gender: Within the Planning Region, the percentage of males and females is similar (49% male and 51% female). Age: The majority of residents in Mercer County are between the ages of (7.8%). Mercer County also has a large percentage of residents between the age ranges of and (7.5% respectively). Section II: Social Determinates Data for the Mercer County Planning Region Language: In Mercer County, 73% of residents speak English only at home while 12% speak Spanish. Employment Status: In the Planning Region, the percentage of individuals over the age of 16 who are employed is 67%. Median Household Income: The median household income in the Planning Region is $70,956. Level of Poverty: Twelve percent (12%) of the individuals in the Planning Region are living in poverty. Households Receiving Government Assistance: The percentage of households in the Planning Region receiving cash public assistance is 3%. Seven percent (7%) are receiving food stamps/snap benefits.
91 Appendix II: Regional Profiles MERCER COUNTY PLANNING REGION Housing Owner Occupied vs. Renter-Occupied: Sixty-six percent (66%) of houses in the Planning Region are owner occupied. Median Home Value: The median home value in the Planning Region is $293,600. Renters: The number of occupied units generating rent in Mercer County is 40,407 and the median rent paid is $1,082. In the Planning Region, the majority of individuals (45%) are paying 35% or more of their income in rent. Homeless Population Point-In-Time Count ( ): Within the Planning Region, the homeless population is estimated at 574 individuals. Health Insurance Coverage: In the Planning Region, 88% of residents are reported to have health insurance. Of those with health insurance, 75% have private insurance and 24% are covered under public insurance. The percentage of those who have no health insurance is 12%. Medicaid Beneficiaries: Within Mercer County, there are 4,414 individuals enrolled in Medicaid. Incarcerated: Within the Planning Region, there are 1,309 offenders in correctional institutions. 89 Section III: HIV/AIDS, STI and TB Data for the Mercer County Planning Region DHSTS is responsible for collecting and disseminating HIV/ADIS data. All data is for calendar year 2012 based on NJ Department of Health Division of HIV/AIDS, STD and TB Services data as of December 31, HIV New Diagnoses of HIV by Race/Ethnicity: The majority of new diagnoses of HIV are Black, non-hispanics (70%) followed by Hispanics (16%) and White, non-hispanics (14%). Table 2: New Diagnoses of HIV (not AIDS) by Race/Ethnicity County White, non-hispanic Black, non-hispanic Hispanic Other/ Unknown Total Mercer % New Diagnoses of HIV by Gender: The majority of new diagnoses of HIV in the Planning Region are male (74%).
92 Statewide Coordinated Statement of Need New Diagnoses of HIV by Age Group: The age ranges of (34%) and (32%) comprise the highest percentage of new cases. Table 3: New Diagnoses of HIV (not AIDS) by Age Group County Total Mercer % New Diagnoses of HIV by Transmission Mode: The highest percentages of individuals infected are through Heterosexual contact (55%) followed by MSM (30%) and Other/Unknown (12%). Table 4: New Diagnoses of HIV (not AIDS) by Transmission Mode County MSM IDU MSM/IDU Heterosexual contact Other/ Unknown Total Mercer % New Diagnoses Over Five Year Period: The highest percentage of new infections were seen in 2004 (27%). The percentage of new infections steadily dropped until 2008, when they climbed to a level similar to 2004 (26%). Table 5: New Diagnoses of HIV During Five Year Period County Total Mercer % AIDS New Diagnoses of AIDS by Race/Ethnicity: The majority of new diagnoses of AIDS in the Planning Region are Black, non-hispanics (72%) followed by Hispanics (16%) and White, non-hispanics (12%). Table 6: New Diagnoses of AIDS by Race/Ethnicity County White, non-hispanic Black, non-hispanic Hispanic Other/ Unknown Total Mercer % New Diagnoses of AIDS by Gender: The majority of new diagnoses of AIDS are male (51%).
93 Appendix II: Regional Profiles MERCER COUNTY PLANNING REGION New Diagnoses of AIDS by Age Group: The age ranges of (33%) and (26%) account for the highest percentage of new AIDS cases in the Planning Region. Table 7: New Diagnoses of AIDS by Age Group County Total Mercer % New Diagnoses of AIDS by Transmission Mode: The highest percentage of individuals infected are through Heterosexual contact (58%) followed by IDU (19%) and MSM (16%). Table 8: New Diagnoses of AIDS by Transmission Mode County MSM IDU MSM/IDU Heterosexual contact Other/ Unknown Total Mercer % New Diagnoses of AIDS During Five Year Period: The highest percentage of new infections were seen in 2006 (23%). By 2008, the percent of new infections dropped to 16%. 91 Table 9: New Diagnoses of AIDS During Five Year Period County Total Mercer % HIV/AIDS New Diagnosis of HIV/AIDS by Race/Ethnicity: The majority of new HIV/AIDS diagnoses are Black, non- Hispanics (75%) followed by Hispanics (13%) and White, non-hispanics (12%). Table 10: New Diagnoses of HIV/AIDS by Race/Ethnicity County White, non-hispanic Black, non-hispanic Hispanic Other/ Unknown Total Mercer % New Diagnoses of HIV/AIDS by Gender: The majority of newly diagnosed HIV/AIDS cases are male (69%).
94 Statewide Coordinated Statement of Need New Diagnoses of HIV/AIDS by Age Group: The age ranges with the highest percentage of new HIV/AIDS diagnoses are and (28% respectively). Table 11: New Diagnoses of HIV/AIDS by Age Group County Total Mercer % New Diagnoses of HIV/AIDS by Transmission Mode: The highest percentage of new HIV/AIDS diagnoses are through Heterosexual contact (58%) and MSM (28%). Table 12: New Diagnoses of HIV/AIDS by Transmission Mode County MSM IDU MSM/IDU Heterosexual contact Other/ Unknown Total Mercer % New Diagnoses of HIV/AIDS During Five Year Period: The highest percentage of new infections were seen in 2010 (26%). Since then, the percentage of new infections has declined to 14% in Table 13: New Diagnoses of HIV/AIDS During Five Year Period County Total Mercer % Prevalence of Persons Living with HIV/AIDS Living with HIV/AIDS by Race/Ethnicity: The majority of those living with HIV/AIDS in the Planning Region are Black, non-hispanic (68%). The percentages of Hispanic and White, non-hispanic persons living with HIV/ AIDS are similar (15% and 17% respectively). Table 14: Prevalence of Persons Living with HIV/AIDS by Race/Ethnicity County Hispanic, all races Non-Hispanic, Black Non-Hispanic, White Other/ unknown Total Mercer % Living with HIV/AIDS by Gender: Of the 1,485 individuals living with HIV/AIDS in the Planning Region, 66% are male.
95 Appendix II: Regional Profiles MERCER COUNTY PLANNING REGION Living with HIV/AIDS by Age Group: The age ranges with the highest percentage of individuals living with HIV/AIDS in the Planning Region are (37%) and 55+ (27%). Table 15: Prevalence of Persons Living with HIV/AIDS by Age Group County < Total Mercer % Living with HIV/AIDS by Transmission Mode: The highest percentage of individuals living with HIV/AIDS were infected through Heterosexual contact (45%) followed by MSM (26%) and IDU (19%). Table 16: Prevalence of Persons Living with HIV/AIDS by Transmission Mode County MSM IDU MSM/IDU Heterosexual Other/unknown Total Mercer % STI Data 93 The STIs monitored by DHSTS are Syphilis (primary; secondary; early latent; late, late latent; congenital), Gonorrhea, Chlamydia and Tuberculosis. STI Morbidity: Mercer County has a high number of cases of Chlamydia and Gonorrhea. The majority of Syphilis cases reported in the county are in the early latent stage. Table 17: Reported Sexually Transmitted Infection Morbidity in the Planing Region County Chlamydia Gonorrhea Syphilis: Primary, Secondary Syphilis: Early, Latent Syphilis: Late, Late Latent Syphilis Congenital Mercer TB Morbidity: TB morbidity in the Planning Region ranged from a high of 16 in to a low of 9 in Table 18: TB Morbidity Cases in the Planning Region County Mercer
96 Statewide Coordinated Statement of Need Unmet Need: DHSTS Epidemiologic Services Unit is responsible for providing the unmet need data for all Ryan White grantees in New Jersey. Estimates of unmet need are outlined for people living with HIV and AIDS who were diagnosed before 2010 and alive through December 31, 2010 in the Mercer County Planning Region as of June 30, Individuals with HIV and AIDS who were incarcerated or resided in unknown counties at the time of diagnosis are not included in this analysis. Unmet need refers to the population of HIV infected individuals who are aware of their HIV status but are not engaged in adequate HIV related services. This is defined as having at least one HIV care-related viral load test (VL), CDC count/percent and/or antiretroviral drug within a one-year period. Individuals who had at least one HIV care-related antiretroviral drug, a viral load test and/or CD4 test were considered to have been in care in Unmet Need in the Mercer County Planning Region Unmet need for the Planning Region is 40%. Unmet need by HIV/AIDS Status: 94 o Individuals living with HIV have a higher percentage of unmet need (53%) than those living with AIDS (28%) Unmet need by Race/Ethnicity: o White, non-hispanics have a higher percentage of unmet need (48%) followed by Hispanics (43%) and Black, non-hispanics (37%). Unmet need by Transmission Mode: o Unmet need by transmission mode is highest for MSM and MSM/IDU (44% respectively), followed by IDU (41%) and Heterosexual contact (38%).
97 Appendix II: Regional Profiles Middlesex-Somerset- Hunterdon TGA 95
98 Statewide Coordinated Statement of Need Section I: Description of the Middlesex-Somerset-Hunterdon TGA The Middlesex-Somerset-Hunterdon TGA is one of nine HIV/AIDS planning regions in the State of New Jersey. The TGA is a Part A Planning Region in central New Jersey, comprised of Middlesex, Somerset and Hunterdon Counties. The land area of the TGA is 1,045 square miles. Middlesex County: The County has a total land area of 308 square miles with a population density of 2,621 per square mile. Somerset County: The County has a total land area of 301 square miles with a population density of 1,071 per square mile. Hunterdon County: The County has a total land area of 427 square miles with a population density of 300 per square mile. 96 Total Population: The population of the TGA is 1,261,651. Middlesex County has a population of 809,858, Somerset County has a population of 323,444 and Hunterdon County has a population of 129,349. Race/Ethnicity: The majority of residents in the three counties are White. Middlesex (10%) and Somerset (9%) Counties have the largest percentage of Black/African American residents in the TGA. Middlesex (18%) and Somerset (13%) Counties also have larger Hispanic populations. Table 1 shows the racial/ethnic breakdown of the Planning Region by county. Table 1: Race/Ethnicity in Planning Region Race Middlesex % Somerset % Hunterdon % White 474, , , Black or African American 78, , ,451 3 American Indian and Alaska Native 2,777 <1 556 <1 167 <1 Asian 173, , ,181 3 Native Hawaiian or Other Pacific Islander Other Race 56, , ,570 1 Hispanic/ Latino 148, , ,722 5 Gender: Within the TGA, the percentage of males and females in each county is similar (49% male and 51% female). Age: In each of the counties, the majority of residents are between the ages of (10% in Hunterdon, 9% in Somerset and 8% in Middlesex).
99 Appendix II: Regional Profiles MIDDLESEX-SOMERSET-HUNTERDON TGA Section II: Social Determinates Data for the Middlesex-Somerset-Hunterdon TGA Language: In Hunterdon County, 90% of residents speak English only at home while 4 % speak Spanish. Somerset and Hunterdon Counties have higher percentages of resident who speak Spanish (13% and 12% respectively). Employment Status: In the TGA, the percentage of individuals over the age of 16 who are employed is 68%. Somerset County has the highest percentage of those employed (71%) and Middlesex County (67%). Median Household Income: The median household income in the TGA is $83,415. Hunterdon County has the highest median household income ($97,874) followed by Somerset ($94,270) and Middlesex Counties with the lowest ($76,443). Level of Poverty: Nearly 7% of the individuals in the TGA are living in poverty. The percentage of individuals living in poverty is higher in Middlesex County (8%) than the other two counties (5% for Somerset and 4% for Hunterdon). Households Receiving Government Assistance: The percentage of households in the TGA receiving cash public assistance is 2%. Four percent (4%) are receiving food stamps/snap benefits. Middlesex County has the highest percentage of households receiving cash public assistance income (2%) and food stamps/snap benefits (4%). Housing Owner Occupied vs. Renter-Occupied: Seventy-one percent (71%) of houses in the TGA are owner occupied. Hunterdon County has the highest percentage of owner occupied housing (84%) followed by Somerset (77%) and Middlesex Counties (67%). 97 Median Home Value: The median home value in the TGA is $363,746. Hunterdon County has the highest median home value ($411,400) followed by Somerset ($398,200) and Middlesex Counties ($341,300). Renters: The number of occupied units generating rent in the TGA is 117,590 and the median rent paid is $1,239. Middlesex County has the largest number of occupied rental units (89,297). The highest median monthly rental is in Somerset County ($1,350). In the TGA, the majority of individuals (39%) are paying 35% or more of their income in rent. Hunterdon County have significantly more individuals (51%) paying 35% or more of their income on rent than the other two counties. Table 2: Data on Rental Units, Median Monthly Rent Payments and Percentage of Renters Paying 35% or More of their Income on Rent by County Percentage of Renters County Number of Occupied Units Paying Rent Median Monthly Rent Paying 35% or More of Income on Rent Middlesex 89,297 1, Somerset 21,337 1, Hunterdon 6,956 1,195 51
100 Statewide Coordinated Statement of Need Homeless Population Point-In-Time Count ( ): Within the TGA, the homeless population is estimated at 873 individuals. Middlesex County has the highest estimated number of homeless individuals (571), followed by Somerset (234) and Hunterdon Counties (68). Health Insurance Coverage: In the TGA, 88% of residents are reported to have health insurance. Of those with health insurance, 79% have private insurance and 20% are covered under public insurance. The percentage of those who have no health insurance is 12%. Middlesex County has the lowest percentage of individuals who have health insurance (86%). Middlesex County also has the largest percentage of individuals who have no health insurance. All of the counties have similar percentages of the population who have public health insurance. Somerset and Hunterdon Counties have a similar percentage of individuals (91% and 94%) with health insurance of some kind. Table 3: Percentage of Individuals with Health Insurance and No Health Insurance by County 98 County Health Insurance Private Insurance Public Insurance No Health Insurance Middlesex Somerset Hunterdon Medicaid Beneficiaries: Within the TGA, 5,493 individuals are enrolled in Medicaid. Middlesex County has the highest number of individuals enrolled in Medicaid (3,882), followed by Somerset (1,366) and Hunterdon (245) Counties. Incarcerated: Within the TGA, there are 2,145 offenders in correctional institutions. Middlesex County has significantly more individuals who are incarcerated (1,560) than Somerset (440) and Hunterdon (145) Counties.
101 Appendix II: Regional Profiles MIDDLESEX-SOMERSET-HUNTERDON TGA Section III: HIV/AIDS, STI and TB Data for the Middlesex-Somerset-Hunterdon TGA DHSTS is responsible for collecting and disseminating HIV/ADIS data. All data is for calendar year 2012 based on NJ Department of Health Division of HIV/AIDS, STD and TB Services data as of December 31, HIV New Diagnoses of HIV by Race/Ethnicity: The majority of new diagnoses of HIV are in Middlesex County (69%). White, non-hispanics comprise 44% of new HIV diagnoses in the TGA followed by Black, non-hispanics (31%). Table 4: New Diagnoses of HIV (not AIDS) by Race/Ethnicity County White, non-hispanic Black, non-hispanic Hispanic Other/ Unknown Total % Middlesex Somerset Hunterdon Total % New Diagnoses of HIV by Gender: The majority of new diagnoses of HIV in the TGA are male (69%). New Diagnoses of HIV by Age Group: The age ranges of (25%), (24%) and (22%) comprise the highest percentage of the new infections in the TGA. Table 5: New Diagnoses of HIV (not AIDS) by Age Group County Total Middlesex Somerset Hunterdon Total % New Diagnoses of HIV by Transmission Mode: The highest percentage of individuals infected are through Heterosexual contact (46%) followed by MSM (27%) and Other/Unknown (16%). Table 6: New Diagnoses of HIV (not AIDS) by Transmission Mode County MSM IDU MSM/IDU Heterosexual contact Other/ Unknown Total % Middlesex Somerset Hunterdon Total %
102 Statewide Coordinated Statement of Need New Diagnoses of HIV Over Five Year Period: The highest percentage of new infections occurred between Middlesex County carried the burden of the epidemic in the TGA (74%). Table 7: New Diagnoses of HIV During Five Year Period County Total % Middlesex Somerset Hunterdon Total % AIDS 100 New Diagnoses of AIDS by Race/Ethnicity: The majority of new diagnoses of AIDS are in Middlesex County (66%). Black, non-hispanics comprise 42% of new diagnoses of AIDS followed by Hispanics (29%) and White, non-hispanics (27%). Table 8: New Diagnoses of AIDS by Race/Ethnicity County White, non-hispanic Black, non-hispanic Hispanic Other/ Unknown Total % Middlesex Somerset Hunterdon Total % New Diagnoses of AIDS by Gender: The majority of new diagnoses of AIDS are male (66%). New Diagnoses of AIDS by Age Group: The age ranges of (37%) and (22%) comprise the highest percentage of new AIDS diagnoses in the TGA. Table 9: New Diagnoses of AIDS by Age Group County Total Middlesex Somerset Hunterdon Total %
103 Appendix II: Regional Profiles MIDDLESEX-SOMERSET-HUNTERDON TGA New Diagnoses of AIDS by Transmission Mode: The highest percentage of individuals infected are through Heterosexual contact (47%) followed by MSM (32%) and IDU (14%). Table 10: New Diagnoses of AIDS by Transmission Mode County MSM IDU MSM/IDU Heterosexual contact Other/ Unknown Total % Middlesex Somerset Hunterdon Total % New Diagnoses of AIDS During Five Year Period: The highest percentage of new infections were seen in 2004 (23%). By 2008, the percentage of new infections dropped to 18%. Table 11: New Diagnoses of AIDS During Five Year Period County Total % Middlesex Somerset Hunterdon Total % HIV/AIDS New Diagnoses of HIV/AIDS by Race/Ethnicity: The majority of new diagnoses of HIV/AIDS are in Middlesex County (64%). White, non-hispanics (38%) and Black, non-hispanics (37%) constitute the highest percentages of new HIV/AIDS cases in the TGA. Table 12: New Diagnoses of HIV/AIDS by Race/Ethnicity County White, non-hispanic Black, non-hispanic Hispanic Other/ Unknown Total % Middlesex Somerset Hunterdon Total % New Diagnoses of HIV/AIDS by Gender: The majority of newly diagnosed HIV/AIDS cases in the TGA are male (72%).
104 Statewide Coordinated Statement of Need New Diagnoses of HIV/AIDS by Age Group: The age ranges with the highest diagnoses of HIV/AIDS in the TGA are and (27% respectively). Table 13: New Diagnoses of HIV/AIDS by Age Group County Total Middlesex Somerset Hunterdon Total % New Diagnoses of HIV/AIDS by Transmission Mode: The highest percentage of individuals infected are through Heterosexual contact (48%) and MSM (31%). Table 14: New Diagnoses of HIV/AIDS by Transmission Mode 102 County MSM IDU MSM/IDU Heterosexual contact Other/ Unknown Total % Middlesex Somerset Hunterdon Total % New Diagnoses of HIV/AIDS During Five Year Period: The highest percentage of new infections were seen in 2008 (28%). By 2012, the percentage of new infections dropped to 14%. The majority of new diagnoses during this time period were in Middlesex County (68%). Table 15: New Diagnoses of HIV/AIDS During Five Year Period County Total % Middlesex Somerset Hunterdon 9 # # 6 # Total % # - indicates that data is not available due to small cell size (1-5)
105 Appendix II: Regional Profiles MIDDLESEX-SOMERSET-HUNTERDON TGA Prevalence of Persons Living with HIV/AIDS Living with HIV/AIDS by Race/Ethnicity: The majority of those living with HIV/AIDS in the TGA are Black, non- Hispanic (37%) followed by White, non-hispanic (33%) and Hispanic (27%). County Table 16: Prevalence of Persons Living with HIV/AIDS by Race/Ethnicity Hispanic, all races Non-Hispanic, Black Non-Hispanic, White Other/ unknown Total % Middlesex Somerset Hunterdon Total % Living with HIV/AIDS by Gender: Of the 2,750 individuals living with HIV/AIDS in the TGA, 66% are male. Living with HIV/AIDS by Age Group: The age range with the highest percentage of individuals living with HIV/AIDS in the TGA is (38%) followed by 55+ (28%). Table 17: Prevalence of Persons Living with HIV/AIDS by Age Group 103 County < Total % Middlesex Somerset Hunterdon Total % Living with HIV/AIDS by Transmission Mode: The highest percentage of individuals living with HIV/AIDS were infected through Heterosexual contact (41%) followed by MSM (28%). Table 18: Prevalence of Persons Living with HIV/AIDS by Transmission Mode County MSM IDU MSM/IDU Heterosexual Other/unknown Total % Middlesex Somerset Hunterdon Total %
106 Statewide Coordinated Statement of Need STI Data The STIs monitored by DHSTS are Syphilis (primary; secondary; early latent; late, late latent; congenital), Gonorrhea, Chlamydia and Tuberculosis. STI Morbidity: Middlesex County has significantly more reported cases of Chlamydia and Gonorrhea than Somerset or Hunterdon Counties. Middlesex County also has the highest number of Syphilis cases in the TGA. Table 19: Reported Sexually Transmitted Infection Morbidity in the TGA County Chlamydia Gonorrhea Syphilis: Primary, Secondary Syphilis: Early Latent Syphilis: Late, Late Latent Syphilis Congenital Middlesex Somerset Hunterdon Total TB Morbidity: TB morbidity in the TGA ranged from a high of 81 in 2010 to a low of 59 in Middlesex County had a significantly higher number of TB cases than Somerset or Hunterdon Counties. Table 20: TB Morbidity Cases in the Planning Region County Middlesex Somerset Hunterdon Total
107 Appendix II: Regional Profiles MIDDLESEX-SOMERSET-HUNTERDON TGA Unmet Need: DHSTS Epidemiologic Services Unit is responsible for providing the unmet need data for all Ryan White grantees in New Jersey. Estimates of unmet need are outlined for people living with HIV and AIDS who were diagnosed before 2010 and alive through December 31, 2010 in the Middlesex-Somerset-Hunterdon TGA as of June 30, Individuals with HIV and AIDS who were incarcerated or resided in unknown counties at the time of diagnosis are not included in this analysis. Unmet need refers to the population of HIV infected individuals who are aware of their HIV status but are not engaged in adequate HIV related services. This is defined as having at least one HIV care-related viral load test (VL), CDC count/percent and/or antiretroviral drug within a one-year period. Individuals who had at least one HIV care-related antiretroviral drug, a viral load test and/or CD4 test were considered to have been in care in Unmet Need in the Middlesex-Somerset-Hunterdon TGA Unmet need for the Planning Region is 43%. Unmet need by HIV/AIDS Status: o Middlesex County has the highest percentage of unmet need for individuals living with HIV (59%) followed by Hunterdon (52%) and Somerset (51%) Counties. o Middlesex County has a higher percentage of unmet need for those living with AIDS (33%) followed by Somerset (32%) and Hunterdon (31%) Counties. 105 Unmet need by Race/Ethnicity: o o o In Middlesex County the highest percentage of unmet need is for Hispanics (50%) followed by Black, non-hispanics and White, non-hispanics (41% respectively). In Somerset County the highest percentage of unmet need is for Hispanics (48%) followed by White, non-hispanics (39%) and Black, non-hispanics (38%). In Hunterdon County the highest percentage of unmet need is for Hispanics (50%) followed by White, non-hispanics (40%) and Black, non-hispanics (35%). Unmet need by Transmission Mode: o o o Unmet need by transmission mode is highest for MSM/IDU (53%) followed by IDU (49%) and MSM (43%) in Middlesex County. Unmet need by transmission mode is highest for IDU and Heterosexual contact (44% respectively), followed by MSM (43%) in Somerset County. Unmet need by transmission mode is highest for Heterosexual contact (50%) followed by IDU (46%) and Pediatric Exposure (33%) in Hunterdon County.
108 106 Statewide Coordinated Statement of Need
109 Appendix II: Regional Profiles Monmouth-Ocean Planning Region 107
110 Statewide Coordinated Statement of Need Section I: Description of the Monmouth-Ocean Planning Region The Monmouth-Ocean Part B Region is one of nine planning regions in the State of New Jersey located along the central New Jersey shore. The land area of the Part B Region is 1,096 square miles. Monmouth County: The County has a land area of 468 square miles with a population density of 1,344 per square mile. Ocean County: The County has a land area of 628 square miles with a population density of 917 per square mile. Total Population: The population of the Planning Region is 1,206,947. Monmouth County has a population of 630,380 and Ocean County has a population of 576, Race/Ethnicity: The majority of residents in the two counties are White. The Planning Region also has as noticeable Hispanic/Latino population (9% in Monmouth County and 8% in Ocean County). Monmouth County has a larger percentage of Black/African Americans (5%) than Ocean County (3%). Table 1 shows the racial/ethnic breakdown of the Planning Region by county. Table 1: Race/Ethnicity in Planning Region Race Monmouth % Ocean % White 520, , Black or African American 46, ,164 3 American Indian and Alaska Native 1,211 <1 966 <1 Asian 31, ,081 2 Native Hawaiian or Other Pacific Islander <1 Other Race 18, ,165 3 Hispanic/Latino 108, ,783 8 Gender: Within the counties in the Planning Region, the percentage of males (49%) and females (51%) is similar. Age: In each of the counties, the majority of residents are between the ages of and Section II: Social Determinates Data for the Monmouth-Ocean Planning Region Language: In Ocean County, 88% of the residents speak English only versus Monmouth County (83%). Monmouth County has a higher percentage of individuals (7%) who speak Spanish than Ocean County (6%).
111 Appendix II: Regional Profiles MONMOUTH-OCEAN PLANNING REGION Employment Status: In the Planning Region, the percentage of individuals over the age of 16 who are employed is 64%. Monmouth County has a higher percentage of individuals who are employed (67%) than Ocean County (60%). Median Household Income: The median household income in the Planning Region is $80,816. Monmouth County has a higher median household income ($67,681) than Ocean County ($57,128). Level of Poverty: In the Planning Region, 9% of individuals are living in poverty. The percentage of individuals living in poverty is higher in Ocean County (11%) than in Monmouth County (7%). Households Receiving Government Assistance: The percentage of households in the Planning Region receiving cash public assistance is 1%. Five percent (5%) are receiving food stamps/snap benefits. Ocean County has a higher percentage of households receiving food stamp/snap benefits (6%) than Monmouth County (4%). The number of households in the two counties receiving cash public assistance income is similar (1.4% and 1.5% respectively). Housing Owner Occupied vs. Renter-Occupied: Seventy-eight percent (78%) of houses in the Planning Region are owner-occupied. Ocean County has a higher percentage of owner-occupied housing (81%) than Monmouth County (75%). Median Home Value: The median home value in the Planning Region is $337,151. Monmouth County has a higher median home value ($399,900) than Ocean County ($279,200). 109 Renters: The number of occupied units generating rent in the Planning Region is $93,283 and the median rent paid is $1,243. Monmouth County has a higher percentage of occupied units paying rent (55,657) than Ocean County (37,626). Ocean County has a higher monthly median rent ($1,303) than Monmouth County. In the Planning Region, the majority of individuals (53%) are paying 35% or more of their income in rent. Ocean County has 59% of residents paying 35% or more of their income in rent compared with 49% in Monmouth County. Table 2: Data on Rental Units, Median Monthly Rent Payments and Percentage of Renters Paying 35% or more of their of Income on Rent by County Percentage of Renters Paying County Number of Occupied Units Paying Rent Median Monthly Rent 35% or more of Income on Rent Monmouth 55,657 $1, Ocean 37,626 $1, Homeless Population Point-In-Time Count ( ): Within the Planning Region, the homeless population is estimated at 752 individuals. Ocean County has a higher estimate of homeless individuals (402) than Monmouth County (350).
112 Statewide Coordinated Statement of Need Health Insurance Coverage: In the Planning Region, 91% of residents have health insurance. Of those with health insurance, 76% have private insurance and 29% are covered under public insurance. The percentage of those who have no health insurance is 10%. Both counties in the Planning Region have a similar percentage of individuals with health insurance (90.3% and 90.8%) of some kind. Monmouth County has a higher percentage of individuals who have private insurance (80%). Ocean County has a higher percentage (37%) of individuals who have public health insurance. Both counties have a similar percentage of individuals who have no health insurance (10% respectively). Table 3: Percentage of Individuals with Health Insurance and No Health Insurance by County County Health Insurance Private Insurance Public Insurance No Health Insurance Monmouth Ocean Medicaid Beneficiaries: Within the Planning Region, 6,287 individuals are enrolled in Medicaid. Ocean County (3,787) has a higher number of those enrolled than Monmouth County (2,500). 110 Incarcerated: Within the Planning Region, there are 2,132 offenders in correctional institutions. Monmouth County has a higher number of individuals incarcerated (1,268) than Ocean County (867). Section III: HIV/AIDS, STI and TB Data for the Monmouth-Ocean Planning Region DHSTS is responsible for collecting and disseminating HIV/ADIS data. All data is for calendar year 2012 based on NJ Department of Health Division of HIV/AIDS, STD and TB Services data as of December 31, HIV New Diagnosis of HIV by Race/Ethnicity: The majority of new diagnoses of HIV are in Monmouth County (70%). White, non-hispanics constitute 40% of new HIV diagnoses followed by Black, non-hispanics (37%) and Hispanics (22%). Table 4: New Diagnoses of HIV (not AIDS) by Race/Ethnicity County White, non-hispanic Black, non-hispanic Hispanic Other/ Unknown Total % Monmouth Ocean Total % New Diagnoses of HIV by Gender: The majority of new HIV diagnoses are male (68%).
113 Appendix II: Regional Profiles MONMOUTH-OCEAN PLANNING REGION New Diagnoses of HIV by Age Group: The age ranges of (29%) and (24%) comprise the highest percentage of new HIV infections in the Planning Region. Table 5: New Diagnoses of HIV (not AIDS) by age group County Total Monmouth Ocean Total % New Diagnoses of HIV by Transmission Mode: The highest percentage of individuals infected are through Heterosexual contact (41%) and MSM (38%). Table 6: New Diagnoses of HIV (not AIDS) by Transmission Mode County MSM IDU MSM/IDU Heterosexual contact Other/ Unknown Total % Monmouth Ocean Total % New Diagnoses of HIV Over Five Year Period: The highest percentage of new infections were seen in 2005 (25%). In 2007, the percentage of new infections dropped to 16% only to rise in 2008 to 22%. Table 7: New Diagnoses of HIV During Five Year Period County Total % Monmouth Ocean Total %
114 Statewide Coordinated Statement of Need AIDS New Diagnoses of AIDS by Race/Ethnicity: The majority of new diagnoses of AIDS are in Monmouth County (71%). Black, non-hispanics comprise 43% of new AIDS diagnoses followed by White, non-hispanics (33%) and Hispanics (23%). Table 8: New Diagnoses of AIDS by Race/Ethnicity County White, non-hispanic Black, non-hispanic Hispanic Other/ Unknown Total % Monmouth Ocean Total % New Diagnoses of AIDS by Gender: The majority of new diagnoses of AIDS in the Planning Region are male (60%). 112 New Diagnoses of AIDS by Age Group: The age ranges of (33%) and (30%) comprise the highest percentage of new infections in the Planning Region. Table 9: New Diagnoses of AIDS by Age Group County Total Monmouth Ocean Total % New Diagnoses of AIDS by Transmission Mode: The highest percentage of individuals infected are through Heterosexual contact (58%) followed by IDU (16%) and MSM (15%). Table 10: New Diagnoses of AIDS by Transmission Mode County MSM IDU MSM/IDU Heterosexual contact Other/ Unknown Total % Monmouth Ocean Total %
115 Appendix II: Regional Profiles MONMOUTH-OCEAN PLANNING REGION New Diagnoses of AIDS During Five Year Period: The highest percentage of new infections were seen in 2004 (24%). By 2008, the percentage of new AIDS cases had dropped to 17%. Table 11: New Diagnoses of AIDS During Five Year Period County Total % Monmouth Ocean Total % HIV/AIDS New Diagnosis of HIV/AIDS by Race/Ethnicity: The majority of new diagnoses of HIV/AIDS are in Monmouth County (71%). Black, non-hispanics comprise the majority (39%) of new cases followed by White, non-hispanics (35%). Table 12: New Diagnoses of HIV/AIDS by Race/Ethnicity County White, non-hispanic Black, non-hispanic Hispanic Other/ Unknown Total % Monmouth Ocean Total % New Diagnoses of HIV/AIDS by Gender: The majority of new diagnoses of HIV/AIDS in the Planning Region are male (68%). New Diagnoses of HIV/AIDS by Age Group: The age ranges of (25%), (24%) and (23%) comprise the highest percentage of new infections in the Planning Region. Table 13: New Diagnoses of HIV/AIDS by Age Group County Total Monmouth Ocean Total %
116 Statewide Coordinated Statement of Need New Diagnoses of HIV/AIDS by Transmission Mode: The highest percentage of individuals infected with HIV/AIDS are through Heterosexual contact (49%) followed by MSM (29%). Table 14: New Diagnoses of HIV/AIDS by Transmission Mode County MSM IDU MSM/IDU Heterosexual contact Other/ Unknown Total % Monmouth Ocean Total % New Diagnoses of HIV/AIDS During Five Year Period: The highest percentage of new infections were seen in 2009 (25%). From the number of new infections remained consistent at 17%. The majority of new diagnoses during this time period were in Monmouth County (73%). Table 15: New Diagnoses of HIV/AIDS During Five Year Period County Total % Monmouth Ocean Total % Prevalence of Persons Living with HIV/AIDS Living with HIV/AIDS by Race/Ethnicity: White, non-hispanics comprise 46% of individuals living with HIV/AIDS in the Planning Region followed by Black, non-hispanics (37%). Table 16: Prevalence of Persons Living with HIV/AIDS by Race/Ethnicity County Hispanic, all races Non-Hispanic, Black Non-Hispanic, White Other/ unknown Total % Monmouth Ocean Total % Living with HIV/AIDS by Gender: Of the 2,568 individuals living with HIV/AIDS in the Planning Region, 65% are male.
117 Appendix II: Regional Profiles MONMOUTH-OCEAN PLANNING REGION Living with HIV/AIDS by Age Group: The age ranges of (38%) and 55+ (32%) comprise the highest percentage of persons living with HIV/AIDS in the Planning Region. Table 17: Prevalence of Persons Living with HIV/AIDS by Age Group County < Total % Monmouth Ocean Total % Living with HIV/AIDS by Transmission Mode: The highest percentage of individuals living with HIV/AIDS were infected through Heterosexual contact (36%) followed by MSM (27%) and IDU (22%). Table 18: Prevalence of Persons Living with HIV/AIDS by Transmission Mode County MSM IDU MSM/IDU Heterosexual Other/unknown Total % Monmouth Ocean Total % STI Data The STIs monitored by DHSTS are Syphilis (primary; secondary; early latent; late, late latent; congenital), Gonorrhea, Chlamydia and Tuberculosis. STD Morbidity: Monmouth County has significantly more cases of Chlamydia and Gonorrhea than Ocean County. Monmouth County also has a slightly higher number of reported Syphilis cases as compared to Ocean County. Table 19: Reported Sexually Transmitted Infection Morbidity in the Planning Region County Chlamydia Gonorrhea Syphilis: Primary, Secondary Syphilis: Early Latent Syphilis: Late, Late Latent Syphilis Congenital Monmouth Ocean Total
118 Statewide Coordinated Statement of Need TB Morbidity: TB morbidity in the Monmouth-Ocean Planning Region ranged from a high of 32 cases in 2010 to 13 cases in The disparity in number of TB cases between these two counties has decreased from Additionally, Monmouth County had more cases of TB than Ocean County from whereas the number of cases in Ocean County exceeded those in Monmouth County from 2010 onwards. Table 20: TB Morbidity Cases in the Planning Region County Monmouth Ocean Total
119 Appendix II: Regional Profiles MONMOUTH-OCEAN PLANNING REGION Unmet Need: DHSTS Epidemiologic Services Unit is responsible for providing the unmet need data for all Ryan White grantees in New Jersey. Estimates of unmet need are outlined for people living with HIV and AIDS who were diagnosed before 2010 and alive through December 31, 2010 in the Monmouth-Ocean Planning Region as of June 30, Individuals with HIV and AIDS who were incarcerated or resided in unknown counties at the time of diagnosis are not included in this analysis. Unmet need refers to the population of HIV infected individuals who are aware of their HIV status but are not engaged in adequate HIV related services. This is defined as having at least one HIV care-related viral load test (VL), CDC count/percent and/or antiretroviral drug within a one-year period. Individuals who had at least one HIV care-related antiretroviral drug, a viral load test and/or CD4 test were considered to have been in care in Unmet Need in the Monmouth-Ocean Planning Region Unmet need for the Planning Region is 42%. Unmet need by HIV/AIDS Status: o o Monmouth and Ocean Counties have an equal percentage of unmet need for those living with HIV (55%). Monmouth County has a higher percentage of unmet need for those living with AIDS (32%) than Ocean County (30%). 117 Unmet need by Race/Ethnicity: o o In Monmouth County, the highest percentage of unmet need is for Hispanics (48%) followed by Black, non-hispanics and White, non-hispanics (40% respectively). In Ocean County, the highest percentage of unmet need is for Black, non-hispanics (43%) followed by Hispanics (42%) and White, non-hispanics (40%). Unmet need by Transmission Category: o Unmet need by transmission category is highest for MSM/IDU (49%), IDU (46%) and MSM (43%) in Monmouth County. o Unmet need by transmission category is highest for MSM (42%) followed by Heterosexual contact and IDU (40% respectively) in Ocean County.
120 Statewide Coordinated Statement of Need The Newark EMA 118
121 Appendix II: Regional Profiles Section I: Description of the Newark EMA The Newark EMA (NEMA) is a Part A Planning Region in northern New Jersey and is one of nine HIV/AIDS planning regions. NEMA is comprised of five counties: Essex, Morris, Sussex, Union and Warren. The land area of NEMA is 1,562 square miles. Essex County: The County is 125 square miles and has a population density of 6,211 per square mile. Morris County: The County is 460 square miles and has a population density of 1,069 per square mile. Sussex County: The County is 519 square miles and has a population density of 287 per square mile. Union County: The County is 102 square miles and has a population density of 5,216 per square mile. Warren County: The County is 356 square miles and has a population density of 304 per square mile. Total Population: The population of NEMA is 2,070,701. The population of each county ranges from roughly 785,000 to 105,000 persons. 119 Race/Ethnicity: The racial/ethnic profiles of Morris, Sussex and Warren Counties are similar, as are the racial/ ethnic profiles of Essex and Union Counties. Table 1 shows the racial/ethnic breakdown of NEMA by county. Table 1: Race/Ethnicity in NEMA Race Essex % Morris % Sussex % Union % Warren % White 333, , , , , Black or African American 320, , , , ,818 4 American Indian and Alaska Native 3,056 <1 805 <1 234 <1 2,080 <1 155 <1 Asian 35, , , , ,673 3 Native Hawaiian or Other Pacific Islander Other Race 65, , , , ,964 2 Hispanic/ Latino 159, , , , ,659 7 Gender: Within the counties in NEMA, the percentage of males (49%) and females (52%) are similar.
122 Statewide Coordinated Statement of Need Age: In NEMA, the largest percentages of individuals are between the age ranges of (8.3%), (7.8%) and (7.7%). In each of the five counties, the majority of residents are also between the ages of Table 2: Percentage of the Top Three Age Ranges of Residents by County County Essex Morris Sussex Union Warren Section II: Social Determinates Data for NEMA Language: Within NEMA, 77% of residents speak English only at home and 12% speak Spanish. The counties of Essex (19%) and Warren (15%) have the highest percent of residents who speak Spanish at home. 120 Table 3: Percentage of Residents Speaking English and Spanish at Home County English Only Spanish Essex Morris Sussex 90 5 Union 89 5 Warren Employment Status: In NEMA, the percentage of individuals over the age of 16 who are employed is 68%. Sussex (70%) and Union (69%) Counties have the highest percent of individuals employed. Table 4: Percentage of Individuals Employed by County County Percentage Employed Essex 65 Morris 68 Sussex 70 Union 69 Warren 67
123 Appendix II: Regional Profiles THE NEWARK EMA Median Household Income: The median household income in NEMA is $67,480. Morris County has the highest median household income ($91,469) and Essex County has the lowest ($52,394). Table 5: Median Household Income by County County Median Household Income Essex $52,394 Morris $91,469 Sussex $84,115 Union $66,665 Warren $71,832 Levels of Poverty: In NEMA, 11% of individuals are living in poverty. Essex County has the highest percentage of residents living in poverty (17%) while Sussex and Morris Counties have the lowest (6% respectively). Table 6: Percentage of Individuals Living in Poverty by County County Percentage Living in Poverty Essex 17 Morris 6 Sussex 6 Union 11 Warren Households Receiving Government Assistance: The percentage of households in NEMA receiving cash public assistance is 3%. Five percent (5%) are receiving food stamps/snap benefits. Essex County has the largest percentage of households receiving cash public assistance (5%) and food stamps/snap benefits (14%). Morris County has the lowest percentage of households receiving cash public assistance (1%) and food stamps/snap benefits (2%). Table 7: Percentage of Households Receiving Government Assistance by County County Cash Public Assistance Income % Food Stamp/SNAP Benefits % Essex 5 14 Morris 1 2 Sussex 3 5 Union 3 5 Warren 2 5
124 Statewide Coordinated Statement of Need Housing Owner Occupied vs. Renter-Occupied: Sixty-one percent (61%) of houses in NEMA are owneroccupied. The percentage of houses that are renter-occupied in NEMA are 40%. Sussex County has the highest percentage of owner-occupied housing (84%) and Essex has the highest percentage of renteroccupied housing (55%). Table 8: Percentage of Owner-Occupied and Renter-Occupied Housing by County County Percentage Owner-Occupied Percentage Renter-Occupied Essex Morris Sussex Union Warren Median Home Value: The median home value in NEMA is $381,216. The highest median home value is in Morris County ($444,100), while the lowest is in Warren County ($287,700). 122 Table 9: Median Home Value by County County Median Home Value Essex $374,000 Morris $444,100 Sussex $293,700 Union $378,300 Warren $287,700 Renters: The number of occupied units generating rent in NEMA is 264,914 and the median rent paid is $1,088. The majority of individuals in NEMA (44%) are paying 35% or more of their income in rent. Warren County has the highest percentage of renters (49%) paying 35% or more of their income in rent while Morris County (38%) has the lowest percentage. Essex County has the highest number of occupied rental units (141,085) and Sussex County has the lowest number (7,808). The highest median monthly rent payment is in Morris County ($1,257). Warren County ($902) has the lowest median monthly rent. Table 10: Data on Rental Units, Median Monthly Rent Payments and Percentage of Renters Paying 35% or more of their Income on Rent by County Percentage of Renters County Number of Occupied Units Paying Rent Median Monthly Rent Paying 35% or more of Income on Rent Essex 141,085 $ Morris 38,760 $1, Sussex 7,808 $1, Union 68,637 $1, Warren 8,624 $902 49
125 Appendix II: Regional Profiles THE NEWARK EMA Homeless Population Point-In-Time Count ( ): Within NEMA, there are 2,382 individuals who are identified as homeless. Essex County has the highest number of homeless individuals (1,003) while Sussex County has the lowest number (78). Table 11: Number of Homeless Individuals by County County Number of Homeless Individuals Essex 1,003 Morris 247 Sussex 78 Union 887 Warren 167 Health Insurance Coverage: In NEMA, 86% of residents have health insurance of some kind. Of those with health insurance, 70% have private insurance and 25% are covered under public insurance. The percentage of those who have no health insurance is 15%. Sussex County has the highest percentage (92%) of residents with health insurance of some kind. Of those individuals in Sussex County with health insurance, the majority (81%) have private insurance. Twenty-one percent (21%) are covered under public insurance and 8% have no insurance at all. 123 Union and Essex Counties have the highest percentage of individuals with publicly funded insurance (26% and 30%). The county with the highest percentage of individuals with no health insurance is Essex (18%) followed by Union County (17%). Table 12. Percentage of Individuals with Health Insurance and No Health Insurance by County County Health Insurance Private Insurance Public Insurance No Health Insurance Essex Morris Sussex Union Warren Medicaid: Within NEMA, 21,194 individuals are enrolled in Medicaid. Essex County has the highest number of individuals enrolled in Medicaid (14,161) followed by Union County (4,299). Table 13: Number of Individuals Enrolled in Medicaid by County County Medicaid Essex 14,161 Morris 1,468 Sussex 620 Union 4,299 Warren 645
126 Statewide Coordinated Statement of Need Incarcerated: There are 6,561 offenders in correctional institutions in NEMA. Essex County has the highest number of incarcerated individuals (3,843). Sussex County has the lowest number of incarcerated individuals (172). Table 14: Number of Incarcerated Individuals by County County Number of Incarcerated Essex 3,843 Morris 385 Sussex 172 Union 1,985 Warren 176 Section III: HIV/AIDS, STI and TB Data for NEMA DHSTS is responsible for collecting and disseminating HIV/ADIS data. All data is for calendar year 2012 based on NJ Department of Health Division of HIV/AIDS, STD and TB Services data as of December 31, HIV New Diagnoses of HIV by Race/Ethnicity: The majority of new diagnoses of HIV are in Essex County (75%). Black, non-hispanics comprise 69% of new HIV diagnoses followed by Hispanics (21%). Table 15: New Diagnoses of HIV (not AIDS) by Race/Ethnicity County White, non-hispanic Black, non-hispanic Hispanic Other/ Unknown Total % Essex Morris Sussex Union Warren Total % New Diagnoses of HIV by Gender: The majority of new diagnoses of HIV are male (58%). Table 16: New Diagnoses of HIV (not AIDS) by Gender County Male % Female % Total % Essex Morris Sussex Union Warren Total
127 Appendix II: Regional Profiles THE NEWARK EMA New Diagnoses of HIV by Age Group: The age ranges of (27%), (24%) and (22%) comprise the highest percent of new infections in NEMA. Essex County has the highest number of individuals infected in all age ranges. Table 17: New Diagnoses of HIV (not AIDS) by Age Group County Total Essex Morris Sussex Union Warren Total % New Diagnoses of HIV by Transmission Mode: The highest percentage of individuals infected are through Heterosexual contact (47%) followed by Other/Unknown (24%). Table 18: New Diagnoses of HIV by Transmission Mode County MSM IDU MSM/IDU Heterosexual contact Other/ Unknown Total % Essex Morris Sussex <1 Union Warren <1 Total % New Diagnoses of HIV Over Five Year Period: The highest percentage of new infections were seen between Essex County carried the burden of the epidemic in NEMA (75%), while Warren County had the lowest percentage of new infections (<1%). By 2008, the percentage of new infections dropped to 17%. Table 19: New Diagnoses of HIV During Five Year Period County Total % Essex Morris Sussex Union Warren <1 Total %
128 Statewide Coordinated Statement of Need AIDS New Diagnoses of AIDS by Race/Ethnicity: The majority of new diagnoses of AIDS are in Essex County (75%) followed by Union County (18%). Black, non-hispanics comprised 74% of new diagnoses of AIDS followed by Hispanics (19%). Table 20: New Diagnoses of AIDS by Race/Ethnicity County White, non-hispanic Black, non-hispanic Hispanic Other/ Unknown Total % Essex Morris Sussex Union Warren Total % New Diagnoses of AIDS by Gender: The majority of new diagnoses of AIDS are male (58%). Table 21: New Diagnoses of AIDS by Gender County Male % Female % Total % Essex Morris Sussex Union Warren Total New Diagnoses of AIDS by Age Group: The age ranges of (32%) and (29%) comprise the highest percentages of new AIDS diagnoses in NEMA. Table 22: New Diagnoses of AIDS by Age Group County Total Essex Morris Sussex Union Warren Total %
129 Appendix II: Regional Profiles THE NEWARK EMA New Diagnoses of AIDS by Transmission Mode: The highest percentage of individuals infected are through Heterosexual contact (51%) followed by Other/Unknown (19%), MSM (15%) and IDU (14%). Table 23: New Diagnoses of AIDS by Transmission Mode County MSM IDU MSM/IDU Heterosexual contact Other/ Unknown Total % Essex Morris Sussex <1 Union Warren <1 Total % Diagnoses of AIDS During Five Year Period: The highest percentage of new infections were seen in 2007 (30%). Union County carried 52% of the AIDS cases in NEMA, followed by Essex County (33%). By 2008, the percentage of new infections dropped to 18%. Table 24: New Diagnoses of AIDS During Five Year Period County Total % Essex Morris Sussex Union Warren Total % HIV/AIDS New Diagnoses of HIV/AIDS by Race/Ethnicity: The majority of new diagnoses of HIV/AIDS are in Essex County (76%). Black, non-hispanics comprise 70% of new HIV/AIDS diagnoses followed by Hispanics (21%). Table 25: New Diagnoses of HIV/AIDS by Race/Ethnicity County White, non-hispanic Black, non-hispanic Hispanic Other/ Unknown Total % Essex Morris Sussex Union Warren Total %
130 Statewide Coordinated Statement of Need New Diagnoses of HIV/AIDS by Gender: The majority of new diagnoses of HIV/AIDS in NEMA are male (60%). Table 26: New Diagnoses of HIV/AIDS by Gender County Male % Female % Total % Essex Morris Sussex Union Warren Total New Diagnoses of HIV/AIDS by Age Group: The age ranges of (31%), (23%) and (22%) comprise the highest percentage of new HIV/AIDS diagnoses in NEMA. Table 27: New Diagnoses of HIV/AIDS by Age Group 128 County Total Essex Morris Sussex Union Warren Total % < New Diagnoses of HIV/AIDS by Transmission Mode: The highest percentage of individuals infected are through Heterosexual contact (48%), Other/Unknown (27%) and MSM (20%). Table 28: New Diagnoses of HIV/AIDS by Transmission Mode County MSM IDU MSM/IDU Heterosexual contact Other/ Unknown Total % Essex Morris Sussex <1 Union Warren <1 Total %
131 Appendix II: Regional Profiles THE NEWARK EMA New Diagnoses of HIV/AIDS During Five Year Period: The highest percentage of new infections were seen in 2009 (23%). By 2012, the percentage of new infections dropped to 14%. The majority of new diagnoses during this time period were in Essex County (74%). Table 29: New Diagnoses of HIV/AIDS During Five Year Period County Total % Essex Morris Sussex # # Union Warren # # # # # 5+ 0 Total % # - indicates that data is not available due to small cell size (1-5) Prevalence of Persons Living with HIV/AIDS Living with HIV/AIDS by Race/Ethnicity: The majority of those living with HIV/AIDS in the EMA are Black, non- Hispanic (69%). Hispanics and White, non-hispanics comprise 17% and 13% of persons living with HIV/AIDS in the EMA respectively. 129 Table 30: Prevalence of Persons Living with HIV/AIDS by Race/Ethnicity County Hispanic, all races Non-Hispanic, Black Non-Hispanic, White Other/ unknown Total % Essex Morris Sussex Union Warren Total % Living with HIV/AIDS by Gender: Of the 13,659 individuals living with HIV/AIDS in the EMA, 62% are male.
132 Statewide Coordinated Statement of Need Living with HIV/AIDS by Age Group: The age range with the highest percentage of individuals living with HIV/AIDS in the EMA is (37%) followed by 55+ (30%). Table 31: Prevalence of Persons Living with HIV/AIDS by Age Group County < Total % Essex Morris Sussex Union Warren # # Total % # - indicates that data is not available due to small cell size (1-5) Living with HIV/AIDS by Transmission Mode: The highest percentage of individuals living with HIV/AIDS were infected through Heterosexual contact (43%) followed by IDU (21%) and MSM (18%). 130 Table 32: Prevalence of Persons Living with HIV/AIDS by Transmission Mode County MSM IDU MSM/IDU Heterosexual Other/unknown Total % Essex Morris Sussex Union Warren Total % STI Data The STIs monitored by DHSTS are Syphilis (primary; secondary; early latent; late, late latent; congenital), Gonorrhea, Chlamydia and Tuberculosis. STI Morbidity: Essex County has significantly more reported cases of Chlamydia, Gonorrhea, and Syphilis than any other county in the Newark EMA. Union and Morris Counties both had large numbers of reported cases of Chlamydia, and Union County had a high number of Gonorrhea and Syphilis cases. Congenital Syphilis was reported only in Morris County. Table 33: Reported Sexually Transmitted Infection Morbidity in the EMA County Chlamydia Gonorrhea Syphilis: Primary, Secondary Syphilis: Early Latent Syphilis: Late, Late Latent Syphilis Congenital Essex Morris Sussex Union Warren Total
133 Appendix II: Regional Profiles THE NEWARK EMA TB Morbidity: TB morbidity in the TGA ranged from a high of 125 in 2008 to a low of 73 in Essex and Union Counties had significantly higher numbers of TB cases than the other counties in the EMA. Table 34: TB Morbidity in the EMA County Essex Morris Sussex Union Warren Total Unmet Need: DHSTS Epidemiologic Services Unit is responsible for providing the unmet need data for all Ryan White grantees in New Jersey. Estimates of unmet need are outlined for people living with HIV and AIDS who were diagnosed before 2010 and alive through December 31, 2010 in NEMA as of June 30, Individuals with HIV and AIDS who were incarcerated or resided in unknown counties at the time of diagnosis are not included in this analysis. Unmet need refers to the population of HIV infected individuals who are aware of their HIV status but are not engaged in adequate HIV related services. This is defined as having at least one HIV care-related viral load test (VL), CDC count/percent and/or antiretroviral drug within a one-year period. Individuals who had at least one HIV care-related antiretroviral drug, a viral load test and/or CD4 test were considered to have been in care in Unmet Need in NEMA Unmet need for the Planning Region is 46%. Unmet need by HIV/AIDS Status: o Essex County has the highest percentage of unmet need for individuals living with HIV (61%) followed by Warren (60%), Union (58%), Morris (49%) and Sussex (49%) Counties. o Warren County has the highest percentage of unmet need for those living with AIDS (42%) followed by Sussex (36%), Morris (36%), Essex (35%) and Union (33%) Counties. Unmet need by Race/Ethnicity: o o o o o In Essex County, the highest percentage of unmet need is for Hispanics (52%) followed by Black, non- Hispanics and White, non-hispanics (47% respectively). In Morris County, the highest percentage of unmet need is for Black, non-hispanics (47%) followed by White, non-hispanics (40%) and Hispanics (39%). In Sussex County, the highest percentage of unmet need is for Black, non-hispanics and White, non- Hispanics (43% respectively) followed by Hispanics (36%). In Union County, the highest percentage of unmet need is for Hispanics (50%) followed by White, non-hispanics (42%) and Black, non-hispanics (40%). In Warren County, the highest percentage of unmet need is for Black, non-hispanics (53%) followed
134 Statewide Coordinated Statement of Need by White, non-hispanics (49%) and Hispanics (44%). Unmet need by Transmission Mode: o o o o o Unmet need by transmission mode is highest for MSM/IDU (52%), IDU (50%) and MSM (47%) in Essex County. Unmet need by transmission mode is highest for IDU (47%), MSM/IDU (41%) and MSM (39%) in Morris County. Unmet need by transmission mode is highest for IDU (44%), MSM (43%) and Heterosexual contact (42%) in Sussex County. Unmet need by transmission mode is highest for MSM/IDU (60%), IDU (44%) and MSM (43%) in Union County. Unmet need by transmission mode is highest for IDU (58%), MSM (52%) and Heterosexual contact (37%) in Warren County. 132
135 Appendix II: Regional Profiles The South Jersey Planning Region 133
136 Statewide Coordinated Statement of Need Section I: Description of the South Jersey Planning Region The Philadelphia EMA is a Part A planning region that includes four adjacent counties in New Jersey. The four New Jersey counties comprise the South Jersey Part B Planning Region, one of nine planning regions in the State of New Jersey. The Part B Region is comprised of Burlington, Camden, Gloucester and Salem Counties. It is an ethnically and economically diverse area that is urban, suburban and rural. The land area of the Part B Region is 1,690 square miles. The largest city, Camden, is five miles from Philadelphia. Burlington County: The County has a total area of 799 square miles and 561 persons per square mile. Camden County: The County has a total area of 221 square miles and 2,321 persons per square mile. Gloucester County: The County has a total area of 322 square miles and 895 persons per square mile. 134 Salem County: The County has a total area of 322 square miles and 895 persons per square mile. Total Population: The population of the Planning Region is 1,316,762. Burlington County has a population of 448,734, Camden County has a population of 513,657, Gloucester County has a population of 288,288, and Salem County has a population of 66,083. Race/Ethnicity: The majority of residents in the Planning Region are White. Camden (20%) and Burlington Counties (17%) have the highest percentage of Black/African Americans. Camden County also has the highest percentage of Hispanics/Latinos (14%). Table 1: Race/Ethnicity in Planning Region Race Burlington % Camden % Gloucester % Salem % White 331, , , , Black or African American 74, , , , American Indian and Alaska Native 985 <1 1,608 <1 501 <1 240 <1 Asian 19, , , <1 Native Hawaiian or Other Pacific Islander Other Race 9, , , ,745 3 Hispanic/ Latino 28, , , ,507 7 Gender: Within the Planning Region, the percentage of males and females in each county is similar (49% male and 51% female).
137 Appendix II: Regional Profiles SOUTH JERSEY PLANNING REGION Age: In each of the counties, the majority of residents are between the ages of and Table 2: Highest Percentages of Population by Age Range County Burlington 8.6% 8.2% Camden 7.6% 7.7% Gloucester 8.3% 7.9% Salem 7.9% 8.0% Section II: Social Determinates Data for South Jersey Planning Region Language: Gloucester County has the highest percentage of residents that speak English only (91%) at home. Camden County has the highest percentage of households that speak Spanish (12%). Table 3: Percentage of Residents Speaking English Only and Spanish at Home County English Only Spanish Burlington 88 4 Camden Gloucester 91 3 Salem N/A N/A 135 Employment Status: In the Planning Region, the percentage of individuals over the age of 16 who are employed is 68%. Salem County has the lowest percentage of individuals employed (62%). The remaining counties in the Planning Region have similar percentages of those employed (70%-68%). Median Household Income: The median household income in the Planning Region is $40,527. Burlington County has the highest median household income ($74,329) followed by Gloucester County ($70,514). Camden ($57,352) and Salem Counties ($56,357) have the lowest median household income. Level of Poverty: Nearly nine percent (9%) of the individuals in the Planning Region are living in poverty. The percentage of individuals living in poverty is highest in Camden (12%) and Salem (11%) Counties. Gloucester (6%) and Burlington (5%) Counties have a lower percentage of individuals living in poverty. Households Receiving Government Assistance: The percentage of households in the Planning Region receiving cash public assistance is 3%. Nearly seven percent (7%) are receiving food stamps/snap benefits. Gloucester County has the highest percentage of households receiving cash public assistance (4%). Salem County has the highest percentage of households receiving food stamps/snap benefits (10%). Table 4: Percentage of Households Receiving Government Assistance by County County Cash Public Assistance Income % Food Stamp/SNAP Benefits % Burlington 2 3 Camden 4 9 Gloucester 4 7 Salem 3 10
138 Statewide Coordinated Statement of Need Housing Owner Occupied vs. Renter-Occupied: Seventy-four percent (74%) of houses in the Planning Region are owner-occupied. Gloucester County has the highest percentage of owner-occupied housing (80%) followed by Burlington (78%), Salem (72%) and Camden Counties (68%). Median Home Value: The median home value in the Planning Region is $236,152. Burlington County has the highest ($265,500) median home value followed by Gloucester ($231,100), Camden ($218,300) and Salem Counties ($196,100). Renters: The number of occupied units generating rent in the Planning Region is 117,391 and the median rent paid is $1,021. Camden County has the largest number of occupied rental units (58,204). The highest median monthly rent is in Burlington County ($1,157). In the Planning Region, the majority of individuals (48%) are paying 35% or more of their income in rent. Residents of Camden County have significantly more individuals (52%) paying 35% or more of their income on rent than the other three counties. Table 5: Data on Rental Units, Median Monthly Rent Payments and Percentage of Renters Paying 35% or more of Income on Rent by County 136 Percentage of Renters Number of Occupied Units Median Monthly Rent Paying 35% or more of Paying Rent County Income on Rent Burlington 32,732 $1, Camden 58,204 $ Gloucester 19,662 $ Salem 6,793 $ Homeless Population Point-In-Time Count ( ): Within the Planning Region, the homeless population is estimated at 1,372 individuals. Burlington County has the highest number of homeless (657) individuals followed by Gloucester (564), Camden (99) and Salem Counties (52). Health Insurance Coverage: In the Planning Region, 90% of residents are reported to have health insurance of some kind. Of those with health insurance, 76% have private insurance and 26% are covered under public insurance. The percentage of those who have no health insurance is 10% Burlington County has the largest percentage of individuals who have health insurance (93%) of some kind. Camden County has the lowest percentage of individuals who have health insurance (88%). Salem and Camden Counties each have the lowest percentage of individuals (74% and 68%) who have private insurance. These counties also have the highest percentage of individuals who have public health insurance. Camden County has the highest percentage of individuals with no health insurance in the Planning Region. Table 6: Percentage of Individuals with Health Insurance and No Health Insurance by County County Health Insurance Private Insurance Public Insurance No Health Insurance Burlington Camden Gloucester Salem
139 Appendix II: Regional Profiles SOUTH JERSEY PLANNING REGION Medicaid Beneficiaries: Within the Planning Region, 17,580 individuals are enrolled in Medicaid. Camden County has the largest number of individuals enrolled in Medicaid (8,883) followed by Burlington (4,295), Gloucester (3,595) and Salem Counties (807). Incarcerated: Within the Planning Region, there are 4,413 offenders in correctional institutions. Camden County has the largest number of individuals (2,894) who are incarcerated followed by Burlington (822), Gloucester (445) and Salem Counties (252). Section III: HIV/AIDS, STI and TB Data for the South Jersey Planning Region DHSTS is responsible for collecting and disseminating HIV/ADIS data. All data is for calendar year 2012 based on NJ Department of Health Division of HIV/AIDS, STD and TB Services data as of December 31, HIV New Diagnoses of HIV by Race/Ethnicity: The majority of new diagnoses of HIV are in Camden County (58%). Black, non-hispanics comprise 58% of new diagnoses in the Planning Region followed by White, non-hispanics (26%). Table 7: New Diagnoses of HIV (not AIDS) by Race/Ethnicity 137 County White, non-hispanic Black, non-hispanic Hispanic Other/ Unknown Total % Burlington Camden Gloucester Salem Total % New Diagnoses of HIV by Gender: The majority of new diagnoses of HIV in the Planning Region are male (58%). New Diagnoses of HIV by Age Group: The age ranges of (34%) comprise the highest percentage of new infections in the Planning Region. Individuals between the ages of account for 26% of new infections. Table 8: New Diagnoses of HIV (not AIDS) by Age Group County Total Burlington Camden Gloucester Salem Total %
140 Statewide Coordinated Statement of Need New Diagnoses of HIV by Transmission Mode: The highest numbers of individuals infected are through MSM (46%) and Heterosexual contact (41%). Table 9: New Diagnoses of HIV (not AIDS) by Transmission Mode County MSM IDU MSM/IDU Heterosexual contact Other/ Unknown Total % Burlington Camden Gloucester Salem Total % New Diagnoses of HIV Over Five Year Period: The highest number of new infections were seen in 2004 (24%). The lowest number of new infections were seen in 2007 (16%), only to increase to 21% in Table 10: New Diagnoses of HIV During Five Year Period County Total % Burlington Camden Gloucester Salem Total % AIDS New Diagnoses of AIDS by Race/Ethnicity: The majority of new diagnoses of AIDS are in Camden County (55%). Black, non-hispanics comprise 59% of new AIDS cases followed by White, non-hispanics (25%) and Hispanics (14%). Table 11: New Diagnoses of AIDS by Race/Ethnicity County White, non-hispanic Black, non-hispanic Hispanic Other/ Unknown Total % Burlington Camden Gloucester Salem Total % New Diagnoses of AIDS by Gender: The majority of new diagnoses of AIDS in the Planning Region are male (67%).
141 Appendix II: Regional Profiles SOUTH JERSEY PLANNING REGION New Diagnoses by Age Group: The age ranges of (35%) and (30%) comprise the highest percentage of new infections in the Planning Region. Table 12: New Diagnoses of AIDS by Age Group County Total Burlington Camden Gloucester Salem Total % New Diagnoses of AIDS by Transmission Mode: The highest percentage of individuals diagnosed with AIDS are through Heterosexual contact (51%) followed by MSM (27%) and IDU (13%). Table 13: New Diagnoses of AIDS by Transmission Mode County MSM IDU MSM/IDU Heterosexual contact Other/ Unknown Total % Burlington Camden Gloucester Salem Total % New Diagnoses of AIDS During Five Year Period: The highest percentages of new infections were seen between (22% respectively). AIDS cases were relatively stable between (averaging 17.5%). Table 14: New Diagnoses of AIDS During Five Year Period County Total % Burlington Camden Gloucester Salem Total %
142 Statewide Coordinated Statement of Need HIV/AIDS New Diagnoses of HIV/AIDS by Race/Ethnicity: The majority of new diagnoses of HIV/AIDS are in Camden County (55%). Black, non-hispanics constitute 59% of new HIV/AIDS cases in the Planning Region followed by White, non-hispanics (25%). Table 15: New Diagnoses of HIV/AIDS by Race/Ethnicity County White, non-hispanic Black, non-hispanic Hispanic Other/ Unknown Total % Burlington Camden Gloucester Salem Total % New Diagnoses of HIV/AIDS by Gender: The majority of newly diagnosed HIV/AIDS cases are male (67%). 140 New Diagnoses of HIV/AIDS by Age Group: The age ranges of (35%) and (31%) comprise the highest percentages of new HIV/AIDS diagnoses in the Planning Region. Table 16: New Diagnoses of HIV/AIDS by Age Group County Total Burlington Camden Gloucester Salem Total % New Diagnoses of HIV/AIDS by Transmission Mode: The highest percentage of individuals infected are through Heterosexual contact (51%) followed by MSM (27%). Table 17: New Diagnoses of HIV/AIDS by Transmission Mode County MSM IDU MSM/IDU Heterosexual contact Other/ Unknown Total % Burlington Camden Gloucester Salem Total %
143 Appendix II: Regional Profiles SOUTH JERSEY PLANNING REGION New Diagnoses of HIV/AIDS During Five Year Period: The highest percentage of new infections were seen in 2008 (25%). By 2012, the percentage of new infections dropped to 14%. The majority of new diagnoses during this time period were in Camden County (55%) and Burlington County (30%). Table 18: New Diagnoses of HIV/AIDS During Five Year Period County Total % Burlington Camden Gloucester Salem # # 7 # # Total % # - indicates that data is not available due to small cell size (1-5) Prevalence of Persons Living with HIV/AIDS Living with HIV/AIDS by Race/Ethnicity: The majority of those living with HIV/AIDS in the Planning Region are Black, non-hispanic (49%) followed by White, non-hispanic (33%). 141 Table 19: Prevalence of Persons Living with HIV/AIDS by Race/Ethnicity County Hispanic, all races Non-Hispanic, Black Non-Hispanic, White Other/ unknown Total % Burlington Camden Gloucester Salem Total % Living with HIV/AIDS by Gender: Of the 3,146 individuals living with HIV/AIDS in the Planning Region, 70% are male. Living with HIV/AIDS by Age Group: The age range with the highest percentage of individuals living with HIV/AIDS in the Planning Region is (39%) followed by 55+ (25%) and (21%). Table 20: Prevalence of Persons Living with HIV/AIDS by Age Group County < Total % Burlington Camden Gloucester Salem Total % # - indicates that data is not available due to small cell size (1-5)
144 Statewide Coordinated Statement of Need Living with HIV/AIDS by Transmission Mode: The highest percentage of individuals living with HIV/AIDS were infected through Heterosexual contact (41%) followed by MSM (33%). Table 21: Prevalence of Persons Living with HIV/AIDS by Transmission Mode County MSM IDU MSM/IDU Heterosexual Other/unknown Total % Burlington Camden Gloucester Salem Total % STI Data The STIs monitored by DHSTS are Syphilis (primary; secondary; early latent; late, late latent; congenital), Gonorrhea, Chlamydia and Tuberculosis 142 STI Morbidity: All counties had a high number of Chlamydia cases. Camden, Burlington, and Gloucester Counties had a large number of reported Gonorrhea cases, though Camden County s numbers were significantly higher. Camden County also had the highest number of reported Syphilis cases. Table 22: Reported Sexually Transmitted Infection Morbidity in the Planning Region County Chlamydia Gonorrhea Syphilis: Primary, Secondary Syphilis: Early Latent Syphilis: Late, Late Latent Syphilis Congenital Burlington Camden Gloucester Salem Total TB Morbidity: TB morbidity in the TGA ranged from a high of 34 in 2010 to a low of 23 in Camden County had the highest number of TB cases followed by Burlington County. Table 23: TB Morbidity Cases by Planning Region County Burlington Camden Gloucester Salem Total
145 Appendix II: Regional Profiles SOUTH JERSEY PLANNING REGION Unmet Need: DHSTS Epidemiologic Services Unit is responsible for providing the unmet need data for all Ryan White grantees in New Jersey. Estimates of unmet need are outlined for people living with HIV and AIDS who were diagnosed before 2010 and alive through December 31, 2010 in the South Jersey Planning Region as of June 30, Individuals with HIV and AIDS who were incarcerated or resided in unknown counties at the time of diagnosis are not included in this analysis. Unmet need refers to the population of HIV infected individuals who are aware of their HIV status but are not engaged in adequate HIV related services. This is defined as having at least one HIV care-related viral load test (VL), CDC count/percent and/or antiretroviral drug within a one-year period. Individuals who had at least one HIV care-related antiretroviral drug, a viral load test and/or CD4 test were considered to have been in care in Unmet Need in the South Jersey Planning Region Unmet need for the Planning Region is 52%. Unmet need by HIV/AIDS Status: o o Burlington County has the highest percentage of unmet need for individuals living with HIV (67%) followed by Camden (64%), Salem (63%) and Gloucester (60%) Counties. Burlington and Gloucester Counties have the higher percentage of unmet need for those living with AIDS (42% respectively), followed by Camden (40%) and Salem (17%) Counties. 143 Unmet need by Race/Ethnicity: o o o o In Burlington County, the highest percentage of unmet need is for Hispanics (68%) followed by White, non-hispanics (55%) and Black, non-hispanics (50%). In Camden County, the highest percentage of unmet need is for Hispanics (52%) followed by White, non-hispanics (51%) and Black, non-hispanics (50%). In Gloucester County, the highest percentage of unmet need is for Hispanics (65%) followed by White, non-hispanics (49%) and Black, non-hispanics (48%). In Salem County, the highest percentage of unmet need is for Hispanics (67%) followed by White, non-hispanics (36%) and Black, non-hispanics (36%). Unmet need by Transmission Category: o Unmet need by transmission category is highest for MSM/IDU (65%), Heterosexual contact (53%) and MSM (49%) in Burlington County. o o o Unmet need by transmission category is highest for IDU and MSM/IDU (56% respectively), followed by MSM (52%) in Camden County. Unmet need by transmission category is highest for MSM (56%), IDU (55%) and Heterosexual contact (44%) in Gloucester County. Unmet need by transmission category is highest for MSM/IDU (67%), MSM (50%) and Heterosexual contact (37%) in Salem County.
146 Statewide Coordinated Statement of Need APPENDIX III 144 HIV/AIDS Epidemiologic Profile for the State of New Jersey 2008
147
148 Epidemiologic Profile for 2008 Division of HIV, STD and TB Services Preventing disease with care. Office of the Assistant Commissioner (609) Program Management - Evaluation and Monitoring Services Administrative Support Services (609) Medical Director (609) HIV/AIDS Services Care and Treatment Services (609) AIDS Drug Distribution Program Corrections Initiative Health Insurance Continuation Program HIV Care Consortia HIV Early Intervention Program HIV Home Health Care Program Housing Opportunities for Persons with AIDS Epidemiologic Services (609) Case Reporting Forms Epidemiologic Studies HIV/AIDS Statistics Notification Assistance Program-Newark (973) Prevention and Education Services (609) Community-based HIV Prevention Projects HIV Counseling and Testing Program HIV Prevention Community Planning Group HIV-related Training Printed Material Distribution Special Projects NJ AIDS/STD Hotline Sexually Transmitted Disease Services (609) Tuberculosis Services (609) Visit the New Jersey Department of Health and Senior Services website: To request to have this report link ed to you, to be added to our mailing list, or to request other information, contact us by telephone or by . Telephone (609) aids@doh.state.nj.us Questions? Contact New Jersey HIV/AIDS Hotline

149 Division of HIV, STD and TB Services The Division of HIV, STD and TB Services MISSIon STaTeMenT The Division of HIV, STD and TB Services (DHSTS) mission is to prevent, treat, and reduce the spread of HIV in New Jersey. In keeping with this mission, the DHSTS will monitor the epidemic and assure through its resources that individuals who are at risk or infected with HIV have access to culturally competent, communitybased networks that provide qualitative and comprehensive services. VISIon Consistent with the mission, the DHSTS vision for providing HIV services is a coordinated community and statewide effort supported by public and private partnerships to provide comprehensive services that assure: All residents, regardless of age, race, gender, class, sexual orientation, or ethnic background, are equipped with appropriate information to make informed behavioral decisions and choices that will not place them and those with whom they interact at risk for HIV infection; Support for strong, positive community attitudes and social norms; Communities have the necessary resources for prevention, testing, and interventions to reduce the spread of HIV/AIDS, and Communities have the necessary comprehensive, community-based, culturally competent, affordable network of care services to maximize the quality of life for those individuals living with HIV/AIDS. 2
150 Epidemiologic Profile for 2008 HIV/aIDS epidemiologic PRoFILe FoR THe STaTe of new JeRSeY 2008 Acknowledgements We gratefully acknowledge the following for their work on the 2008 profile. Barbara Bascara Barbara Bolden Linda Dimasi Abdel Ibrahim Susan Ju Kenneth O Dowd John Ryan We would also like to acknowledge all of the DHSTS staff, and the staff of the Division s grantees for their contribution in the collection and processing of the data that appears in this profile. 3
151 Division of HIV, STD and TB Services LIST of abbreviations ADDP ADADS AIDS AUS AZT BRFSS CARE CDC CD DHSTS DHSS EIP EMA ehars GA HAART HCV HITS HIV HRH ICD-10 IDU MSM MMWR NHBS PAAD PLWHA RVCT RWCA SCBW STD TB UB ZDV AIDS Drug Distribution Program New Jersey Alcohol and Drug Abuse Data System Acquired Immunodeficiency Syndrome Anonymous Unlinked Surveys Zidovudine Behavioral Risk Factor Surveillance System Comprehensive AIDS Resources Emergency (Act) Centers for Disease Control and Prevention Division of Communicable Diseases Division of HIV, STD and TB Services New Jersey Department of Health and Senior Services Early Intervention Program Eligible Metropolitan Area Enhanced HIV/AIDS Reporting System General Assistance Highly Active Antiretroviral Therapy Hepatitis C Virus HIV Testing Survey Human Immunodeficiency Virus High-risk Heterosexual International Classification of Diseases Tenth Revision Injection Drug Use(r) Male-to-Male Sex/Men Who Have Sex with Men Morbidity and Mortality Weekly Report National HIV Behavioral Surveillance Pharmaceutical Assistance to the Aged and Disabled People Living with HIV/AIDS Report of a Verified Case of Tuberculosis Ryan White CARE Act Survey of Childbearing Women Sexually Transmitted Disease Tuberculosis Uniform Billing Zidovudine (also known as AZT) 4
152 Epidemiologic Profile for 2008 TaBLe of ConTenTS LIST OF FIGURES AND TABLES EXECUTIVE SUMMARY INTRODUCTION Profile Strengths and Limitations Data Sources Definitions SOCIO-DEMOGRAPHIC CHARACTERISTICS OF THE GENERAL POPULATION IN NEW JERSEY Demographics Socio-economic Status SCOPE OF THE EPIDEMIC REPORTED CASES Overview Geographic Impact By County Project IMPACT HIV/AIDS Services Planning Race/Ethnicity Living with HIV/AIDS Trends in New Diagnosis Exposure Category Living with HIV/AIDS Targeted at Risk Populations Trends in New Diagnoses Age Living with HIV/AIDS Trends in New Diagnoses Special Age Categories Adolescents (Persons 13 to 24 Years of Age) Person 50 Years of Age and Older Children Affected by HIV Pediatric Infections Children Whose Mothers have Died of HIV/AIDS Comorbidities Tuberculosis (TB) Hepatitis-C Among HIV/AIDS Patients in New Jersey
153 Division of HIV, STD and TB Services Sexually Transmitted Diseases (STDs) STDs and HIV/AIDS Co-infection in New Jersey MORTALITY Progression from HIV to AIDS and Survival after AIDS Diagnoses Causes of Death INDICATORS OF RISK HIV Testing Behavior Ever an HIV Test by Age and Race Ever an HIV Test by Age and Gender Last HIV Test by Place and Race Last HIV Test by Place and Age High-Risk Situations Illicit Drug Use Admissions to Drug Treatment Analysis of Unmet Need Successes and Future Challenges BIBLIOGRAPHY Appendix A Major Data Sources Appendix B - Glossary Appendix C Other Sources Centers for Disease Control and Prevention National Centers for HIV, STD and TB Prevention Division of HIV/AIDS Prevention Division of Sexually Transmitted Diseases National Institute of Allergies and Infectious Diseases National Institute on Drug Abuse National Institute of Health - Office of AIDS Research Kaiser Family Foundation New Jersey Department of Education
154 Epidemiologic Profile for 2008 LIST of FIGuReS and TaBLeS Figure 1. Figure 2. Table 1. Percentage Distribution of the Population of New Jersey by Age Group and Gender Estimates as of July 1, Percentage Distribution of the Population of New Jersey by Race/Ethnicity and Gender Estimates as of July 1, Percentage Distribution of the Population of New Jersey by Race/Ethnicity and County of Residence Estimates as of July 1, Table 2. Major Languages Spoken at Home in New Jersey Figure 3. Table 3. Table 4. Figure 4. Table 5. Percentage of New Jersey Residents Under the Poverty Level by County in Percentage of Population 25 Years or Older in New Jersey with High School Diplomas or Higher by County, Survey Health Insurance Coverage of Adults 19-64, New Jersey ( ), U.S Diagnosed HIV/AIDS Cases, Deaths and Persons Living with HIV/AIDS by Year in New Jersey Overview of HIV/AIDS in New Jersey Figure 5. Estimated Persons Diagnosed with HIV/AIDS in New Jersey in Figure 6. Figure 7. Figure 8. Table 6. Figure 9. Table 7. Estimated Rates of Persons Living with HIV/AIDS in New Jersey as of December 31, Persons Living with HIV/AIDS in Top 10 Cities with Highest Number of People Living with HIV/AIDS, Rates per 100,000 of HIV/AIDS Cases Diagnosed in 2006 by Planning Area36 Persons Living with HIV/AIDS in New Jersey by Race/Ethnicity and Gender in Estimated Number of Individuals Diagnosed with HIV/AIDS in New Jersey by Race/Ethnicity and Year of Diagnosis: Adult/Adolescent Persons Living with HIV/AIDS in New Jersey by Risk Exposure,
155 Division of HIV, STD and TB Services Table 8. Table 9. Table 10. Table 11. Table 12. Table 13. Table 14. Table 15. Table 16. Table 17. Figure 10. Figure 11. Table 18. Adult/Adolescent Persons Living with HIV/AIDS in New Jersey by Heterosexual Risk by Partner Risk, Number and Percent of Men Living with HIV/AIDS in New Jersey Exposure Category and Race/Ethnicity in Number and Percent of Men Living with HIV/AIDS in New Jersey Exposed by Heterosexual Sex by Risk of Partner and Race/Ethnicity in Number and Percent of Women Living with HIV/AIDS in New Jersey by Race/Ethnicity and Exposure Category in Number and Percent of Women Living with HIV/AIDS in New Jersey Exposed by Heterosexual Sex by Risk of Partner and Race/Ethnicity in Number and Percent of Men (Aged 13+ as of 12/31/2008) Exposed through IDU Living with HIV/AIDS in New Jersey by Age and Race/Ethnicity, Number and Percent of Women (Aged 13+ as of 12/31/2008) Exposed through IDU Living with HIV/AIDS in New Jersey by Age and Race/Ethnicity, Number and Percent of Men (Aged 13+ as of 12/31/2008) Exposed through Sex with Females Living with HIV/AIDS in New Jersey by Age and Race/Ethnicity, Number and Percent of Women (Aged 13+ as of 12/31/2008) Exposed through Sex with Men Living with HIV/AIDS in New Jersey by Age and Race/Ethnicity, Number and Percent of Men (Aged 13+ as of 12/31/2008) Exposed through Sex with Men Living with HIV/AIDS in New Jersey by Age and Race/Ethnicity, Estimated Number of Men (Age 13+ at Diagnosis) Diagnosed with HIV/AIDS in New Jersey by Mode of Exposure and Year of Diagnosis Estimated Number of Women (13+ at Diagnosis) Diagnosed with HIV/AIDS in New Jersey by Mode of Exposure and Year of Diagnosis Number of Persons Living with HIV/AIDS in New Jersey by Age Group,
156 Epidemiologic Profile for 2008 Figure 12. Figure 13. Table 19. Table 20. Table 21. Table 22. Table 23. Estimated Number of Men Diagnosed with HIV/AIDS in New Jersey by Age Group and Year of Diagnosis Estimated Number of Women Diagnosed with HIV/AIDS in New Jersey by Age Group and Year of Diagnosis Estimated Cases of HIV/AIDS for Persons Ages and 50 and Over by Year of Diagnosis, HIV/AIDS Among Persons 13 through 24 Years of Age at Diagnosis in New Jersey by Race/Ethnicity and Gender, Diagnosed in Persons 13 through 24 Years of Age Diagnosed with HIV/AIDS in New Jersey in by Exposure Category, Race/Ethnicity and Gender Cases of HIV/AIDS Among Persons 50 Years of Age and Older in New Jersey by Race/Ethnicity and Gender Cases of HIV/AIDS Among Persons 50 Years of Age and Older in New Jersey by Exposure Category and Gender Table 24. Cumulative Pediatric HIV/AIDS Cases in New Jersey Table 25. Table 26. Table 27. Table 28. Table 29. Table 30. Figure 14. HIV Pediatric Exposures in New Jersey by Current Status and Birth Year Since Overview of Cumulative AIDS Cases and AIDS Cases with Tuberculosis in New Jersey, Distribution of Hepatitis-C and HIV Co-infection Status Among HIV/AIDS Cases by Demographics The Adjusted Odds of having Hepatitis-C Infection Associated with Exposure Risk and Other Variables of HIV/AIDS Patients Sexually Transmitted Disease (STD) Incidence and Rates in New Jersey and the United States for Distribution of STD and HIV Co-infection Status Among HIV/AIDS Cases By Demographics The Distribution of Syphilis by Type Among the Co-infection Group,
157 Division of HIV, STD and TB Services Figure 15. Figure 16. Figure 17. Figure 18. Figure 19. Table 31. Table 32. Table 33. Figure 20. Table 34. Figure 21.. Table 35. Progression to AIDS and Survival Curves After AIDS Diagnosis: Pre-HAART vs. HAART Era Progression from HIV to AIDS and Survival Curves After AIDS Diagnosis by Gender, Progression from HIV to AIDS and Survival Curves After AIDS Diagnosis by Race/Ethnicity, Progression from HIV to AIDS and Survival Curves After AIDS Diagnosis by Major Exposure Category, Progression to AIDS and Survival Curves After AIDS Diagnosis by Age Group, Ranking of Leading Underlying Causes of Death by Race for Males in New Jersey in Ranking of Leading Underlying Causes of Death by Race for Females in New Jersey in Estimated Percentage of New Jersey Adults aged (18-64) Who Have Ever Had an HIV Test by Age Group and Race/Ethnicity, Estimated Percentage of New Jersey Adults (18-64) Who Have Ever Had an HIV Test by Age and Race/Ethnicity, Estimated Prevalence Percentage of New Jersey Adults (18-64) Who Have Ever Had an HIV Test by Age and Gender, Estimated Percentage of New Jersey Adults (18-64) Who Have Ever Had an HIV Test by Age and Gender, Estimated Percentage of New Jersey Adults (18-64) Where Last Obtained an HIV Test by Race/Ethnicity, Figure 22. Percent of Distribution of Major Sites Where New Jersey Adults (18-64) Last Obtained an HIV Test by Race/Ethnicity, Table 36. Estimated Percentage of New Jersey Adults (18-64) Where Last Obtained an HIV Test by Age Figure 23. Percent of Distribution of Major Sites Where New Jersey Adults (18-64) Last Obtained an HIV Test by Age,
158 Epidemiologic Profile for 2008 Table 37. Table 38. Table 39. Estimated Percentage of New Jersey Adults (18-64) who have High-Risk Situation of Hepatitis B by Education Level and Race/Ethnicity, Estimated Percentage of New Jersey Sexual ActiveAdults (18-64) who have HIV List of High-Risk Situation by Education Level and Race/Ethnicity Primary Drug Use by Race/Ethnicity for New Jersey Resident Admissions to Drug Treatment in
159 Division of HIV, STD and TB Services executive SuMMaRY The New Jersey statewide epidemiologic profile was developed to assist groups planning HIV/AIDS services in the state. It summarizes the socio-demographic characteristics of New Jersey, describes the scope of the HIV/AIDS epidemic, identifies those at risk for HIV/AIDS, examines services that are needed, and highlights our successes and challenges. New Jersey is the most densely populated state in the nation with a racially and ethnically diverse population. New Jersey s median household income ranks second in the nation in Less than nine percent of the households (8.7% in 2005, 8.5% in 2007 on Figure 3) have incomes below the poverty line. However, in eight of New Jersey s 21 counties, more than nine percent of residents have income below the poverty level. Approximately 19 percent of New Jersey residents between the ages of 19 and 64 are uninsured in (Table 4). Over 72,000 New Jersey residents have been reported with HIV/AIDS and approximately half of these individuals were deceased by the end of Nationally, New Jersey ranks fifth in cumulative AIDS cases, third in cumulative pediatric AIDS cases, and has one of the third highest proportions of women among those living with AIDS through Ten counties account for 82 percent of persons living with HIV/AIDS (PLWHA) in the state in 2008 with Essex and Hudson Counties having the highest rates of infection. Fifty-nine percent of the PLWHA in 2008 were aged 45 and older, and in 2006, 34 percent of newly diagnosed HIV/AIDS cases occurred in individuals 45 years of age and older. As of December 31, 2008: one in 62 Black non-hispanics, one in 181 Hispanics, and one in 705 White non-hispanics was living with HIV/AIDS. The greatest proportion of PLWHA in 2008 were exposed through sexual contact (male-to-male sex or heterosexual sex), however, injection drug use continues to be a major mode of transmission. Advances in treatment have led to a decline in the number of pediatric infections, and have slowed the progression from HIV to AIDS and enhanced survival after AIDS. The number of deaths due to HIV disease has declined, and over half of the HIV infected population is living more than ten years after diagnosis with AIDS. However, HIV disease remains the fourth leading cause of death for Black males, the seventh leading cause of death for Black females and the first leading cause of death for Black men and women, between the ages of 25 and 44 in We have identified and provided care for many HIV-infected individuals in New Jersey. However, individuals are still being infected with a preventable disease, and an analysis of unmet need indicates that many individuals may not be in care. Self-reported survey and other data, increasing rates of sexually transmitted diseases, increased comorbidity between HIV and STD, and HIV and hepatitis C, as well as admissions to drug treatment in New Jersey demonstrate that risky behavior still occurs. Our challenge is to continue to care for those already infected while reducing the rate of new infections. 12

160 Epidemiologic Profile for 2008 InTRoDuCTIon This epidemiologic profile provides a comprehensive analysis of the HIV/AIDS epidemic in New Jersey. It is a useful tool for planners and providers working to prevent and reduce the spread of HIV and care for those already infected. Specifically, the profile summarizes the socio-demographic characteristics of the population; describes the impact of HIV/AIDS on the population; identifies those at risk for becoming HIV infected; and describes the geographic distribution of the epidemic. The epidemiologic profile is written for use by all individuals interested in understanding, planning for, or providing services to those affected by HIV/AIDS in New Jersey. The profile addresses the following questions: What are the socio-demographic characteristics of the general population in New Jersey? What is the scope of the HIV/AIDS epidemic and its impact on communities, families and individuals in New Jersey? What are the indicators of risk for HIV/AIDS infection among New Jersey residents? What is the unmet need for HIV services in New Jersey? What are the barriers and challenges to preventing the spread of HIV and providing treatment for persons living with HIV in New Jersey? 13
161 Division of HIV, STD and TB Services Profile Strengths and Limitations When making planning decisions, it is important to consider the overall strengths and limitations of the available data. Some of the strengths of this profile are: New Jersey has had a comprehensive HIV/AIDS reporting system for over 20 years that includes information on demographic characteristics, clinical and laboratory findings, and transmission risk for men, women and children infected with HIV/AIDS. New Jersey has had Enhanced Perinatal Surveillance since 1995, a system that follows children born to HIV positive mothers. New Jersey participated in several studies of risk taking and testing behaviors. Some of the limitations of this profile are: Information is not available on persons who are HIV positive but not reported, or who have not been tested. Information may be incomplete due to reporting delays and missing data on a person s exposure to HIV. Information may be incomplete on those persons who are diagnosed with HIV in New Jersey and reported to the data system but relocate out-of-state. 14
162 Epidemiologic Profile for 2008 Data Sources In order to present an accurate description of the epidemic we have used data from multiple sources. The most current analysis available is presented for each source of data; however the time frames differ from one source to another. Due to a lag in reporting, data for new diagnoses are presented through Data for persons living with HIV/AIDS are presented through 2008 as the reporting lag has minimal effect on this value. Data from the United States Census Bureau July 1, 2007 Bridged Population Estimates is used for calculating rates by race/ethnicity, gender distribution and county. When population data are not available for 2007, data from the 2000 Census are used. Below is a list of the data sources used in this profile. A more detailed description of each data source can be found in Appendix A. Behavioral Surveys; Enhanced Perinatal Surveillance (EPS); HIV/AIDS Reporting System (ehars); National Sexually Transmitted Disease Surveillance; New Jersey Alcohol and Drug Abuse Data System (ADADS); New Jersey Death Certificate Data; Tuberculosis Surveillance; Uniform Billing Hospital Discharge Data (UB-92); United States Census Bureau; Urban Institute and Kaiser Commission on Medicaid and the Uninsured; New Jersey Department of Labor s Division of Labor Market and Demographic Research, and Communicable Disease Services (Hepatitis C and Sexually Transmitted Diseases surveillance). 15
163 Division of HIV, STD and TB Services Definitions Some of the definitions used in this Epidemiologic Profile are provided to assist in understanding HIV/AIDS data and to provide information on why some data are included. An HIV case is a person diagnosed and reported to the state s HIV/AIDS Reporting System (HARS) with HIV infection. An AIDS case is a person with HIV infection who has an opportunistic infection or a CD4+ count of less than 200 cells/mm or whose proportion of CD4 (+) T-lymphocytes is less than 14 percent of their total lymphocytes and who has been reported to the HARS. All AIDS cases are persons infected with HIV, but not all persons infected with HIV are AIDS cases. Note: Since the HIV disease may be seen as a continuum, throughout this profile the data will be shown on HIV/AIDS when possible. In addition, when New Jersey is compared to the rest of the nation, only AIDS cases can be reported because a standardized national system of named reporting of HIV cases is not available. Cumulative cases include all cases that have been diagnosed and reported since 1982, including those individuals who have died. Prevalence is the total number of individuals who have been diagnosed with HIV/AIDS, minus those who have died. This profile provides data on estimated prevalence by using the number of persons living with HIV or AIDS who have been diagnosed, reported to the ehars and are not known to have died. It does not include data on persons who are infected, but who have not been diagnosed and/or reported to ehars. A rate is the number of cases (of a condition or event) divided by the total population exposed to the condition or event in a given time period. A rate is often expressed as cases per 100,000. In this profile, estimated prevalence rates are based on HIV/AIDS cases that were reported to ehars and are not known to have died. Actual prevalence rates are reported only for specific sub-populations for which special studies were conducted. Estimated incidence rates are based on the number of cases reported as diagnosed during the year. Incident infections can only occur if prevalent infections exist. In other words, the disease must be transmitted from someone who already has it. Although incidence and prevalence are different, they are related and both are important to consider in planning for prevention, as well as, for care and treatment. 16
164 Epidemiologic Profile for 2008 Incidence is the number of new cases within a given period of time. This profile includes estimated incidence, the number of persons who have been diagnosed during the year and reported to the ehars. Since the actual date of HIV infection is not known, the date of diagnosis is used. Note: Because rates account for differences in the size of sub-populations, the use of rates is essential for comparing different population categories at different times or places. Risk exposures - Although we usually cannot determine exactly how or when a person was infected, it is possible to determine which behaviors put a person at risk for infection. In the 1980s the Centers for Disease Control and Prevention (CDC) established a hierarchy to categorize modes of exposure for persons reported with AIDS based on their risk exposures. Behaviors most likely to lead to infection are higher in the hierarchy than those less likely to lead to infection. Individuals are categorized as follows. Men who report sexual contact with other men, and men who report sexual contact with both men and women are placed in the male-tomale sex (MSM) category. Persons reporting having injected drugs anytime since 1978 are placed in the injection drug use (IDU) category. Men with both a history of sexual contact with other men and injection drug use are placed in the MSM-IDU category. Then follows persons with hemophilia/coagulation disorder. Persons who report specific heterosexual sex with a person with, or at increased risk for, HIV infection (e.g., an injection drug user or person known to be infected with HIV) are placed in the Heterosexual category. Heterosexual sex with a person of unknown risk or unknown HIV status is reported as heterosexual sex with partners of unknown HIV risk, and heterosexual risk with persons of known risk will be reported by the risk status of the partner. Persons who received a transfusion prior to March 1985 were then placed in the other/unknown category. The ascertainment of exposure category is incomplete, especially for cases reported recently. Some cases currently in the other/unknown category may be redistributed later to known exposure as follow-up investigations are completed. Individuals diagnosed under the age of 13 are considered pediatric cases. Perinatal transmission occurs when the virus is passed from mother to child during pregnancy or delivery. 17
165 Division of HIV, STD and TB Services SoCIo-DeMoGRaPHIC CHaRaCTeRISTICS of THe GeneRaL PoPuLaTIon In new JeRSeY Lying between New York City and Philadelphia, in the heart of a highly urbanized area, New Jersey is a geographically small, but heavily populated state. With over 8.6 million people in 2007 (three percent of the total national population), New Jersey is the eleventh most populated state, but the fifth smallest geographically. New Jersey is one of the most urbanized states in the nation. According to the United States Census Bureau, New Jersey is the most densely populated state, with 1,170 people per square mile in 2007 and is the only state in which all counties are officially classified as metropolitan. The state includes vast wetlands and undisturbed stretches of the Delaware Bay, as well as many farms, and scenic and rugged terrain. One of the state's most treasured prizes is its 127 miles of white sand beaches that draw thousands of visitors and families each year to enjoy the surf, sand, sun, fun and excitement of the famous Jersey Shore. Demographics Slightly more residents of New Jersey were female (51.1%) than male (48.99%) in Just below one third of New Jersey residents were between 25 and 44 years of age (Figure 1). A larger proportion of males is under 45 years of age compared to females (62.8% for males versus 58.2% for females). The larger number of females in the 65 and older age category is a reflection of the longer life expectancy of females. According to the 2007 population estimate, New Jersey s population is older than the national average (median age 38 years in New Jersey compared to 36 years nationally). The percentage of the population aged 65 and older is 13.1 percent in New Jersey compared to 12 percent nationally. Similar to the national trend, the oldest age group (85 years and over) is growing at the fastest rate in New Jersey. With 8,685,920 residents, New Jersey was the nation s eleventh most populous state in As of the July 1, 2007 population estimates, New Jersey had a 0.23 percent growth rate between 2006 and This growth rate is ranked forty-third among the nation s 50 states. New Jersey s net gain of almost 20,000 residents between 2006 and 2007 was the twenty-ninth largest numerical increase in the nation. 18
, 62.7 percent of the population of New Jersey were White non-hispanic; 13.")
166 Epidemiologic Profile for 2008 Figure 1. Percentage Distribution of the Population of New Jersey by Age Group and Gender Estimates as of July 1, 2007 Source: U.S. Census Bureau July 1, 2007 Bridged-Race Population Estimates According to the 2007 population estimates (Figure 2), 62.7 percent of the population of New Jersey were White non-hispanic; 13.6 percent were Black non-hispanic; 7.6 percent were Asian/Pacific Islander; 15.9 percent were Hispanic; and fewer than one percent were Native American/Alaska Native. New Jersey is more racially and ethnically diverse than most other states in the nation. Approximately 15 percent of New Jersey s residents were foreign immigrants as of 2000 and it ranks fifth in percentage of foreign-born persons in the nation. 19

167 Division of HIV, STD and TB Services Figure 2. Percentage Distribution of the Population of New Jersey by Race/Ethnicity and Gender Estimates as of July 1, 2007 Source: U.S. Census Bureau July 1, 2007 Bridged-Race Population Estimates. According to the 2000 Census, New Jersey had the seventh highest population of Hispanics in the United States. Hispanics represented 9.6 percent of the state s population in 1990 and 15.9 percent in Persons of Hispanic origin (of any race) accounted for approximately 55.2 percent of New Jersey s total population growth from 1990 through The Hispanic population grew 51.0 percent during this period outpacing the 4.4 percent growth rate in the non- Hispanic population. By 1997, there were estimated to be more than one million Hispanic residents in the state, and the population grew to 1,117,191 according to the 2000 Census. 20

168 Epidemiologic Profile for 2008 During the decade of the 1990s, however, the fastest growing population in New Jersey was Asian/Pacific Islander (85.7% increase). This was a continuation of the high growth rate among this population during the 1980s. With an estimated population of 514,273 persons of Asian or Pacific Islander background, New Jersey ranked fifth nationally in numbers of Asian or Pacific Islander residents in the 2000 Census. New Jersey s six percent of the total population was the highest proportion of Asian or Pacific Islanders outside the nation s West Coast. Based on data from the New Jersey Department of Labor s Division of Labor Market and Demographic Research, only California had a higher proportion of Asian or Pacific Islanders as of From the 1990 to the 2000 censuses, the Black population in New Jersey increased by 16.8 percent. Blacks (including black Hispanics) represented 14.8 percent of the state s population in With a population of 1,124,469 in 2000, New Jersey s Black population ranked thirteenth in the nation. In 2007, however, the Black population accounted for 13.6 percent of the state s population. The Native American and Alaska Native population is estimated to have grown by 82.1 percent in the state between the censuses of 1990 and Current estimates reveal that there are 16,957 residents of Native American/Alaska Native origin (including Hispanics) in the state, representing 0.2 percent of the total population in Between 1990 and 2000, New Jersey s White population (including Hispanics) increased by 4.1 percent. With a population of 6,629,830, New Jersey had the ninth highest White population among the 50 states in Based on the 2007 population estimate, the state s majority racial/ethnic group (White non-hispanic) is the minority in Essex and Hudson Counties. In Essex County the largest racial/ethnic group is Black non-hispanic; in Hudson County the largest racial/ethnic group is Hispanic (Table 1). The largest concentrations of Hispanics are in Hudson, Passaic, Union and Cumberland Counties. The largest concentrations of Black non-hispanics are in Essex, Union, Mercer, and Cumberland Counties. The largest concentrations of Asian/Pacific Islanders are in Middlesex, Bergen and Somerset Counties. 21

169 Division of HIV, STD and TB Services Table 1. Percentage Distribution of the Population of New Jersey by Race/Ethnicity and County of Residence Estimates as of July 1, 2007 Source: U.S. Census Bureau July 1, 2007 Bridged-Race Population Estimates. 22
. Table 2.")
170 Epidemiologic Profile for 2008 New Jersey residents are more likely to speak languages other than English than United States residents overall. In the United States as a whole, Spanish is the most frequently spoken language other than English; the same is true in New Jersey (Table 2). Table 2. Major Languages Spoken at Home in New Jersey Source: U.S. Census Bureau: 2008 American Community Survey Note: These data are collected from persons five years of age and older Socio-economic Status According to the American Community Survey (ACS) reports, the median household income estimates in the 2008 ACS ranged from a median of $70,545 for Maryland to $37,790 for Mississippi. The New Jersey 2008 median household income ($70,378) is well above the national median household income ($52,029), and is ranked the second highest among all states. Not unexpectedly given the average income levels, the percentage of New Jersey s population living in poverty is lower than in the nation as a whole. Less than nine percent of New Jersey s residents (8.5%) had incomes below the level of poverty in 2007 compared to 13.0 percent nationally. However, in seven of New Jersey s 21 counties, more than 10 percent of the residents have incomes below the poverty line (Figure 3). Above all, four counties, (Essex, Passaic, Hudson and Cumberland) have 13 percent or more of its residents below the poverty level. Especially, Cumberland County has 17.4 percent of its residents below the poverty level in 2007 according to the Census estimates released in December
 have high school diplomas (Table 3), compared to 84.1 percent nationally (data not shown). In the 2006 survey, 33.")
171 Division of HIV, STD and TB Services According to the 2006 American Community Survey (ACS), in New Jersey, 86.1 percent of the state s residents (aged 25 years and over) have high school diplomas (Table 3), compared to 84.1 percent nationally (data not shown). In the 2006 survey, 33.4 percent of New Jersey residents were found to have bachelor s degrees, compared to 27.0 percent nationally. The counties with the lowest percentages of high school graduates are Cumberland, Hudson, and Passaic. The counties with the highest percentage of high school graduates and bachelor s degrees or higher are Hunterdon, Morris and Somerset. From the ACS conducted in 2006 and 2007, it was found that for individuals 19 through 64 years of age, 19.4 percent of New Jersey residents do not have health insurance coverage compared to 19.7 percent of United States residents as a whole. Most persons (69.5%) in New Jersey were covered by employer based health care insurance. However, coverage through individual plans was small (4%). New Jersey s Medicaid program insured 5.2 percent, of the population nationally. Medicaid accounts for eight percent of health insurance coverage for adults (Table 4). 24

172 Epidemiologic Profile for 2008 Figure 3. Percentage of New Jersey Residents under the Poverty Level by County in 2007 Source: Small Area Income and Poverty Estimates Program, U.S. Bureau of the Census, December

, United States (2008) Source:")
173 Division of HIV, STD and TB Services Table 3. Percentage of Population 25 Years or Older in New Jersey with High School Diplomas or Higher by County Source: U.S. Census Bureau, American Community Survey. Table 4. Health Insurance Coverage of Adults 19-64, New Jersey ( ), United States (2008) Source: Urban Institute and Kaiser Commission on Medicaid and the Uninsured: Health Facts. 26

174 Epidemiologic Profile for 2008 SCoPe of THe epidemic Reported Cases The reported data underestimates true incidence, prevalence because the individuals who are infected but not tested and diagnosed are not included in the reported cases. It is estimated that undiagnosed or unreported cases comprise approximately onequarter of all infections. overview In the third decade of the HIV epidemic in the United States, there is still no vaccine or cure. Although successful public health efforts have reduced the number of annual new infections from over 150,000 in the late 1980s to the estimated 56,000 HIV infections in 2008, the fight to end HIV/AIDS related illness and death continues. Following the introduction of combination antiretroviral therapy in the 1990s, the number of deaths and new AIDS cases in the United States began to decline for the first time in the history of the epidemic. Between 1995 and 1998, the annual number of new AIDS cases, fell by 38 percent (from 69,242 to 42,832) and deaths by 63 percent (from 51,760 to 18,823). According to the Centers for Disease Control and Prevention (CDC), declines in morbidity and mortality have stabilized in more recent years. Nationally, minorities have been disproportionately affected by the HIV/AIDS epidemic. Black non-hispanics, who represented only 12.6 percent of the United States 2008 population, accounted for 41 percent of the cumulative AIDS cases through 2008 and 50.2 percent of estimated new HIV infections in Hispanics, who comprised about 15.4 percent of the United States population, accounted for 19.2 percent of the cumulative AIDS cases and 19.2 percent of the estimated new HIV infections in By the end of December 2008, over 72,000 New Jersey residents have been reported with HIV/AIDS and approximately half of these individuals have died. As of December 31, 2008, New Jersey had a cumulative total of 52,393 AIDS cases reported. There were also 20,281 persons reported with HIV (not AIDS) in the state as of that date. Nationally, New Jersey ranked fifth in cumulative AIDS cases, and third in cumulative pediatric AIDS cases through New Jersey also has one of the highest proportions (32.4%) of females among those living with AIDS in 2007 compared to a national figure of 23.5% of cases. 27

175 Division of HIV, STD and TB Services From the beginning of the HIV/AIDS epidemic, New Jersey differed from the national profile. In the early years of the epidemic, injection drug users represented the largest proportion of AIDS cases in New Jersey, while men who have sex with men represented the largest proportion of AIDS cases nationally. New Jersey reported HIV infections in large numbers of women and minorities in the mid to late 1980s, well before most of the country saw large numbers in those populations. As of December 31, 2008, women represent 35.2 percent of persons living with HIV/AIDS, and minorities represent 77.9 percent of persons living with HIV/AIDS. Overall, diagnosed cases and deaths have declined slightly in the last few years following dramatic declines during the 1990s. The number of people living with HIV/AIDS has increased. Prior to 1992, AIDS, but not HIV-only cases were reported. The number of AIDS cases increased steadily from 1985 through The implementation of named HIV reporting in 1992 led to a spike in diagnosed cases of HIV/AIDS in that year as HIV cases were added to the count. Diagnoses of new HIV/AIDS cases decreased from 1992 through 2006 with a slight increase occurring in The increase in 2000 may be due to the fact that viral load reporting was initiated in that year and the fact that additional laboratory reports were added to the registry, rather than because of a change in the epidemic. Deaths (from any cause) of persons with HIV/AIDS rose steadily until Improved treatments led to a sharp decline in deaths after 1995 and smaller decreases since 1997 (Figure 4). Figure 4. Diagnosed HIV/AIDS Cases, Deaths and Persons Living with HIV/AIDS by Year in New Jersey Data Source: New Jersey ehars as of December 31,

176 Epidemiologic Profile for 2008 The epidemic differs geographically and across racial/ethnic groups, gender, age groups and exposure categories. An overview of the epidemic is shown in Table 5. Discussions on the impact of geographic location, gender, race/ethnicity, age, and exposure category follow. Table 5. Overview of HIV/AIDS in New Jersey a. Other includes Asian/Pacific Islander and American Indian/Alaska Native. b. Other/Unknown are combined due to the low number of cases in the other category. Source: New Jersey ehars as of December 31,
 in 2008 and those newly diagnosed in 2006 are similar (Figures 5 and 6).")
177 Division of HIV, STD and TB Services Geographic Impact By County Cases of HIV/AIDS are not equally distributed across the state. Patterns of Persons Living with HIV/AIDS (PLWHA) in 2008 and those newly diagnosed in 2006 are similar (Figures 5 and 6). The highest concentration of PLWHA is along the New York City to Philadelphia corridor. This includes the Counties of Passaic, Bergen, Hudson, Union, Essex, Middlesex, Monmouth, and Mercer. The second highest concentration of HIV/AIDS cases is in the Philadelphia to Atlantic City corridor that includes Camden and Atlantic Counties. The counties with the highest AIDS incidence rate in 2006 are Essex, Hudson, Atlantic and Salem. Figure 5. Estimated Persons Diagnosed With HIV/AIDS in New Jersey, 2006 Sussex 9 Passaic 118 Warren 4 Bergen 92 Morris 41 essex 505 Hunterdon 7 union 133 Hudson 248 Somerset 29 Middlesex 96 Mercer 72 Monmouth 74 Burlington 43 ocean 32 Gloucester 25 Camden 99 Salem 16 atlantic 80 Cumberland 23 Cape May 11 Note: One dot equals one person. Dots are randomly placed within each county. Source: New Jersey ehars as of December 31,
 Bergen (174.7) Hunterdon (91.2) union (499.9) Hudson (773.7) Somerset (156.1) Middlesex (243.5) Mercer (347.5) Monmouth (255) Camden (310.5) Burlington (137.")
178 Epidemiologic Profile for 2008 Figure 6 Estimated Rate of Persons Living with HIV/AIDS in New Jersey as of December 31, 2008 Sussex (94.4) Passaic (521.6) Warren (108.4) Morris (144.1) essex (1240.7) Bergen (174.7) Hunterdon (91.2) union (499.9) Hudson (773.7) Somerset (156.1) Middlesex (243.5) Mercer (347.5) Monmouth (255) Camden (310.5) Burlington (137.9) ocean (101) Gloucester (120) Salem (225.7) atlantic (536.9) Cumberland (304.7) Cape May (204.3) Note: Rates are per 100,000 population based on the July 2007 Bridged Race Estimates. Source: New Jersey ehars as of December 31,
 account for 81.5 percent of persons living with HIV/AIDS in the state in 2008.")
179 Division of HIV, STD and TB Services All 21 counties in New Jersey are classified by the United States Census Bureau as metropolitan, but only ten counties (Atlantic, Bergen, Camden, Essex, Hudson, Mercer, Middlesex, Monmouth, Passaic and Union) account for 81.5 percent of persons living with HIV/AIDS in the state in Five of these counties (Essex, Hudson, Passaic, Union and Atlantic) are disproportionately affected, this is most dramatic in Essex and Hudson Counties. Statewide, one in 249 individuals were living with HIV/AIDS in In Essex County that number was one in 81 persons, and in Hudson County one in 129 individuals was living with HIV/AIDS in Project IMPaCT Intensive Mobilization to Promote AIDS Awareness through Community-based Technologies (IMPACT) is a city-by-city community mobilization initiative designed to galvanize and support African American leaders to reduce the spread of HIV/AIDS in cities with the highest prevalence of HIV/AIDS. These ten cities have the highest prevalence rates of African Americans living with HIV/AIDS. About 62.4 percent of the state s African Americans living with HIV/AIDS resided in one of the ten IMPACT cities in However, these cities show a wide variation in HIV/AIDS prevalence (Figure 7). Atlantic City and Newark have the highest prevalence rates of African Americans living with HIV/AIDS. One in 34 African American residents in Atlantic City, and one in 31 African American residents in Newark were living with HIV/AIDS as of December 31, Newark had the highest number (4,623) of African Americans living with HIV/AIDS among the ten IMPACT cities in Over one in four (26%) African Americans living with HIV/AIDS in the state resided in Newark. 32
180 Epidemiologic Profile for 2008 Figure 7 Persons Living with HIV/AIDS in Top 10 Cities with Highest Number of People Living with HIV/AIDS Paterson (1722) newark (5914) east orange (1315) Irvington (977) elizabeth (1091) Jersey City (2877) Plainfield (519) Trenton (1050) Camden (808) atlantic City (794) Source: New Jersey ehars as of December 31,
181 Division of HIV, STD and TB Services HIV/aIDS Services Planning The Division of HIV, STD and TB Services (DHSTS) holds the primary responsibility for program development, as well as planning and resource allocation for HIV care and treatment, counseling and testing, and prevention services. Three major funding sources are utilized to support direct client services, planning and evaluation activities, and administrative costs as follows: 1) Ryan White Part B funds from the Health Resources and Services Administration (HRSA) support a wide array of care and treatment, case management and support services for individuals living with HIV disease; 2) Funds from the CDC are used for HIV counseling, testing and prevention programs, and 3) Financial support from the state of New Jersey allows the DHSTS to more fully fund the major cost categories mentioned above and to respond to emerging needs as they are identified. To provide a comprehensive and efficient system of addressing the HIV epidemic, the state has established the New Jersey HIV/AIDS Planning Group (NJHPG). The NJHPG is a collaborative formed by the New Jersey Department of Health and Senior Services (NJDHSS), DHSTS that combines HIV Care and Treatment and HIV Prevention effort in order to make the best use of resources for both, while improving efficiency and effectiveness in planning in the state of New Jersey. The NJHPG is comprised of up to 40 members; membership is diverse and includes health care providers, case managers, governmental representatives, as well as persons from the affected and infected community. The group meets monthly to address ongoing concerns and emerging issues in the fight against HIV. Six New Jersey epicenters receive Part A funds and all six have active community planning councils to prioritize services and allocate HRSA funding for primary medical care and support services. The Ryan White Part A regions in New Jersey are: Bergen and Passaic Counties; Hudson County; Middlesex-Somerset-Hunterdon Counties; Essex, Morris, Sussex, Union, and Warren Counties; Cumberland County, and Burlington, Camden, Gloucester and Salem Counties (Philadelphia region). 34

182 Epidemiologic Profile for 2008 Figure 8 Rate per 100,000 of HIV/AIDS Cases Diagnosed in 2006 by Planning Area newark Title I ema 33.7 Bergen-Passaic Title I ema 15.2 Jersey City Title I ema 41.4 Incidence Rate: HIV/aIDS cases newly Diagnosed in Calendar Year 2006 per 100,000 total population Middlesex-Somerset-Hunterdon ema Mercer Title II Consortium 19.7 Monmouth-ocean Title II Consortium Southern nj Portion of Phila Title I ema and Title II Consortium 14.0 Cumberland County Title I ema 14.9 atlantic-cape May Title II Consortium 24.8 Note: State of New Jersey as a whole Year 2006 Incidence Rate=21 new HIV/AIDS cases per 100,000 population as of July 1, 2006 Bridged estimates. Source: New Jersey ehars as of December 31,
183 Division of HIV, STD and TB Services Race/ethnicity Living With HIV/aIDS A pattern of disparity of HIV/AIDS among the various racial/ethnic groups has been relatively consistent. By 2008 Black non-hispanics represented 55 percent of the total number of persons reported living with HIV/AIDS, although they represent only 14 percent of the 2007 population of New Jersey. Hispanics accounted for 21 percent of those living with HIV/AIDS in 2008 while representing just 15 percent of the New Jersey population in White non-hispanics represented 22 percent of persons living with HIV/AIDS, but represented 64 percent of the total population. Latinos are infected with HIV/AIDS at a rate three times greater than White non- Hispanic. Asians, Native Americans and those with unknown race/ethnicity accounted for two percent of the infected population and seven percent of the state s total population (Table 6). In New Jersey HIV/AIDS affects the African American community more than any other racial, ethnic or demographic group. The infection rates below more clearly illustrate this disparity. As of December 31, 2008: One in 62 Black non-hispanics was living with HIV/AIDS; One in 181 Hispanics was living with HIV/AIDS, and One in 705 White non-hispanics was living with HIV/AIDS. The prevalence rate among Black non-hispanic men living with HIV/AIDS in 2008 is almost ten times greater than for White non-hispanic men. This disparity is even greater among women. Table 6 shows that the prevalence rate among Black non-hispanic females in 2008 is 17.6 times greater than of White non-hispanic females. Black non-hispanic females represent 40.9 percent of cases living with HIV/AIDS among Black non-hispanic (males and females combined); Hispanic females represent 30.4 percent of Hispanics living with HIV/AIDS; and White non- Hispanic females represent 25.8 percent of cases living with HIV/AIDS among White non- Hispanic in 2008 (Table 6). This may be related to the fact that the mode of exposure varies across racial and ethnic groups as discussed in the section on Risk Exposure. Table 6. Persons Living with HIV/AIDS in New Jersey by Race/Ethnicity and Gender in 2008 a. Other includes Asian/Pacific Islander and American Indian/Alaska Native. Note: Rates are per 100,000 population based on the July 2007 Bridged Race Estimates. Source: New Jersey ehars as of December 31,
184 Epidemiologic Profile for 2008 Trends in new Diagnoses This same disparity in the impact of HIV/AIDS among the various racial/ethnic groups is also reflected in the pattern of infections diagnosed from 2002 to 2006 (Figure 9). Although generally, the number of HIV infections has decreased in each racial/ethnic group, minorities still comprise the majority of new infections. Blacks account for 52.5% of new infections, but only 13.6% of the New Jersey population in 2006; and Hispanics accounted for 23.3% of new infections, but only15.6% of the New Jersey population in The number of infections has decreased from 460 in 2002 to 411 in 2006 among White non-hispanics, and from 1,254 in 2002 to 952 in 2006 among Black non-hispanics. Among Hispanics the decline was from 470 in 2002 to 422 in Figure 9. Estimated Number of Individuals Diagnosed with HIV/AIDS in New Jersey by Race/Ethnicity and Year of Diagnosis: Source: New Jersey ehars as of December 31,
 and IDU associated (4.9% heterosexual sex with an IDU) continue to account for a large proportion of cases (32.7%).")
185 Division of HIV, STD and TB Services exposure Category Living With HIV/aIDS At the beginning of the epidemic, the highest proportion of AIDS cases in New Jersey were exposed through IDU. In 2008 persons exposed through IDU (25.5% IDU, and 2.3% IDU and MSM) and IDU associated (4.9% heterosexual sex with an IDU) continue to account for a large proportion of cases (32.7%). Those exposed through sexual contact (heterosexual gender and male-to-male) accounted for 61 percent of all persons living with HIV/AIDS in 2008 (Tables 7 and 8). The high percentages in reported exposures due to heterosexual sex is in part due to the fact that this report classifies heterosexually active persons with partners of unknown risk as exposed through heterosexual sex. Previously these individuals were classified as having an unknown risk. Sixty one percent of men reporting heterosexual exposure as their mode of exposure had partners with unknown risk, compared to just 41 percent of women (Table 7). Table 7. Adult/Adolescent Persons Living with HIV/AIDS in New Jersey by Risk Exposure, 2008 Note: Does not include individuals under the age of 13 as of December 31, a. MSM=Male-to-male sex b. IDU=Injection drug use c. Other/Unknown are combined due to the low number of cases in the other category. Source: New Jersey ehars as of December 31, Table 8. Adult/Adolescent Persons Living with HIV/AIDS in New Jersey Exposed by Heterosexual, by Partner Risk, 2008 Note: Does not include individuals under the age of 13 as of December 31, Source: New Jersey ehars as of December 31,


186 Epidemiologic Profile for 2008 The proportion of men and women living with HIV/AIDS in 2008 varied by exposure category and racial/ethnic group. The greatest percentage of Hispanic and Black non-hispanic men living with HIV/AIDS in 2008 were exposed through injection drug use. However, the greatest percentage of White non-hispanic men were exposed through sex with another man (Table 9). The lower proportion of White non-hispanic men indicating sex with men, and the higher proportion of White non-hispanic men indicating exposure through heterosexual sex and IDU, may explain the greater racial disparity in women. The risks of the partners of men who reported heterosexual exposure were comparable across all races and ethnic groups with most being exposed with a partner of unknown HIV risk (Table 10).. Table 9. Number and Percent of Men Living with HIV/AIDS in New Jersey Exposure Category and Race/Ethnicity in 2008 Note: Does not include individuals under the age of 13 as of December 31, a. Other includes Asian/Pacific Islander and American Indian/Alaska Native. b. MSM=Male-to-male sex c. IDU=Injection drug use d. The categories of other exposure and unknown exposure are combined due to the small number of cases in the other category. Source: New Jersey ehars as of December 31, Table 10. Number and Percent of Men Living with HIV/AIDS in New Jersey Exposed by Heterosexual Sex by Risk of Partner and Race/Ethnicity in 2008 Note: Does not include individuals under the age of 13 as of December 31, a. Other includes Asian/Pacific Islander and American Indian/Alaska Native. Source: New Jersey ehars as of December 31,
.")
187 Division of HIV, STD and TB Services A different pattern of known exposure emerges for women living with HIV/AIDS in 2008 (Table 11) as compared to men. For all racial and ethnic groups, women are most likely to have been exposed through heterosexual sex (64%). However, IDU associated exposures are still a major risk (37% which includes 26% IDU plus 11% heterosexual sex with an IDU), particularly among White non-hispanic women. The majority (49%) of White non-hispanic women were exposed through IDU (35%) and sexual contact with an IDU (13.5%). In contrast, Black non-hispanic and Hispanic women living with HIV/AIDS were more likely to have been exposed through heterosexual sex as through IDU or IDU associated exposure. Black non-hispanic women who reported exposure through heterosexual sex were less likely to know the risk of their partner than Hispanics and White non-hispanics (Table 12). This may be due to a reluctance of Black non- Hispanic men to identify as gay, and hence have sex with both men and women. Table 11. Number and Percent of Women Living with HIV/AIDS in New Jersey by Race/Ethnicity and Exposure Category in 2008 Note: Does not include individuals under 13 years of age as of December 31, a. Other includes Asian/Pacific Islander and American Indian/Alaska Native. b. The categories of other exposure and unknown exposure are combined due to the small number of cases in the other category. Source: New Jersey ehars as of December 31, Table 12. Number and Percent of Women Living with HIV/AIDS in New Jersey Exposed by Heterosexual Sex by Risk of Partner and Race/Ethnicity in 2008 Note: Does not include individuals under 13 years of age as of December 31, a. Other includes Asian/Pacific Islander and American Indian/Alaska Native. Source: New Jersey ehars as of December 31,

188 Epidemiologic Profile for 2008 Targeted at Risk Populations Some populations of HIV infected individuals are of special interest for planning purposes. These include persons exposed to HIV through injection drug use, women exposed to HIV through sexual contact with men, and men exposed to HIV through sexual contact with men or women. Characteristics of these populations can be seen in Tables Generally, persons exposed through IDU are more likely to be 50 years of age or older than men or women exposed through sexual contact. The percent of 50+ men and women living with HIV/AIDS exposed through IDU increased from the previous years, although the IDU men and IDU women living with HIV/AIDS decreased. This may reflect the fact that the early epidemic in New Jersey was predominately among persons exposed through IDU. Black non-hispanics represent the greatest percentage of cases in all groups except men who were exposed through sex with men. Among the other populations, the disparity is greater among women who were exposed through sex with men. Men exposed through IDU tend to be older than women. For women IDU, the most prevalent age group is (45.4%) followed by those aged 50 and over. Among men, the larger percentage of HIV infected through IDU are 50 or over (Tables 13). White non-hispanic men exposed by sexual contact with women tend to be older than other men exposed through sexual contact with women and Hispanics tend to be younger. The heterosexually exposed population also shows the greatest racial disparity for men (Table 15). The proportion of heterosexual men living with HIV/AIDS in 2008 who were aged 50 and older was greater than in previous years. Women show the same disparity as men (Table 16). White non-hispanic men who were exposed through sexual contact with other men also tend to be older (% of 50+ on Table 17 become greater than in previous years). Black non-hispanics and Hispanics have similar age distributions (Table 17). Table 13. Number and Percent of Men (Aged 13+ as of December 31, 2008) Exposed through IDU Living with HIV/AIDS in New Jersey by Age and Race/Ethnicity, 2008 Source: New Jersey ehars as of December 31, * Other includes Asian/Pacific Islander and American Indian/Alaska Native. 41
 Exposed through IDU Living with HIV/AIDS in New Jersey by Age and Race/Ethnicity, 2008")
 Exposed through Sex with Females Living with HIV/AIDS in New Jersey by Age and")
 Exposed through Sex with Men Living with HIV/AIDS in New Jersey by Age and 42")
189 Division of HIV, STD and TB Services Table 14. Number and Percent of Women (Aged 13+ as of December 31, 2008) Exposed through IDU Living with HIV/AIDS in New Jersey by Age and Race/Ethnicity, 2008 Source: New Jersey ehars as of December 31, * Other includes Asian/Pacific Islander and American Indian/Alaska Native. Table 15. Number and Percent of Men (Aged 13+ as of December 31, 2008) Exposed through Sex with Females Living with HIV/AIDS in New Jersey by Age and Race/Ethnicity, 2008 Source: New Jersey ehars as of December 31, * Other includes Asian/Pacific Islander and American Indian/Alaska Native. Table 16. Number and Percent of Women (Aged 13+ as of December 31, 2008) Exposed through Sex with Men Living with HIV/AIDS in New Jersey by Age and Race/Ethnicity, 2008 Source: New Jersey ehars as of December 31, * Other includes Asian/Pacific Islander and American Indian/Alaska Native. 42
 Exposed through Sex with Men Living with HIV/AIDS in New Jersey by Age and Race/Ethnicity, 2008 Source: New Jersey ehars as of December")
190 Epidemiologic Profile for 2008 Table 17. Number and Percent of Men (Aged 13+ as of December 31, 2008) Exposed through Sex with Men Living with HIV/AIDS in New Jersey by Age and Race/Ethnicity, 2008 Source: New Jersey ehars as of December 31, *. Other includes Asian/Pacific Islander and American Indian/Alaska Native. Trends in new Diagnoses From 2002 through 2006, of the men and women diagnosed with HIV/AIDS who have a reported mode of exposure, a higher proportion were exposed through sexual contact than by any other mode of exposure (68% for men and 66% for women) (Figures 10 and 11). For men, male-tomale sex (regardless of whether male-to-female sex also occurred) accounted for 33 percent of all exposures and heterosexual sex (sex with women but not men) for 35 percent of all exposures. The proportion of newly diagnosed women exposed through IDU declined from 19 percent in 2002 to 12 percent in The proportion of newly diagnosed men exposed through IDU declined from 21 percent in 2002 to 13 percent in The proportion of individuals exposed through heterosexual contact increased slightly for men and women. Similar to the modes of exposure for PLWHA a greater proportion of men diagnosed from 2002 through 2006 who reported heterosexual exposure did not know the risk of their partner compared to women (see Figures 10 and 11 insert). 43
191 Division of HIV, STD and TB Services Figure 10. Estimated Number of Men (Age 13+ at Diagnosis) Diagnosed with HIV/AIDS in New Jersey by Mode of Exposure and Year of Diagnosis Source: New Jersey ehars as of December 31,
192 Epidemiologic Profile for 2008 Figure 11. Estimated Number of Women (13+ at Diagnosis) Diagnosed with HIV/AIDS in New Jersey by Mode of Exposure and Year of Diagnosis Source: New Jersey ehars as of December 31,

193 Division of HIV, STD and TB Services age Living With HIV/aIDS In 2008 the median age of PLWHA was 47 years (females median age of PLWHA was 45), and 76.6 percent of all PLWHA were 40 years and older. In general prevalence increases with age, reaches a peak at the age group of and declines thereafter. The age group of has the highest rate of PLWHA. The numbers of persons older than 50 living with HIV/AIDS has increased 12 times since 1992, while the number of all PLWHA increased two times (Figure 4). The increase in persons older than 50 living with HIV/AIDS may be attributed to the fact that people are living longer with HIV/AIDS so those who were infected at a younger age are maturing into this age category; and a greater proportion of cases reported with HIV/AIDS since 1998 are older than 40 years of age at time of diagnosis compared to those reported prior to 1998 (data not shown). The proportion of all persons living with HIV/AIDS who were aged 50 and older in 2008 was greater than those aged 50 and older who were living with HIV/AIDS in the past. The prevalence rate for males of all ages living with HIV/AIDS is almost twice that of females. However, the prevalence rate for males and females infected under the age of 20 are almost equal. Most of the infections of those living in their teens occurred perinatally (Table 18). Table 18. Number of Persons Living with HIV/AIDS in New Jersey by Age Group, 2008 Note: Rates are per 100,000 population-based U.S. Census July 2007 Bridged Estimates. Source: New Jersey ehars Trends in new Diagnoses TThe largest number of diagnosed cases 2002 through 2006 occurred in people 30 through 49 years of age, a time that is typically considered the most productive years of life. The highest rates for women also coincide with the childbearing years. The number of diagnoses was almost equal for males and females under the age of 25, but as age increased, the ratio of male to female 46
194 Epidemiologic Profile for 2008 cases increased. Overall for pediatric cases (those diagnosed under 13 years of age), the equality of rates can be attributed to the fact that most of the individuals were infected perinatally. Trends of new diagnoses were similar for men and women from 2002 through The number of newly diagnosed HIV/AIDS cases aged 30-39, declined from year 2002 to year 2006 ( newly diagnosed individuals aged showed a sharper decline than those aged for men and women). Newly diagnosed HIV/AIDS men aged increased from year 2002 to year 2006 (20-24 men increased sharply). The number of individuals diagnosed with HIV/AIDS aged 55+ remained relatively stable for men and women during those five years. Newly diagnosed men aged increased slightly in these 5 years, while women aged decreased slightly (Figures 12 and 13). The median age of diagnosed HIV/AIDS cases in 2006 was 40, while the median age in 2002 was 39. Figure 12. Estimated Number of Men Diagnosed with HIV/AIDS in New Jersey by Age Group and Year of Diagnosis: Source: New Jersey ehars as of December 31, 2008 Note: Only for males aged 13 years or older at diagnosis. 47

195 Division of HIV, STD and TB Services Figure 13. Estimated Number of Women Diagnosed with HIV/AIDS in New Jersey by Age Group and Year of Diagnosis Source: New Jersey ehars as of December 31, Note: Only for females aged 13 years or older at diagnosis. Special age Categories Two age categories are of special interest and represent a distinct priority population for planning: persons 13 to 24 years of age and persons 50 years of age and older. Both of these groups represent only a small percentage of cases diagnosed in recent years; however, the percentage of newly diagnosed cases had been slowly increasing through 2005 (Table 19). Additionally, as the HIV infected population ages, a greater proportion of those living with HIV/AIDS are 50 years of age and older. 48


196 Epidemiologic Profile for 2008 Table 19. Estimated Cases of HIV/AIDS for Persons Ages and 50 and Over by Year of Diagnosis: Note: Percent is the percentage of all cases diagnosed that year. Source: New Jersey ehars as of December 31, adolescents (Persons 13 to 24 Years of age) Adolescence is a period of experimentation. The use of alcohol and drugs by adolescents may occur, as well as sexual experimentation. The number of newly HIV infected men aged has increased in New Jersey in the past five years (Figure 12) and the percentage of newly diagnosed cases aged has been slowly increasing for nine years (Table 19). For those reasons, it is important to review data for this group. Additionally, most of the infections diagnosed in this group are relatively recent infections as opposed to infections diagnosed among people older than 24 years of age, where the diagnoses may have occurred ten years or more following infection. Among persons 13 to 24 years of age, Black non-hispanics represent 60 percent of cases with Hispanics accounting for 26 percent of cases and White non- Hispanics accounting for 14 percent of cases (Table 20). However, Black non-hispanics comprised of 53 percent of all HIV/AIDS new cases followed by equal proportions (23%) of Hispanics and White non-hispanics in This difference is due, in part, to the fact that Hispanics account for 18.3 percent of the state s population 13 to 24 years of age, but only 15.9 percent of the state s overall population based upon the United States Census July 2007 Bridged Estimates. 49


197 Division of HIV, STD and TB Services Table 20. HIV/AIDS Among Persons 13 through 24 Years of Age at Diagnosis in New Jersey by Race/Ethnicity and Gender, Diagnosed in Note: Three years data are presented, as numbers are too small to present one year only. Rates are not included due to the low number of cases in this population. Source: New Jersey ehars as of December 31, Exposure category is difficult to analyze due to the small number of cases. Similarly, the small number of cases among White non-hispanic adolescents makes racial comparisons difficult to interpret, so the numbers for three years are combined (Table 20 and Table 21). The number of newly diagnosed HIV/AIDS cases in all race groups has declined from 2002 to 2006 (Figure 9), but the percentage of newly diagnosed aged cases has been slowly increasing (Table 19). Young men who have sex with men (YMSM) are of particular concern, especially, young black MSM. Table 21 shows that Black YMSM aged had a much higher number than other race MSM aged The MSM in the middle age groups remain heavily affected. Among white MSM, those in their 40s, followed by those in their 50s, had the highest number of living with HIV/AIDS (Table 17). However, the largest percent (more than half) of risk exposure is MSM for all three races among HIV infected men 13 through 24 years of age (Table 21). Table 21. Persons 13 through 24 Years of Age Diagnosed with HIV/AIDS in New Jersey in by Exposure Category, Race/Ethnicity and Gender 50 Data are not presented for Asian/Pacific Islanders or Alaska Natives/American Indians due to the small number of cases. a. This row is a total of all the heterosexual exposures listed. b. The categories of other and unknown exposure are combined due to the small number of cases in the other category. c. Column values will not add to the total as heterosexual risk is shown as a subtotal of all heterosexual risks and as separate sub-categories. Source: New Jersey ehars as of December 31, 2008.

198 Epidemiologic Profile for 2008 Persons 50 Years of age and older The age group of persons 50 years of age and older is often overlooked in planning for HIV services. The group is important to consider for two reasons: the immune system weakens with age so the body has less ability to fight infection, and people over 50 years of age tend to have more chronic conditions for which they take medications. These medications may interfere with HIV treatment. Overall, Black non-hispanics account for more than half of the 2006 new cases of persons aged 50+ and of the 2008 PLWHA, followed by White non-hispanics (Table 22). This is a different pattern than can be found for other age groups where Black non-hispanics comprise the largest percentage of cases, but Hispanics and White non-hispanics account for almost the same percentage of cases (Table 6 and Figure 9). This is due, in part, to the fact that Hispanics comprise a smaller percentage of the population 50 years of age and older than they do in the general population (9.4% of 50+ versus 15.9% of all age on Figure 2). Similar to the HIV infected population in general, Black non-hispanic women are more disproportionately infected among newly diagnosed cases, as well as among PLWHA than Black non-hispanic men. Among Hispanic persons 50+ there is a larger percentage of 2006 newly diagnosed cases than among PLWHA in 2008; the reverse is true for the Black non-hispanic groups. The percentage of newly diagnosed men and women in this age group infected through IDU is lower than the percentage of persons infected through IDU among those living with HIV/AIDS in this age group. The percentage of newly diagnosed men and women in this age group infected through heterosexual sex is higher than the percentage of persons infected through heterosexual sex among those living with HIV/AIDS in this age group (Table 23). The proportion of HIV/AIDS diagnosed among persons 50+ that were exposed through sexual contact is larger than in the past. Table 22. Cases of HIV/AIDS Among Persons 50 Years of Age and Older in New Jersey by Race/Ethnicity and Gender Note: Rates are not included due to the low number of cases in this population. Source: New Jersey ehars as of December 31,

199 Division of HIV, STD and TB Services Table 23. Cases of HIV/AIDS Among Persons 50 Years of Age and Older in New Jersey by Exposure Category and Gender a. MSM=Male-to-male sex. b. IDU=Injection drug use. The categories of other exposure and unknown exposure are combined due to the small number of cases in the other category. Source: New Jersey ehars as of December 31, Children affected by HIV Children are affected by the HIV disease in two ways: they may be infected with HIV, or they are affected because they lose one or both of their parents to HIV disease. The latter may happen because the parent is too sick to care for the child, or the parent may die. Pediatric Infections Children who are diagnosed before they are 13 years of age are considered to be pediatric infections. As the reporting of pediatric cases of HIV/AIDS is more current than cases for other age groups due to the continual monitoring of birth certificates and reports from facilities, pediatric infections through December 31, 2008 are presented in this report. Most of the 1,341 cumulative pediatric HIV/AIDS infections (Table 24) resulted from a child s mother being infected with HIV (perinatal transmission). Due to improvements in the screening of donated blood in 1985, transfusions have been virtually eliminated as a means of exposure. As with adult/adolescent infections, the highest proportion of cases occurred in Black non-hispanic children (Table 24). Table 24. Cumulative Pediatric HIV/AIDS Cases in New Jersey Source: New Jersey ehars as of December 31,
. Table 25.")
200 Epidemiologic Profile for 2008 In 1993, the DHSTS began monitoring pediatric exposures to HIV through Enhanced Perinatal Surveillance (see Appendix A). Since that time over 3,200 exposures have been followed, and the number of annual pediatric infections has dropped over 90 percent (Table 25). Table 25. HIV Perinatal a Exposure in New Jersey by Current Status and Birth Year Since 1993 * Data for 2007, 2008 is incomplete due to delays in reporting. a. Child was exposed to HIV during pregnancy/delivery. b. Child is known to be infected with HIV/AIDS. c. Child was exposed but actual status of infection is not known. d. Child was perinatally exposed and proven to be uninfected. Source: New Jersey Enhanced Perinatal Surveillance data as of December 31, Children Whose Mothers have Died of HIV/aIDS As part of Enhanced Perinatal Surveillance, the ehars was matched against birth certificate files from 1989 to In this way mother-child pairs were linked. Additionally, case reports for children were linked to their mothers; the presence of siblings was also noted when the information was available. As of December 31, 2008 there were an estimated 6,498 women listed in ehars with evidence that they had at least one live birth. Of those women 2,053 have died, 58% (1,186) of whom died leaving at least one surviving child under the age of eighteen. Comorbidities The health care treatment for many persons living with HIV/AIDS, particularly the newly diagnosed, includes treatment for one or more comorbid conditions in addition to HIV/AIDS. Under the Ryan White CARE Act, comorbidity is very broadly defined. Comorbidity can include physical illnesses (such as tuberculosis, hepatitis, sexually transmitted infection), mental health problems (depression or other mental illness), behavioral problems (substance abuse), and/or social problems (homelessness, incarceration). Meeting the multiple needs of people living with HIV/AIDS who have comorbidities requires attentive coordination of services as, generally; TB and hepatitis C morbidity accelerate with HIV co-infection. 53

201 Division of HIV, STD and TB Services Tuberculosis (TB) A person co-infected with HIV and TB is classified as an AIDS case. According to the CDC, TB is a leading cause of death among people infected with HIV. The risk of developing TB disease is much greater for those infected with HIV. The HIV infection so severely weakens the immune system that people dually infected with HIV and TB have a 100 times greater risk of developing active TB disease and becoming infectious compared to people not infected with HIV. The CDC estimates that 10 to 15 percent of all TB cases and nearly 30 percent of cases among people ages 25 through 44 are occurring in HIV-infected individuals. Consequently, the CDC recommends that, all people infected with HIV should be tested for TB, and, if infected, complete preventive therapy as soon as possible to prevent TB disease. Extra Pulmonary TB and Pulmonary TB are included among the opportunistic infections that define AIDS. Men comprised 71 percent of the cumulative AIDS cases and 73.2 percent of TB/AIDS cases in New Jersey in 2008 (Table 28). The rate of comorbid infection with HIV/TB is 5.5 per 100 of men with AIDS and 4.8 per 100 women with AIDS. Black non-hispanics show a higher proportion of TB cases than White non-hispanics and Hispanics. Overall, 5.3 percent of all persons diagnosed with AIDS were co-infected with TB in Table 26. Overview of Cumulative AIDS Cases and AIDS Cases with TB in New Jersey Source: New Jersey ehars as of December 31,

202 Hepatitis C Epidemiologic Profile for 2008 According to the CDC, one quarter of the HIV-infected persons in the United States are also infected with the hepatitis C virus (HCV). This figure may be even higher in New Jersey since much of the state s epidemic is related to injection drug use. Hepatitis C is one of the most important causes of chronic liver disease in the United States and it progresses more rapidly to liver damage in HIV-infected persons. Hepatitis infection may also impact the course and management of HIV infection. Because HCV is transmitted through the skin by puncture, co-infection with HIV and HCV is common (50%-90%) among HIV-infected injection drug users. For persons infected with HIV through sexual exposure, co-infection with HCV is no more common than among similarly aged adults in the general population (3%-5%). Chronic HCV infection develops in percent of infected persons and leads to chronic liver disease in 70 percent of these chronically infected persons. Hepatitis infection is an opportunistic infection in HIV-infected persons, but it is not considered an AIDS-defining illness. As highly active antiretroviral therapy (HAART) and prophylaxis of opportunistic infections increase the life span of persons living with HIV, HCV-related liver disease has become a major cause of hospital admissions and deaths among HIV-infected persons. Hepatitis-C (HCV) among HIV/aIDS Patients in new Jersey* Hepatitis C (HCV) reports during 2008 were matched probabilistically to the New Jersey ehars as of June 30, 2009 using AUTOMATCH 1. The matching algorithm used date of birth, names (including aliases), street address, city, county, zip code, sex and race/ethnicity to match and verify matched records. Weak matching pairs were clerically reviewed prior to deciding on their matching status. The match was performed by the HIV/AIDS surveillance program to maintain confidentiality of the HIV information. Of the 6,105 unduplicated HCV reports in 2008, 546 (8.9%) were matched to HIV/AIDS records. This is 1.4 percent lower than the matched records of the 2007 HCV reports. Table 27 shows the demographic distribution of the coinfected cases compared to all other HIV/AIDS cases that were not co-infected with HCV and alive as of January 1, A higher proportion among the coinfected group was AIDS cases as of June 30, 2009 compared to HIV/AIDS cases that were not co-infected with HCV. Sex distribution is similar for both groups of patients. Sixty-four percent 55
203 Division of HIV, STD and TB Services of the co-infected patients are Black non-hispanic compared to 54 percent of the not coinfected group. The percentages of White non-hispanic and Hispanics are lower in the coinfected group compared to the not co-infected group. The average age of HIV/AIDS diagnosis is older for the co-infected group (38.9 years) than for the HIV/AIDS group that is not co-infected with HCV (36.5 years). Geographic distribution of the co-infected persons is similar to that of HIV/AIDS cases. Over 55 percent in both groups resided in Essex, Hudson, Union and Passaic counties. Thirty-five percent of the co-infected individuals resided in Essex County (results not shown). There is a high association between injection drug use and HCV/HIV co-infection. Two-thirds of the coinfected individuals were exposed to HIV/AIDS through IDU or MSM/IDU, almost two and a half times the proportion among the group that is not co-infected with HCV. An additional five percent of the co-infected group reported MSM and 22 percent reported heterosexual contact compared to 21 percent and 40 percent for the not co-infected group, respectively. Only six percent of the co-infected group did not report any exposure category. Mortality is higher among the co-infected group, five percent died in or after 2008 compared to only three percent for the not co-infected group. Table 28 shows the adjusted odds of having HCV infection among HIV/AIDS patients associated with risk exposure categories, controlling for sex, age at HIV/AIDS diagnosis, year of HIV/AIDS diagnosis and race/ethnicity. The odds were calculated from logistic regression using the SAS system 2. Only significant variables are kept in the table. The odds of co-infection with HCV among HIV/AIDS patients is more than five times higher among those who inject drugs than among those who did not report any risk exposure. There are no significant differences in co-infection between those whose exposure risk was sexual contact and those who did not report any risk of exposure. Increased age at HIV/AIDS diagnosis is associated with increased odds of co-infection. One-year increase in age at HIV/AIDS diagnosis is associated with 2 percent increase in co-infection with HCV. Blacks non-hispanic are more likely than Whites non-hispanic to be co-infected. No significant effects of sex or year of HIV/AIDS diagnosis were observed. Despite data limitations these results suggest new HIV prevention challenges. The frequent co-infection of HCV and HIV underscores the importance of an integrated prevention message that addresses high-risk behaviors, especially injection drug use, to reduce both HIV and Hepatitis-C infection. The higher short-term mortality among HIV/AIDS patients who were co-infected with HCV in 2008, calls attention to the need for HIV/AIDS care and treatment programs to control HCV. * For questions contact Abdel R. Ibrahim (609) or Abdel.Ibrahim@doh.state.nj.us 1 AUTOMATCH is a generalized record linkage system that provides individual matching. It uses new advances in record linkage technology to provide statistically justifiable methodology for file matching. 2 SAS =Statistical Analysis System 56

204 Epidemiologic Profile for 2008 Table 27. Distribution of Hepatitis-C and HIV Co-infection Status Among HIV/AIDS Cases By Demographic Source: New Jersey Department of Health and Senior Services Division of HIV, STD and TB Services, Epidemiologic Services Unit. Data as of June 30,

205 Division of HIV, STD and TB Services Table 28. The Adjusted Odds of having Hepatitis-C Infection Associated with Exposure Risk and Other Variables of HIV/AIDS Patients * Significant at 1%. Odds are adjusted for sex and year of HIV/AIDS. The odds for categorical variables are interpreted in relation to the reference category. Sexually Transmitted Diseases An estimated 15 million people each year in the United States are infected with a sexually transmitted disease (STD). It is important to include STD data in the reporting of HIV/AIDS because sexual contact is a primary exposure category for HIV/AIDS. The STDs are indicators of individual high-risk behavior and the presence of some STDs increases the transmissibility of HIV. The most commonly reported STD in New Jersey is chlamydia (Table 29: 21,536 cases reported in 2007). It is asymptomatic in most cases and occurs most often in female adolescents who are physiologically more susceptible to this infection than are older women. If exposed to HIV, women infected with chlamydia are up to five times more likely to become infected with HIV. Gonorrhea is the second most commonly reported STD in New Jersey, (6,076 cases reported in 2007). Drug-resistant strains of this STD are becoming increasingly common. Unless successfully treated, gonorrhea can facilitate HIV transmission. The number and rate per 100,000 of cases of chlamydia increased dramatically from 2003 to Since 2003, the rates for chlamydia are the highest they have been in New Jersey for the last five years, although still below the national rates. The number and rate per 100,000 of cases of syphilis and gonorrhea decreased from 2003 to 2006, but increased in The rates for gonorrhea have been below national rates for the past five years. The number and rate of syphilis infections has not declined nationally from The rate of syphilis in New Jersey was slightly higher than the national rate in 2003, whereas 2004 to 2007, the rate was lower than the national rate (Table 29). 58

206 Epidemiologic Profile for 2008 Table 29. Sexually Transmitted Disease (STD) Incidence and Rates in New Jersey and the United States for Note: Rates are per 100,000 population. Source: Division of Sexually Transmitted Diseases Prevention, CDC. Sexually Transmitted Diseases (STDs) and HIV/aIDS Co-infection in new Jersey: Results of Matching STD Reports in to HIV/aIDS Records 1 Sexually Transmitted Disease (STD) individual reports during 2007 and 2008 were matched probabilistically to the HIV/AIDS registry in New Jersey as of June 30, 2009 using AUTOMATCH 2. The matching algorithm used dates of birth (including aliases and imputed year of birth), names (including aliases), Social Security Number (SSN), telephone number, street address, city, county, zip code, sex and race/ethnicity to match and verify matched records. Weak matching pairs were clerically reviewed prior to deciding on their matching status. The match was performed by the HIV/AIDS surveillance program to maintain confidentiality of HIV/AIDS information. Of the 37,879 unduplicated STD case reports eligible for matching, 543 (1.40%) were matched to HIV/AIDS records. This is slightly lower than the two percent matching percentage for the cumulative STD records through 2006 found during a previous match between STD and HIV/AIDS records. 59

207 Division of HIV, STD and TB Services Table 30 shows the demographic distribution of the co-infected cases compared to HIV/AIDS cases that are not co-infected with STDs among those who were diagnosed with HIV/AIDS and alive as of January 1, Males accounted for 78.7 percent of the co-infected group compared to 64.7 percent among HIV/AIDS cases that were not co-infected with STD. There is a higher proportion of HIV (not AIDS) cases among the coinfected group. Racial distribution is similar for both groups of patients. The age at HIV/AIDS diagnosis is considerably younger among those co-infected than among those HIV/AIDS patients who were not co-infected with STD. The co-infected group (average age, 29.8 years) was diagnosed with HIV/AIDS 6.2 years younger than those HIV/AIDS patients (average age, 36 years) who were not co-infected with STD. Average age at STD diagnosis for the co-infected group was 34.5 years, 10.8 years older than those who were diagnosed with STD only. There is a high association between syphilis and HIV/AIDS in Fifty-four percent of coinfected individuals reported an episode of syphilis, as their first STD. Gonorrhea was the second most reported at 26 percent and chlamydia at 21 percent. In contrast, among those infected with STD only, chlamydia was the most frequently reported with 80 percent of the reported cases, gonorrhea with 16 percent and syphilis with three percent (results not shown). Figure 1 shows the types of syphilis associated with the co-infected group. Of the HIV/AIDS patients who were co-infected with syphilis, 65 percent had latent syphilis, 30 percent had secondary syphilis, and five percent had primary syphilis. Nearly four out of five (76.9%) of the co-infected individuals reported sexual activity as the major risk exposure for HIV infection. The percentage of MSM risk in the co-infected group is 50 percent compared to 20 percent among all other HIV/AIDS cases. Seven percent of the co-infected group reported injection drug use as a medium for HIV infection and 13 percent did not report any mode of HIV disease exposure. A higher proportion of the co-infected group were recently diagnosed with HIV/AIDS (70% since 2001) compared to the not co-infected group (only 37% since 2001). Geographic distribution of the co-infected persons is similar to that of HIV/AIDS cases. Over 55 percent in both groups resided in Essex, Hudson, Union and Passaic counties. However, 33 percent of the co-infected resided in Essex County at time of HIV diagnosis compared to 28 percent among the HIV/AIDS patients who were not co-infected with STD. In the remaining counties, there is virtually no difference in the distribution between the two comparison groups (results not shown). 1 For questions please contact Abdel R. Ibrahim: (609) Abdel.Ibrahim@doh.state.nj.us 2 AUTOMATCH is a generalized record linkage system that provides individual matching. It uses new advances in record linkage technology to provide statistically justifiable methodology for file matching. 60

208 Epidemiologic Profile for 2008 Table 30. Distribution of STD and HIV Co-infection Status Among HIV/AIDS Cases by Demographic Source: New Jersey Department of Health and Senior Services Division of HIV/AIDS Services, Epidemiologic Services Unit. Data as of June 30,

209 Division of HIV, STD and TB Services Figure 14. Distribution of Syphilis by Type Amond the Co-infected Group,
210 Mortality Epidemiologic Profile for 2008 Progression from HIV to aids and Survival after aids Diagnosis The era of Highly Active Antiretroviral Therapy (HAART), which began in 1996, has also witnessed a significant improvement in the health of HIV patients. It has slowed down progression of HIV to AIDS and witnessed a reduction in the death rates among AIDS patients. This marked increase in AIDS-free time and survival improved the quality of life of AIDS patients. To explore this further, we examined adult/adolescent AIDS patients progression from HIV to AIDS and survival rates after AIDS diagnosis during 1996 to 2006, the last year for which we have complete data. AIDS-free and survival times 1 were computed directly from dates of death and dates of HIV and AIDS diagnosis or censoring date as of December 31, AIDSfree rates from HIV to AIDS and survival after AIDS diagnosis, and differences in survival were analyzed to compare socio-demographic and HIV exposure categories during the HAART era. First, we illustrate the significant gains in AIDS-free time and in survival after AIDS diagnosis comparing the pre and post HAART era. Figure 16 shows the AIDS-Free and survival curves for those diagnosed with HIV or AIDS between 1996 and 2006 (during the HAART era) compared to those diagnosed between 1992 and 1995 (Pre-HAART era). Those diagnosed during the HAART era have considerably slower progression from HIV to AIDS and higher survival rates after AIDS diagnosis than those diagnosed prior to the HAART era. The impact of the HAART era seems to be more pronounced on slowing the progression from HIV to AIDS than on survival after AIDS diagnosis. This improvement in AIDS-free and survival times is attributed largely to advancements in the treatment of HIV/AIDS patients from 1996 to Progression includes only patients with over a month of an observed progression from HIV to AIDS. Survival excludes those born outside the USA and its dependencies where mortality reporting is incomplete and/or inaccessible to US national/state vital statistics files. 63
211 Division of HIV, STD and TB Services Figure 15. Progression to AIDS and Survival Curves after AIDS Diagnosis: Pre-HAART vs. HAART Era The improvement in HIV/AIDS therapy on progression to AIDS and on survival rates during the HAART era have not been uniform across socio-demographic and exposure categories in New Jersey. The observed differences in progression from HIV to AIDS and on survival after AIDS diagnosis between males and females (Figure 17) were slight during
212 Epidemiologic Profile for 2008 Figure 16. Progression from HIV to AIDS and Survival Curves after AIDS Diagnosis by Gender, By contrast, ethnic differences in progression to AIDS and on survival from AIDS to death (Figure 18) show that Black non-hispanic and Hispanic patients progress to AIDS and succumb to death significantly faster after AIDS diagnosis than White non-hispanics. Black non-hispanics in particular experienced a considerably faster progression from HIV to AIDS and higher mortality after AIDS diagnosis. Ethnic differences in survival rates may reflect, at least in part, differences in access to medical care, as documented in the literature. Hispanic mortality may also be affected by a differential in mortality reports. New Jersey cannot obtain data for many Hispanics that die outside the United States. 65
213 Division of HIV, STD and TB Services Figure 17. Progression from HIV to AIDS and Survival Curves after AIDS Diagnosis by Race/Ethnicity, Differences in progression to AIDS and in survival after AIDS diagnosis by major exposure groups (Figure 19) show that those whose HIV exposure was injecting drug use have experienced significantly faster progression to AIDS and higher mortality after AIDS diagnosis than those whose HIV disease exposure was heterosexual sex or men having sex with men. 66
214 Epidemiologic Profile for 2008 Figure 18. Survival Curves from HIV to AIDS and after AIDS Diagnosis by Major Exposure Category, Marked differences in progression to AIDS and in survival after AIDS diagnosis occurred by age at AIDS diagnosis. Progression from HIV to AIDS increases significantly by age and survival after AIDS diagnosis decreases significantly with age. Figure 20 shows that those diagnosed at younger ages consistently show slower progression from HIV to AIDS and improved survival compared to those who were diagnosed with AIDS when they were older. 67
215 Division of HIV, STD and TB Services Figure 19. Progression to AIDS and Survival Curves after AIDS diagnosis by Age Group 68
.")
216 Epidemiologic Profile for 2008 Causes of Death The HIV disease is the fourth leading cause of death for Black males in the state, the nineteenth leading cause for White males, and the thirteenth leading cause for all males in 2005 (Table 31). The HIV disease is the seventh leading cause for Black females, the twenty-third leading cause for White females, and the sixteenth leading cause of death for females overall in 2005 (Table 32). Among all persons 25 to 44 years of age HIV disease is the fourth leading cause of death, but for Blacks 25 to 44 years of age, HIV disease is the first leading cause of death (data not shown). When AIDS was first diagnosed in the early 1980s, the life expectancy of a person with the disease was measured in months, since the advent of the highly active antiretroviral therapy (HAART), persons are living with HIV/AIDS for years, and in many cases are dying of diseases other than HIV. Table 31. Ranking of Leading Underlying Causes of Death by Race for Males in New Jersey in 2005 Note: Black and White categories include Hispanics. Total includes other races. All other diseases category excluded from ranking. Source: New Jersey Department of Health and Senior Services, Center for Health Statistics. 69

217 Division of HIV, STD and TB Services Table 32. Ranking of Leading Underlying Causes of Death by Race for Females in New Jersey in 2005 Note: Black and White categories include Hispanics. Total includes other races. All other diseases category excluded from ranking. Source: New Jersey Department of Health and Senior Services, Center for Health Statistics 70

218 Epidemiologic Profile for 2008 InDICaToRS of RISk Information related to the behavioral and social indicators of risk for HIV infection are necessary for the planning of HIV prevention, care, and treatment. This section of the Epidemiologic Profile includes information about the following indicators: sexual behaviors (such as the number and gender of partners), drug use behavior, and testing behaviors (such as where and/or why tested). The data were collected through mandated reports of disease or admission to drug treatment, or through special surveys designed to measure health behaviors. Each of these methods has its limitations. Mandated reports do not provide information on atrisk, but not yet infected populations. Surveys provide only information on the population questioned, and the risk behaviors are self-reported. The Behavioral Risk Factor Surveillance System (NJBRFS) is the largest telephone-based surveillance system in the world, with over 430,000 interviews conducted in Self reported data was collected as part of the New Jersey survey. Questions regarding HIV-related attitudes and behaviors were asked of the respondents under the age of 65 who were accessible by telephone. Since it is population-based, estimates about testing attitudes and practices can be generalized to the adult population, not just those at highest risk for HIV/AIDS. HIV Testing Behavior The NJBRFS asked 20,890 respondents from if they had ever been tested for HIV. Persons ages of most races were more likely to have been tested than persons in other age groups. In every age group, a greater proportion of Black non-hispanics said they have had an HIV test than did any other racial or ethnic group (Table 33 and Figure 20). The Odds Ratio of Black non-hispanics tested in was 2.86 times more likely than the Odds Ratio of White non-hispanic. Table 33. Estimated Percentage of New Jersey Adults aged (18-64) Who Have Ever Had an HIV Test* by Age Group and Race/Ethnicity, *Excluding blood donations. Source: Prevalence Estimates for from NJBRFS. New Jersey Center for Health Statistics. 71
219 Division of HIV, STD and TB Services Figure 20. Estimated Percentage of New Jersey Adults (18-64) Who Have Ever Had an HIV Test* by Age and Race/Ethnicity, * Excluding blood donations. Source: Prevalence Estimates for from NJBRFS. New Jersey Center for Health Statistics. In the surveys, the data from the NJBRFS indicated that the proportion of women who had an HIV test was higher than the proportion of men who had been tested, among respondents 44 years of age and younger. Mandatory counseling and voluntary testing of pregnant women at the time of labor and delivery may account for these higher estimated percentages. A higher proportion of men aged reported having had an HIV test than women did in the same age category. Overall, the link function Cumulative Logit indicates that the Odds Ratio of women tested in is 1.29 times more than Odds Ratio of men. 72
 Who Have Ever Had an HIV Test* by Age Group and Gender, 2006-2008 * Excluding blood donations.")
220 Epidemiologic Profile for 2008 Table 34. Estimated Prevalence Percentage of New Jersey Adults Aged (18-64) Who Have Ever Had an HIV Test* by Age Group and Gender, * Excluding blood donations. Source: Prevalence Estimates for from NJBRFS. New Jersey Center for Health Statistics. Figure 21. Estimated Percentage of New Jersey Adults (18-64) Who Have Ever Had an HIV Test* by Age Group and Gender, * Excluding blood donations. Source: Prevalence Estimates for from NJBRFS. New Jersey Center for Health Statistics. 73
.")
221 Division of HIV, STD and TB Services Nearly eight thousand respondents between the ages of 18 and 64 in indicated where they had their last HIV test. In most cases, the last HIV test was at a doctor s office or at a health maintenance organization (HMO). The estimated prevalence percentage of White non-hispanics tested in a private doctor s office or an HMO (52.8%) was higher than in other race/ethnicity groups. The estimated prevalence percentages of Hispanics tested in a Hospital/Emergency Room (24.7%) or a clinic (23.1%) were higher than in other race/ethnicity groups in New Jersey. A small percent of the respondents indicated their last HIV test was obtained at a counseling and testing site or a correctional facility. However, the estimated prevalence percentage of Black non-hispanics tested in a correctional faciltiy or drug treatment facility (2.1%) and counseling testing site (5.4%) were larger than for other race/ethnicity groups (Table 35 and Figure 22). Table 35. Estimated Percentage of New Jersey Adults (18-64) Where Last Obtained an HIV Test* by Race/Ethnicity, * Excluding blood donations. ** includes refused/unknown and Asian/Pacific Islander race. Source: Prevalence Estimates from NJBRFS


222 Epidemiologic Profile for 2008 Figure 22. Estimated Percentage Major Sites of New Jersey Adults (18-64) Where Last Obtained an HIV Test* by Race/Ethnicity, * Excluding blood donations. ** includes refused/unknown and Asian/Pacific Islander race. Source: Prevalence Estimates from NJBRFS The doctor s office/hmo is the most common site for HIV tests among the year old population across all age categories. The respondents aged 18 through 24 years were the most likely age group to have been tested at a community health clinic, and the prevalence estimates are relatively greater for young people to use clinics than for older people. Persons 45 through 64 years old are more likely to say they used a hospital or home health organization for their recent HIV test than younger people (Table 36 and Figure 24). Table 36. Estimated Percentage of New Jersey Adults (18-64) Where Last Obtained an HIV Test* by Race/Ethnicity, * Excluding blood donations Source: Prevalence Estimates from NJBRFS
223 Division of HIV, STD and TB Services Figure 23. Percent Distribution of Major Sites Where New Jersey Adults (18-64) Last Obtained an HIV Test by Age, Note: Adults who had an HIV test, excluding blood donations. Source: NJBRFS. 76
224 Epidemiologic Profile for 2008 HIGH-RISk SITuaTIonS The NJBRFS question regarding any high-risk situation for exposure to hepatitis B was asked of 4,808 respondents in Overall, Black non-hispanic had a larger percentage of persons and higher-risk situations than White non-hispanics and Asian non-hispanics. The NJBRFS questions regarding any high-risk behavior status in HIV were asked of 7,825 respondents in 2008 (Table 38). Statistical inferences from the NJBRFS indicate that education level accounts for differences in exposure to high-risk situations among Asian non-hispanics. The results show a decreasing percentage of any risk situations in persons with a college education for all race/ethnicity groups. Table 37. Estimated Percentage of New Jersey Adults (18-64) Who Have High-Risk Situations of Hepatitis B by Education Level and Race/Ethnicity, 2007 Note: Unknown responses and refusals have been excluded from this analysis. Source: New Jersey Center for Health Statistics. Table 38. Estimated Percentage of New Jersey Adults (18-64) Who Have HIV List of High-Risk Situations by Education Level and Race/Ethnicity, 2008 Note: Unknown responses and refusals have been excluded from this analysis. Source: New Jersey Center for Health Statistics. 77
225 Division of HIV, STD and TB Services ILLICIT DRuG use Amajor factor in the prevention, care and treatment of HIV is illicit drug use. Sharing of injection drug equipment can transmit HIV and hepatitis. In addition, illicit drug use, as well as the use of alcohol, is linked with unsafe sexual activity. Drug users may exchange sex for drugs and some people think that drugs make sex more enjoyable. Most importantly, drug use (including alcohol) decreases the chances that people will protect themselves during sexual activity. Illicit drug use can lead to other problems for people who are taking HIV/AIDS medication. 1,2 People who use illicit drugs are less likely to take all of their medications, which can cause treatment failure and may lead to the transmission of HIV that is resistant to some of the drug therapies available. Additionally, people who use illicit drugs and take prescribed medications for HIV may develop adverse drug reactions which are potentially life threatening. admissions to Drug Treatment There were 62,812 people admitted to drug treatment in Of these, approximately 59 percent were White non-hispanic and one-fourth (26%) were Black non-hispanic (Table 38). Heroin/Opiates were the primary drug of choice for about 41 percent of the total admissions in Persons admitted for heroin use were primarily White non-hispanic (60%) and Black non- Hispanic (26%). The second most frequent primary drug on admission in 2008 was alcohol with 20,302 admissions. More than two-thirds (69%) of the admissions for alcohol treatment were White non-hispanic and about one-sixth (17%) were Black non-hispanic. The third most frequent primary drug in 2008 was marijuana with 9,415 admissions. This represents an increase in the number marijuana related admissions in all race/ethnic groups compared to previous years. Table 39. Primary Drug Use by Race/Ethnicity for New Jersey Resident Admissions to Drug Treatment in 2008 Source: New Jersey Department of Human Services, Division of Addiction Services. 78

226 Epidemiologic Profile for 2008 analysis of unmet need For purposes of determining unmet need, individuals who had at least one HIV care-related antiretroviral drug prescription, a viral load test and/or a CD4 test during 2007 were considered to have been in care in Individuals not in care were considered to have an unmet need for HIV-related primary medical care. Unmet need was estimated for individuals reported to ehars as having been diagnosed prior to 2007 and still living as of December 31, 2007 (n=30,916). Those incarcerated at time of diagnosis and those with unknown county of residence are not included in the analysis (not included in the 30,916). The 2007 unduplicated antiretroviral drug prescription claims data from New Jersey Medicaid, the AIDS Drug Distribution Program, General Assistance, Pharmaceutical Assistance to the Aged and Disabled (PAAD) and the Senior Gold program were linked to ehars to identify those who received prescription drugs in Viral load and CD4 data in ehars, laboratory reports not yet updated in ehars, and those laboratory test data available from Early Intervention Programs were also matched to ehars to determine who had laboratory work ordered during Out of 30,916 individuals who were diagnosed prior to 2007 and still alive at the end of 2007, 16,351 patients (53%) had at least one indicator (antiretroviral drugs, a viral load test and/or a CD4 test in 2007) of HIV primary medical care in The remaining 14,610 patients (47%) are classified as individuals with unmet need for HIV-related primary care. Differences in unmet need were found by gender, race/ethnicity, current age, mode of transmission, HIV status, year of HIV diagnosis and residence (EMA) at time of diagnosis. In 2007, 64 percent of AIDS patients received primary care compared to 34 percent of HIV patients. A higher percentage of females than males received primary medical care in Fifty-six percent of White non-hispanics, 53 percent of Black non-hispanics, and 49 percent of Hispanics were in care. The percentage of people in care has generally increased by year of HIV diagnosis. Fifty-nine percent of HIV/AIDS patients diagnosed in 2006 reported having primary medical care compared to only 48 percent who were diagnosed in or before The estimates of people in care represent minimum numbers in care. This is because many indications of care are not included in this analysis. These include medical visit data, and data on laboratory tests and prescription drugs paid for by private sources. Finally, gaps in mortality data and population movement may affect the estimated level of HIV-related primary medical care. 79

227 Division of HIV, STD and TB Services SuCCeSSeS and FuTuRe CHaLLenGeS New Jersey s response to the HIV/AIDS epidemic has yielded many successes. The greatest success in New Jersey s fight against HIV/AIDS is the reduction of perinatal transmission of HIV with a decrease from 12 percent in 1997 to one percent in Due to improvements in the screening of donated blood, transfusions have been virtually eliminated as an exposure category for HIV infection. When AIDS was first diagnosed in the early 1980s, life expectancy for individuals with the disease was measured in months. Now over 50 percent of those infected with HIV are still living ten years after the date of HIV diagnosis. In the absence of an HIV vaccine or cure, prevention remains one of the most effective methods of containing the epidemic. Successful public health efforts have reduced the number of annual new infections, but despite the existence of strong proven prevention programs, individuals are still becoming infected with a preventable disease. This is particularly true in minority communities. Although the number of infections is down for Black non-hispanic men and women, the rate of infection in this population is still significantly higher than in the White population. Although surveillance data show that persons are living longer with HIV/AIDS, the older adult is often overlooked in targeting prevention. In 2006, 33 percent of newly diagnosed HIV/AIDS cases occurred in individuals 45 years of age and older and in 2008, 59 percent of persons living with HIV/AIDS are 45 years old or older (Table 5). Many adults 45 years of age and older do not take precautions against HIV because they do not consider themselves to be at risk for infection. If they are infected, older adults often mistake the symptoms of HIV/AIDS with the signs of the normal aging process. Similarly, physicians may be less likely to consider the possibility of HIV infection in older adults, resulting in inadequate prevention and delayed diagnosis. This is a population that needs more attention. The advent of highly active antiretroviral therapy has been a huge success in an area where there was previously little hope. However, analysis of reported cases of HIV/AIDS has shown that many infected individuals are not in care. Additionally, drug resistance threatens to erase the recent gains made in treating HIV. As strains resistant to HAART increase in the HIV infected population, new pharmaceutical agents must be readily available for use in these patients. Moreover, medical treatments must also be developed to meet the future needs that current drug therapies may not resolve. The DHSTS continues to monitor changes in the epidemic using its surveillance system to look for resistant strains. However, the challenge will be to maintain and modify this system as laboratory testing for these strains evolves. 80
228 Epidemiologic Profile for 2008 Transmission of HIV, hepatitis and other blood-borne pathogens, by the sharing of contaminated needles, has given rise to syringe exchange programs in other states. Although some epidemiologic studies have shown that these programs decrease the transmission of HIV disease without increasing the rates of addiction, they remain controversial. Others think it is inconsistent with public health policy to provide drug paraphernalia to addicts. In 2007, a Gubernatorial Executive Order was established to permit a limited number of syringe exchange programs (SEP) in New Jersey. The SEPs are currently operating in Camden, Newark, Paterson and Jersey City. These municipalities are highly impacted by injection drug use and HIV transmission. The DHSTS will continue to monitor the impact of the SEP and respond to the political challenges regarding this important issue. While the availability and expansion of rapid HIV testing has revolutionized our ability to introduce testing to a greater population by informing participants of their status on the same day within 30 minutes, we must also offer more innovative programming to get African Americans and Hispanics to test sooner, long before they are symptomatic from the effects of possible HIV infection. The DHSTS believes that these challenges represent our greatest opportunity for improvement in advancing the fight against HIV. Turning the tide on reducing the spread of HIV remains a formidable challenge, and we must not underestimate the commitment needed. The value of this Epidemiologic Profile is that it provides the surveillance and research information necessary for the planning processes for HIV/AIDS prevention, education, care, treatment and HIV testing. To this end, the DHSTS invites your comments and suggestions for the use and improvement of future versions of the Epidemiologic Profile. 81
229 Division of HIV, STD and TB Services BIBLIoGRaPHY appendix a - Major Data Sources enhanced Perinatal Surveillance (eps) Overview: The project was established to monitor the implementation and effect of the Public Health Service recommendations for preventing perinatal HIV transmission on pediatric HIV/AIDS trends, provide a data collection system that enables states to respond to selected requirements of the Ryan White CARE Act, and assist with timely evaluation of perinatal prevention efforts. The project collects data using the HIV/AIDS case report form and collects additional information from supplemental records by the use of a medical record abstraction form. The enhanced surveillance methods used to identify HIV-infected mothers and their perinatally exposed children include matching of birth file to the HIV/AIDS surveillance registry and linking of mother-infant pairs. Information on HIV-infected mothers and their perinatally exposed children is abstracted from multiple sources: the maternal HIV record, prenatal care records, labor and delivery records, birth records, pediatric HIV records, birth and death certificates, and laboratory reports. The data that are collected include maternal and prenatal care, mother s HIV test history, prenatal and neonatal antiretroviral therapy, other interventions to prevent transmission, receipt of prophylaxis and treatment of the infant, appropriate follow-up care of the mother and child, and other interventions relevant to the evaluation of recommended public health actions to prevent perinatal HIV transmission. Infants identified through enhanced surveillance are followed-up every six months until their HIV infection status is determined; if they meet the case definition, they are followed-up to determine their vital status. Population: All HIV-exposed infants born during 1999 or later years and their HIVpositive mothers. Strengths: The project is population based in most areas. Data from populationbased areas are complete. In a study that included data from four population-based project areas (Louisiana, Michigan, New Jersey, and South Carolina), 90 percent ascertainment of infants born to HIV-infected women was found when data were compared with data from the Survey of Childbearing Women. The project collects information on HIV-exposed 82
230 Epidemiologic Profile for 2008 infants every six months until HIV infection is diagnosed. Study sites are able to characterize trends in perinatal HIV/AIDS, monitor the implementation and effect of perinatal prevention guidelines, assess resource needs, assess missed prevention opportunities, and monitor the effect of prevention programs. Limitations: Data for the project rely upon the ability to identify an HIV-exposed infant and locate the supplemental medical charts needed to complete the abstraction form. The completeness of data elements relies upon the level of documentation in each of these medical records. HIV/aIDS Reporting System (ehars) Overview: Since 1992 HIV/AIDS has been a reportable disease in New Jersey. The surveillance system was established to monitor incidence and the demographic profile of HIV/AIDS; describe the modes of HIV transmission among persons with a diagnosis of HIV or AIDS; guide the development and implementation of public health intervention and prevention programs; and assist in the assessment of the efficacy of public health interventions. Funding Source: U.S. Department of Health and Human Services, Centers for Disease Control and Prevention (CDC), National Center for HIV, STD, and TB Prevention, New Jersey Department of Health and Senior Services (NJDHSS) and the Division of HIV, STD and TB Services (DHSTS). Mode of Administration: The CDC designed case report forms are completed by providers, and/or the NJDHSS staff, based on a review of medical records. Records are updated based on laboratory reports received from testing laboratories. Population: All persons whose conditions meet the 1993 CDC AIDS surveillance case definition or who are identified as HIV positive. Strengths: These data reflect the effect of HIV/AIDS on a community and the trends of the epidemic in a community. The HIV/AIDS surveillance has been determined to be >85 percent complete. The data include all demographic groups (age, race/ethnicity, gender). Limitations: Information is not available on persons who are HIV positive but not reported, or who have not been tested. Information on the mode of transmission of the disease is not complete, and follow-up on known 83
231 Division of HIV, STD and TB Services positives may not be complete because they may move out-of-state after diagnosis. Because of the prolonged and variable period from infection to the development of AIDS, trends in AIDS surveillance do not represent recent HIV infections. Asymptomatic HIV-infected persons are also not represented by AIDS case data. In addition, incomplete HIV or CD4+ T- cell testing may interfere with the representation of reporting. Further, the widespread use of highly active antiretroviral therapy (HAART) complicates the interpretation of AIDS case surveillance data and estimation of the HIV/AIDS epidemic in an area. Newly reported AIDS cases may reflect treatment failures or the failure of the health care system to halt the progression of HIV infection to AIDS. The AIDS cases represent late-stage HIV infections. Response Rate: Population-based system of reporting, mandated by both statute and regulation. Evaluations of completeness are consistently greater than 85 percent. Demographic Data: Gender, age and race/ethnicity. Other Data: Schedule: Geographic Estimates: Mortality status, mode of transmission, year of diagnosis and date of report. Ongoing. State, county and municipality. new Jersey alcohol and Drug abuse Data System (adads) Overview: Population: Strengths: Limitations: Drug abuse treatment agencies throughout the state submit reports on treatment admissions and discharges to the state s Alcohol and Drug Abuse Data System (ADADS). The system collects data on drug use and socio demographic characteristics of persons admitted to drug treatment. All persons admitted to drug treatment in New Jersey. Data are provided statewide and by county. Data include detailed information on drugs used, length of time used, and methods of use including injection. Data are available on the NJDHSS website with links to other useful sites. The system does not contain data on persons who use illicit drugs but do not enter treatment. It does not contain data on needle sharing for those admitted to drug treatment. 84
232 Epidemiologic Profile for 2008 new Jersey Death Data Overview: New Jersey law requires the prompt filing of a death certificate by the proper authority in the event of a death occurring in the state. These certificates are submitted to the office of the State Registrar, where they are recorded and filed permanently. Statistics on deaths of New Jersey residents that occurred in other states are obtained through an exchange program sponsored by the national Vital Statistics Cooperative Program and added to the death file. Records of deaths occurring to non-residents of New Jersey were eliminated from the analysis. Deaths included in this report encompass all of the deaths to New Jersey residents that occurred within a calendar year. The records follow the standard certificate promulgated by the National Center for Health Statistics and include demographic information on the decedent, underlying cause of death and contributions of selected factors to the death. The underlying cause of death for deaths occurring prior to 1999 were coded in accordance with the International Classification of Diseases, Ninth Revision. Years of Data Collected: New Jersey, along with Massachusetts, the District of Columbia, and several large cities that had efficient systems for death registration, was part of the first national death registration area created in New Jersey has continued to collect death records since that time, through a number of changes in the death record format and several versions of the classification system for cause of death. The standard death certificate that provided the data for this report was implemented in The certificate was revised in 2003 using a new format. The manual for coding the cause of death that had been in effect from 1979 through 1998, Ninth Revision was replaced by the International Classification of Diseases, Tenth Revision in Population: The entire state population. Strengths: Reporting of deaths is universal and complete. Standardized procedures and definitions are used throughout the country to collect and process death certificate data. The data are widely available and can be analyzed by demographic characteristics and geographic residence of individuals who are reported to have died with an underlying cause of HIV infection. Limitations: Deaths from HIV infection as an underlying cause may be under-reported and as a consequence, information may be incomplete when using only the underlying cause of death. Death records may be less timely than reports to the HIV/AIDS reporting system. 85
233 Division of HIV, STD and TB Services Demographic Data: Gender, age, educational attainment, race/ethnicity, employment status, and marital status. Schedule: Reported annually. Geographic Estimates: State, county, municipality. Sexually Transmitted Disease Case Reporting Overview: The CDC conducts surveillance to monitor the levels of syphilis, gonorrhea, chancroid, and, more recently, chlamydia, in the U.S. in order to establish prevention programs, develop and revise treatment guidelines, and identify populations at risk for STDs. States, local areas, and U.S. territories submit to the CDC (weekly, monthly, or annually) case reports of STDs that have met the respective case definition for the infection. Funding Source: U. S. Department of Health and Human Services, Centers for Disease Control and Prevention (CDC), National Center for HIV, STD and TB Prevention and the New Jersey Department of Health and Senior Services (NJDHSS). File Content: Case report forms include date of report, name, telephone number, address, age, birth date, pregnancy status, gender, race/ethnicity, disease type, name, address and telephone number of the provider/physician, laboratory test and treatment. Population: Years of Data Collected: All persons with a diagnosis of an infection that meets the CDC surveillance case definition for the infection and who are reported to a local health department. New Jersey started to require reporting of venereal disease in New Jersey has continued to collect these reports since that time, through a number of format changes. Response Rates: Demographic Data: Schedule: Laboratories and providers are surveyed to determine compliance with regulations. Gender, age and race/ethnicity. Reported annually. 86
234 Epidemiologic Profile for 2008 Strengths: Limitations: Sexually Transmitted Disease surveillance data can serve as a surrogate marker for unsafe sexual practices and/or demonstrate the prevalence of changes in a specific behavior (e.g., rectal gonorrhea). The STD data are widely available at the state and local level and because of shorter incubation periods between exposure and infection, STDs can serve as a marker of recent unsafe sexual behavior. In addition, certain STDs (e.g., ulcerative STDs) can facilitate transmission and/or acquisition of HIV infection. Finally, changes in trends of STDs may indicate changes in community sexual norms (e.g., unprotected sex). Sexually Transmitted Diseases are reportable, but requirements for reporting differ by state. Reporting of STDs from private sector providers may be less complete. Although STD risk behaviors result from unsafe sexual practices, they do not necessarily correlate with HIV risk. Trends in chlamydia infections may reflect changes in reporting and screening practices rather than actual trends in disease. Survey of Childbearing Women Overview: Beginning in 1988 and continuing annually since, the NJDHSS, DHSTS has conducted a study of the HIV status of newborns. This is an anonymous unlinked study done through testing of a blood specimen from infants born in the state. The HIV antibodies are present in the blood of a newborn in about the same concentration as in the blood of the mother. Therefore, the test of a newborn s blood is a good indicator of the presence of HIV in the mother and infant pair. The state s 120,000 newborns each year are routinely screened for inborn errors of metabolism. This involves obtaining a blood specimen from each newborn. During the months of July, August and September, excess blood remaining from the inborn errors of metabolism screening are analyzed for HIV through blinded, anonymous surveys. Since 1994, positive specimens have been tested for the presence of ZDV. Population: All women giving birth to a live infant whose routine specimens for inborn errors of metabolism testing are received at the state Public Health and Environmental Laboratory during July, August, and September of each year. Strengths: Limitations: It is the state s only population based study of HIV prevalence. Women giving birth may not be representative of women in general. Limited information is available about the participants. 87
235 Division of HIV, STD and TB Services Tuberculosis Surveillance Overview: All reporting areas (the 50 states, the District of Columbia, New York City, Puerto Rico, and other United States jurisdictions in the Pacific and Caribbean) report tuberculosis (TB) cases to the CDC by using a standard case report form, the Report of a Verified Case of Tuberculosis (RVCT). Reported TB cases are verified according to the TB case definition for public health surveillance. In 1993, the surveillance of TB was expanded to collect additional data to better monitor and target groups at risk for TB disease, to estimate and follow the extent of drug-resistant TB, and to evaluate outcomes of TB cases. The RCVT form was revised to obtain information on occupation, initial drug regimen, HIV test results, history of substance abuse and homelessness, and residence in correctional or long-term care facilities at the time of diagnosis. Population: All persons whose case of TB meets the public health surveillance definition. Strengths: The level of active TB disease reporting is more than 95 percent complete. As a result of the 1993 expansion of surveillance activities, jurisdictions have been able to evaluate the success of TB control efforts and monitor the status of the TB epidemic. Tuberculosis surveillance data provide areas with a minimum estimate of the level of HIV comorbidity. Limitations: Data on HIV infection status of reported TB cases should be interpreted with caution, because these data are not representative of all TB patients with HIV infection. HIV testing is voluntary, and some TB patients may decline HIV testing. In addition, TB patients who have been tested anonymously may not share their HIV test results with their health care provider. Further, testing may be influenced by other factors, such as the extent to which testing is focused on, or routinely offered to, specific groups. Hepatitis C Registry Overview: Communicable Disease Services within the New Jersey Department of Health and Senior Services conducts surveillance to monitor the levels of hepatitis C in the state. 88
236 Epidemiologic Profile for 2008 Funding Source: Federally funded through the CDC. File Content: Case report forms include date of report, name, telephone number, address, age, birth date, pregnancy status, gender, race/ethnicity, disease type, name, address and telephone number of the provider/physician, laboratory test and treatment. Demographics, however, are not always available. Population: The enabling regulations for collecting and reporting hepatitis C are outlined in N.J.A.C. 8:57. As per the regulations all physicians, hospitals and clinical laboratories are required to report this disease. Hepatitis C is directly reportable to the New Jersey Department of Health and Senior Services. Demographic Data: Gender, age and race/ethnicity. Schedule: Reported annually. Strengths: Allow to assess, level, trends and prevalence of the disease. Can be used to measure comorbidity with other diseases through matching the hepatitis C registry to other disease registries like HIV/AIDS and other communicable diseases. Limitations: Some demographics are missing. uniform Billing (ub-92) Overview: The New Jersey Department of Health and Senior Services collects discharge records from hospitals. The UB-92 Hospital Discharge Data file contains medical abstracts, patient information and billing of all hospital discharges from acute care facilities. Population: All discharges from hospitals statewide. Strengths: Broad coverage. Limitations: Data are largely administrative in nature and may not be adequate for detailed research. Medical and patient information may not be accurate. 89
237 Division of HIV, STD and TB Services united States Bureau of the Census Population Data United States Census Bureau: o Bridged-race vintage estimates of resident population of July 1, 2005, U.S. Bureau of the Census, Population Division, released 8/16/2006, and o U.S. Census Bureau, American Community Survey. Overview: The Census Bureau collects and provides timely information about the people and the economy of the U.S. The decennial censuses provide data on demographic characteristics (e.g., age, race, Hispanic ethnicity, sex) of the population, family structure, educational attainment, income level, housing status, and the percentage of persons living at or below the poverty level. In addition, the Census Bureau provides intracensal population estimates for counties by age, race, ethnicity and gender for each year. Also, the Census Bureau conducts a number of population surveys such as the current Population Survey and the American Community Survey. Population: United States population. Strengths: A wide range of online statistical data on the United States population is available on the web in different formats (e.g., tables, maps). State and county-specific information is easily accessible, and links to other census websites are provided. Limitations: Only limited municipality data are available between censuses. The availability may improve when the American Community Survey is completely implemented. 90
238 Epidemiologic Profile for 2008 appendix B - Glossary Acquired Immunodeficiency Syndrome (AIDS): The current Centers for Disease Control and Prevention AIDS definition includes the following conditions: HIV positive, AND CD4 (T-cell) count below 200 OR presence of one or more opportunistic infections. Antiretroviral Drug: A drug used to combat the Human Immunodeficiency Virus (HIV). Core Surveillance: Activities conducted by the Epidemiologic Services unit within the Division of HIV/AIDS Services. Diagnosis: The art or act of identifying a disease from its signs and symptoms. Eligible Metropolitan Area: Geographic areas highly impacted by HIV/AIDS that are eligible to receive Title I CARE Act funds. Epidemic: The occurrence of more cases of a disease than would be expected in a community or region during a given time period. Epidemiology: The study of the populations in order to determine frequency and distribution of disease and measure risks. Exposure Category: In describing HIV/AIDS cases, same as transmission categories; how an individual may have been exposed to HIV, such as injection drug use, male-to-male sexual contact, and heterosexual sex. Heterosexual: Relating to or characterized by a tendency to direct sexual desire toward the opposite sex. HIV: Human Immunodeficiency Virus: a type of virus called a retrovirus. ICD-10: The International Classification of Disease. Tenth revision. Incidence: The number of new events (i.e., diagnosed cases) in a period of time. Incidence is often expressed as an annual measure (the number of new cases occurring during a year). Incidence rate is the number of newly diagnosed cases per standard population size, usually expressed as cases per 100,000 populations. 91
239 Division of HIV, STD and TB Services Morbidity: The relative incidence of disease. Mortality: The number of deaths in a given time or place: the proportion of deaths to the population. Poverty Level: A measure of household income set by the United States Census Bureau. Prevalence: The number of occurrences of a given disease or other condition existing in a given population at a designated time. The prevalence rate is the number of living (prevalent) cases per standard population size, usually expressed as cases per 100,000 populations. Proportion: The amount of things or events relative to the total number of things or events. Measures are usually presented as percentages. Proportions are useful when describing the composition of populations. Rate: The amount of things or events relative to a standard quantity. It is derived by dividing the number of cases for a given sub population (e.g., African American males), by the total population count for that group. A rate is useful for making comparisons between groups having different population sizes. Report Delay: The time internal between when an HIV diagnosis was made and reported to the New Jersey Department of Health and Senior Services (Division of HIV/AIDS Services). Ryan White CARE Act Federal legislation created to address the unmet health care and service needs of people living with HIV disease and their families. Seroprevalence: The number of persons in a defined population who test HIV positive based on HIV testing of blood specimens. (Seroprevalence is often presented either as a percent of the total specimens tested or as a rate per 100,000 persons tested.) Surveillance: An ongoing, systematic process of collecting, analyzing and using data on specific health conditions and diseases. Title I: The part of the CARE Act that provides emergency assistance to localities (EMAs) disproportionately affected by the HIV/AIDS epidemic. 92
240 Epidemiologic Profile for 2008 Title II Consortia: The part of the CARE Act that provides funds to states and territories for primary health care and support services that enhance access to care to persons living with HIV and their families. Trend: A measurable direction that can be determined for a condition being examined. Uninsured: A person or group of persons who do not have health insurance. 93
241 Division of HIV, STD and TB Services appendix C other Sources new Jersey Department of Health and Senior Services Division of HIV, STD and TB Services Home Page: Semi-Annual HIV/AIDS Report: County and Municipal Statistics: Fact Sheets: Centers for Disease Control and Prevention national Centers for HIV, STD and TB Prevention Division of HIV/aIDS Prevention: Division of Sexually Transmitted Diseases national Institute of allergies and Infectious Diseases national Institute on Drug abuse national Institute of Health office of aids Research kaiser Family Foundation new Jersey Department of education New Jersey Student Health Survey of High School Students at 94

242 Epidemiologic Profile for 2008
243
244 Statewide Coordinated Statement of Need APPENDIX IV 242 Rapid-Rapid Testing Algorithm
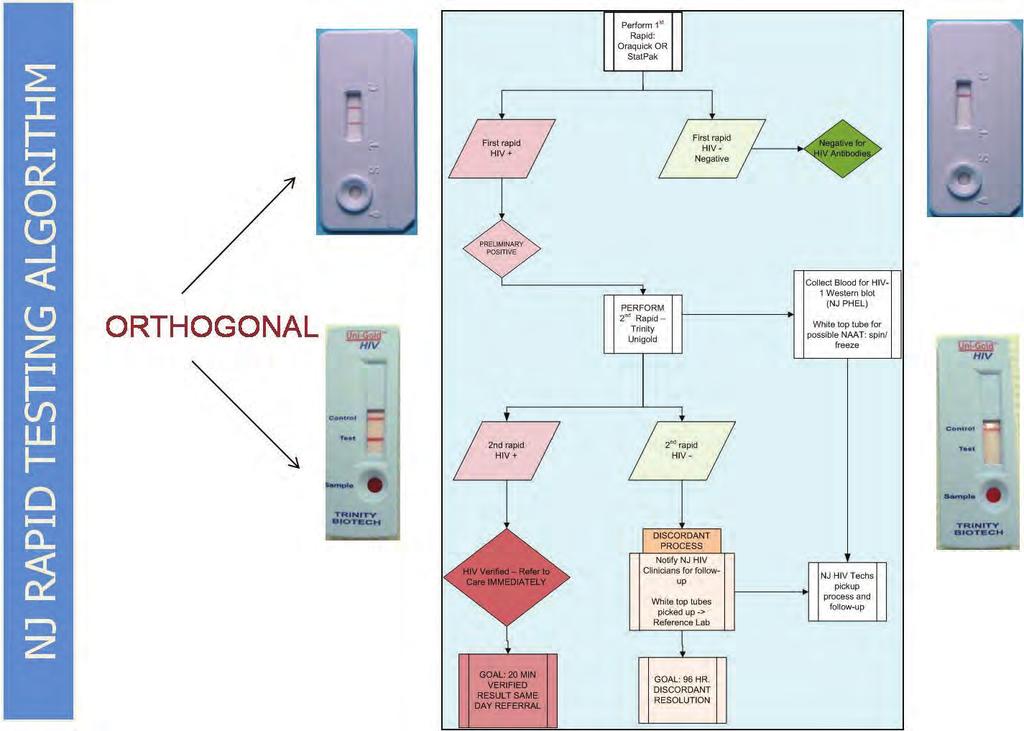
245
New Jersey HIV/AIDS Epidemiologic Overview, 2017 (Data based upon the HIV/AIDS Reporting System ehars, unless otherwise noted.)
") New Jersey HIV/AIDS Epidemiologic Overview, 2017 (Data based upon the HIV/AIDS Reporting System ehars, unless otherwise noted.) New Jersey Department of Health Division of HIV, STD, TB Services INTRODUCTION
New Jersey HIV/AIDS Epidemiologic Overview, 2017 (Data based upon the HIV/AIDS Reporting System ehars, unless otherwise noted.) New Jersey Department of Health Division of HIV, STD, TB Services INTRODUCTION
New Jersey HIV/AIDS Epidemiologic Profile 2011
 New Jersey HIV/AIDS Epidemiologic Profile 2011 HIV/AIDS in New Jersey New Jersey ranks 5th among 46 states with long-term namebased reporting in the rate of HIV (not AIDS) infection among adults and adolescents
New Jersey HIV/AIDS Epidemiologic Profile 2010
 New Jersey HIV/AIDS Epidemiologic Profile 00 Estimated HIV/AIDS Cases, Deaths and Persons Living with HIV/AIDS -- New Jersey, 989-008 In 008, the latest complete year of diagnosis data, there were 350
Estimated HIV/AIDS Newly Diagnosed Cases In New Jersey
 Introduction n As of 12/31/2009 there were more than 73,800 HIV/ AIDS cases in New Jersey including 1,353 pediatric HIV/AIDS cases. Over 4,000 children were also exposed to HIV. Over half of the cumulative
NEW JERSEY HIV/AIDS REPORT
 NEW JERSEY HIV/AIDS REPORT December 31, 2014 Chris Christie Governor Kim Guadagno Lt. Governor Public Health Services Branch Division of HIV, STD and TB Services preventing disease with care Mary E. O
NEW JERSEY HIV/AIDS REPORT
 NEW JERSEY HIV/AIDS REPORT December 31, 2009 Chris Christie Governor Kim Guadagno Lt. Governor Public Health Services Branch Division of HIV/AIDS Services preventing disease with care Poonam Alaigh, MD,
HIV Integrated Epidemiological Profile December 2011 State of Alabama
 HIV Integrated Epidemiological Profile December 2011 State of Alabama 12/31/2011 Alabama Department of Public Health Division of HIV/AIDS Prevention and Control TABLE OF CONTENTS List of Figures 3 List
Missouri Statewide Integrated HIV Prevention and Care Plan, including the Statewide Coordinated Statement of Need, CY
 Missouri Statewide Integrated HIV Prevention and Care Plan, including the Statewide Coordinated Statement of Need, CY 2017-2021 September 20, 2016 Developed through the collaborative efforts of the following
Missouri St. Louis TGA 2016 HIV Epidemiological Profile
 Missouri St. Louis TGA 2016 HIV Epidemiological Profile St. Louis TGA Part A Planning Council Prepared by the City of St. Louis Department of Health Center for Health Information, Research, and Planning
Women s Health at Risk. A report on the status of women s health in New Jersey
 Women s Health at Risk A report on the status of women s health in New Jersey May 2015 New Jersey Women s Reproductive Health Overview As more New Jersey residents gained access to insurance through the
State of Alabama HIV Surveillance 2014 Annual Report
 State of Alabama HIV Surveillance 2014 Annual Report Prepared by: Division of STD Prevention and Control HIV Surveillance Branch Contact Person: Richard P. Rogers, MS, MPH richard.rogers@adph.state.al.us
State of Alabama HIV Surveillance 2013 Annual Report Finalized
 State of Alabama HIV Surveillance 2013 Annual Report Finalized Prepared by: Division of STD Prevention and Control HIV Surveillance Branch Contact Person: Allison R. Smith, MPH Allison.Smith@adph.state.al.us
Bassett Medical Center PPS Community Profile
 Bassett Medical Center PPS Community Profile Counties served: Delaware, Herkimer, Madison, Otsego, and Schoharie DEMOGRAPHICS 1 The Bassett Medical Center PPS s total population is 278,214. Age: Residents
NEW JERSEY HIV/AIDS REPORT
 NEW JERSEY HIV/AIDS REPORT June 30, 2009 Jon S. Corzine Governor Public Health Services Branch Division of HIV/AIDS Services preventing disease with care Heather Howard Commissioner 2 Division of HIV/AIDS
Central New York Care Collaborative, Inc. PPS Community Profile
 Central New York Care Collaborative, Inc. PPS Community Profile Counties served: Cayuga, Lewis, Madison, Oneida, Onondaga, and Oswego DEMOGRAPHICS 1 The total population of the Central New York Care Collaborative
Millennium Collaborative Care PPS Community Profile
 Millennium Collaborative Care PPS Community Profile Counties served: Allegany, Cattaraugus, Chautauqua, Erie, Genesee, Niagara, Orleans, and Wyoming DEMOGRAPHICS 1 Millennium Collaborative Care (MCC) PPS
NEW JERSEY HIV/AIDS PLANNING GROUP. 2012: A Year in Review
 NEW JERSEY HIV/AIDS PLANNING GROUP 2012: A Year in Review NJHPG MEETINGS NJHPG MEETINGS AND COMMITTEES Eight Main NJHPG Meetings Nine Executive Committee Meetings Seven Governance Committee Meetings Nine
State of Alabama HIV Surveillance 2012 Annual Report Finalized
 State of Alabama HIV Surveillance 2012 Annual Report Finalized Prepared by: Division of HIV/AIDS Prevention and Control HIV Surveillance Branch Contact Person: Allison R. Smith, MPH Allison.Smith@adph.state.al.us
New Jersey Drug and Alcohol Abuse Treatment Substance Abuse Overview 2016 Statewide
 New Jersey Drug and Alcohol Abuse Treatment Substance Abuse Overview 2016 Statewide Department of Human Services Division of Mental Health and Addiction Services Office of Planning, Research, Evaluation
FULTON COUNTY GOVERNMENT RYAN WHITE PART A PROGRAM. Atlanta Eligible Metropolitan Area HIV/AIDS Unmet Need Estimate
 FULTON COUNTY GOVERNMENT RYAN WHITE PART A PROGRAM Atlanta Eligible Metropolitan Area HIV/AIDS Unmet Need Estimate Southeast AIDS Training and Education Center Department of Family and Preventative Medicine
Glossary of Terms. Commercial Sex Worker: Self-reported as having received money, drugs or favors in exchange for sex.
 ADAP: AIDS Drug Assistance Program funded through Part B. Congress earmarks funds that must be used for ADAP, an important distinction since other Part B spending decisions are made locally. AIDS: Acquired
Ryan White Part A Overview Kimberlin Dennis Melissa Rodrigo March 21, 2018
 Ryan White Part A Overview Kimberlin Dennis Melissa Rodrigo March 21, 2018 Part A Program = Partnership Regional HIV Planning Council Cuyahoga County Board of Health One Purpose Ryan White Legislation
Division of Mental Health and Addiction Services
 Division of Mental Health and Addiction Services A DAM BUCON, LSW DMHAS Mission DMHAS, in partnership with consumers, family members, providers and other stakeholders, promotes wellness and recovery for
Substance Abuse Services. AIDS Drug Assistance. Oral Health Care. Program (ADAP) Medical Care
 Medical Care") 2017-2018 Council for HIV/AIDS Care and Prevention Core Medical Service Area Paired Comparison Analysis Prioritization Worksheet Medical Case Management Services Substance Abuse Services - Outpatient AIDS
2017-2018 Council for HIV/AIDS Care and Prevention Core Medical Service Area Paired Comparison Analysis Prioritization Worksheet Medical Case Management Services Substance Abuse Services - Outpatient AIDS
Nassau Queens PPS Community Profile
 Nassau Queens PPS Community Profile Counties served: Nassau and Queens DEMOGRAPHICS 1 The total population of the two counties served by the Nassau Queens (Nassau University Medical Center) PPS is 3,631,203.
Hudson Valley Collaborative PPS Community Profile
 Hudson Valley Collaborative PPS Community Profile Counties served: Dutchess, Orange, Putnam, Rockland, Sullivan, Ulster, and Westchester DEMOGRAPHICS 1 The total population of the counties served by the
State of Alabama AIDS Drug Assistance Program (ADAP) Quarterly Report
 Quarterly Report") State of Alabama AIDS Drug Assistance Program (ADAP) Quarterly Report This report reflects active clients currently enrolled in ADAP Full-pay Prescription Program (ADAP-Rx), Alabama s Insurance Assistance
State of Alabama AIDS Drug Assistance Program (ADAP) Quarterly Report This report reflects active clients currently enrolled in ADAP Full-pay Prescription Program (ADAP-Rx), Alabama s Insurance Assistance
Implementation of testing (and other interventions along the Continuum of Care)
") Implementation of testing (and other interventions along the Continuum of Care) Jonathan Mermin, MD, MPH National Center for HIV/AIDS, Viral Hepatitis, STD, and TB Prevention U.S. Centers for Disease Control
Implementation of testing (and other interventions along the Continuum of Care) Jonathan Mermin, MD, MPH National Center for HIV/AIDS, Viral Hepatitis, STD, and TB Prevention U.S. Centers for Disease Control
HIV, STDs, and TB: An Overview of Testing Results (1997)
") HIV, STDs, and TB: An Overview of Testing Results (1997) prepared for Delaware Department of Health and Social Services Division of Public Health by Edward C. Ratledge and Anne M. Gurchik Center for Applied
HIV, STDs, and TB: An Overview of Testing Results (1997) prepared for Delaware Department of Health and Social Services Division of Public Health by Edward C. Ratledge and Anne M. Gurchik Center for Applied
Planning Council Meeting May 17, 2016 Yohannes Abaineh, MPH
 Ryan White Part A Program Services Client-Level Data Report FY2015 Planning Council Meeting May 17, 2016 Yohannes Abaineh, MPH Yohannes.abaineh@baltimorecity.gov Mission Improve the quality of life for
New Jersey Department of Human Services Division of Mental Health and Addiction Services Substance Abuse Treatment State Performance Report
 New Jersey Department of Human Services Substance Abuse Treatment January 1, 2016 - December 31, 2016 Prepared by: Office of Planning, Research, Evaluation and Prevention June 2017 : 1/1/2016-12/31/2016
New Jersey Department of Health Division of Mental Health and Addiction Services Substance Abuse Treatment State Performance Report
 New Jersey Department of Health Substance Abuse Treatment July 1, 2016 - June 30, 2017 Prepared by: Office of Planning, Research, Evaluation and Prevention October 2017 : 07/01/2016-06/30/2017 Primary
Westchester Medical Center PPS Community Profile
 Westchester Medical Center PPS Community Profile Counties served: Delaware, Dutchess, Orange, Putnam, Rockland, Sullivan, Ulster, Westchester DEMOGRAPHICS 1 The eight counties served by the Westchester
Palm Beach County Integrated Prevention and Patient Care Plan
 Palm Beach County Integrated Prevention and Patient Care Plan Introduction The Palm Beach County Coordinated Services Network (CSN) is a partnership of state and federal funding sources, planning authorities,
New Jersey HIV Prevention and Care Service Plan
 New Jersey HIV Prevention and Care Service Plan 2014 2016 New Jersey HIV Prevention and Care Services Plan, 2014 2016 New Jersey HIV Prevention and Care Services Plan, 2014 2016 Table of Contents Executive
CHILDHOOD LEAD POISONING IN NEW JERSEY
 CHILDHOOD LEAD POISONING IN NEW JERSEY ANNUAL REPORT FISCAL YEAR 2002 (July 1, 2001 June 30, 2002) New Jersey Department of Health and Senior Services Division of Family Health Services Maternal, Child,
2014 County of Marin Fact Sheet: HIV/AIDS in Marin County
 2014 County of Marin Fact Sheet: HIV/AIDS in Marin County HIV/AIDS epidemiology data is from the enhanced HIV/AIDS Reporting System (ehars) maintained by the Office of AIDS. The data presented here are
New Jersey Drug and Alcohol Abuse Treatment Substance Abuse Overview 2016 Essex County
 New Jersey Drug and Alcohol Abuse Treatment Substance Abuse Overview 2016 Essex County Department of Human Services Division of Mental Health and Addiction Services Office of Planning, Research, Evaluation
Advancing the National HIV/AIDS Strategy: Housing and the HCCI. Housing Summit Los Angeles, CA
 Advancing the National HIV/AIDS Strategy: Housing and the HCCI Housing Summit Los Angeles, CA October 21, 2014 The National HIV/AIDS Strategy Facets of the Strategy Limited number of action steps Sets
Data: Access, Sources, and Systems
 EXEMPLARY INTEGRATED HIV PREVENTION AND CARE PLAN SECTIONS Data: Access, Sources, and Systems REGION PLAN TYPE JURISDICTIONS HIV PREVALENCE Midwest Integrated state-only prevention and care plan State
Needs Assessment of People Living with HIV in the Boston EMA. Needs Resources and Allocations Committee March 10 th, 2016
 Needs Assessment of People Living with HIV in the Boston EMA Needs Resources and Allocations Committee March 10 th, 2016 Presentation Overview 1. What is a Needs Assessment? 2. The Numbers o Epidemiological
New Jersey Drug and Alcohol Abuse Treatment Substance Abuse Overview 2007 Essex County
 New Jersey Drug and Alcohol Abuse Treatment Substance Abuse Overview 2007 Essex County Prepared by: Department of Human Services Division of Addiction Services Information Systems Management Trenton, New
Substance Abuse Overview 2014 Essex County
 New Jersey Drug and Alcohol Abuse Treatment Substance Abuse Overview 2014 Essex County Prepared by Limei Zhu Department of Human Services Division of Mental Health and Addiction Services Office of Planning,
HIV, STDs, and TB: An Overview of Testing Results (1999)
") HIV, STDs, and TB: An Overview of Testing Results (1999) prepared for Delaware Department of Health and Social Services Division of Public Health by Edward C. Ratledge Center for Applied Demography & Survey
HIV, STDs, and TB: An Overview of Testing Results (1999) prepared for Delaware Department of Health and Social Services Division of Public Health by Edward C. Ratledge Center for Applied Demography & Survey
HRSA HIV/AIDS Bureau Updates
 HRSA HIV/AIDS Bureau Updates Minority AIDS Initiative (MAI): 15 Years Later What s Been Achieved? What Are the Ongoing Barriers to Success? October 2, 2014 Harold J. Phillips Deputy Director Division of
New Jersey Drug and Alcohol Abuse Treatment Substance Abuse Overview 2016 Hudson County
 New Jersey Drug and Alcohol Abuse Treatment Substance Abuse Overview 2016 Hudson County Department of Human Services Division of Mental Health and Addiction Services Office of Planning, Research, Evaluation
Epidemiologic Trends in HIV in Illinois. Prepared by Cheryl Ward for the 24 th Annual Illinois HIV/STD Conference
 Epidemiologic Trends in HIV in Illinois Prepared by Cheryl Ward for the 24 th Annual Illinois HIV/STD Conference October 28, 2015 Learning Objectives To describe epidemiologic trends in HIV/AIDS in Illinois
Asthma in New Jersey
 Asthma in New Jersey County Asthma Profiles Overview The New Jersey Department of Health has designed profiles of each New Jersey County presenting asthma prevalence and asthma-related emergency department
HIV/AIDS in the Houston EMA and HSDA
 The HIV/AIDS epidemic has affected people of all gender, age and racial/ethnic groups in the Houston EMA and HSDA. This effect, however, has not been the same for all groups. In the beginning of the epidemic,
Florida s HIV Testing Efforts
 Florida s HIV Testing Efforts Mara Michniewicz, MPH Prevention Program Manager Florida Department of Health (DOH) Bureau of Communicable Diseases HIV/AIDS Section Florida Comprehensive Planning Network
Areas 3/13 HIV/AIDS Prevention Needs Assessment
 Areas 3/13 HIV/AIDS Prevention Needs Assessment June 2010 Area 3/13 HIV/AIDS Prevention Needs Assessment WellFlorida Council Shane Bailey, MBA/HCM, CHES Project Coordinator Sandra Carroll Data and Technology
SCOPE OF HIV/AIDS IN MINNESOTA
 SCOPE OF HIV/AIDS IN MINNESOTA National Perspective Compared to the rest of the nation, Minnesota is considered to be a low- to-moderate HIV/AIDS incidence state. In 2013 (the most recent year for which
Assessing Needs, Gaps, and Barriers
 EXEMPLARY INTEGRATED HIV PREVENTION AND CARE PLAN SECTIONS Assessing Needs, Gaps, and Barriers Washington State Statewide Coordinated Statement of Need REGION PLAN TYPE JURISDICTIONS HIV PREVALENCE West
Hartford Transitional Grant Area (TGA) Quality Management Plan
 Quality Management Plan") Hartford Transitional Grant Area (TGA) Quality Management Plan 2015-2017 1 Table of Contents Overview.. 2 Mission Core Values Purpose Quality Improvement Directions. 3 National HIV/AIDS Strategies for
Hartford Transitional Grant Area (TGA) Quality Management Plan 2015-2017 1 Table of Contents Overview.. 2 Mission Core Values Purpose Quality Improvement Directions. 3 National HIV/AIDS Strategies for
Miami-Dade County Getting to Zero HIV/AIDS Task Force Implementation Report
 1 Miami-Dade County Getting to Zero HIV/AIDS Task Force Implementation Report Make HIV History! Know the Facts Get Tested Get Treated 2017-2018 7/9/2018 1 2 7/9/2018 2 3 Progress on the Getting to Zero
Substance Abuse Overview 2014 Cape May County
 New Jersey Drug and Alcohol Abuse Treatment Substance Abuse Overview 2014 Cape May County Prepared by Limei Zhu Department of Human Services Division of Mental Health and Addiction Services Office of Planning,
Substance Abuse Overview 2015 Passaic County
 New Jersey Drug and Alcohol Abuse Treatment Substance Abuse Overview 2015 Passaic County Prepared by Limei Zhu Department of Human Services Division of Mental Health and Addiction Services Office of Planning,
Epidemiology of HIV Among Women in Florida, Reported through 2014
 To protect, promote and improve the health of all people in Florida through integrated state, county, and community efforts. Created: 12/4/14 Revision: 1/27/15 Epidemiology of HIV Among Women in Florida,
New Jersey Drug and Alcohol Abuse Treatment Substance Abuse Overview 2016 Passaic County
 New Jersey Drug and Alcohol Abuse Treatment Substance Abuse Overview 2016 Passaic County Department of Human Services Division of Mental Health and Addiction Services Office of Planning, Research, Evaluation
Introduction. All of the County Health Rankings are based upon this model of population health improvement:
 2011 New Jersey Introduction Where we live matters to our health. The health of a community depends on many different factors, including quality of health care, individual behavior, education and jobs,
High Impact HIV Prevention Services and Best Practices
 High Impact HIV Prevention Services and Best Practices David W. Purcell, JD, PhD Deputy Director for Behavioral and Social Science Division of HIV/AIDS Prevention Centers for Disease Control and Prevention
NJ s Transitional Housing Initiative
 NJ s Transitional Housing Initiative SARA WALLACH, DOH DHSTS PROGRAM MANAGEMENT OFFICER ANNIE CHEN, ARFC CHIEF OPERATING OFFICER Definition of Homeless person According to the Department of Housing and
HIV/AIDS Bureau Update
 HIV/AIDS Bureau Update Ryan White HIV/AIDS Program Clinical Conference New Orleans, LA December 15, 2015 Laura Cheever, MD, ScM Associate Administrator Department of Health and Human Services Health Resources
Statewide Influenza Activity Levels. 0=No report/activity 1=Sporadic 2=Local 3= Regional 4=Widespread
 Communicable Disease Service Influenza Activity Summary Week Ending October 3, 7 (MMWR Week 4) Influenza activity level: NO ACTIVITY No Activity- At least of 3 parameters at or below state baseline AND
2016 Houston HIV Care Services Needs Assessment: Profile of the Recently Released
 2016 Houston HIV Care Services Needs Assessment: Profile of the Recently Released Page 1 PROFILE OF THE RECENTLY RELEASED The Texas Department of Criminal Justice (TDCJ) estimates that 386 people living
HIV/AIDS in Massachusetts
 HIV/AIDS in Massachusetts Challenges and Opportunities to Enhance the Public Health Response May 14, 2013 Fenway Community Health Center H. Dawn Fukuda, Director Office of HIV/AIDS Bureau of Infectious
New Jersey Drug and Alcohol Abuse Treatment Substance Abuse Overview 2016 Middlesex County
 New Jersey Drug and Alcohol Abuse Treatment Substance Abuse Overview 2016 Middlesex County Department of Human Services Division of Mental Health and Addiction Services Office of Planning, Research, Evaluation
CHILDHOOD LEAD POISONING IN NEW JERSEY
 CHILDHOOD LEAD POISONING IN NEW JERSEY ANNUAL REPORT FISCAL YEAR 2003 (July 1, 2002 June 30, 2003) New Jersey Department of Health and Senior Services Division of Family Health Services Maternal, Child,
NEW JERSEY STATEWIDE COMPREHENSIVE PLAN AS REQUIRED BY THE RYAN WHITE TREATMENT MODERNIZATION ACT
 NEW JERSEY PART B COMPREHENSIVE PLAN 2009-2014 NEW JERSEY STATEWIDE COMPREHENSIVE PLAN AS REQUIRED BY THE RYAN WHITE TREATMENT MODERNIZATION ACT SUBMITTED TO: Health Resources and Services Administration
HIV/AIDS IN NEW JERSEY
 HIV/AIDS IN NEW JERSEY While the federal government s investment in treatment and research is helping people with HIV/AIDS live longer and more productive lives, HIV continues to spread at a staggering
UnitedHealthcare Dual Complete ONE (HMO SNP) New Jersey
 New Jersey") UnitedHealthcare Dual Complete ONE (HMO SNP) New Jersey Agenda Overview Service Area Contracting Member ID Cards Sample Member ID Card Checking Member Enrollment Claim Submission Additional Benefits Additional
UnitedHealthcare Dual Complete ONE (HMO SNP) New Jersey Agenda Overview Service Area Contracting Member ID Cards Sample Member ID Card Checking Member Enrollment Claim Submission Additional Benefits Additional
New Jersey HIV Planning Group Main Meeting September 15, 2016
 New Jersey HIV Planning Group Main Meeting September 15, 2016 Commissioner Division of HIV, STD and TB Services RYAN WHITE MOVING FORWARD Shared Mission RFA Funding Decisions Based on meeting the goals
MMWR Analysis Provides New Details on HIV Incidence in U.S. Populations
 MMWR Analysis Provides New Details on HIV Incidence in U.S. Populations CDC HIV/AIDS Fa c t s S e p t e m b e r 2008 On August 6, 2008, the Centers for Disease Control and Prevention (CDC) released a new
2016 Houston HIV Care Services Needs Assessment: Profile of African American Men Who Have Sex with Men (MSM)
") 2016 Houston HIV Care Services Needs Assessment: Profile of African American Men Who Have Sex with Men (MSM) Page 1 PROFILE OF AFRICAN AMERICAN MSM A recent analysis of national HIV diagnosis rates revealed
2016 Houston HIV Care Services Needs Assessment: Profile of African American Men Who Have Sex with Men (MSM) Page 1 PROFILE OF AFRICAN AMERICAN MSM A recent analysis of national HIV diagnosis rates revealed
Minneapolis Department of Health and Family Support HIV Surveillance
 Rate per 1, persons 2 21 22 23 24 25 26 27 28 29 21 Rate per 1, persons Minneapolis Department of Health and Family Support HIV Surveillance Research Brief, September 212 Human immunodeficiency virus (HIV)
Unmet Oral Health Needs of Persons Living With HIV/AIDS in the United States
 Unmet Oral Health Needs of Persons Living With HIV/AIDS in the United States What Can We Do To Improve Services? Nicholas G. Mosca, DDS, DrPH CrescentCare Health/NO AIDS Task Force April 25, 2017 National
The Heterosexual HIV Epidemic in Chicago: Insights into the Social Determinants of HIV
 The Heterosexual HIV Epidemic in Chicago: Insights into the Social Determinants of HIV Nikhil Prachand, MPH Board of Health Meeting January 19, 2011 STI/HIV/AIDS Division Today s Presentation Epidemiology
Substance Abuse Overview 2014 Cumberland County
 New Jersey Drug and Alcohol Abuse Treatment Substance Abuse Overview 2014 Cumberland County Prepared by Limei Zhu Department of Human Services Division of Mental Health and Addiction Services Office of
SUPPORT FUNDING FOR DOMESTIC HIV/AIDS PREVENTION, TREATMENT, AND RESEARCH
 SUPPORT FUNDING FOR DOMESTIC HIV/AIDS PREVENTION, TREATMENT, AND RESEARCH This is a programmatic request. Dear Colleague: Amidst rising infection rates and shrinking state budgets, increased federal funding
New Jersey Substance Abuse Monitoring System (NJ-SAMS) Substance Abuse Treatment Admissions 1/1/ /31/2013 Resident of Union County
 Substance Abuse Treatment Admissions 1/1/ /31/2013 Resident of Union County") New Jersey Substance Abuse Monitoring System (NJ-SAMS) Substance Abuse Treatment Admissions 1/1/2013-12/31/2013 Resident of Union County Primary Drug Highest School Grade Completed Alcohol 1,024 30% Completed
New Jersey Substance Abuse Monitoring System (NJ-SAMS) Substance Abuse Treatment Admissions 1/1/2013-12/31/2013 Resident of Union County Primary Drug Highest School Grade Completed Alcohol 1,024 30% Completed
Metro St. Louis HIV Epidemiological Profile
 Metro St. Louis HIV Epidemiological Profile Saint Louis TGA Part A Planning Council Prepared by the City of St. Louis Department of Health s Center for Health Information, Research, and Planning Table
Estimates of New HIV Infections in the United States
 Estimates of New HIV Infections in the United States CDC HIV/AIDS FactS A u g u s t 28 Accurately tracking the HIV epidemic is essential to the nation s HIV prevention efforts. Yet monitoring trends in
HIV Prevention Action Coalition
 HIV Prevention Action Coalition National HIV/AIDS Strategy Agency Implementation Plan Suggestions 1.1 Allocate public funding to geographic areas consistent with the epidemic: HHS/, HRSA HHS/, SAMHSA,
FY Broward County Comprehensive HIV Health Services Plan
 FY 2012-2015 Broward County Comprehensive HIV Health Services Plan 2012-2015 Fort Lauderdale/Broward County EMA Table of Contents INTRODUCTION... 3 1. WHERE ARE WE NOW?... 8 A. DESCRIPTION OF THE LOCAL
New Jersey Drug and Alcohol Abuse Treatment Substance Abuse Overview 2016 Hunterdon County
 New Jersey Drug and Alcohol Abuse Treatment Substance Abuse Overview 2016 Hunterdon County Department of Human Services Division of Mental Health and Addiction Services Office of Planning, Research, Evaluation
Julia Hidalgo Positive Outcomes, Inc. & George Washington University William Green Broward County Department of Human Services Part A Office
 Assessing and Improving the Effectiveness of Outreach to HIV+ Individuals Not in Care: Translating Evaluation Results into Action in the Fort Lauderdale Eligible Metropolitan Area Julia Hidalgo Positive
Responding to HIV/AIDS in Illinois Remarks to the Adequate Health Care Task Force
 Responding to HIV/AIDS in Illinois Remarks to the Adequate Health Care Task Force AIDS Foundation of Chicago June 27, 2006 AIDS-Related Deaths Since 1981 United States: 530,000 Illinois: 18,000 Chicago:
New Jersey Drug and Alcohol Abuse Treatment Substance Abuse Overview 2016 Warren County
 New Jersey Drug and Alcohol Abuse Treatment Substance Abuse Overview 2016 Warren County Department of Human Services Division of Mental Health and Addiction Services Office of Planning, Research, Evaluation
Comprehensive HIV Health Services Plan
 PanWest-West Texas Ryan White Programs Comprehensive HIV Health Services Plan 2010-2013 Executive Summary EXECUTIVE SUMMARY This Comprehensive HIV Services Plan is the first joint plan between the PanWest
INTOXICATED DRIVING PROGRAM 2010 STATISTICAL SUMMARY REPORT
 INTOXICATED DRIVING PROGRAM 2010 STATISTICAL SUMMARY REPORT November 2011 Prepared by: Sherry Ranieri Dolan Office of Research, Planning, Evaluation, Information Systems and Technology and Intoxicated
Alabama Department of Public Health. Sexually Transmitted Diseases
 Alabama Department of Public Health Sexually Transmitted Diseases Annual Report 29 August 16, 21 Dear Alabama Stakeholder: The Division of Sexually Transmitted Disease Prevention and Control of the Alabama
INTOXICATED DRIVING PROGRAM 2009 STATISTICAL SUMMARY REPORT
 INTOXICATED DRIVING PROGRAM 2009 STATISTICAL SUMMARY REPORT April 2011 Prepared by: Sherry Ranieri Dolan Office of Research, Planning, Evaluation, Information Systems and Technology and Intoxicated Driving
Platte Valley Medical Center Page 0
 Platte Valley Medical Center Page 0 Table of Contents Introduction 4 Background and Purpose... 4 Service Area... 4 Map of the Service Area...5 Project Oversight...5 Consultants... 6 Identification of Community
2014 Butte County BUTTE COUNTY COMMUNITY HEALTH ASSESSMENT
 2014 Butte County BUTTE COUNTY COMMUNITY HEALTH ASSESSMENT EXECUTIVE SUMMARY 2015 2017 EXECUTIVE SUMMARY TOGETHER WE CAN! HEALTHY LIVING IN BUTTE COUNTY Hundreds of local agencies and community members
FY 17 EIIHA PLAN Early Identification of Individuals with HIV/AIDS
 1) EIIHA a) Plan for linking people to prevention and care services. Include community partners and other resources utilized and major collaborations. The EMA s EIIHA strategy focuses on five areas for
HIV EPIDEMIC UPDATE: FACTS & FIGURES 2012
 HIV EPIDEMIC UPDATE: FACTS & FIGURES 2012 Number of Cases Note: In this surveillance report, HIV cases include persons reported with HIV infection (non-aids), advanced HIV (non-aids) and AIDS within a
Table of Contents INTRODUCTION... 2 METHODOLOGY Appendix 1 Comparison of Peer Counties... 6
 Table of Contents INTRODUCTION... 2 METHODOLOGY... 4 Appendix 1 Comparison of... 6 Appendix 2 Key Findings from the MAPP Assessments... 7 BARRIERS TO HEALTHCARE ACCESS... 7 HEALTH STATUS... 9 DEATH INDICATORS...
New Jersey Drug and Alcohol Abuse Treatment Substance Abuse Overview 2008 Warren County
 New Jersey Drug and Alcohol Abuse Treatment Substance Abuse Overview 2008 Warren County Prepared by: Department of Human Services Division of Addiction Services Office of Research, Planning, Evaluation
Rhode Island Department of Health. Division of Infectious Disease and Epidemiology. Office of HIV/AIDS & Viral Hepatitis
 Rhode Island Department of Health Division of Infectious Disease and Epidemiology Office of HIV/AIDS & Viral Hepatitis November 2013 Table of Contents 1) Introduction.....3 2) Surveillance Methods...3
New Jersey Substance Abuse Monitoring System (NJ-SAMS) Substance Abuse Treatment Admissions 1/1/ /31/2013 Resident of Middlesex County
 Substance Abuse Treatment Admissions 1/1/ /31/2013 Resident of Middlesex County") New Jersey Substance Abuse Monitoring System (NJ-SAMS) Substance Abuse Treatment Admissions 1/1/2013-12/31/2013 Resident of Middlesex County Primary Drug Highest School Grade Completed Alcohol 1,571 32%
New Jersey Substance Abuse Monitoring System (NJ-SAMS) Substance Abuse Treatment Admissions 1/1/2013-12/31/2013 Resident of Middlesex County Primary Drug Highest School Grade Completed Alcohol 1,571 32%