Naive and memory CD8 T cell responses after antigen stimulation in vivo
|
|
|
- Basil Hardy
- 5 years ago
- Views:
Transcription

 thesis, University of Iowa, 2011. https://ir.uiowa.edu/etd/1246. Follow this and additional works at: https://ir.uiowa.edu/etd Part of the Pathology Commons")
1 University of Iowa Iowa Research Online Theses and Dissertations Summer 2011 Naive and memory CD8 T cell responses after antigen stimulation in vivo Matthew David Martin University of Iowa Copyright 2011 Matthew David Martin This thesis is available at Iowa Research Online: Recommended Citation Martin, Matthew David. "Naive and memory CD8 T cell responses after antigen stimulation in vivo." MS (Master of Science) thesis, University of Iowa, Follow this and additional works at: Part of the Pathology Commons
2 NAÏVE AND MEMORY CD8 T CELL RESPONSES AFTER ANTIGEN STIMULATION IN VIVO by Matthew David Martin A thesis submitted in partial fulfillment of the requirements for the Master of Science degree in Pathology in the Graduate College of The University of Iowa July 2011 Thesis Supervisor: Assistant Professor Vladimir P. Badovinac
3 Copyright by MATTHEW DAVID MARTIN 2011 All Rights Reserved
4 Graduate College The University of Iowa Iowa City, Iowa CERTIFICATE OF APPROVAL MASTER'S THESIS This is to certify that the Master's thesis of Matthew David Martin has been approved by the Examining Committee for the thesis requirement for the Master of Science degree in Pathology at the July 2011 graduation. Thesis Committee: Vladimir P. Badovinac, Thesis Supervisor John T. Harty Kevin L. Legge Hai-Hue-Xue
5 To my parents and sisters. Without your love and support through the years this would not have been possible. ii
6 ACKNOWLEDGMENTS While I am the only author listed on this thesis, there are many people who have helped in its success, and I would like to take the opportunity to thank them now. First, I d like to thank my mentor, Dr. Vladimir Badovinac for his guidance during this process and for helping me to become a better scientist. I m truly grateful for all that you do for me. To the members of my thesis committee: Dr. John Harty, Dr. Kevin Legge, and Dr. Hai-Hue-Xue for their valuable input and the time they devoted towards helping make this thesis a success. Dr. Thomas Waldschmidt for the opportunity to pursue a Master s Degree through the Department of Pathology and for the advice and support that he has offered. To the members of the Badovinac lab: Deepa Rai, Stephanie Condotta, and Shaniya Khan for their help, support, and friendship that they have offered. To Dr. John Harty and the members of the Harty lab for their advice, the reagents and cells they have let me borrow, and the scientific discussion that they have provided. To the members of the Department of Pathology, Pathology Learning Center, and Pathology Flow Cytometry Facility for everything that they do for the students in the Pathology program. iii
7 TABLE OF CONTENTS LIST OF FIGURES... vi CHAPTER I. INTRODUCTION...1 The CD8 T cell response to acute infection or vaccination...1 Memory CD8 T cells...3 Manipulating memory differentiation...5 Purpose of the study...7 II. POPULATION DYNAMICS OF NAÏVE AND MEMORY CD8 T CELL RESPONSES AFTER ANTIGEN ENCOUNTER IN VIVO...9 Introduction...9 Materials and Methods...11 Mice, bacteria, and virus infections...11 Dendritic cell immunizations...11 Adoptive transfer experiments and isolation of lymphocytes from tissues...12 Abs and peptides...12 Quantification of CD8 T cell responses and detection of BrdU uptake and activated Caspase- 3/7 in Ag-specific CD8 T cells...13 Statistical Analysis...13 Results...14 Naïve CD8 T cells undergo a higher magnitude of expansion than memory CD8 T cells after L. monocytogenes infection...14 Naïve CD8 T cells expand in numbers more than memory CD8 T cells after different infections or after non-infectious priming conditions...15 Systemic inflammation influences the expansion potential of primary memory CD8 T cells...16 Differences in trafficking after adoptive transfer do not explain the higher magnitude of expansion of naïve CD8 T cells...17 Differences in tissue localization at the peak of the response do not explain the differences in expansion potential of naïve and memory CD8 T cells...18 Sustained proliferation of primary effectors leads to the higher magnitude of expansion of naïve CD8 T cells...19 Increased death of secondary effectors does not lead to the higher magnitude of expansion of naïve CD8 T cells...19 Population dynamics of naïve and memory CD8 T cell responses after antigen stimulations in vivo...20 Primary memory CD8 T cells are found in greater numbers than secondary memory CD8 T cells in multiple organs at a late memory time point...21 The rate of homeostatic proliferation differs between primary and secondary memory CD8 T cells...21 Phenotypic characterization of early and late memory CD8 T cells...22 iv
8 Higher proliferation potential but indistinguishable kinetics of secondary CD8 T cell responses generated from late versus early primary memory CD8 T cells...23 Discussion...23 III. THE IMPACT OF PRE-EXISTING MEMORY ON DIFFERENTIATION OF NEWLY RECRUITED NAÏVE CD8 T CELLS...54 Introduction...54 Materials and Methods...55 Mice, bacteria, and virus infections...55 Adoptive-transfer experiments and isolation of lymphocytes from tissues...56 Abs and peptides...56 Quantification of CD8 T cell responses and intracellular cytokine staining...57 Statistical Analysis...57 Results...57 Primary memory CD8 T cells influence differentiation of naïve CD8 T cell responses of the same specificity after infection...57 Naïve TCR-Tg CD8 T cells transferred into recipients with endogenous memory CD8 T cells of the same specificity progress to a CD27 hi /CD62L hi phenotype faster...58 Naïve endogenous CD8 T cells primed in the presence of memory CD8 T cells of unrelated specificity show decreased levels of expansion but progress to a late memory phenotype faster...60 The functional consequences of naïve CD8 T cell priming in the presence of anti-vectorial immunity...61 Primary CD8 T cells primed in the presence of anti-vectorial immunity have a greater proliferative potential upon antigen reencounter...63 Discussion...63 IV. CONCLUSIONS AND FUTURE DIRECTIONS...80 Conclusions...80 Future Directions...82 REFERENCES...88 v
9 LIST OF FIGURES Figure 1. Naïve CD8 T cells undergo a higher magnitude of expansion than memory CD8 T cells after L. monocytogenes infection Naïve CD8 T cells expand in numbers more than memory CD8 T cells after different infections or after non-infectious priming conditions Systemic inflammation influences the expansion potential of primary memory CD8 T cells Differences in trafficking after adoptive transfer do not explain the higher magnitude of expansion of naïve CD8 T cells Differences in tissue localization at the peak of the response do not explain the differences in expansion potential of naïve and memory CD8 T cells Sustained proliferation of primary effectors leads to the higher magnitude of expansion of naïve CD8 T cells Increased death of secondary effectors does not lead to the higher magnitude of expansion of naïve CD8 T cells Population dynamics of naïve and memory CD8 T cell responses after antigen stimulations in vivo Detailed longitudinal kinetic analysis of primary and secondary CD8 T cell responses in vivo Primary memory CD8 T cells are found in greater numbers than secondary memory CD8 T cells in multiple organs at a late memory time point The rate of homeostatic proliferation differs between primary and secondary memory CD8 T cells Phenotypic characterization of early and late memory CD8 T cells Higher proliferation potential but indistinguishable kinetics of secondary CD8 T cell responses generated from late versus early memory CD8 T cells Population dynamics of primary and secondary CD8 T cell responses after infection or vaccination- a model Primary memory OT-I CD8 T cells influence the phenotype of naïve OT-I responses after infection Naïve TCR-Tg CD8 T cells transferred into recipients with endogenous polyclonal memory CD8 T cells of the same specificity progress to a CD27 hi /CD62L hi phenotype faster vi
10 17. Naïve endogenous CD8 T cells primed in the presence of endogenous memory CD8 T cells of unrelated specificity show decreased levels of expansion but progress to a late memory phenotype faster Anti-vectorial immunity decreases the magnitude of newly evoked primary CD8 T cell responses after infection Anti-vectorial immunity influences the tissue distribution of primary CD8 T cells Primary CD8 T cells primed in the presence of anti-vectorial immunity show different cytokine profiles after direct ex vivo stimulation with antigen Primary CD8 T cells primed in the presence of anti-vectorial immunity have a greater proliferative potential after booster challenge Population dynamics of primary and multiply stimulated CD8 T cell responses after infection or vaccination- a model vii
11 1 CHAPTER I INTRODUCTION The CD8 T cell response to acute infection or vaccination CD8 T cells are specialized cells of the adaptive immune system that are critical for defense against intracellular pathogens such as viruses, intracellular bacteria, and protozoan parasites. Because of the need to respond to vast microbial diversity, the number of naïve CD8 T cells recognizing a particular pathogen derived antigen (Ag) is quite small, with estimates ranging from tens to at most thousands of cells per host in the case of laboratory mice [1-3]. These numbers are too small to successfully eliminate rapidly dividing microbes. However, recognition of foreign Ag leads to clonal expansion of the Ag-specific CD8 T cell population and acquisition of effector functions which allows the host to fight off the invading microorganism. The CD8 T cell response to infection or vaccination has been divided into four phases: activation, expansion, contraction, and memory formation. Naïve CD8 T cells residing in the lymph nodes are activated when they recognize pathogen-derived peptides displayed on MHC class I molecules of dendritic cells (DCs) [4-7]. In addition to TCR recognition of foreign peptides (signal 1), complete activation of CD8 T cells requires costimulation through receptor interactions between the CD8 T cell and antigen-presenting cells (APCs) (signal 2) [4, 8]. The absence of these co-stimulatory signals results in anergy or deletion of the CD8 T cell [9]. Additionally, it has become apparent that inflammatory signals provided through cytokines (signal 3) have a major impact on the proliferation and differentiation of CD8 T cells [6, 8, 10]. The activation phase is followed by clonal expansion where Ag-specific cells differentiate into effector cells and increase substantially in numbers. Depending on the type and dose of infection, the Ag-specific population can undergo a 10,000-fold increase in numbers [4]. The overall magnitude of expansion and functional qualities of resulting
12 2 effector cells, including cytokine production, cytolytic capabilities, and the ability to undergo vigorous secondary expansion, is governed by many factors including the amount of antigen available, the strength of the TCR interaction with the peptide MHC-I complex, co-stimulatory signaling with the APC, and signals received through cytokine receptors [4-6, 8, 11-14]. Clonal expansion is associated with molecular changes which include down-regulation of the lymph node homing molecules CD62L and CCR7 [13, 15, 16]. In addition to these changes, effector CD8 T cells exit the local lymph node, enter into the bloodstream, and localize to peripheral tissues where they survey the body for infection. Other molecular changes lead to the Ag-driven production of cytokines including IFN-γ, TNF-α, and IL-2 that promote the immune response, as well as the production of cytotoxic molecules such as perforin and granzymeb which allow effector CD8 T cells to kill infected cells and/or APCs [5, 17, 18]. The increase in numbers and acquisition of effector functions by Ag-specific CD8 T cells are the two major mechanisms that CD8 T cells employ to fight a microbial challenge. The goal of the effector phase is to clear the body of infection, but whether or not this is achieved, clonal expansion is followed by contraction [4, 5, 17]. The onset of the contraction phase varies depending on the infection, but generally begins 7-12 days following infection or vaccination [17]. During this phase, the Ag-specific population undergoes massive death where 90-95% of the population is eliminated [4, 12, 18]. This large reduction in numbers is thought to be necessary for the preservation of immune system homeostasis and for the prevention of immunopathology [4, 19]. While contraction is substantial, it is incomplete, and the pool of Ag-specific CD8 T cells remaining after contraction constitutes the memory population. Memory cells possess unique functional properties compared to naïve CD8 T cells that confer the ability for increased protection after Ag re-encounter [4, 18, 20]. Because of this, much effort has been devoted to understanding memory CD8 T cells and the factors affecting their development. However, much remains to be learned, and the study of memory CD8
13 3 T cells has been my focus as a graduate student. Coming to a better understanding of what memory CD8 T cells are and what they are capable of is the focus of this thesis dissertation. Memory CD8 T cells The CD8 T cell memory pool is maintained at remarkably stable numbers through a process of self-renewal, and it is believed that this population can be maintained at least in laboratory mice, for the life of the host [5, 17, 21]. However, the memory population is characterized by marked heterogeneity, and the phenotypic and functional properties of the memory population change throughout the course of time after infection [4, 12, 19, 22, 23]. Because of this, attempts to identify memory CD8 T cells based on phenotypic markers has proven challenging. Regardless, several characteristics of memory CD8 T cells which differ from their naïve counterparts have been used to define memory cells including: Their persistence at higher numbers than the naïve repertoire Their ability to migrate to and be maintained in peripheral tissues Their rapid execution of effector functions including cytolysis and cytokine production Their capability of undergoing vigorous secondary expansion resulting in increased numbers of secondary memory cells [4, 18, 20] After contraction, antigen-specific memory CD8 T cells survive and are maintained at higher numbers than the naïve repertoire. The higher precursor frequency, as well as the ability of memory CD8 T cells to be maintained for long periods of time through basal proliferation [18, 19], are two features that distinguish memory CD8 T cells from their naïve counterparts. These two features are partially responsible for the increased protection offered by memory CD8 T cells.
14 4 In addition to their higher numerical representation, subsets of memory CD8 T cells are able to migrate to peripheral tissues. One classification of memory CD8 T cell subsets has specified memory cells as effector memory (Tem) and central memory (Tcm) based on the expression of CD62L and chemokine receptor 7 (CCR7). Memory CD8 T cells that express these molecules (Tcm) are able to traffic into lymph nodes from the blood through the high endothelial venules [16, 24, 25]. On the other hand, Tem cells are excluded from the lymph nodes and are more highly represented in peripheral tissues than Tcm cells [16, 24, 25]. These cells are thought to provide a first line of defense against invading microorganisms. Recent studies have indicated that populations of memory CD8 T cells may even be maintained long-term in tissues such as the skin, gut, and liver [16, 20, 26]. This peripheral localization has also been shown to become enhanced during periods of inflammation [16, 26], indicating that memory CD8 T cells may localize to sites of infection much faster than their naïve counterparts. These attributes allow memory CD8 T cells to provide enhanced surveillance at potential sites of pathogen entry compared to naïve CD8 T cells. CD8 T cells combat infection by implementing effector functions including cytokine production and cytolysis. In regards to effector functions, memory CD8 T cells are superior to their naïve counterparts as they are able to respond with cytokine production including IFN-γ and IL-2 faster than naïve cells which require a longer period of differentiation to carry out production of these cytokines [17, 18]. Additionally, the representation of cells producing multiple cytokines is higher in memory CD8 T cells than naïve CD8 T cells [27]. Unlike naïve CD8 T cells, memory cells are also capable of immediately killing target cells in a TCR dependant manner not requiring de novo protein synthesis [20, 28, 29], suggesting that pre-formed cytolytic molecules are retained in memory CD8 T cells. These differences from naive cells also contribute to the increased protection provided by memory CD8 T cells.
15 5 The other major mechanism that CD8 T cells use to combat infection is Ag-driven proliferation to amplify the number of cells performing effector functions, and both naïve and memory CD8 T cells are capable of vigorous expansion after Ag encounter. Because memory CD8 T cells are present at higher precursor frequencies than naïve cells, clonal expansion of memory cells yields greater numbers of effector cells than clonal expansion of naïve cells. However, the per cell proliferation potential of naïve and memory CD8 T cells has also been explored [18]. These experiments have provided different results depending on the model system and the nature of infection/immunization. Thus, it is unclear whether on a per cell basis naïve or memory CD8 T cells are capable of higher magnitudes of proliferation after Ag encounter. Additionally, these and other experiments have suggested that memory generation potential, defined as the relative ability to generate long-lived progeny, is higher for memory CD8 T cells than for naïve CD8 T cells. However, a prolonged contraction has been observed for secondary responses compared to primary responses [30-34], and it is also unclear if on a per cell basis a higher number of memory cells results from the primary or secondary response. These two questions are addressed in the experiments described in Chapter II of this thesis. Manipulating memory differentiation Protection during re-challenge depends on both the quantity and quality of CD8 T cell memory, and after normal infections or vaccinations, a significant amount of time is required for CD8 T cells to acquire memory characteristics (i.e. capacity for vigorous recall response to Ag) [17, 31, 35]. Shortening the length of time required to generate cells with memory characteristics would be beneficial in cases where rapid recall is essential and would be an important consideration for the design of vaccines designed to elicit protective CD8 T cell memory. Studies have shown that the time required for the generation of CD8 T cells with the characteristics of memory can be shortened by
16 6 reducing the level of inflammation during the priming or shortening the duration of infection [17, 36, 37]. These experiments show that manipulating the rate of CD8 T cell memory differentiation is possible. Consequently, discovering the mechanisms involved in memory differentiation, as well as discovering additional ways in which the time required for memory differentiation could be shortened, would provide a valuable contribution to the field of CD8 T cell biology. Studies employing peptide-dc immunizations have shown that inflammatory cytokines present during priming have a great impact on the rate of memory differentiation. Immunization with peptide-pulsed DCs results in the priming of CD8 T cells in a low inflammatory environment, and the magnitude of CD8 T cell expansion is reduced in comparison to the response to the same Ag delivered by L. monocytogenes infection. However, the time required for effector to memory transition is greatly decreased, with Ag-specific cells capable of vigorous secondary expansion appearing 4 days post peptide-dc immunization [17, 37, 38]. In comparison, memory capable of undergoing the most vigorous secondary proliferation after L. monocytogenes infection was not seen until 40 or more days after infection [17, 37]. However, administration of CpG oligodeoxynucleotide, an inducer of IL-12, IFN-γ, and Type I interferon [39] at the time of peptide-dc immunization resulted in a higher magnitude of expansion of Agspecific CD8 T cells but prevented the accelerated development of CD8 T cells with a memory phenotype and the ability to be boosted at an early time-point [17, 37]. Thus, inflammatory cytokines appear to affect both the magnitude of Ag-specific CD8 T cell responses as well as the effector to memory differentiation process. Additionally, it has been shown that shortening the duration of L. monocytogenes infection through antibiotic pre-treatment also decreases the amount of time needed to generate CD8 T cells with good memory characteristics. CD8 T cells in antibiotic pretreated mice developed functional and phenotypic traits of memory CD8 T cells within a week of L. monocytogenes infection and were capable of undergoing secondary
17 7 expansion at this time-point [17, 36, 40]. Levels of inflammatory cytokines were reduced in antibiotic pre-treated mice, and administration of CpG at the time of infection reversed the early acquisition of memory characteristics [17, 36, 40]. Thus, the duration of infection also affects naïve to memory differentiation. Responses involving CD8 T cell memory shorten the duration of infection and are likely to result in reduced levels of inflammatory cytokines [5, 17]. Because of this, it is possible that naïve cells responding to Ag while a memory response is occurring may have an altered memory progression. However, how a concurrent memory response affects the differentiation of naïve to memory cells is unknown. This is an important consideration, as this situation exists during immunizations where the host has immunity to the vaccination vector. How pre-existing memory affects naïve to memory cell differentiation is examined in the experiments described in the third chapter of this thesis. Purpose of the study Memory CD8 T cells are capable of providing increased protection from reinfection with the same or related intracellular pathogens. Thus, understanding the properties of memory CD8 T cells that differentiate them from naïve CD8 T cells as well as understanding how they function in different environmental conditions are important goals if CD8 T cell based vaccinations are to be successful. Consequently, studies over the last several decades have been directed towards understanding the characteristics of CD8 T cell memory as well as the factors that influence the development of memory of good quality after infection or vaccination. This work to date has led to the assumption that memory CD8 T cells are qualitatively and quantitatively better than their naïve counterparts because of their increased representation in numbers, ability to localize to peripheral tissues, potential to survive for greater lengths of time, and capacity to more rapidly perform effector functions [18]. However, how other attributes of memory CD8
18 8 T cells, such as their potential to proliferate and their memory generation potential, compare to naïve CD8 T cells are currently unclear or unknown. Additionally, many factors present during priming including Ag persistence and inflammation during infection or vaccination have been shown to influence both the magnitude of the CD8 T cell response as well as the quality of resulting memory CD8 T cells [17, 20]. One particular concern for vaccine design is a concurrent memory response due to anti-vectorial immunity, which has been documented to limit the expansion of newly evoked naïve CD8 T cell responses [41-43]. However, how antivectorial immunity impacts memory differentiation of newly recruited CD8 T cells is unknown. This is an important question because the quality of memory, as well as the quantity of memory generated, are important defining parameters of memory CD8 T cell responses that can influence the resulting degree of protection [44]. Thus, the main purpose of this project is to further describe the characteristics of memory CD8 T cells as well as analyze how conditions present at the time of priming influence the primary CD8 T cell response and memory differentiation. The main focuses of this thesis project are: 1. To determine differences in the proliferation capacity of primary memory compared to naïve CD8 T cells. 2. To determine if memory generation potential (the relative ability to generate long-lived progeny) differs between naïve and primary memory CD8 T cells. 3. To analyze the impact of pre-existing memory on the differentiation of newly recruited naïve CD8 T cells.
19 9 CHAPTER II POPULATION DYNAMICS OF NAÏVE AND MEMORY CD8 T CELL RESPONSES AFTER ANTIGEN ENCOUNTER IN VIVO Introduction Memory CD8 T cells are the surviving progeny of relatively rare naive CD8 T cells that have been programmed to clonally expand upon antigen (Ag) recognition on professional antigen-presenting cells (APCs) [4, 5, 11-14]. Only a small fraction (5-10%) of the responding cells present at the peak of the expansion phase survive to become memory [30, 45-47]. A number of studies have suggested that the protective capacity of primary memory CD8 T cells is dependent on their absolute number and phenotype [4], suggesting that controlling the quality and/or quantity of the developing memory CD8 T cell pool should represent an important goal in CD8 T cell vaccine development. Substantial progress has been made towards understanding the features that define primary memory CD8 T cells. In general, attributes of memory CD8 T cells such as increased representation (increase in numbers over the naïve CD8 T cell repertoire), changes in distribution (enhanced surveillance at potential sites of pathogen entry), longevity (long-term survival), and function (rapid killing and cytokine producing abilities) have led to the assumption that memory CD8 T cells are qualitatively and quantitatively better than their naïve counterparts [11, 13, 17, 48]. All of those attributes that define memory CD8 T cells are indeed important factors that contribute to the increased CD8 T cell-mediated resistance to infection in immune hosts. However, the extent to which one memory CD8 T cell differs from one naïve CD8 T cell of the same specificity remains an open and important question. For instance, both naïve and memory CD8 T cells are capable of exponential proliferation following Ag-stimulation. Because memory CD8 T cells are present in higher numbers than naïve cells they give rise to a higher number of secondary effectors
20 10 compared to the number of primary effectors generated from the naïve CD8 T cell pool after Ag (re)-encounter. The ability of prime-boost protocols to increase memory CD8 T cell numbers is well documented [35, 37, 49]. However, experiments that were designed to examine the proliferative potential of naïve and memory CD8 T cells while controlling for the numbers of precursor cells have yielded conflicting results [18]. Despite that, it has been suggested that the expansion capacity of memory CD8 T cells is the same or better compared to naïve cells following Ag-stimulation [18]. The experiments that support this conclusion might have been biased towards memory CD8 T cells since a relatively large number of naïve TCR-Tg CD8 T cells were used [50]. In addition, primary and repeatedly stimulated (ex. secondary, tertiary, quaternary) memory CD8 T cells differ substantially in their molecular signatures as well as in their functional attributes including the ability to respond to new Ag-stimulation [31, 32]. Since a loss of expansion capacity is correlated with the number of Ag-encounters, the conclusion that primary memory CD8 T cells (on a per cell basis) are capable of equal or greater Agdriven proliferation compared to naïve CD8 T cells needs to be re-examined. Additionally, experiments examining the kinetics of primary and secondary CD8 T cell responses have noted a prolonged contraction of secondary compared to primary effector CD8 T cells, suggesting differential susceptibility to apoptosis between naïve and primary memory CD8 T cells after infection [30-34]. However, the assumption that due to delayed contraction memory generation potential (here defined as the relative ability to generate long-lived progeny) is greater for primary memory compared to naïve CD8 T cells has yet to be examined. In order to address intrinsic (cell autonomous) differences between naïve and memory CD8 T cells that are not the result of environmental factors, an experimental model was adopted in which both cell types were analyzed in the same environment. Two questions were addressed in this chapter: 1) does previous Ag-exposure change the Ag-driven proliferation capacity of primary memory compared to naïve CD8 T cells; and
21 11 2) does memory generation potential in vivo differ between naïve and primary memory CD8 T cells after infection. The data obtained provide new insights into primary memory CD8 T cell function and will help further define the functional properties of primary memory CD8 T cells. Materials and Methods Mice, bacteria, and virus infections C57Bl/6 (B6, Thy1.2/1.2) mice were obtained from the U.S. National Cancer institute. OT-I TCR-transgenic mice (Thy1.1/1.2 and Thy1.1/1.1) were previously described [32, 51]. Pathogen-infected mice were housed in the appropriate biosafety conditions. All mice were used at 6-10 weeks of age. All animal protocols followed approved Institutional Animal Care and Use Committee (IACUC) protocols. The virulent Listeria monocytogenes strain expressing Ova257 (Vir LM-OVA) and the attenuated acta-deficient LM strain expressing Ova257 (Att LM-OVA) were grown, injected intravenously, and quantified as described [32, 52, 53]. Vaccinia virus expressing the OVA257 peptide (VacV-OVA) has been described previously [54]. Dendritic cell immunizations Splenic DC were isolated after subcutaneous injection of B6 mice with 5x10 6 B16 cells expressing Flt3L as previously described [55]. When tumors were palpable (5 mm x 5 mm), mice were injected with 2 mg LPS (Sigma-Aldrich) intravenously to mature the DC. Spleens were harvested 16 hrs later and were digested with DNase and Collagenase for 20 min at 37 o C/ 7% CO 2 with shaking. Spleen pieces were smashed through a nylon cell strainer (70 mm) to generate a single cell suspension, RBC were lysed, and splenocytes were re-suspended in 2 parts of 10% FCS RPMI 1640 to one part B16-Flt3L conditioned medium plus recombinant GM-CSF (1000 m/ml) plus 2 mm Ova and incubated 2 hrs at 37 o C/ 5% CO 2. Spleen cells were washed three times and CD11c + cells were isolated using anti-cd11c microbeads (Miltenyi Biotec). The purity and
22 12 activation status of DC were determined by staining for CD11c, CD86, and MHC class II. Routinely, >90% pure CD11c + DC were obtained. DCs were re-suspended in saline and injected intraperitoneally. Adoptive transfer experiments and isolation of lymphocytes from tissues To generate primary memory OT-I CD8 T cells for adoptive transfer experiments, 1x10 3 naïve Thy1.1/1.2 or Thy1.1/1.1 OT-I cells were transferred into Thy1.2 recipients one day before VacV-OVA (3x10 6 PFU per mouse; i.p.) infection. For co-transfer of naive and memory OT-I cells, naïve OT-I T cells were obtained from peripheral blood TCR-Tg OT-I mice and mixed at the indicated ratios with memory OT-I cells obtained from the spleens of VacV-Ova immunized mice at various time points after infection. The ratio of naïve to memory OT-I cells in the master mix used for adoptive transfer was verified by flow cytometry before transfer. For isolation of lymphocytes from secondary lymphoid organs and tertiary tissues, samples of blood were obtained by retro-orbital puncture before tissue removal. Anesthetized mice were then perfused through the left ventricle with cold PBS for 1-2 minutes and tissues were collected. Single cell suspension from liver, lung, spleen, lymph nodes, and bone marrow were washed with PBS before staining [56]. Abs and peptides The following mabs from ebioscience with the indicated specificity and with appropriate combinations in fluorochromes were used: CD8 (clone ), Thy1.1 (OX- 7 or HIS51), Thy1.2 (53-2.1), CD127 (A7R34), CD62L (MEL-14), CD27 (LG.7F9), CD122 (5H4), anti-brdu (PRB-1) and appropriate isotype controls.
23 13 Quantification of CD8 T cell responses and detection of BrdU uptake and activated Caspase- 3/7 in Ag-specific CD8 T cells OT-I cell responses in peripheral blood and tissues were monitored by FACS analysis for Thy1.1 positive CD8 T cells. Thy1.2 expression was used to discriminate between primary and secondary responses in the same host. To determine the rate of proliferation of Ag-specific T cells during the expansion phase, mice were intraperitoneally injected with 2 mg BrdU on days 4, 5, or 6 after Att LM-OVA infection and given 0.8 mg/ml BrdU in drinking water for an additional 24h. Peripheral blood was collected and splenocytes were isolated and surface-stained for CD8α and Thy1.1, followed by fixation and permeabilization procedures as recommended in the BrdU Flow Kit (BD Biosciences). Anti-BrdU mab was used for intracellular staining to detect BrdU uptake. To determine the proliferation rate of Agspecific CD8 T cells during the memory maintenance phase, mice were intraperitoneally injected with 2 mg BrdU and given 0.8 mg/ml BrdU in drinking water for an additional 8 days. BrdU uptake was determined as described above. For detection of activated caspase-3 and -7 in Ag-specific CD8 T cells, splenocytes were first surface-stained for CD8, Thy1.1, and Thy1.2. Samples were then incubated with the fluorescent inhibitor of caspases (FLICA) reagent, which binds to activated caspases, at 37 o C and 5% CO 2 for 60 min as recommended in the Vybrant FAM caspase-3 and -7 assay kit (Invitrogen, Carlsbad, CA). Statistical Analysis Statistical significance was assessed using the two-tailed t-test with a confidence interval of >95%. * indicates a p value between 0.01 and 0.05, and ** indicates a p value less than Data are presented as mean (+/- SEM) unless otherwise stated in the figures.
24 14 Results Naïve CD8 T cells undergo a higher magnitude of expansion than memory CD8 T cells after L. monocytogenes infection Naive and primary memory CD8 T cells are characterized by their ability to undergo vigorous expansion in numbers upon antigen-encounter. However, whether memory CD8 T cells have an enhanced proliferation capacity compared to naïve cells is still an unresolved question (reviewed in [18]). The prevailing assumption is that memory CD8 T cells due to their increased frequencies, tissue distribution, and function are both qualitatively and quantitatively superior to their naïve counterparts. In experiments where the magnitude of expansion of primary and secondary CD8 T cell responses was compared it has been shown that memory CD8 T cells have an equal or increased ability to proliferate and accumulate in vivo [27, 34, 57, 58]. Since multiple factors can influence the expansion of naïve and/or primary memory CD8 T cells (ex. precursor frequencies, type of Ag-stimulation, duration of infection and inflammation, phenotype of responding CD8 T cells) we developed an experimental model to address the proliferative potential of both naïve and memory CD8 T cell populations (Figure 1A). The model includes: a) the adoptive transfer of low and physiologically relevant numbers of naïve CD8 T cells (primary expansion is influenced by the number of naïve precursors present at the time of Ag-stimulation [50]); and b) co-transfer of primary memory CD8 T cells into the same recipients to control for differences in the in vivo environment (ex. duration of infection and inflammation). We adoptively co-transferred 1x10 3 naïve TCR-Tg OT-I CD8 T cells (Thy1.1/1.1) with the same number of primary memory OT-I cells (Thy1.1/1.2) and subsequently infected recipient mice (naïve B6 mice; Thy1.2/1.2) with a sub-lethal dose (0.1LD 50 ) of an attenuated (Act A - deficient) recombinant Listeria monocytogenes expressing the Ova257 epitope (Att LM-Ova [32, 52, 53]) (Figure 1A - experimental design). Recall
25 15 potential of memory CD8 T cell populations changes by time [25], and to ensure that memory CD8 T cells used in the experiments were capable of vigorous secondary expansion, we obtained primary memory OT-I cells from donor mice that had been infected more that 200 days before. To determine the magnitude of expansion of the primary and secondary CD8 T cell responses we analyzed the percentage of primary or secondary effector OT-I cells in the blood from days 5 to 7 (Figure 1B,C). Unlike previous models that utilized the adoptive transfer of high numbers of naïve transgenic CD8 T cells [18], the data presented here suggests that the proliferation capacity of naïve CD8 T cells is greater than the capacity of memory CD8 T cells after bacterial challenge (Figure 1C). Importantly, a higher ratio of primary to secondary effectors was seen in each individual mouse examined at days 6 and 7 after infection (Figure 1D). Therefore, these results suggest that the proliferation capacity of naïve CD8 T cells is higher than memory CD8 T cells when analyzed on a per cell basis in the same host after bacterial infection. Naïve CD8 T cells expand in numbers more than memory CD8 T cells after different infections or after non-infectious priming conditions The magnitude of naïve CD8 T cell responses varies depending on factors such as the type, route, and dose of infection as well as inflammation present during the infection [4, 6, 48]. In addition, it has been recently suggested that inflammation also controls secondary CD8 T cell responses but that naïve and memory CD8 T cells might differ in their susceptibility to inflammatory cues in the environment [56]. Therefore, it was important to examine if the initial findings seen after Att LM-OVA infection could be extended to additional types and doses of bacterial and viral infections as well as noninfectious priming conditions (Figure 2A). Equal numbers of naïve and memory OT-I cells (d225 p.i.) were co-transferred into naïve B6 recipients followed by immunization
26 16 with Att LM-OVA (5x10 6 or 100-fold less, 5x10 4 CFU per mouse), a virulent strain of LM-OVA (5x10 4 CFU), Vaccinia virus expressing OVA (VacV-Ova), or dendritic cells coated with OVA peptide (DC-Ova) (Figure 2A - experimental design). The starting ratio of naïve to memory OT-I cells in the master mix used for injection was confirmed before adoptive transfer (Figure 2B) and that ratio was later used to determine how Agdriven proliferation changes the numbers of primary and secondary CD8 T cell responses in vivo. Importantly, when analyzed on a per cell basis, the overall magnitude of expansion of naïve CD8 T cells was greater than primary memory CD8 T cells in all groups of mice analyzed (Figure 2C,D). However, the differences in the magnitude of expansion between primary and secondary CD8 T cells was not equal under each of the priming conditions examined suggesting that naïve and memory CD8 T cells differ in their ability to respond to various types of Ag-stimulations. The magnitude of expansion of the primary and secondary CD8 T cell responses were the most similar after infection with a virulent strain of LM, while differences between primary and secondary CD8 T cell responses were more pronounced after priming in an environment where inflammation was substantially reduced (DC-Ova group; Figure 2C,D [6, 37]). Systemic inflammation influences the expansion potential of primary memory CD8 T cells In order to test if sensitivity to inflammation differs between naïve and primary memory CD8 T cells, the experiment in which naïve and primary memory CD8 T cells were co-transferred in equal and low numbers prior to DC-OVA infection were repeated. To induce inflammation, one group of mice was co-infected with Ova non-expressing LM (Figure 3A experimental design). As shown above, naïve CD8 T cells detected in PBL expanded more than memory CD8 T cells after DC immunization. Importantly, in the presence of LM-induced inflammation, a lower ratio of primary to secondary effector
27 17 cells was observed compared to priming with DC-OVA alone (Figure 3B). In addition to what was observed in PBL, the ratio of primary to secondary OT-I cells was decreased after the addition of inflammation in secondary lymphoid organs and in peripheral tissues of mice as well, indicating that the observations made in the blood are consistent throughout the host (Figure 3C). Taken together, these data suggest that under various infections and priming conditions the magnitude of expansion of the primary response is greater than the magnitude of expansion of the secondary CD8 T cell response and indicate that when analyzed on a per cell basis, naïve CD8 T cells posses a higher proliferative potential than memory CD8 T cells. In addition, these results also suggest that sensitivity to inflammation of naïve and memory CD8 T cells is likely different. Differences in trafficking after adoptive transfer do not explain the higher magnitude of expansion of naïve CD8 T cells The results thus far have indicated that the magnitude of expansion of the primary response is greater than the secondary CD8 T cell response when analyzed on a per cell basis under various priming conditions. A possible explanation for this is that naïve and primary memory CD8 T cells could traffic to different areas after adoptive transfer, which might influence their priming. In order to test that idea, equal numbers of naive and primary memory OT-I cells (3x10 5 each) were co-transferred and the ratio of naïve to primary memory OT-I cells in various organs 24 hours after adoptive transfer was determined (Figure4A - experimental design). As in the experiments before, the memory OT-I cells were obtained from donor mice more than 200 days post primary infection, and phenotypic analysis showed that the majority of them were CD127, CD62L, CD27, and CD122 positive (Figure 4B), which is characteristic of late or central memory CD8 T cells (latem or Tcm, respectively) [5, 17]. Thus, these cells should be capable of
28 18 vigorous secondary expansion and trafficking to secondary lymphoid organs where priming occurs [11, 25]. Figure 4C shows the ratio of naïve and primary memory OT-I cells used in the adoptive transfer mix. Examining the ratios of naïve to primary memory OT-I cells in various tissues after adoptive transfer revealed higher numbers of primary memory cells in all organs examined except for the inguinal lymph nodes (Figure 4D). However, higher numbers of memory cells were detected in the spleen compared to naïve cells (Figure 4E), a major organ where priming occurs after LM infection [59]. Thus, these data suggest that the differences in proliferation capacity between naïve and memory CD8 T cells are likely not explained by their differences in trafficking. Differences in tissue localization at the peak of the response do not explain the differences in expansion potential of naïve and memory CD8 T cells It is also possible that primary effectors are over-represented in circulation and that overall ratios between primary and secondary effectors differ in various organs of the mice. In order to address this question, equal numbers (1x10 3 each) of naïve and primary memory OT-I were co-transferred into naïve mice prior to Att LM-OVA infection (Figure 5A). Consistent with the previous experiments, a higher number of primary effectors in PBL at day 7 post-infection was found (Figure 5A,B). Importantly, in each organ examined primary effectors were found in higher numbers than secondary CD8 T cells (Figure 5A,B). Interestingly, even after the transfer of 20-fold lower numbers of both naïve and memory CD8 T cells (50 cells transferred) proliferation potential of naïve surpasses that of primary memory CD8 T cells (Figure 5A,B). Taken together, these results suggest that primary effectors are not over-represented in circulation and that naïve CD8 T cells posses a higher proliferative potential than memory CD8 T cells when analyzed on a per cell basis and in multiple organs of the mice.
29 19 Sustained proliferation of primary effectors leads to the higher magnitude of expansion of naïve CD8 T cells The differences in the proliferative expansion abilities of naïve and primary memory CD8 T cells after Ag-stimulation could be explained by increased proliferation of naïve CD8 T cells and/or decreased survival of secondary effector CD8 T cells. In order to test these possibilities, separate groups of naïve B6 mice received naïve or primary memory OT-I CD8 T cells before Att LM-Ova infection (Figure 6). As described before, differences in kinetics of CD8 T cell expansion were observed for primary and secondary CD8 T cell responses (Figure 6A). Importantly, even after transfer into separate mice, a statistically significant increase in numbers (from day 6 to 7 p. i.) was observed only in PBL of mice that contained primary CD8 T cells (Figure 6A). Examining the kinetics of BrdU incorporation revealed that nearly all primary and secondary effector OT-I cells incorporated BrdU from days 4-5. However, from days 6-7 in the PBL and days 5-6 and 6-7 in the spleen, a significantly higher percentage of primary effector OT-I cells incorporated BrdU than secondary effector OT-I cells (Figure 6B,C). Thus, these data suggest that primary effector CD8 T cells show sustained and prolonged proliferation compared to secondary CD8 T cells. Increased death of secondary effectors does not lead to the higher magnitude of expansion of naïve CD8 T cells In addition to the BrdU proliferation assay, caspase 3/7 staining (as an indication of cell death) was performed on primary and secondary OT-I cells found in the spleens at day 6 and 7 after Att LM-OVA infection. Staining with the FLICA reagent showed that similar percentages of primary and secondary CD8 T cells were positive for caspase 3/7 at days 6 and 7 p.i. (Figure 7A,B), suggesting that the rate of death for both primary and secondary CD8 T cell responses was similar. Therefore, these results
30 20 indicate that the differences in proliferation but not the rate of cell death can explain the observed differences in naïve and memory CD8 T cell expansion after infection. Population dynamics of naïve and memory CD8 T cell responses after antigen stimulations in vivo Previously, it has been shown that in contrast to the vigorous and relatively short contraction (death) phase of primary CD8 T cell responses, secondary CD8 T cells die at a substantially protracted rate [30-34]. Importantly, it is not known if and when contraction of secondary CD8 T cells is resolved and how the prolonged contraction influences the numbers of secondary memory CD8 T cells. In other words, is the potential for memory CD8 T cell generation different for naïve and primary memory CD8 T cells? In order to address this, similar experiments to those described above were performed (Figure 8A). In addition to co-transfer of equal and low numbers (1x10 3 ) of naïve and primary memory CD8 T cells, additional groups of recipient naïve B6 mice were included in which increased numbers of memory CD8 T cells were transferred (naïve to memory CD8 T cell ratios: 1:1, 1:10 and 1:100) before infection with Att LM- Ova (Figure 8A experimental design). The detailed longitudinal kinetic analysis of primary and secondary CD8 T cell responses (either as frequencies of OT-I cells in the PBL or as a ratio between primary and secondary OT-I cells in individual mice) was presented in Figure 9A and B. When the ratio of the primary to secondary CD8 T cell responses was plotted at various time points after infection an interesting pattern that details the dynamics of primary and secondary CD8 T cell populations in vivo was uncovered (Figure 8B). As shown above, during the expansion phase (d6-7) primary OT-I cells were present in higher numbers than secondary OT-I cells. During the contraction phase (d8-100), secondary OT-I cells were present in higher numbers than primary OT-I cells, indicating that the contraction of secondary CD8 T cell responses was prolonged. However, due to
31 21 the extent of secondary CD8 T cell contraction, primary memory CD8 T cells were more prevalent than secondary memory OT-I when analyzed late after infection (d150+) (Figure 8B). Importantly, the described changes in population dynamics of primary and secondary CD8 T cell responses was not influenced by the number of memory CD8 T cells present at the time of infection (Figure 8B). Primary memory CD8 T cells are found in greater numbers than secondary memory CD8 T cells in multiple organs at a late memory time point The changes in dynamics of primary and secondary CD8 T cell responses after infection could be a consequence of examining the representation of primary and secondary memory populations in PBL and may not be representative of other tissues in the host. To address that issue, the percentages of primary and secondary memory CD8 T cells were determined in secondary lymphoid organs and tertiary tissues at a memory time point. The data clearly showed that in all organs examined at day 227 post infection a higher percentage of primary memory OT-I cells was detected compared to secondary memory OT-I cells (Figure 10A,B). The rate of homeostatic proliferation differs between primary and secondary memory CD8 T cells It has been shown that memory CD8 T cell populations are maintained by a process of slow homeostatic turnover, and it has been shown that primary memory CD8 T cells undergo higher rates of homeostatic proliferation than secondary memory CD8 T cells [32, 60]. In order to determine if differences in homeostatic proliferation might explain the shift in primary and secondary memory CD8 T cell numbers, homeostatic proliferation of primary and secondary memory OT-I cells was determined using a BrdU assay. A significantly higher percentage of primary memory OT-I cells incorporated BrdU in the PBL and spleen when compared to secondary memory CD8 T cells (Figure
32 22 11A,B). Since homeostatic proliferation of both primary and secondary memory CD8 T cell populations was measured in the same mice, the differences observed were likely not related to environmental factors, but rather they represent inherent differences between primary and secondary memory CD8 T cells. Taken together, these results uncover the differences in population dynamics of primary and secondary CD8 T cell responses and suggest that one naïve CD8 T cell does have a greater memory generation potential than one primary memory CD8 T cell. Phenotypic characterization of early and late memory CD8 T cells Memory CD8 T cells undergo phenotypic and functional changes throughout time after infection [4, 12, 19, 22, 23]. Consequently, the quality of memory CD8 T cells used to examine the population dynamics of naïve and primary memory CD8 T cells could impact the interpretation of the results presented thus far. For each of the experiments, memory CD8 T cells that were at least two hundred days post primary infection were used. It has been shown that the majority of primary memory CD8 T cells at this time post infection have a late memory (latem) phenotype (ex. CD62L expression) and function (ability to vigorously expand to antigen challenge) [25]. To test the extent to which observed changes in population dynamics of primary and secondary CD8 T cell responses are influenced by the quality of primary memory CD8 T cells, a final set of adoptive co-transfer experiments was performed (Figure 12). Primary memory OT-I cell populations generated 33 days (earlym) or 255 days after VacV-OVA infection (latem) were co-transferred at different ratios into naïve B6 recipient mice before infection with Att LM-OVA or Vir LM-OVA infections (Figure 12A - experimental design). Phenotypic analysis of both memory OT-I populations revealed that in contrast to day 33 cells, day 255 cells do have a latem phenotype (high frequencies of cells expressing CD62L and CD27 markers) (Figure 12B).
33 23 Higher proliferation potential but indistinguishable kinetics of secondary CD8 T cell responses generated from late versus early primary memory CD8 T cells The longitudinal kinetic analysis of secondary CD8 T cell responses generated either from earlym or latem populations revealed that the proliferation capacity of latem CD8 T cells is higher than the capacity of earlym cells. Interestingly, despite the initial differences in the ability to expand, the ratio of earlym and latem remained relatively constant up to five months after infection, indicating that while latem were able to undergo a higher magnitude of expansion than earlym CD8 T cells [25], the overall kinetics of the secondary CD8 T cell responses were nearly identical (Figure 13A,B,C). The same results were obtained in all groups of mice suggesting that intrinsic differences in proliferative expansion and overall kinetics of the secondary CD8 T cell responses are not influenced by the numbers of cells transferred or the virulence of the pathogen used for the infection (Figure 13A,B,C). Thus, the observed changes in population dynamics of primary and secondary CD8 T cell responses are not influenced by the quality of primary memory CD8 T cells used in co-transfer studies. Discussion The data presented in this chapter provide new insights into the functional differences that distinguish naïve and memory CD8 T cells as well as differences in the progression and resolution of the primary and secondary response to antigen. CD8 T cells mediate protection to infection due to their ability to employ effector functions and undergo Ag-driven clonal expansion. CD8 T cells respond to infection by the production of cytolytic molecules and cytokines which results in the recruitment of additional cells of the immune system to the site of infection and destruction of infected cells. In regards to these processes, memory CD8 T cells are superior to naïve CD8 T cells as they are able to respond faster [18, 27, 57]. However, the precise mechanisms that allow memory
34 24 cells to kill and produce cytokines faster are not completely understood, and there is some evidence that memory CD8 T cells may exist in a ready to respond state through steady- state phosphorylation of proteins involved in signaling as well as chromatin remodeling around gene loci encoding for cytolitic molecules [61-66]. The other aspect of the CD8 T cell response that impacts the outcome of the response is Ag-stimulated proliferation that leads to increased numbers of pathogenspecific CD8 T cells capable of executing effector functions. It has been suggested that compared to naïve, memory CD8 T cells may be able to encounter Ag earlier (due to differences in trafficking and tissue distribution), begin to cycle faster, and proliferate to a higher extent after Ag encounter [4, 5, 11-14]. However, interpretation of these observations has in some instances been complicated by the experimental systems employed. In addition, recent studies have suggested that primary and repeatedly stimulated memory CD8 T cells differed substantially in their functional properties, including the ability to proliferate and re-differentiate into long-lived memory [32]. In this chapter, we show that when analyzed on a per cell basis and in the same environment, naïve CD8 T cells have a greater expansion potential than primary memory CD8 T cells (Figure 14 - model). The intrinsic ability of one naïve cell to give rise to more effector CD8 T cells than one memory CD8 T cells is independent of the inflammatory context (type and dose of infection) as well as on the number and quality of primary memory cells present in vivo. Therefore, and in line with the notion that multiple Ag-encounters decrease the proliferation capacity of responding CD8 T cells, even primary Ag-stimulation leads to a decreased ability of Ag-specific CD8 T cells to respond to new Ag-stimulation. However, inflammatory context (signal 3 [6, 8, 10]) during Ag-recognition influences the proliferation capacity of naïve and primary memory CD8 T cells. The sensitivity to inflammatory cues might be greater for memory CD8 T cells since increasing inflammation during the initial priming decreases the differences in the magnitude of the expansion between primary and secondary CD8 T cell responses.
35 25 Recently, it has been shown that inflammatory cytokines (signal 3) exert the greatest impact on proliferating CD8 T cells [55] suggesting the possibility that memory CD8 T cells, by their ability to enter cell-cycle earlier than naïve CD8 T cells, might be influenced by inflammation for longer periods of time. Although additional studies are needed to further investigate the differential susceptibility of naïve and memory CD8 T cells to inflammatory stimuli the data presented here suggest that the choice of booster pathogen and modulation in the inflammatory milieu during Ag-stimulation might represent viable approaches to modulate the magnitude and composition of responding CD8 T cells. Examining the population dynamics of naïve and primary memory CD8 T cell responses after Ag-stimulation we also showed that memory generation potential is higher for naïve than primary memory CD8 T cells (Figure 14 model). Initially, contraction of the secondary CD8 T cell response was delayed leading to a greater representation of secondary than primary CD8 T cells. However, contraction of the secondary CD8 T cell responses was protracted, and as contraction of the secondary CD8 T cell response resolved, primary memory cells were actually present at greater numbers than secondary memory CD8 T cells in all organs analyzed. The decreased ability of primary memory CD8 T cells to generate long-lived progeny compared to their naïve counterparts might not be surprising since it has been shown that every additional Agencounter ultimately decreases the memory generation potential of responding cells [32]. In summary, the data presented here provide new insights into the functional properties of primary memory CD8 T cells that must be taken into consideration in future vaccine development.
36 26 Figure 1 Naive CD8 T cells undergo a higher magnitude of expansion than memory CD8 T cells after L. monocytogenes infection. A) Experimental design. Naïve Thy1.1/1.1 OT-I (1x10 3 ) were mixed with an equal number of primary memory Thy1.1/1.2 OT-I (day 200+ after primary VacV-Ova infection) and injected into naïve B6 Thy1.2/1.2 recipients. Mice were challenged 24 hrs later with Att LM-OVA (5x10 6 CFU per mouse; i.v.). B) Representative plots showing the primary (Thy 1.1/1.1) and secondary (Thy 1.1/1.2) OT-I responses at the indicated days after Att LM-OVA infection. Numbers inside the plots indicate the percentage of primary or secondary OT-I CD8 T cells in peripheral blood, and numbers below the plots indicate the ratio of primary to secondary OT-I cells at the indicated days p.i. C) Kinetic analysis of OT-I in peripheral blood. Data are presented as the percentage of primary or secondary OT-I cells in peripheral blood (mean +/- SEM for 5 mice per group). D) The ratio of primary to secondary OT-I cells at the indicated days after infection. Dots represent individual mice, solid lines indicate the mean, and the dashed line indicates the starting ratio of naïve and primary memory OT-I cells in the mix used for adoptive transfer before infection. * indicates a p value between 0.01 and 0.05, and ** indicates a p value less than 0.01.
37 27
38 28 Figure 2 Naïve CD8 T cells expand in numbers more than memory CD8 T cells after different infections or after non-infectious priming conditions. A) Experimental design. Naïve Thy 1.1/1.1 OT-I (1x10 3 ) were mixed with an equal number of primary memory Thy 1.1/1.2 OT-I (day 200+ after primary VacV-Ova infection) and injected into naïve B6 Thy 1.2/1.2 recipients. Mice were challenged 24 hrs later with Att LM-OVA (5x10 6 CFU or 5x10 4 CFU per mouse; i.v.), Vir LM-OVA (5x10 4 CFU per mouse; i.v.), VacV-OVA (3x10 6 PFU per mouse; i.p.), or DC-OVA (1x10 6 cells per mouse; i.v.). B) Dot plot showing the mix of naïve and memory OT-I cells used for adoptive transfer. Numbers inside the plot indicate the percentage of naïve OT-I (Thy 1.1/1.1) or primary memory OT-I (Thy 1.1/1.2). C) Kinetic analysis of OT-I in peripheral blood at the indicated days after infection or immunization. Data are presented as the percentage of primary or secondary OT-I cells in peripheral blood (mean +/- SEM for 5 mice per group). D) The ratio of primary to secondary OT-I at the indicated days after infection or immunization. Dots represent individual mice, solid lines indicate the mean, and the dashed line indicates the starting ratio of naïve and memory OT-I cells before infection. * indicates a p value between 0.01 and 0.05, and ** indicates a p value less than 0.01.
39 29
40 30 Figure 3 Systemic inflammation influences the expansion potential of primary memory CD8 T cells. A) Experimental design. Naïve Thy1.1/1.1 OT-I cells (1x10 3 ) were mixed with an equal number of primary memory Thy1.1/1.2 OT-I cells (d350+ after primary infection) and injected into naïve B6 Thy1.2/1.2 recipients. Mice were immunized 24 hrs later with Ova257-coated dendritic cells (DC-OVA; 2x10 5 cells per recipient) in the presence or absence of Att LM co-infection (5x10 6 CFU per mouse). B) Graph showing the ratio of primary to secondary OT-I cells in PBL at the indicated days after DC-OVA immunization in the presence or absence of infection. C) The ratio of primary to secondary OT-I cells in the indicated organs at day 7 after immunization. The dotted lines in B and C indicate the ratio of naïve to primary memory OT-I cells used in the adoptive transfer mix.
41 31
42 32 Figure 4 Differences in trafficking after adoptive transfer do not explain the higher magnitude of expansion of naïve CD8 T cells. A) Experimental design. The indicated numbers of naïve Thy 1.1/1.1 OT-I were mixed with an equal number of primary memory Thy 1.1/1.2 OT-I (day 300+ after primary VacV-Ova infection) and injected into naïve B6 Thy 1.2/1.2 recipients. Mice were challenged 24 hrs later with Att LM-OVA (5x10 6 CFU per mouse). B) The expression of the indicated markers was evaluated on primary memory OT-I cells. Shaded histograms represent isotype control staining and open histograms represent specific staining of gated primary memory OT-I CD8 T cells. Numbers indicate the percentage of cells positive for the indicated molecules. C) Dot plot showing the mix of naïve and memory OT-I cells used for adoptive transfer. Numbers inside the plot indicate the percentage of naïve OT-I (Thy 1.1/1.1) or primary memory OT-I (Thy 1.1/1.2) cells. D) The ratio of primary to secondary OT-I in the indicated organs 24 hours after adoptive transfer of naïve OT-I and primary memory OT-I (3x10 5 of each cell types per recipient). Dots represent individual mice, solid lines indicate the mean, and the dashed line indicates the starting ratio of naïve and memory OT-I cells before infection. E) Total numbers of naïve or primary memory OT-I in the spleens one day after adoptive transfer. Data are presented as mean + SEM for 4 mice per group. * indicates a p value between 0.01 and 0.05.
43 33
44 34 Figure 5 Differences in tissue localization at the peak of the response do not explain the differences in expansion potential of naïve and memory CD8 T cells. A) Representative histograms showing the percentage of secondary among all gated OT-I cells in the indicated organs at day 7 after Att LM-OVA infection (5x10 6 CFU per mouse; i.v.). The total number of naïve and primary OT-I cells initially transferred is indicated. B) The ratio of primary to secondary OT-I cells in the indicated organs at day 7 p.i. Dots represent individual mice, solid lines indicate the mean, and the dashed line indicates the starting ratio of naïve and memory OT-I cells before infection.
45 35
46 36 Figure 6 Sustained proliferation of primary effectors leads to the higher magnitude of expansion of naïve CD8 T cells. A) Kinetic analysis of primary or secondary OT-I in peripheral blood. Naïve OT-I or primary memory OT-I cells were transferred into separate mice, and mice were challenged 24 hrs later with Att LM-OVA (5x10 6 CFU per recipient; i.v.). Data are presented as the percentage of primary or secondary OT-I cells in peripheral blood (mean +/- SEM for 4-10 mice per group per time point). B) Kinetic analysis of BrdU incorporation. Data are presented as the percentage of primary or secondary OT-I cells in peripheral blood or the spleen positive for BrdU (mean +/- SEM for 3-4 mice per group per time point). C) Representative dot plots of BrdU staining of OT-I cells in the spleen at day 7 after Att LM-OVA infection. Numbers inside the plots indicate the percentage of OT-I cells positive for BrdU. ** indicates a p value less than 0.01; ns- not significant.
47 37
48 38 Figure 7 Increased death of secondary effectors does not lead to the higher magnitude of expansion of naïve CD8 T cells. A) Representative dot plots of caspase-3/7 staining of primary or secondary OT-I cells in the spleens at the indicated time points after Att LM-OVA infection. Numbers indicate the percentage of OT-I cells positive for caspase-3/7. B) The percentage of primary or secondary OT-I cells positive for caspase-3/7 at the indicated days after Att LM-OVA infection (mean + SEM for 3-4 mice per group per time point).
49 39
50 40 Figure 8 Population dynamics of naïve and memory CD8 T cell responses after antigen stimulations in vivo. A) Experimental Design. Naïve Thy 1.1/1.1 OT-I (1x10 3 ) were mixed with primary memory Thy 1.1/1.2 OT-I (day 200+ after primary VacV-Ova infection) at the indicated ratios and injected into naïve B6 Thy 1.2/1.2 recipients. Mice were challenged 24 hrs later with Att LM-OVA (5x10 6 CFU per recipient; i.v.). B) Kinetic analysis of primary and secondary OT-I CD8 T cell responses presented as the ratio of primary to secondary OT-I cells in peripheral blood (mean +/- SEM for 4 or 5 mice per group). The dashed line indicates the starting ratio of naïve and memory OT-I cells transferred before infection.
51 41
52 42 Figure 9 Detailed longitudinal kinetic analysis of primary and secondary CD8 T cell responses in vivo. A) Primary or secondary responses in PBL after adoptive transfer of the indicated numbers of naïve and primary memory OT-I cells followed by Att LM-OVA infection. Data are presented as the mean percentage of primary or secondary OT-I cells in PBL +/- SEM for 4 or 5 mice per group. B) The ratio of primary to secondary OT-I cells in the PBL at the indicated days after infection. Dots represent individual mice, solid lines indicate the mean, and the dashed line indicates the ratio of naïve to primary memory OT-I cells used in the adoptive transfer mix.
53 43
54 44 Figure 10 Primary memory CD8 T cells are found in greater numbers than secondary memory CD8 T cells in multiple organs at a late memory time point. A) The percentage of primary or secondary OT-I per indicated organ on day 227 after Att LM-OVA infection. Data are presented as mean + SEM for 3 mice per organ. B) The ratio of primary to secondary OT-I in the indicated organs at day 227 after Att LM-OVA infection. Dots represent individual mice, solid lines indicate the mean, and the dashed line indicates the starting ratio of naïve and memory OT-I cells transferred before infection. * indicates a p value between 0.01 and 0.05, and ** indicates a p value less than 0.01.
55 45
56 46 Figure 11 The rate of homeostatic proliferation differs between primary and secondary memory CD8 T cells. A) Representative dot plots of BrdU staining of primary or secondary OT-I cells in the spleen or peripheral blood (PBL) on day 216 after infection (the ratio of naïve to primary memory OT-I cells used for adoptive transfer was 1:10). Numbers inside the plots indicate the percentage of OT-I cells positive for BrdU. B) The percentage of BrdU positive primary or secondary OT-I cells in the spleen or PBL at day 216 after Att LM- OVA infection. Dots represent individual mice, and lines indicate the mean.
57 47
58 48 Figure 12 Phenotypic characterization of early and late memory CD8 T cells. A) Experimental Design. Day 33 old primary memory (earlym; Thy1.1/1.1 OT-I - 1x10 3 or 1x10 4 ) were mixed with day 250+ old primary memory (latem Thy1.1/1.2 OT-I) at the indicated ratios and injected into naïve B6 Thy1.2/1.2 recipients. Mice were challenged 24 hrs later with Att LM-OVA or Vir LM-OVA (5x10 6 and 5x10 4 CFU per mouse, respectively). B) The expression of the indicated markers was evaluated for earlym and latem OT-I donors. Shaded histograms represent isotype control staining and open histograms represent staining of earlym or latem OT-I CD8 T cells. Numbers indicate the percentage of cells positive for the indicated molecules.
59 49
60 50 Figure 13 Higher proliferation potential but indistinguishable kinetics of secondary CD8 T cell responses generated from late versus early memory CD8 T cells. A) Kinetic analysis of the combined earlym and latem OT-I cell responses in peripheral blood after the indicated infection. Data are presented as the mean percentage of OT-I cells in PBL +/- SEM for five mice per group. B) Kinetic analysis of the earlym or latem OT-I response in PBL after the indicated infection. Data are presented as the mean percentage of earlym or latem OT-I cells in PBL +/- SEM for five mice per group. C) The ratio of earlym or latem OT-I in the PBL at the indicated days after infection. Dots represent individual mice, solid lines indicate the mean, and the dashed line indicates the starting ratio of earlym and latem OT-I cells transferred before infection.
61 51
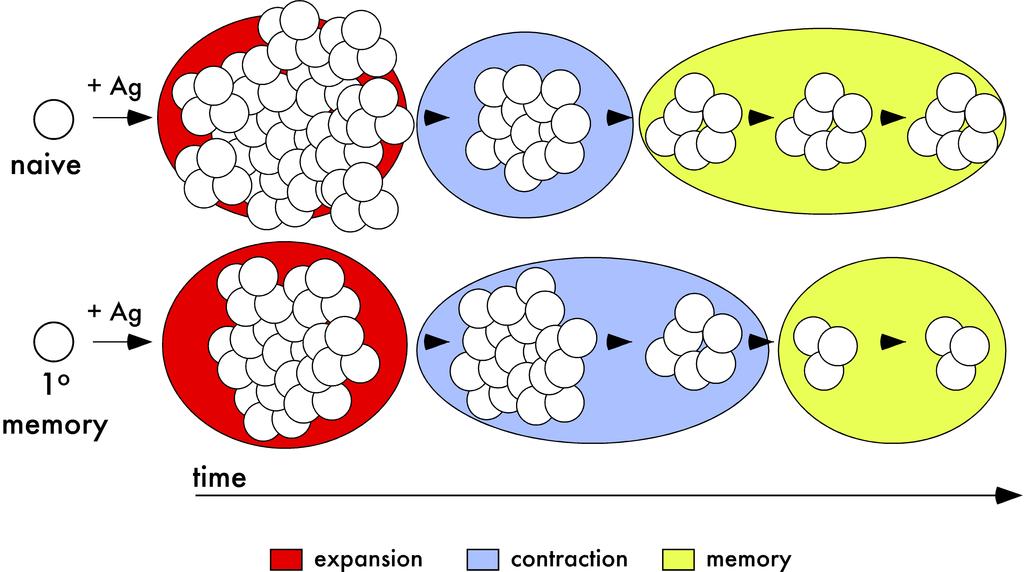
62 52 Figure 14 Population dynamics of primary and secondary CD8 T cell responses after infection or vaccination a model. A) After antigen encounter, naïve and primary memory CD8 T cells undergo significant proliferative expansion. However, the expansion in numbers of the primary response is greater than the expansion of the secondary CD8 T cell response. Due to the prolonged contraction of the secondary CD8 T cell response, secondary CD8 T cells are present in higher numbers than primary CD8 T cells after the expansion phase. However, after resolution of contraction, primary memory CD8 T cells persist at higher numbers than secondary memory CD8 T cells. Therefore, on a per cell basis, naïve CD8 T cells have greater seeding potential than memory CD8 T cells after antigen-encounter.
63 53
64 54 CHAPTER III THE IMPACT OF PRE-EXISTING MEMORY ON DIFFERENTIATION OF NEWLY RECRUITED NAÏVE CD8 T CELLS Introduction It has been shown that after infection/immunization the increased resistance of the immunized (immune) host to re-infection correlates with the numbers of memory CD8 T cells in both lymphoid and non-lymphoid tissues [30, 52, 67]. As a result, much effort has been devoted to identifying approaches that increase the quantity of memory CD8 T cells [4, 5, 14]. For instance, for most primary infections the number of memory CD8 T cells correlates with the number of effectors generated during the initial Ag-stimulation [46, 47, 68] suggesting that the generation of primary memory CD8 T cells might be influenced by the parameters that control effector CD8 T cell expansion and/or survival (ex. Ag-presentation, co-stimulation, signal three cytokines [4, 6, 8, 48]). In addition, prime-boost protocols (repetitive Ag stimulations) are often used because of their ability to elicit large numbers of memory CD8 T cells [31, 35, 37]. Although the impact of repeated Ag-exposures on memory CD8 T cell differentiation and the subsequent amount of protection achieved are under investigation [11, 31, 53, 60, 69], prime-boost regimens represent a viable approach in modulating the quantity of memory CD8 T cells [4, 14, 35]. On the other hand, the magnitude of primary Ag-specific CD8 T cell responses might be influenced by the presence of pre-existing immunity to the pathogen or to the vector used for Ag-delivery. It has been shown that the existence of anti-vectorial immunity can limit the expansion of newly evoked naïve CD8 T cell responses [41, 70-73] but the impact on differentiation and memory CD8 T cell generation is not known. This is an important question since memory CD8 T cell quality, which can be characterized by phenotype and function of Ag-specific CD8 T cells, together with
65 55 quantity are defining parameters that directly influence the degree of protection. Recent studies have suggested that the quality of memory is likely determined during the initial days after Ag-recognition [4, 10, 36, 37, 40, 48]. Interestingly, most experimental conditions that affect effector CD8 T cell expansion also influence the effector to memory CD8 T cell transition. As an example, generation of CD8 T cells with memory phenotype and function can be accelerated if priming and early development of effector CD8 T cells occurs under low-inflammatory conditions (ex. peptide-dc immunizations, immunization with peptide-coated microspheres [37, 49, 74]) or when the duration of infection and/or functional Ag-presentation is modulated (ex. antibiotic treatment to stop the infection [36, 40, 75]). In this section, the consequences of existing CD8 T cell-mediated immunity on the development of newly recruited naïve CD8 T cell responses was analyzed. The impact of simultaneously occurring memory responses on the magnitude of the primary response, as well as naïve to memory differentiation (including phenotypic and functional attributes of resulting memory cells) was addressed. The results provide new insights into the development of primary CD8 T cell responses in immune mice and could have important implications for the design of vaccination regimens. Materials and Methods Mice, bacteria, and virus infections C57Bl/6 mice were obtained from the U.S. National Cancer Institute. OT-I transgenic mice were previously described [50, 51]. Pathogen-infected mice were housed in the appropriate biosafety conditions. All mice were used at 6-12 wk of age. All animal protocols followed approved Institutional Animal Care and Use Committee (IACUC) protocols. Attenuated acta-deficient Listeria monocytogenes (LM) strains DP- L1942, Ova257-expressing strains, and Ova257/GP33-expressing strains (Att LM, Att LM-OVA, and Att LM-OVA/GP33 respectively) were grown, injected i.v., and
66 56 quantified as described [76, 77]. As a measure of bacterial clearance after infection, colony-forming units (CFU) were determined in the spleen and liver on the indicated days after infection, as described [78]. Vaccinia virus expressing the OVA257 peptide (VacV-OVA), the GP33 peptide (VacV-GP33), and the β-gal peptide (VacV-β-Gal) [54, 79] were injected i.p into mice. Adoptive-transfer experiments and isolation of lymphocytes from tissues OT-I cells were obtained from peripheral blood samples of 2-3 month old naïve Thy1.1 OT-I mice. Contaminating memory phenotype (CD44 hi /CD11a hi Vα2 + Vβ5 + ) OT- I cells were less than 5%. OT-I cells were transferred (5x10 2 cells per mouse [50]) into recipient Thy1.2/1.2 mice 24 hours before infection with the indicated strains of LM or VacV. To generate primary memory OT-I T cells for adoptive transfer experiments, naïve Thy1.1/1.2 OT-I cells were transferred into Thy1.2 recipients and mice were immunized with 3x10 6 PFU VacV-OVA by i.p. injection. For experiments examining secondary expansion of OT-I cells, primary memory OT-I cells were purified by positive selection with PE-conjugated anti-thy1.1 (ebioscience) and anti-pe magnetic beads (Miltenyi Biotec) before injection into naïve recipients. For isolation of lymphocytes from tissues, samples of blood were obtained by retroorbital puncture before tissue removal. Anesthetized mice were then perfused through the left ventricle with PBS. Single cell suspension from liver, lung, spleen, and lymph nodes were washed before staining [80]. Abs and peptides The following mabs from ebioscience with the indicated specificity and with appropriate combinations in fluorochromes were used: CD8 (clone ), Thy1.1 (OX- 7 and HIS51), Thy1.2 (53-2.1), CD127 (A7R34), CD62L (MEL-14), CD27 (LG.7F9), KLRG1 (2F1), IFN-γ (XMG1.2), TNF-α (MP6-XT22), IL-2 (JES6-5H4), and appropriate
67 57 isotype controls. Synthetic OVA and GP33-41 peptides were used as previously described [37]. Quantification of CD8 T cell responses and intracellular cytokine staining OT-I T cell responses in peripheral blood and tissues were monitored by FACS analysis for Thy1.1 positive CD8 T cells. Thy1.2 expression was used to discriminate between primary and secondary responses in the same host. Endogenous Ova257- specific CD8 T cells were detected by allophycocyanin (APC)-conjugated tetramer complexes as described [53]. The percentage of CD8 T cells producing cytokines after stimulation with Ova or GP33-41 peptides was determined using intracellular cytokine staining (ICS) for IFN-γ and TNF-α or IL-2 after 5 hr incubation with or without peptide in brefeldin A (BD Pharmingen) [81]. Statistical analysis Statistical significance was assessed using the two-tailed t-test with a confidence interval of >95%. Results Primary memory CD8 T cells influence differentiation of naïve CD8 T cell responses of the same specificity after infection To test the idea that the presence of primary memory CD8 T cells can influence differentiation of naïve CD8 T cell responses, physiological numbers of naïve TCR-Tg OT-I CD8 T cells (500 cells per recipient; Thy1.1/1.1 [50]) were adoptively cotransferred with different numbers of primary memory OT-I cells (3x10 4 or 5x10 5 cells per recipient; Thy1.1/1.2) (Figure 15A experimental design). All groups of naïve C57BL/6 (B6; Thy1.2/1.2) recipient mice, including a control group that was initially
68 58 seeded with naïve OT-I cells only, were infected with a sublethal dose (0.1LD 50 ) of attenuated (act A - deficient) recombinant Listeria monocytogenes that expresses the Ova257 epitope (Att LM-Ova). At various days post infection the changes in the expression of phenotypic markers (CD127 (IL-7Rα), CD62L, CD27) known to be modulated during primary memory CD8 T cell development and differentiation [17] were analyzed on responding naïve OT-I cells (Figure 15B,C). Phenotype analysis of Thy1.1/1.1 primary OT-I cells at days 12 and 41 p.i. revealed higher percentages of CD127, CD62L and CD27high expressing OT-I cells in both groups of mice that contained memory OT-I cells at the time of infection. Importantly, a positive correlation between the number of memory OT-I cells present and the differentiation of naïve OT-I cells into memory was observed (Figure 15B,C). Therefore, naive OT-I CD8 T cells responding to infection in the presence of co-transferred memory OT-I converted faster to cells with a late memory phenotype (CD127high, CD62Lhigh, and CD27high). Naive TCR-Tg CD8 T cells transferred into recipients with endogenous memory CD8 T cells of the same specificity progress to a CD27 hi /CD62L hi phenotype faster In order to extend the initial observation, additional experiments were performed in which the fate of newly primed naïve OT-I cells was followed in previously immunized hosts. In this experimental setup the differentiation of naïve OT-I T cell responses was followed in a more physiologically relevant system since immune hosts contained endogenous polyclonal primary memory CD8 T cells of the same Agspecificity. Naïve B6 mice were infected with Vaccinia virus expressing the LCMV-derived GP33 epitope (VacV-GP33; w/o memory group) or with VacV expressing the Ova257 epitope (VacV-Ova; w/memory group) (Figure 16A experimental design). At a memory time point (d49 p.i.) naïve OT-I cells were transferred into both groups of mice
69 59 before infection with Att LM-Ova. Before the adoptive transfer of naïve OT-I cells the existence of endogenous memory CD8 T cells specific for GP33 and Ova257 after VacV- GP33 or VacV-Ova immunization was confirmed by a peptide stimulated IFN-γ secretion assay in the spleen before secondary challenge (Figure 16B). Importantly, VacV-Ova immunized mice that contained ~ 3x10 4 Ova257-specific CD8 T cells per spleen were able to control and clear secondary LM infection faster than the VacV-GP33 immunized control group (Figure 16C). Therefore, this experimental setup enabled the investigation of how functional endogenous memory CD8 T cells are influencing the development of newly recruited naïve CD8 T cell responses directed against the same epitope. Primary OT-I CD8 T cell responses were readily detectable in both groups of mice (Figure 16D) after Att LM-Ova infection. As previously suggested [42], the magnitude of expansion of newly recruited CD8 T cells was decreased in the presence of memory CD8 T cells of the same specificity. Importantly, despite the lower magnitude of the initial expansion, the phenotype of OT-I CD8 T cells at day 7 p.i., at least for the markers that were examined, was indistinguishable between groups suggesting that naïve to effector CD8 T cell differentiation during the development of primary CD8 T cell responses is not influenced by the CD8 T cell-mediated immunity present at the time of Ag-stimulation (Figure 16E). Consistent with the data presented in Figure 15, longitudinal analysis of primary OT-I T cell responses in these mice indicated that naïve OT-I cells primed in the presence of endogenous polyclonal CD8 T cell memory displayed an accelerated memory differentiation based on increased expression of CD27 and CD62L (Figure 16F). In addition, the surface expression of KLRG-1 molecule is known to be decreased during differentiation of effector CD8 T cells into memory [48]. Importantly, the frequency of KLRG-1 positive cells was decreased on primary memory OT-I cells initially primed in immune mice (Figure 16F). In summary, pre-existing endogenous CD8 T cell memory influenced the magnitude of expansion of naive CD8 T cells of the same Ag-specificity but not their
70 60 naïve to effector transition. Importantly, development of OT-I cells with memory phenotype was facilitated in an immune host suggesting that endogenous memory CD8 T cell responses might control the developmental program of newly primed CD8 T cell responses. Naïve endogenous CD8 T cells primed in the presence of memory CD8 T cells of unrelated specificity show decreased levels of expansion but progress to a late memory phenotype faster In the adoptive transfer models where naïve TCR-Tg OT-I cells were transferred with primary memory OT-I cells or when they were transferred into recipients with endogenous polyclonal CD8 T cell memory of the same specificity, the differentiation of newly primed OT-I cells into cells with memory phenotype (i.e. CD127 and CD62L pos, KLRG1 neg, and CD27 hi) was facilitated (Figures 15 and 16). The next set of experiments were designed to address the extent to which the presence of memory CD8 T cells specific for the vector but not to new antigen (anti-vectorial immunity) influence clonal expansion and memory differentiation of primary polyclonal (endogenous) CD8 T cell responses. Groups of naïve B6 mice were immunized with VacV expressing β-gal (w/o memory group) or VacV-GP33 (w/memory group) two months before secondary challenge with recombinant LM expressing both, OVA and GP33 epitopes (Att LM- OVA/GP33) (Figure 17A - experimental design). GP33-specific memory CD8 T cells were detected in VacV-GP33 immunized mice and VacV-GP33 immune mice showed increased resistance to secondary LM-OVA/GP33 challenge indicating that anti-lm (anti vector) immunity was present (Figure 17B,C). Analysis of the newly primed endogenous Ova257-specific CD8 T cells in control as well as in immune mice revealed that the presence of CD8 T cell-mediated anti-
71 61 vectorial immunity (GP33-specific CD8 T cells) decreased the efficiency of primary Ova257-specific CD8 T cell expansion and subsequent memory generation (Figure 17D,E). Importantly, despite decreased numbers of endogenous Ova257-specific CD8 T cells generated in the presence of anti-vectorial immunity, ova-specific cells converted faster to a memory phenotype when compared to the cells primed in a non-immune environment. Longitudinal analysis of endogenous K b Ova257-specific CD8 T cells showed that expression of markers known to be upregulated on Ag-specific memory CD8 T cells (CD127, CD27, CD62L Figure 17F) was increased when the responding cells were primed in immune hosts. Therefore, naïve endogenous CD8 T cells primed in the presence of responding endogenous memory CD8 T cells of unrelated specificity showed a decreased magnitude of expansion but differentiated into cells with a memory phenotype at an accelerated pace. The functional consequences of naïve CD8 T cell priming in the presence of anti-vectorial immunity In order to address the functional consequences of naïve CD8 T cell priming in the presence of anti-vectorial immunity, age and sex matched naïve Thy1.2 B6 mice were either not infected (w/o memory group) or infected with a strain of LM that does not express the Ova257 epitope (w/memory group). 500 naïve Thy1.1 OT-I CD8 T cells were transferred into both groups of mice 44 days after initial infection and one day before infection with an LM strain that expresses the Ova257 epitope (Figure 18A experimental design). This experimental setup enabled analysis of the extent to which phenotype (rapid expression of memory CD8 T cell markers) correlates with changes in function (ex. tissue distribution, cytokine production, Ag-driven proliferation) for vectorinduced primary CD8 T cells primed in the presence of anti-vectorial immunity. Detailed kinetic analysis of newly primed OT-I cells in the blood showed that the magnitude of expansion and subsequent memory generation were decreased in mice immune to the
72 62 vector (Figure 18B,C,D). Decreased expansion correlated again with an increase in frequency of CD27 hi /CD62L hi OT-I CD8 T cells one month after Att LM-Ova challenge (Figure 18E). To determine if primary memory OT-I cells primed in the presence or absence of anti-vectorial immunity showed different patterns of tissue distribution, the representation of OT-I cells in secondary lymphoid organs and tertiary tissues was analyzed one month after Att LM-Ova challenge. The frequency of OT-I in total CD8 T cells in each tissue was normalized to the frequency of OT-I in PBL (Figure 19A,B). The results clearly showed that consistent with their phenotype, memory OT-I primed in immune hosts were significantly enriched (p=0.04) in lymph nodes (LN) but their representation was decreased in lungs (p=0.027) (Figure 19B). The total number of OT-I cells recovered from LNs was similar in both groups of mice suggesting that despite their decrease in numbers in the circulation and/or spleen (Figures 18D,19C), priming of naïve CD8 T cells in the presence of memory might not lead to a uniform decrease in memory CD8 T cell numbers in all organs. Therefore, the accelerated differentiation of naïve CD8 T cells into memory is coupled with their ability to rapidly re-gain access to LNs. In addition to the changes in tissue distribution, direct ex vivo Ova257-peptide stimulation of splenocytes one month post infection revealed a significantly (p=0.02) higher frequency of IL-2 producing IFN-γ-positive OT-I cells in mice that were immune to the vector (Figure 20A,B). Thus, these data suggest that accelerated transition to a late memory phenotype is accompanied with increased frequency of Ag-specific CD8 T cells that are functionally superior in their ability to provide polyfunctional cytokine responses upon Ag stimulation.
73 63 Primary CD8 T cells primed in the presence of antivectorial immunity have a greater proliferative potential upon antigen re-encounter One of the defining characteristics of functional memory CD8 T cells is their ability to rapidly expand upon Ag re-encounter and generate increased numbers of secondary effector cells. In order to test on a per cell basis if primary memory OT-I cells primed in naïve or immune environments (Figure 21A experimental design) differ in their ability to undergo Ag-stimulated proliferation, equal numbers (3x10 4 per recipient) of positively selected OT-I CD8 T cells were transferred into naïve B6 Thy1.2 hosts. A day after adoptive transfer all groups of recipient mice were infected with Att LM-Ova or VacV-Ova and the secondary expansion of OT-I cells was followed at the indicated days in the blood of individual mice (Figure 21). Interestingly, in both models of secondary infections, a statistically significant increase in secondary OT-I expansion was observed in mice that were seeded with primary memory CD8 T cells initially generated in immune hosts (Figure 21B w/memory group). Taken together, the data presented here suggest that the presence of CD8 T cell-mediated anti-vectorial immunity leads to an increased ability of primary vaccine-induced CD8 T cells to respond to booster challenge. Discussion The data presented here provide new insight into the process of primary memory CD8 T cell development and differentiation in immune (non-naïve) hosts. How important and relevant is it to study the development of primary CD8 T cell responses that are primed in the presence of existing CD8 T cell-mediated immunity? In other words, how often will naïve CD8 T cells have a chance to respond to new Ag in an environment that contains pathogen or vector-specific CD8 T cell memory? First, naïve CD8 T cells might be recruited after secondary Ag-stimulation when recruitment of naïve CD8 T cells after initial (primary) infection/immunization was incomplete. Second,
74 64 naïve CD8 T cell precursors might also be produced in the thymus after the resolution of the initial infection. Third, it has also been shown that in the case of chronic viral infections newly generated CD8 T cells might preserve the viral-specific CD8 T cell pool and become more responsive to boosting strategies [82]. Therefore, continuous recruitment of naïve CD8 T cells and/or priming of naïve CD8 T cell precursors at different times after initial Ag-stimulation (ex. naïve CD8 T cells that are recruited later into the response; so called latecomers [83, 84]) might contribute to the heterogeneity and survival (longevity) of the memory CD8 T cell pool. Finally, one has to appreciate the elegance of the immune system since secondary memory CD8 T cells are more permissive than primary memory for lymph node priming of naïve CD8 T cells of the same Ag-specificity [60] suggesting a potential mechanism(s) for memory CD8 T cell replacement as well as an increase in the complexity of memory CD8 T cell populations. Therefore, the heterogeneity of the memory CD8 T cell pool might be achieved and maintained where the priming of naïve CD8 T cells occurs in the presence of effector and memory CD8 T cells of the same Ag-specificity. In most of the experimental models discussed above, naïve and existing memory CD8 T cells were of the same Ag-specificity. An equally important implication for the studies presented here is that accelerated naïve to primary memory CD8 T cell differentiation was observed in mice where naïve and existing memory CD8 T cells were of different Ag-specificities. The importance lies in the fact that a similar scenario can be expected in the case where priming of CD8 T cells against the antigen of choice is carried out in hosts with pre-existing immunity to the antigen-delivery vector. The concept of using a common vector as a vaccine carrier for multiple immunizations is not new, and potential complications to the approach are well documented [41-43]. For instance, the efficacy of vaccination with recombinant viral vectors can be greatly diminished due to the existence of vector-induced humoral immunity [41-43]. On the other hand, Listeria monocytogenes (LM) might represent an
75 65 attractive platform as a vaccine delivery vehicle [42, 85] since the contribution of specific antibody in anti-lm protection is minimal [86]. Importantly, the impact of pre-existing CD8 T cell-mediated immunity on the efficacy of LM as a vaccine vector has been investigated. In most studies, the existence of anti-lm immunity decreased the magnitude of expansion of newly recruited naive CD8 T cells after secondary LM challenge [72, 73, 87-89]. Although the extent of attenuation of the primary CD8 T cell responses is likely to be dependent on the quantity and quality of existing anti-lm CD8 T cell memory, this data suggests that substantial expansion of naïve CD8 T cells can be achieved. Importantly, and likely due to the difference in duration of infection (functional Ag-presentation) and inflammatory cytokines elicited during the infection [6], newly evoked primary CD8 T cells progress to memory-like phenotype and function at an accelerated rate. On the population level, memory cells generated from naïve cells primed in the presence of an on-going memory response were able to cycle back to lymph nodes, produce effector cytokines such as IL-2, and they were able to expand in numbers after secondary booster challenge more than CD8 T cells primed in the naïve (non-immune) environment. Therefore, this data offers new insights into the development of primary CD8 T cell responses in the case when those responses are primed in the host that is immune to the vector used for antigen-delivery. Although a correlation between the number of Ag-specific memory CD8 T cells and the level of protection after re-infection is firmly established [30, 52, 67], the desired quality of memory CD8 T cells might differ depending on multiple factors including the nature of the pathogen and route of infection [11, 25, 90]. Understanding the factors that influence the balance between the number and quality of vaccine-induced primary CD8 T cell responses would likely speed up identification of vaccination strategies and increase the efficacy of prime-boost regimens that target acute and chronic infections.
76 66 Figure 15 - Primary memory OT-I CD8 T cells influence the phenotype of naïve OT- I responses after infection. A) Experimental design. Naïve Thy1.1/1.1 OT-I alone ( naïve ) or mixed with 3x10 4 ( low ) or 5x10 5 ( high) primary memory Thy1.1/1.2 OT-I were transferred into naïve B6 Thy1.2/1.2 recipients one day before infection with Att LM-OVA (1x10 7 CFU/mouse i.v.). B-C) Blood samples were pooled and the expression of the indicated phenotypic markers was evaluated at B) d12 and C) d41 after infection. Shaded histograms represent isotype control staining and open histograms represent staining on gated primary OT-I (Thy1.1/Thy1.1) CD8 T cells. Numbers indicate the percentage of cells positive for CD127, CD62L, and CD27hi.
77 67
78 68 Figure 16 - Naïve TCR-Tg CD8 T cells transferred into recipients with endogenous polyclonal memory CD8 T cells of the same specificity progress to a CD27 hi /CD62L hi phenotype faster. A) Experimental design. Naïve B6 mice were infected with either VacV-GP33 (3x10 6 PFU/mouse i.p.; w/o memory group) or VacV-OVA (3x10 6 PFU/mouse i.p.; w/memory group). Naïve OT-I (Thy1.1) were injected 48 days later, and 24 hrs after transfer, mice were infected with Att LM-OVA (5x10 6 CFU/mouse i.v.). B) Splenocytes from mice infected 47 days previously with VacV-GP33 or VacV-OVA were incubated in the presence or absence of the indicated peptides and monitored for IFN-γ production. Numbers represent the percentage of IFN-γ-positive CD8 T cells. C) Bacterial titers in the spleen (CFU/spleen) and liver (CFU/g Liver) were determined three days after Att LM-OVA infection. Data are presented as mean + SD of three mice per group. D) Representative plots showing the frequency of tetramer positive (K b Ova257) endogenous Ova257-specific cells (Thy1.1 negative) and OT-I cells (Thy1.1 positive) in the blood at day 5 p.i. Numbers indicate the percentage of cells positive for the indicated molecules. E) Blood samples were pooled and the expression of the indicated markers was evaluated at d7 after Att LM-OVA infection. Shaded histograms represent isotype control staining and open histograms represent staining of OT-I (Thy1.1) CD8 T cells. Numbers indicate the percentage of cells positive for the indicated molecules. F) Kinetic analysis of the expression of CD27hi, CD62L, and KLRG-1 molecules on OT-I (Thy1.1) CD8 T cells. Data are presented as the percentage of cells positive for the indicated marker. The experiment was repeated twice with similar results.
79 69
80 70 Figure 17 - Naïve endogenous CD8 T cells primed in the presence of endogenous memory CD8 T cells of unrelated specificity show decreased levels of expansion but progress to a late memory phenotype faster. A) Experimental design. Naïve B6 mice were infected with either VacV-β-Gal (3x10 6 PFU/mouse i.p.; w/o memory group) or VacV-GP33 (3x10 6 PFU/mouse i.p.; w/memory group), and 68 days later mice were infected with Att LM-OVA/GP33 (1x10 7 CFU/mouse i.v.). B) Splenocytes from mice infected 67 days previously with VacV-β-Gal or VacV-GP33 were incubated in the presence or absence of GP33 peptide and monitored for IFN-γ production. Numbers represent the percentage of Ag-specific IFN-γ-positive CD8 T cells. C) Bacterial titers in the spleen (CFU/spleen) and liver (CFU/g Liver) were determined three days after Att LM-OVA/GP33 infection. Data are presented as mean + SD of three mice per group. D) Representative plots showing the frequency of K b Ova257-specific CD8 T cells at d7 and d33 after infection. Numbers indicate the percentage of Ova-specific CD8 T cells. E) Percentage of K b OVA257 positive CD8 T cells in PBL at d33 p.i. presented as mean + SD (n=4 mice per group). F) Kinetic analysis of the expression of the indicated markers for K b OVA257 + CD8 T cells. Data are presented as the percentage of cells positive for the indicated marker. The experiment was repeated twice with similar results.
81 71
82 72 Figure 18 - Anti-vectorial immunity decreases the magnitude of newly evoked primary CD8 T cell responses after infection. A) Experimental design. Naïve B6 mice were either not infected or infected with Att LM (5x10 6 CFU/mouse i.v.). Naïve OT-I (Thy1.1, 5x10 2 cells/mouse) were transferred one day before infection with Att LM-OVA (1x10 7 CFU/mouse i.v). B) Representative plots showing the expansion of OT-I cells at d7 and d32 after Att LM-OVA infection. Numbers indicate the percentage of OT-I in PBL. C) Kinetic analysis of the primary OT- I CD8 T cell responses in PBL. Data are presented as the percentage (mean + SD for 5 to 15 mice per group per time point) of OT-I cells in PBL. D) The percentage of OT-I (Thy1.1) CD8 T cells in PBL of individual mice on d32 after Att LM-OVA infection. Dots represent individual mice and the line represents the mean. The p values are indicated. E) The expression of CD27 and CD62L was evaluated at d24 after Att LM- OVA infection. Shaded histograms represent isotype control staining and open histograms represent staining of OT-I (Thy1.1) CD8 T cells. Numbers indicate the percentage of cells positive for the indicated molecules. Representative profiles out of 3 per group are shown.
83 73
84 74 Figure 19 - Anti-vectorial immunity influences the tissue distribution of primary CD8 T cells. A) Representative plots showing the percentage of OT-I (Thy1.1) CD8 T cells in the indicated organs one month after Att LM-OVA infection. B) Ratios of the percentage of OT-I (Thy1.1) CD8 T cells in the indicated organs to the percentage of OT-I CD8 T cells in PBL at d27 after Att LM-OVA infection. Data are presented as mean + SD of three mice per group. Numbers above bar graphs indicate statistical p value and ns indicates not statistically significant. C) Total numbers of OT-I cells found in the spleen and the inguinal lymph nodes at d27 after Att LM-OVA infection. Data are presented as mean + SD of three mice per group.
85 75
86 76 Figure 20 - Primary CD8 T cells primed in the presence of anti-vectorial immunity show different cytokine profiles after direct ex vivo stimulation with antigen. A) One month post Att LM-OVA infection the cytokine production by OT-I CD8 T cells from the spleen from groups of mice described in Figure 18A was determined after short ex vivo incubation in the presence of OVA257 peptide. Numbers represent the percentage of OT-I (Thy1.1) CD8 T cells that were positive for IFN-γ and IL-2. B) Percentage of IL-2 producing IFN-γ positive OT-I CD8 T cells. Data are presented as mean + SD of three mice per group. Numbers above bar graphs indicate statistical p value.
87 77
88 78 Figure 21 - Primary CD8 T cells primed in the presence of anti-vectorial immunity have a greater proliferative potential after booster challenge. A) Primary memory OT-I cells (Thy1.1) from w/o memory and w/memory groups of mice (described in Figure 18A) were isolated on day 35 post Att LM-OVA infection by positive selection and transferred in equal numbers (3x10 4 ) into naïve recipients one day before Att LM-OVA or VacV-OVA infection. Representative dot plot examples showing the expansion of OT-I cells (Thy1.1) at d7 after Att LM-OVA (5x10 6 CFU/mouse i.v.) or VacV-OVA (3x10 6 PFU/mouse i.p.) infections. Numbers indicate the percentage of OT- 1 (Thy1.1) CD8 T cells per PBL. B) Kinetic analysis of the OT-I CD8 T cells in PBL after infection. Data are presented as the frequency of OT-I cells in PBL (mean +SD for three mice per group). Numbers above boxes indicate the statistical p value.
89 79
90 80 CHAPTER IV CONCLUSIONS AND FUTURE DIRECTIONS Conclusions Memory CD8 T cells offer increased protection upon pathogen encounter, and if vaccination strategies based on protective CD8 T cell memory are to be effective, a complete understanding of memory CD8 T cells as well as the processes involved in their generation are necessary. Much work has been focused on understanding the attributes of CD8 T cells that differ from naïve cells and account for their increased protection. These studies have led to the description of memory CD8 T cells as being superior to their naïve counterparts. Compared to naïve cells, memory CD8 T cells are maintained at higher numbers and can localize to peripheral tissues offering increased protection at sites of possible pathogen entry [4, 16, 18, 24, 25]. In addition, they are able to respond faster with effector mechanisms including cytolysis and the production of cytokines, and they are capable of vigorous expansion upon re-encounter with antigen [4, 17, 18, 20]. However, how the proliferation capacity and memory generation potential (the relative ability to generate long-lived progeny) of memory compares to naïve CD8 T cells is not understood. This information would provide additional valuable knowledge of the functional abilities of memory CD8 T cells. Thus, one of the focus areas of this thesis was to further the knowledge of the functional abilities of memory CD8 T cells by examining how the proliferation capacity and memory generation potential of naïve CD8 T cells compares to memory CD8 T cells. Through this work we were able to describe the population dynamics of naïve and memory CD8 T cells after Ag encounter. Naïve CD8 T cells were found to undergo higher magnitudes of expansion than memory CD8 T cells. This was due to increased proliferation of naïve CD8 T cells rather than increased death of memory CD8 T cells, and cells of the primary response were found in higher numbers in multiple organs at the
91 81 peak of the response. During contraction, cells of the secondary response were transiently found in higher numbers than primary cells, suggesting that the secondary response undergoes delayed contraction [30-34]. However, at later time-points after resolution of secondary contraction, primary cells were found in higher numbers than secondary cells in multiple organs, and primary memory cells were found to be better maintained through basal proliferation. This suggests that naïve cells have a higher memory generation potential than primary memory cells. Recent work has shown that the proliferation capacity and memory generation of multiply stimulated cells decreases with each additional Ag-encounter while contraction becomes further prolonged [32]. However, before this work it was not known how the proliferation and memory generation of naïve CD8 T cells compares to primary memory CD8 T cells. This work bridges that knowledge gap and suggests that the proliferation capacity and memory generation potential of CD8 T cells is reduced immediately after the first Ag encounter while contraction becomes increasingly prolonged (Figure 22- model). This provides interesting insight into the functionality of CD8 T cell memory and is an important consideration when implementing booster strategies aimed at increasing the overall numbers of Ag-specific CD8 T cells. Additionally, studies have shown that memory differentiation can be manipulated and that the generation of memory capable of undergoing vigorous secondary proliferation in response to Ag can be accelerated. Studies using peptide-dc immunizations where priming occurs in the absence of systemic inflammation have shown that the time required for naïve CD8 T cells to differentiate into cells with phenotypic and functional characteristics of memory including the ability to undergo vigorous secondary expansion is dramatically reduced [17, 36, 37, 40]. Additionally, studies where the duration of infection was shortened through antibiotic pre-treatment showed that the time required for cells to develop memory characteristics and the ability to undergo vigorous secondary expansion was decreased [5, 17, 36, 40]. However, a
92 82 complete understanding of the process of memory differentiation is lacking, and there are likely additional instances in which memory differentiation and the generation of memory CD8 T cells capable of vigorous proliferation after Ag re-encounter can be hastened. Memory CD8 T cell responses decrease the duration of infection and likely reduce the levels of inflammatory cytokines present during infection [5, 17]. Therefore it is possible that, the differentiation of naïve CD8 T cells in the presence of memory is affected. Thus, a second focus of this thesis was to come to a better understanding of the factors affecting memory differentiation by examining the differentiation of naïve CD8 T cells in the presence of an on-going memory response. We found that naïve CD8 T cells primed in the presence of memory CD8 T cells of the same or unrelated specificity progressed to cells with a late memory phenotype and functions including localization, cytokine production and the ability to undergo more vigorous secondary expansion. This has direct implications for anti-vectorial immunity where naïve CD8 T cells are being primed in the presence of a memory response to the vaccination vector. Additionally, this work presents another instance where the time required for memory progression is shortened and provides further insight into the process of memory differentiation. Future Directions The primary goals of this project were to determine the proliferation capacity and memory generation potential of naïve CD8 T cells compared to memory CD8 T cells and to determine how pre-existing memory affects the differentiation of naïve CD8 T cells. We found that naïve CD8 T cells have a greater potential to proliferate and form memory than primary memory CD8 T cells and that naïve CD8 T cells primed in the presence of memory progress to memory possessing late memory phenotypic and functional attributes faster. However, there are several questions that remain to be
93 83 addressed, and future experiments will be aimed at further characterizing memory CD8 T cells. They include: 1. Extending the analysis of population dynamics of naïve and memory CD8 T cells to other cell types and to generations of memory cells beyond primary memory (i.e. secondary, tertiary, etc.). Co-transfer experiments similar to the ones described in chapter II will be conducted using P14 cells as well as with memory CD8 T cells that have been generated after multiple exposures to Ag. 2. Further analysis of the impact of pre-existing memory on the differentiation of newly recruited naïve CD8 T cells. This will include determining the extent to which inflammation or Ag-persistence are influencing the differentiation of naïve CD8 T cells in the presence of memory. The presence of inflammatory cytokines in the serum of mice after secondary infection will be tested to determine if there is a difference in the inflammatory milieu of mice with or without memory to the vaccination vector. Additionally, the differentiation of naïve CD8 T cells in the presence of memory will be explored under conditions where Ag availability is different in mice containing or lacking memory but the level of systemic inflammation is the same, or where the Ag levels are the same but the level of inflammatory cytokines is different in mice with or without memory to the vaccination vector. Additional experimentation will be aimed at exploring how the differentiation of naïve CD8 T cells in the presence of memory can be manipulated. How the naïve response in the presence of memory is affected by the addition of systemic inflammation through the administration of CpG is one area of exploration. 3. Determine how time affects memory CD8 T cells. We began to explore this question with the data showed in figures 12 and 13 by looking at how time changes the phenotypic qualities of memory populations and their ability to
94 84 undergo proliferative expansion after Ag re-encounter. How time affects memory CD8 T cells is an interesting and important question as for some infections, it is likely that years could pass before re-encountering Ag after a primary infection or after vaccination. Thus, we plan to explore this question in detail in the years to come. Additional functional differences between memory CD8 T cells generated a short time after infection (30-45 days) (earlym) and cells that remain for a long period of time after infection (>200 days) (latem) will be explored. Experiments will be conducted to determine differences in localization, the production of cytokines and cytolytic molecules, the ability of earlym and latem cells to kill infected cells, differences in protection offered by earlym and latem, and their ability to undergo basal proliferation. To explore the molecular changes that occur in memory CD8 T cells over time, earlym and latem CD8 T cells will be sorted, and microarray analysis will be performed. Genes that are differentially expressed in earlym and latem CD8 T cells will be determined as well as the cellular processes that these genes are involved in. During this analysis it is anticipated that several interesting genes that are differently expressed in earlym and latem cells will be discovered. One or two of these genes will be selected for further analysis using knockout mice or gene knockdown procedures to examine how these genes affect the functions of earlym and latem CD8 T cells. Additionally, how the heterogeneity of memory populations differs in earlym and latem CD8 T cells will be explored as well as differences in the phenotypic properties and functional abilities of subpopulations (based on the expression of CD62L) of earlym and latem CD8 T cells. Multi-color flow cytometry will be performed looking at the expression of multiple surface markers on earlym and latem cells to explore how time affects the heterogeneity
95 85 of memory populations. To explore how time affects subpopulations of CD8 T cells, earlym and latem cells will be sorted on cells expressing or not expressing the well-studied CD62L surface marker. Microarray analysis will be performed and differences in gene expression of CD62L expressing and non-expressing earlym and latem cells will be analyzed. Interesting genes that are differentially expressed within these populations will be explored in further detail. Additionally, the functional abilities of CD62L expressing and non-expressing earlym and latem cells will be examined including: the ability of these cells to undergo proliferative expansion, differences in localization of these cells, differences in the production of cytokines and cytolytic molecules, differences in killing of infected cells, differences in protective capacity of these cells, and differences in the ability of these cells to undergo basal proliferation.
96 86 Figure 22 Population dynamics of primary and multiply stimulated CD8 T cell responses after infection or vaccination a model. A) After antigen encounter, naïve and multiply stimulated memory CD8 T cells undergo proliferative expansion. However, the proliferation capacity of memory CD8 T cells is reduced compared to naïve CD8 T cells starting with the initial antigen encounter. Proliferation potential of memory CD8 T cells is further reduced with each additional antigen encounter. The duration of contraction increases progressively after each antigen encounter. However, the ability of memory to be maintained decreases after each antigen encounter, and the memory generation potential progressively decreases in multiply stimulated memory CD8 T cells.
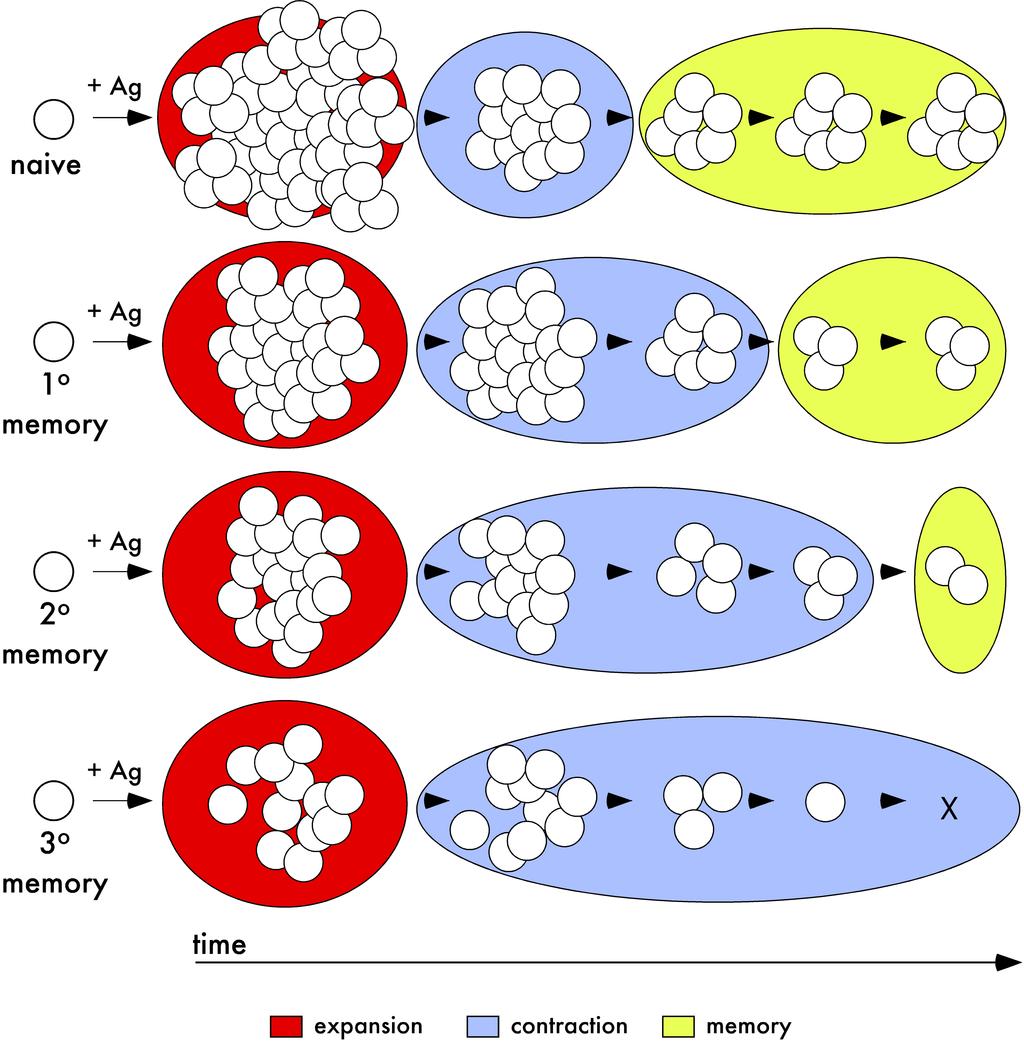
97 87
Tracking total polyclonal CD8 T cell responses in inbred and outbred hosts after infection
 University of Iowa Iowa Research Online Theses and Dissertations 2010 Tracking total polyclonal CD8 T cell responses in inbred and outbred hosts after infection Deepa Kumari Rai University of Iowa Copyright
SUPPLEMENTARY INFORMATION
 Complete but curtailed T-cell response to very-low-affinity antigen Dietmar Zehn, Sarah Y. Lee & Michael J. Bevan Supp. Fig. 1: TCR chain usage among endogenous K b /Ova reactive T cells. C57BL/6 mice
Micro 204. Cytotoxic T Lymphocytes (CTL) Lewis Lanier
 Lewis Lanier") Micro 204 Cytotoxic T Lymphocytes (CTL) Lewis Lanier Lewis.Lanier@ucsf.edu Lymphocyte-mediated Cytotoxicity CD8 + αβ-tcr + T cells CD4 + αβ-tcr + T cells γδ-tcr + T cells Natural Killer cells CD8 + αβ-tcr
Micro 204 Cytotoxic T Lymphocytes (CTL) Lewis Lanier Lewis.Lanier@ucsf.edu Lymphocyte-mediated Cytotoxicity CD8 + αβ-tcr + T cells CD4 + αβ-tcr + T cells γδ-tcr + T cells Natural Killer cells CD8 + αβ-tcr
T-cell activation T cells migrate to secondary lymphoid tissues where they interact with antigen, antigen-presenting cells, and other lymphocytes:
 Interactions between innate immunity & adaptive immunity What happens to T cells after they leave the thymus? Naïve T cells exit the thymus and enter the bloodstream. If they remain in the bloodstream,
General Overview of Immunology. Kimberly S. Schluns, Ph.D. Associate Professor Department of Immunology UT MD Anderson Cancer Center
 General Overview of Immunology Kimberly S. Schluns, Ph.D. Associate Professor Department of Immunology UT MD Anderson Cancer Center Objectives Describe differences between innate and adaptive immune responses
Effector mechanisms of cell-mediated immunity: Properties of effector, memory and regulatory T cells
 ICI Basic Immunology course Effector mechanisms of cell-mediated immunity: Properties of effector, memory and regulatory T cells Abul K. Abbas, MD UCSF Stages in the development of T cell responses: induction
Chapter 22: The Lymphatic System and Immunity
 Bio40C schedule Lecture Immune system Lab Quiz 2 this week; bring a scantron! Study guide on my website (see lab assignments) Extra credit Critical thinking questions at end of chapters 5 pts/chapter Due
The Adaptive Immune Response. B-cells
 The Adaptive Immune Response B-cells The innate immune system provides immediate protection. The adaptive response takes time to develop and is antigen specific. Activation of B and T lymphocytes Naive
The Adaptive Immune Responses
 The Adaptive Immune Responses The two arms of the immune responses are; 1) the cell mediated, and 2) the humoral responses. In this chapter we will discuss the two responses in detail and we will start
ACTIVATION AND EFFECTOR FUNCTIONS OF CELL-MEDIATED IMMUNITY AND NK CELLS. Choompone Sakonwasun, MD (Hons), FRCPT
, FRCPT") ACTIVATION AND EFFECTOR FUNCTIONS OF CELL-MEDIATED IMMUNITY AND NK CELLS Choompone Sakonwasun, MD (Hons), FRCPT Types of Adaptive Immunity Types of T Cell-mediated Immune Reactions CTLs = cytotoxic T lymphocytes
ACTIVATION AND EFFECTOR FUNCTIONS OF CELL-MEDIATED IMMUNITY AND NK CELLS Choompone Sakonwasun, MD (Hons), FRCPT Types of Adaptive Immunity Types of T Cell-mediated Immune Reactions CTLs = cytotoxic T lymphocytes
Lineage relationship and protective immunity of memory CD8 T cell subsets
 23 Nature Publishing Group http://www.nature.com/natureimmunology Lineage relationship and protective immunity of memory CD8 T cell subsets E. John Wherry 1 *,Volker Teichgräber 1 *,Todd C. Becker 1,David
T cell memory Friday, February 10, 17
 T cell memory 2-10-2017 expansion contraction memory recall EFFECTORS 10 6 pathogen load secondary challenge MEMORY 10 2 NAIVE 2 7-8 30 >1 year days post-infection In mouse, ~100 naïve, CD8s become ~3x10
Adaptive immune responses: T cell-mediated immunity
 MICR2209 Adaptive immune responses: T cell-mediated immunity Dr Allison Imrie allison.imrie@uwa.edu.au 1 Synopsis: In this lecture we will discuss the T-cell mediated immune response, how it is activated,
ACTIVATION OF T LYMPHOCYTES AND CELL MEDIATED IMMUNITY
 ACTIVATION OF T LYMPHOCYTES AND CELL MEDIATED IMMUNITY The recognition of specific antigen by naïve T cell induces its own activation and effector phases. T helper cells recognize peptide antigens through
MATERIALS AND METHODS. Neutralizing antibodies specific to mouse Dll1, Dll4, J1 and J2 were prepared as described. 1,2 All
 MATERIALS AND METHODS Antibodies (Abs), flow cytometry analysis and cell lines Neutralizing antibodies specific to mouse Dll1, Dll4, J1 and J2 were prepared as described. 1,2 All other antibodies used
Defensive mechanisms include :
 Acquired Immunity Defensive mechanisms include : 1) Innate immunity (Natural or Non specific) 2) Acquired immunity (Adaptive or Specific) Cell-mediated immunity Humoral immunity Two mechanisms 1) Humoral
Dendritic cells in cancer immunotherapy Aimin Jiang
 Dendritic cells in cancer immunotherapy Aimin Jiang Feb. 11, 2014 Dendritic cells at the interface of innate and adaptive immune responses Dendritic cells: initiators of adaptive immune responses Dendritic
Therapeutic PD L1 and LAG 3 blockade rapidly clears established blood stage Plasmodium infection
 Supplementary Information Therapeutic PD L1 and LAG 3 blockade rapidly clears established blood stage Plasmodium infection Noah S. Butler, Jacqueline Moebius, Lecia L. Pewe, Boubacar Traore, Ogobara K.
Blocking antibodies and peptides. Rat anti-mouse PD-1 (29F.1A12, rat IgG2a, k), PD-
, PD-") Supplementary Methods Blocking antibodies and peptides. Rat anti-mouse PD-1 (29F.1A12, rat IgG2a, k), PD- L1 (10F.9G2, rat IgG2b, k), and PD-L2 (3.2, mouse IgG1) have been described (24). Anti-CTLA-4 (clone
Supplementary Methods Blocking antibodies and peptides. Rat anti-mouse PD-1 (29F.1A12, rat IgG2a, k), PD- L1 (10F.9G2, rat IgG2b, k), and PD-L2 (3.2, mouse IgG1) have been described (24). Anti-CTLA-4 (clone
Supplementary Materials for
 immunology.sciencemag.org/cgi/content/full/2/16/eaan6049/dc1 Supplementary Materials for Enzymatic synthesis of core 2 O-glycans governs the tissue-trafficking potential of memory CD8 + T cells Jossef
1. Overview of Adaptive Immunity
 Chapter 17A: Adaptive Immunity Part I 1. Overview of Adaptive Immunity 2. T and B Cell Production 3. Antigens & Antigen Presentation 4. Helper T cells 1. Overview of Adaptive Immunity The Nature of Adaptive
Time-dependent alterations in memory CD8 T cell function after infection
 University of Iowa Iowa Research Online Theses and Dissertations Spring 2016 Time-dependent alterations in memory CD8 T cell function after infection Matthew David Martin University of Iowa Copyright 2016
Third line of Defense
 Chapter 15 Specific Immunity and Immunization Topics -3 rd of Defense - B cells - T cells - Specific Immunities Third line of Defense Specific immunity is a complex interaction of immune cells (leukocytes)
ABSTRACT. Title of Document: GENERATING FUNCTIONAL CYTOTOXIC T LYMPHOCYTES THROUGH REPETITIVE PEPTIDE BOOSTING.
 ABSTRACT Title of Document: GENERATING FUNCTIONAL CYTOTOXIC T LYMPHOCYTES THROUGH REPETITIVE PEPTIDE BOOSTING. Kendra Nicole Smyth, Master of Science, 2012 Directed By: Assistant Professor Zhengguo Xiao,
Properties & Overview of IRs Dr. Nasser M. Kaplan JUST, Jordan. 10-Jul-16 NM Kaplan 1
 Properties & Overview of IRs Dr. Nasser M. Kaplan JUST, Jordan 10-Jul-16 NM Kaplan 1 Major components of IS & their properties Definitions IS = cells & molecules responsible for: 1- Physiologic; protective
Scott Abrams, Ph.D. Professor of Oncology, x4375 Kuby Immunology SEVENTH EDITION
 Scott Abrams, Ph.D. Professor of Oncology, x4375 scott.abrams@roswellpark.org Kuby Immunology SEVENTH EDITION CHAPTER 11 T-Cell Activation, Differentiation, and Memory Copyright 2013 by W. H. Freeman and
Cellular Immune response. Jianzhong Chen, Ph.D Institute of immunology, ZJU
 Cellular Immune response Jianzhong Chen, Ph.D Institute of immunology, ZJU Concept of adaptive immune response T cell-mediated adaptive immune response I. Concept of immune response A collective and coordinated
There are 2 major lines of defense: Non-specific (Innate Immunity) and. Specific. (Adaptive Immunity) Photo of macrophage cell
 and. Specific. (Adaptive Immunity) Photo of macrophage cell") There are 2 major lines of defense: Non-specific (Innate Immunity) and Specific (Adaptive Immunity) Photo of macrophage cell Development of the Immune System ery pl neu mφ nk CD8 + CTL CD4 + thy TH1 mye
There are 2 major lines of defense: Non-specific (Innate Immunity) and Specific (Adaptive Immunity) Photo of macrophage cell Development of the Immune System ery pl neu mφ nk CD8 + CTL CD4 + thy TH1 mye
NK cell flow cytometric assay In vivo DC viability and migration assay
 NK cell flow cytometric assay 6 NK cells were purified, by negative selection with the NK Cell Isolation Kit (Miltenyi iotec), from spleen and lymph nodes of 6 RAG1KO mice, injected the day before with
Question 1. Kupffer cells, microglial cells and osteoclasts are all examples of what type of immune system cell?
 Abbas Chapter 2: Sarah Spriet February 8, 2015 Question 1. Kupffer cells, microglial cells and osteoclasts are all examples of what type of immune system cell? a. Dendritic cells b. Macrophages c. Monocytes
Cell Mediated Immunity CELL MEDIATED IMMUNITY. Basic Elements of Cell Mediated Immunity (CMI) Antibody-dependent cell-mediated cytotoxicity (ADCC)
 Antibody-dependent cell-mediated cytotoxicity (ADCC)") Chapter 16 CELL MEDIATED IMMUNITY Cell Mediated Immunity Also known as Cellular Immunity or CMI The effector phase T cells Specificity for immune recognition reactions TH provide cytokines CTLs do the
Chapter 16 CELL MEDIATED IMMUNITY Cell Mediated Immunity Also known as Cellular Immunity or CMI The effector phase T cells Specificity for immune recognition reactions TH provide cytokines CTLs do the
Immune response. This overview figure summarizes simply how our body responds to foreign molecules that enter to it.
 Immune response This overview figure summarizes simply how our body responds to foreign molecules that enter to it. It s highly recommended to watch Dr Najeeb s lecture that s titled T Helper cells and
Antigen Presentation and T Lymphocyte Activation. Abul K. Abbas UCSF. FOCiS
 1 Antigen Presentation and T Lymphocyte Activation Abul K. Abbas UCSF FOCiS 2 Lecture outline Dendritic cells and antigen presentation The role of the MHC T cell activation Costimulation, the B7:CD28 family
Signal 3 requirement for memory CD8 1 T-cell activation is determined by the infectious pathogen
 3176 DOI 1.12/eji.21141537 Eur. J. Immunol. 211. 41: 3176 3186 Signal 3 requirement for memory CD8 1 T-cell activation is determined by the infectious pathogen Selina J. Keppler 1,2 and Peter Aichele 1
Chapter 13 Lymphatic and Immune Systems
 The Chapter 13 Lymphatic and Immune Systems 1 The Lymphatic Vessels Lymphoid Organs Three functions contribute to homeostasis 1. Return excess tissue fluid to the bloodstream 2. Help defend the body against
Supplementary Figure 1. Characterization of basophils after reconstitution of SCID mice
 Supplementary figure legends Supplementary Figure 1. Characterization of after reconstitution of SCID mice with CD4 + CD62L + T cells. (A-C) SCID mice (n = 6 / group) were reconstituted with 2 x 1 6 CD4
Immunity and Infection. Chapter 17
 Immunity and Infection Chapter 17 The Chain of Infection Transmitted through a chain of infection (six links) Pathogen: Disease causing microorganism Reservoir: Natural environment of the pathogen Portal
Medical Virology Immunology. Dr. Sameer Naji, MB, BCh, PhD (UK) Head of Basic Medical Sciences Dept. Faculty of Medicine The Hashemite University
 Head of Basic Medical Sciences Dept. Faculty of Medicine The Hashemite University") Medical Virology Immunology Dr. Sameer Naji, MB, BCh, PhD (UK) Head of Basic Medical Sciences Dept. Faculty of Medicine The Hashemite University Human blood cells Phases of immune responses Microbe Naïve
Medical Virology Immunology Dr. Sameer Naji, MB, BCh, PhD (UK) Head of Basic Medical Sciences Dept. Faculty of Medicine The Hashemite University Human blood cells Phases of immune responses Microbe Naïve
chapter 17: specific/adaptable defenses of the host: the immune response
 chapter 17: specific/adaptable defenses of the host: the immune response defense against infection & illness body defenses innate/ non-specific adaptable/ specific epithelium, fever, inflammation, complement,
The Immune System. These are classified as the Innate and Adaptive Immune Responses. Innate Immunity
 The Immune System Biological mechanisms that defend an organism must be 1. triggered by a stimulus upon injury or pathogen attack 2. able to counteract the injury or invasion 3. able to recognise foreign
PBS Class #2 Introduction to the Immune System part II Suggested reading: Abbas, pgs , 27-30
 PBS 803 - Class #2 Introduction to the Immune System part II Suggested reading: Abbas, pgs. 15-25, 27-30 Learning Objectives Compare and contrast the maturation of B and T lymphocytes Compare and contrast
Prof. Ibtesam Kamel Afifi Professor of Medical Microbiology & Immunology
 By Prof. Ibtesam Kamel Afifi Professor of Medical Microbiology & Immunology Lecture objectives: At the end of the lecture you should be able to: Enumerate features that characterize acquired immune response
The Immune System: Innate and Adaptive Body Defenses Outline PART 1: INNATE DEFENSES 21.1 Surface barriers act as the first line of defense to keep
 The Immune System: Innate and Adaptive Body Defenses Outline PART 1: INNATE DEFENSES 21.1 Surface barriers act as the first line of defense to keep invaders out of the body (pp. 772 773; Fig. 21.1; Table
Page 4: Antigens: Self-Antigens The body has a vast number of its own antigens called self-antigens. These normally do not trigger immune responses.
 Common Characteristics of B and T Lymphocytes Graphics are used with permission of Pearson Education Inc., publishing as Benjamin Cummings (http://www.aw-bc.com). Page 1: Introduction While B and T lymphocytes
M.Sc. III Semester Biotechnology End Semester Examination, 2013 Model Answer LBTM: 302 Advanced Immunology
 Code : AS-2246 M.Sc. III Semester Biotechnology End Semester Examination, 2013 Model Answer LBTM: 302 Advanced Immunology A. Select one correct option for each of the following questions:- 2X10=10 1. (b)
I. Lines of Defense Pathogen: Table 1: Types of Immune Mechanisms. Table 2: Innate Immunity: First Lines of Defense
 I. Lines of Defense Pathogen: Table 1: Types of Immune Mechanisms Table 2: Innate Immunity: First Lines of Defense Innate Immunity involves nonspecific physical & chemical barriers that are adapted for
TCR, MHC and coreceptors
 Cooperation In Immune Responses Antigen processing how peptides get into MHC Antigen processing involves the intracellular proteolytic generation of MHC binding proteins Protein antigens may be processed
Introduction to Immunology Part 2 September 30, Dan Stetson
 Introduction to Immunology Part 2 September 30, 2016 Dan Stetson stetson@uw.edu 441 Lecture #2 Slide 1 of 26 CLASS ANNOUNCEMENT PLEASE NO TREE NUTS IN CLASS!!! (Peanuts, walnuts, almonds, cashews, etc)
IL-15 regulates memory CD8 + T cell O-glycan synthesis and affects trafficking
 Research article IL-15 regulates memory CD8 + T cell O-glycan synthesis and affects trafficking Jeffrey C. Nolz 1 and John T. Harty 1,2,3 1 Department of Microbiology, 2 Department of Pathology, and 3
Third line of Defense. Topic 8 Specific Immunity (adaptive) (18) 3 rd Line = Prophylaxis via Immunization!
 (18) 3 rd Line = Prophylaxis via Immunization!") Topic 8 Specific Immunity (adaptive) (18) Topics - 3 rd Line of Defense - B cells - T cells - Specific Immunities 1 3 rd Line = Prophylaxis via Immunization! (a) A painting of Edward Jenner depicts a cow
Topic 8 Specific Immunity (adaptive) (18) Topics - 3 rd Line of Defense - B cells - T cells - Specific Immunities 1 3 rd Line = Prophylaxis via Immunization! (a) A painting of Edward Jenner depicts a cow
Adaptive Immunity: Humoral Immune Responses
 MICR2209 Adaptive Immunity: Humoral Immune Responses Dr Allison Imrie 1 Synopsis: In this lecture we will review the different mechanisms which constitute the humoral immune response, and examine the antibody
Regulation of memory CD8 T cell differentiation
 University of Iowa Iowa Research Online Theses and Dissertations Spring 2011 Regulation of memory CD8 T cell differentiation Nhat-Long Lam Pham University of Iowa Copyright 2011 Nhat-Long Lam Pham This
Chapter 24 The Immune System
 Chapter 24 The Immune System The Immune System Layered defense system The skin and chemical barriers The innate and adaptive immune systems Immunity The body s ability to recognize and destroy specific
B and T cell Memory. Bengt Lindbom Adap6ve Immunity BMC D14
 B and T cell Memory Bengt Lindbom Adap6ve Immunity BMC D14 Immunity: a historical perspec6ve 430 B.C. Thucydides describes the ongoing plague of Athens:.the same man was never attacked twice 15th century:
Supplementary Figure S1. PTPN2 levels are not altered in proliferating CD8+ T cells. Lymph node (LN) CD8+ T cells from C57BL/6 mice were stained with
 CD8+ T cells from C57BL/6 mice were stained with") Supplementary Figure S1. PTPN2 levels are not altered in proliferating CD8+ T cells. Lymph node (LN) CD8+ T cells from C57BL/6 mice were stained with CFSE and stimulated with plate-bound α-cd3ε (10µg/ml)
Supplementary Figure S1. PTPN2 levels are not altered in proliferating CD8+ T cells. Lymph node (LN) CD8+ T cells from C57BL/6 mice were stained with CFSE and stimulated with plate-bound α-cd3ε (10µg/ml)
Supplemental Table I.
 Supplemental Table I Male / Mean ± SEM n Mean ± SEM n Body weight, g 29.2±0.4 17 29.7±0.5 17 Total cholesterol, mg/dl 534.0±30.8 17 561.6±26.1 17 HDL-cholesterol, mg/dl 9.6±0.8 17 10.1±0.7 17 Triglycerides,
Scott Abrams, Ph.D. Professor of Oncology, x4375 Kuby Immunology SEVENTH EDITION
 Scott Abrams, Ph.D. Professor of Oncology, x4375 scott.abrams@roswellpark.org Kuby Immunology SEVENTH EDITION CHAPTER 13 Effector Responses: Cell- and Antibody-Mediated Immunity Copyright 2013 by W. H.
Tolerance, autoimmunity and the pathogenesis of immunemediated inflammatory diseases. Abul K. Abbas UCSF
 Tolerance, autoimmunity and the pathogenesis of immunemediated inflammatory diseases Abul K. Abbas UCSF Balancing lymphocyte activation and control Activation Effector T cells Tolerance Regulatory T cells
Defense mechanism against pathogens
 Defense mechanism against pathogens Immune System What is immune system? Cells and organs within an animal s body that contribute to immune defenses against pathogens ( ) Bacteria -Major entry points ;open
Acquired Immunity Cells are initially and require before they can work Responds to individual microbes
 1 of 10 THE IMMUNE SYSTEM CHAPTER 43; PAGES 898 921 WHY DO WE NEED AN IMMUNE SYSTEM? It s a dirty, dirty world out there and we are vastly outnumbered Bacteria and parasites are everywhere The body has
NK1.1 þ CD8 þ T cells escape TGF-b control and contribute to early microbial pathogen response
 Received 24 Apr 214 Accepted 5 Sep 214 Published 6 Oct 214 DOI: 1.138/ncomms615 NK1.1 þ CD8 þ T cells escape TGF-b control and contribute to early microbial pathogen response Anne L. Ruiz 1,2,3,4, Saidi
LESSON 2: THE ADAPTIVE IMMUNITY
 Introduction to immunology. LESSON 2: THE ADAPTIVE IMMUNITY Today we will get to know: The adaptive immunity T- and B-cells Antigens and their recognition How T-cells work 1 The adaptive immunity Unlike
5/1/13. The proportion of thymus that produces T cells decreases with age. The cellular organization of the thymus
 T cell precursors migrate from the bone marrow via the blood to the thymus to mature 1 2 The cellular organization of the thymus The proportion of thymus that produces T cells decreases with age 3 4 1
I. Critical Vocabulary
 I. Critical Vocabulary A. Immune System: a set of glands, tissues, cells, and dissolved proteins that combine to defend against non-self entities B. Antigen: any non-self chemical that triggers an immune
Memory NK cells during mousepox infection. Min Fang, Ph.D, Professor Institute of Microbiology, Chinese Academy of Science
 Memory NK cells during mousepox infection Min Fang, Ph.D, Professor Institute of Microbiology, Chinese Academy of Science Infectious Diseases are a Major Cause of Death Worldwide May 14 th 1796 Prevalence
Physiology Unit 3. ADAPTIVE IMMUNITY The Specific Immune Response
 Physiology Unit 3 ADAPTIVE IMMUNITY The Specific Immune Response In Physiology Today The Adaptive Arm of the Immune System Specific Immune Response Internal defense against a specific pathogen Acquired
Interferon γ regulates idiopathic pneumonia syndrome, a. Th17 + CD4 + T-cell-mediated GvH disease
 Interferon γ regulates idiopathic pneumonia syndrome, a Th17 + CD4 + T-cell-mediated GvH disease Nora Mauermann, Julia Burian, Christophe von Garnier, Stefan Dirnhofer, Davide Germano, Christine Schuett,
Inflammatory IL-15 is required for optimal memory T cell responses
 The Journal of Clinical Investigation Research article Inflammatory IL-15 is required for optimal memory T cell responses Martin J. Richer, 1 Lecia L. Pewe, 1 Lisa S. Hancox, 1 Stacey M. Hartwig, 1 Steven
Putting it Together. Stephen Canfield Secondary Lymphoid System. Tonsil Anterior Cervical LN s
 Putting it Together Stephen Canfield smc12@columbia.edu Secondary Lymphoid System Tonsil Anterior Cervical LN s Axillary LN s Mediastinal/Retroperitoneal LN s Thoracic Duct Appendix Spleen Inguinal LN
Nonspecific External Barriers skin, mucous membranes
 Immune system Chapter 36 BI 103 Plant-Animal A&P Levels of Defense Against Disease Nonspecific External Barriers skin, mucous membranes Physical barriers? Brainstorm with a partner If these barriers are
TITLE: MODULATION OF T CELL TOLERANCE IN A MURINE MODEL FOR IMMUNOTHERAPY OF PROSTATIC ADENOCARCINOMA
 AD Award Number: DAMD17-01-1-0085 TITLE: MODULATION OF T CELL TOLERANCE IN A MURINE MODEL FOR IMMUNOTHERAPY OF PROSTATIC ADENOCARCINOMA PRINCIPAL INVESTIGATOR: ARTHUR A HURWITZ, Ph.d. CONTRACTING ORGANIZATION:
Test Bank for Basic Immunology Functions and Disorders of the Immune System 4th Edition by Abbas
 Test Bank for Basic Immunology Functions and Disorders of the Immune System 4th Edition by Abbas Chapter 04: Antigen Recognition in the Adaptive Immune System Test Bank MULTIPLE CHOICE 1. Most T lymphocytes
IMMUNOLOGICAL MEMORY. CD4 T Follicular Helper Cells. Memory CD8 T Cell Differentiation
 IMMUNOLOGICAL MEMORY CD4 T Follicular Helper Cells Memory CD8 T Cell Differentiation CD4 T Cell Differentiation Bcl-6 T-bet GATA-3 ROR t Foxp3 CD4 T follicular helper (Tfh) cells FUNCTION Provide essential
Immunology. T-Lymphocytes. 16. Oktober 2014, Ruhr-Universität Bochum Karin Peters,
 Immunology T-Lymphocytes 16. Oktober 2014, Ruhr-Universität Bochum Karin Peters, karin.peters@rub.de The role of T-effector cells in the immune response against microbes cellular immunity humoral immunity
Supplementary Figures
 Supplementary Figures Supplementary Fig. 1. Surface thiol groups and reduction of activated T cells. (a) Activated CD8 + T-cells have high expression levels of free thiol groups on cell surface proteins.
Campbell's Biology: Concepts and Connections, 7e (Reece et al.) Chapter 24 The Immune System Multiple-Choice Questions
 Chapter 24 The Immune System Multiple-Choice Questions") Campbell's Biology: Concepts and Connections, 7e (Reece et al.) Chapter 24 The Immune System 24.1 Multiple-Choice Questions 1) The body's innate defenses against infection include A) several nonspecific
Campbell's Biology: Concepts and Connections, 7e (Reece et al.) Chapter 24 The Immune System 24.1 Multiple-Choice Questions 1) The body's innate defenses against infection include A) several nonspecific
Phenotypical and Functional Analysis of Peripheral T Cells in Foxn1 Transgenic Mice: Effects of Aging
 Loyola University Chicago Loyola ecommons Master's Theses Theses and Dissertations 2010 Phenotypical and Functional Analysis of Peripheral T Cells in Foxn1 Transgenic Mice: Effects of Aging Paulette Krishack
WHY IS THIS IMPORTANT?
 CHAPTER 16 THE ADAPTIVE IMMUNE RESPONSE WHY IS THIS IMPORTANT? The adaptive immune system protects us from many infections The adaptive immune system has memory so we are not infected by the same pathogen
Antigen capture and presentation to T lymphocytes
 Antigen capture and presentation to T lymphocytes What T lymphocytes see Innate Immunity Immediately available or Very broad specificity rapidly recruited Adaptive Immunity Rare and naïve cells require
Effector Mechanisms of Cell-Mediated Immunity
 Effector Mechanisms of Cell-Mediated Immunity Dr. Julia Rempel Section of Hepatology 789-3825 jdrempel@cc.umanitoba.ca 804D JBRC Topics: I. Types of Cell-Mediated Immunity II. Migration of Effector T Lymphocytes
Shiv Pillai Ragon Institute, Massachusetts General Hospital Harvard Medical School
 CTLs, Natural Killers and NKTs 1 Shiv Pillai Ragon Institute, Massachusetts General Hospital Harvard Medical School CTL inducing tumor apoptosis 3 Lecture outline CD8 + Cytotoxic T lymphocytes (CTL) Activation/differentiation
Immunological memory.
 Chapter 11: Dynamics of Adaptive Immunity the answers will lie in the cytokines produced by the environment and by the T cells themselves, and in the affinity of the T-cell receptors for their antigens.
T cell maturation. T-cell Maturation. What allows T cell maturation?
 T-cell Maturation What allows T cell maturation? Direct contact with thymic epithelial cells Influence of thymic hormones Growth factors (cytokines, CSF) T cell maturation T cell progenitor DN DP SP 2ry
Adaptive Immunity: Specific Defenses of the Host
 17 Adaptive Immunity: Specific Defenses of the Host SLOs Differentiate between innate and adaptive immunity, and humoral and cellular immunity. Define antigen, epitope, and hapten. Explain the function
Supplemental Information. Gut Microbiota Promotes Hematopoiesis to Control Bacterial Infection. Cell Host & Microbe, Volume 15
 Cell Host & Microbe, Volume 15 Supplemental Information Gut Microbiota Promotes Hematopoiesis to Control Bacterial Infection Arya Khosravi, Alberto Yáñez, Jeremy G. Price, Andrew Chow, Miriam Merad, Helen
Adaptive Immune System
 Short Course on Immunology Adaptive Immune System Bhargavi Duvvuri Ph.D IIIrd Year (Immunology) bhargavi@yorku.ca Supervisor Dr.Gillian E Wu Professor, School of Kinesiology and Health Sciences York University,
Immune System AP SBI4UP
 Immune System AP SBI4UP TYPES OF IMMUNITY INNATE IMMUNITY ACQUIRED IMMUNITY EXTERNAL DEFENCES INTERNAL DEFENCES HUMORAL RESPONSE Skin Phagocytic Cells CELL- MEDIATED RESPONSE Mucus layer Antimicrobial
Immune Regulation and Tolerance
 Immune Regulation and Tolerance Immunoregulation: A balance between activation and suppression of effector cells to achieve an efficient immune response without damaging the host. Activation (immunity)
NOTES: CH 43, part 1 The Immune System - Nonspecific & Specific Defenses ( )
") NOTES: CH 43, part 1 The Immune System - Nonspecific & Specific Defenses (43.1-43.2) The lymphatic system is closely associated with the cardiovascular system. LYMPHATIC PATHWAYS Lymphatic capillaries
NOTES: CH 43, part 1 The Immune System - Nonspecific & Specific Defenses (43.1-43.2) The lymphatic system is closely associated with the cardiovascular system. LYMPHATIC PATHWAYS Lymphatic capillaries
Supporting Information
 Supporting Information Valkenburg et al. 10.1073/pnas.1403684111 SI Materials and Methods ELISA and Microneutralization. Sera were treated with Receptor Destroying Enzyme II (RDE II, Accurate) before ELISA
C. Incorrect! MHC class I molecules are not involved in the process of bridging in ADCC.
 Immunology - Problem Drill 13: T- Cell Mediated Immunity Question No. 1 of 10 1. During Antibody-dependent cell mediated cytotoxicity (ADCC), the antibody acts like a bridge between the specific antigen
Out-of-sequence signal 3 as a mechanism for virusinduced immune suppression of CD8 T cell responses
 University of Massachusetts Medical School escholarship@umms Open Access Articles Open Access Publications by UMMS Authors 9-25-2014 Out-of-sequence signal 3 as a mechanism for virusinduced immune suppression
The development of T cells in the thymus
 T cells rearrange their receptors in the thymus whereas B cells do so in the bone marrow. The development of T cells in the thymus The lobular/cellular organization of the thymus Immature cells are called
Cover Page. The handle holds various files of this Leiden University dissertation.
 Cover Page The handle http://hdl.handle.net/1887/23854 holds various files of this Leiden University dissertation. Author: Marel, Sander van der Title: Gene and cell therapy based treatment strategies
Acquired Immunity 2. - Vaccines & Immunological Memory - Wataru Ise. WPI Immunology Frontier Research Center (IFReC) Osaka University.
 Osaka University.") Acquired Immunity 2 - Vaccines & Immunological Memory - Wataru Ise WPI Immunology Frontier Research Center (IFReC) Osaka University Outline 1. What is vaccine (vaccination)? 2. What is immunological memory?
Acquired Immunity 2 - Vaccines & Immunological Memory - Wataru Ise WPI Immunology Frontier Research Center (IFReC) Osaka University Outline 1. What is vaccine (vaccination)? 2. What is immunological memory?
COURSE: Medical Microbiology, MBIM 650/720 - Fall TOPIC: Antigen Processing, MHC Restriction, & Role of Thymus Lecture 12
 COURSE: Medical Microbiology, MBIM 650/720 - Fall 2008 TOPIC: Antigen Processing, MHC Restriction, & Role of Thymus Lecture 12 FACULTY: Dr. Mayer Office: Bldg. #1, Rm B32 Phone: 733-3281 Email: MAYER@MED.SC.EDU
RAISON D ETRE OF THE IMMUNE SYSTEM:
 RAISON D ETRE OF THE IMMUNE SYSTEM: To Distinguish Self from Non-Self Thereby Protecting Us From Our Hostile Environment. Innate Immunity Acquired Immunity Innate immunity: (Antigen nonspecific) defense
Effector T Cells and
 1 Effector T Cells and Cytokines Andrew Lichtman, MD PhD Brigham and Women's Hospital Harvard Medical School 2 Lecture outline Cytokines Subsets of CD4+ T cells: definitions, functions, development New
Supplementary Figure 1. Efficient DC depletion in CD11c.DOG transgenic mice
 Supplementary Figure 1. Efficient DC depletion in CD11c.DOG transgenic mice (a) CD11c.DOG transgenic mice (tg) were treated with 8 ng/g body weight (b.w.) diphtheria toxin (DT) i.p. on day -1 and every