Pathologic Stage. Lymph node Stage
|
|
|
- Alban Doyle
- 5 years ago
- Views:
Transcription
 PBMC 8 23.7 N/A N/A PBMC 9 23.7 6 7 (4+3) PBMC 1 23.2 2 6 (3+3) PBMC 11 24.4 6 6 (3+3) PBMC 12 23.7 6 N/A PBMC 13 22. 6 9 (4+) PBMC 14 23.7 8 9 (+4) PBMC 1 23.3 76 1 (+) PBMC 16 24.")
 Obese Patient ID BMI Patient ID BMI Age Gleason score Obese PBMC 2 3. 73 N/A PBMC 26.9 6 7 (4+3) PBMC 27 34.3 68 N/A PBMC 28 31.8 2 N/A PBMC 29 3.6 8 N/A PBMC 3 31 N/A N/A PBMC 31 3.")
1 ASC ASC a c Patient ID BMI Age Gleason score Non-obese PBMC (3+3) PBMC (3+3) PBMC (4+4) PBMC (3+4) PBMC (3+3) PBMC (3+4) PBMC (3+4) PBMC N/A N/A PBMC (4+3) PBMC (3+3) PBMC (3+3) PBMC N/A PBMC (4+) PBMC (+4) PBMC (+) PBMC (4+) PBMC (3+4) PBMC (3+4) PBMC (3+) PBMC (4+4) PBMC PBMC (3+3) PBMC (4+3) PBMC (3+3) Obese Patient ID BMI Patient ID BMI Age Gleason score Obese PBMC N/A PBMC (4+3) PBMC N/A PBMC N/A PBMC N/A PBMC 3 31 N/A N/A PBMC (3+4) PBMC (4+) PBMC (4+4) PBMC (4+3) PBMC (3+3) PBMC (+4) PBMC N/A PBMC (3+4) PBMC (4+4) PBMC (+) PBMC (4+4) PBMC N/A PBMC N/A PBMC (4+3) PBMC N/A Clinical Stage Pathologic Stage Lymph node Stage Gleason Score ASC All cells All cells ASC MSC Tumor volume (cc) Age Race Progression Cd34b cells CPC Non-obese P (-) (-) (-) T1c pt2 pn 7 (3+4).48 6 W P (-) (-) (-) T1c pt2 pn 7 (4+3),.32 8 W P (-) (+) (+) T2c pt3a pn 7 (4+3), A P (-) (+) (+) T1c pt2 pn 7 (4+3) W P (-) (-) (+) T2a pt2 pn 6 (3+3).26 8 B P (-) (-) (+) T1c pt3a pn 7 (3+4) B P 37 2 (-) (-) (+) T2c pt3b pn 7 (3+4) W P (-) (-) (-) T2b pt3b pn 7 (4+3) W P (-) (-) (+) T2a pt2 pn 7 (3+4) W P (+) (-) (-) T1c pt2 pn 7 (3+4) W P (-) (+) (+) T2c pt3a pn 8 (4+4) A P (-) (+) (+) T1c pt2 pn 9 (4+) W P (-) (-) (-) T1c pt3a pn 7 (3+4) W P (-) (-) (+) T2b pt3a pn 9 (4+) 1. 8 W P (-) (-) (-) T1c pt2 pn 8 (4+4).34 7 B P (-) N/A (-) T1c pt2 pn 7 (4+3), W Obese P (+) (+) (-) T2a pt2 pn 7 (3+4) W P 3.3 (+) (-) (-) T1c pt2 pn 7 (3+4).44 6 W Biochemical recurrence P (+) (-) (-) T1c pt2 pn 7 (3+4) W P 8 31 (+) (+) (-) T2a pt2 pnx 7 (3+4) A P (+) (-) (+) T3b pt3b pn1 9 (4+) W P (+) (+) (+) T3a pt3a pn 9 (4+) H Biochemical recurrence P (+) (+) (+) T3a pt2 pn 9 (4+) W P (+) N/A (+) T1c pt2 pn 7 (3+4) W P (+) (+) (+) T1c pt2 pnx 7 (3+4).2 61 W P (+) (+) (+) T1c pt2 pnx 7 (3+4).6 1 W P (-) (+) (+) T1c pt2 pnx 7 (3+4) W P (+) (+) (-) T1c pt2 pnx 7 (3+4).9 42 W P (+) (+) (+) T3b pt3b pn1 9 (4+) 6. 3 H Death P (+) (+) (+) T2b pt2 pnx 7 (3+4) W P (+) (+) (-) T1c pt2 pn 7 (3+4).19 4 W P (+) (+) (-) T1c pt2 pn 7 (3+4).3 3 W P (+) (+) (-) T2a pt2 pn1 7 (3+4) 2. 3 B P 31 3 (-) (+) (-) T2a pt2 pn 7 (3+4) B P (+) (+) (+) T2a pt2 pn 7 (3+4) W P (+) (+) (+) T1c pt2 pn 7 (3+4).7 7 B P (+) (+) (-) T2c pt2 pn 7 (3+4) B P N/A N/A N/A T2b pt3a pn 8 (4+4) W Local recurrence P N/A N/A N/A T1c pt3b pn1 8 (4+4) W Biochemical recurrence Supplementary Figure 1 Characteristics of PC patients. (a) Patients who s PBMC were analyzed in Fig. 1a. (b) Flow cytometric gating of cells from a periprostatic (PP) WAT sample identifying CD34bCD4- CD31- ASC, CD34bCD4b leukocytes (LC), CD34dCD31bCD4- C, and CD34bCD31dCD4d CPC. b, bright, d, dim. Data are representative of three independent experiments. (c) Patients who s tissues were analyzed in Fig. 2a-c and Supplementary Fig. 2a-d,f. and expression in epithelium and expression in the stroma is scored as high (+) and low (-). N/A: data not available. pn1: pelvic lymph node metastasis. W: white, B: black, H: hispanic; A: asian.


 IF analysis of")

")
.")

 IF analysis of tumors")
 and")


 and")
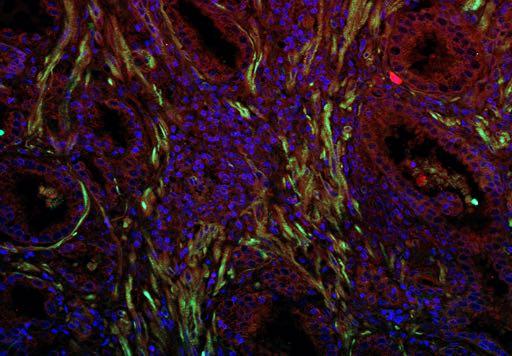
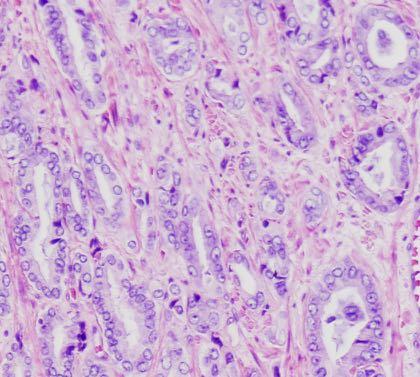
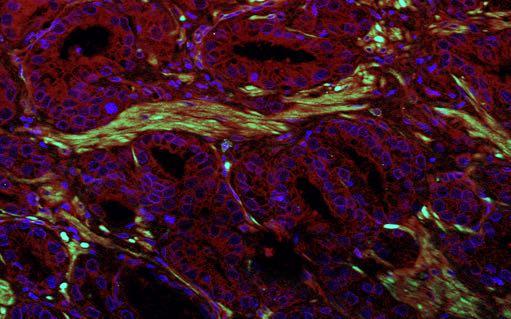
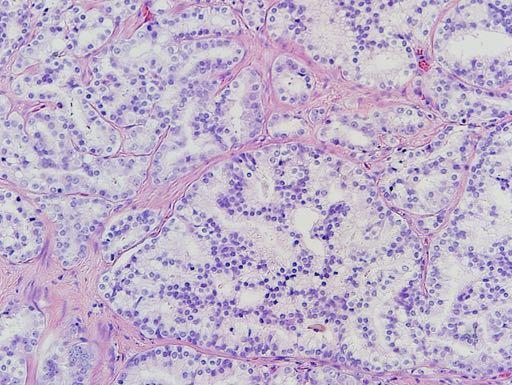
2 a b Lean, Non-malignant Obese, Non-malignant IB4 IB4 c Lean, low grade PC7 Lean, high grade Obese, low grade PC44 Obese, high grade PC1 PC28 H& d Lean, low grade Lean, high grade PC3 Obese, low grade Obese, high grade PC16 PC16 PC16 PC46 PC43 H1 Normal PC11 A11 Gleason 8, T4NM, Alive B11 Gleason 7, T4NM, Alive e H1 non-malignant, Alive C2 Gleason 9, T3bNM1, Dead F7 Gleason 9, T3bNM, Dead D11 Gleason 8, T3bNM, Dead f Lean, low grade CXCR2 IB4 PC36 Lean, high grade PC43 Obese, low grade PC28 Supplementary Figure 2 The CXCL-CXCR obesity axis. (a-b) IF analysis of non-malignant prostate areas of tumors from lean (a) and obese (b) patients with or antibodies (red) counterstained with or antibodies or IB4 (green). (c) Hematoxylin/eosin (H/) stainings of sections analyzed in Fig. 2a. (d) IF analysis of tumors from additional indicated patients with (red) and (green) antibodies. Insets: H/ staining of the area. (e) IF analysis of indicated cores from Biomax array HPro-Ade96Sur-1s with antibodies (red) and antibodies (green). (f) IF analysis of indicated human prostate tumor sections with CXCR2 antibodies (red) and endothelium-labeling IB4 (green). Arrowheads: endothelium. Arrows: stroma, : epithelium. Nuclei are blue. Scale bar (a-f): 1 µm. Data are representative of three independent experiments in a-d and f.
 (ng/ml) ASC 2 1 1 2 ymy ymy Reparixin c d - - - - - - - - + Protein concentra8on (ng/ml) PP ASC Macrophages 4 3 2 1 cxcl1 cxcl8 ab ab CXCR2 ab")
3 (ng/ml) (ng/ml) ASC ymy ymy Reparixin c d Protein concentra8on (ng/ml) PP ASC Macrophages cxcl1 cxcl8 ab ab CXCR2 ab CXCR2 ab Mouse 1 macrophages Macrophage 1 Human Human& monocytes Monocyte& & DU14 CM ab ab ab CXCR2 ab DU14 CM ab ab Supplementary Figure 3 Chemotaxis toward and. (a) Human PP ASC were subjected to trans-well chamber migration through 8 µm pores toward serum-free medium (-) supplemented (+) with increased indicated concentrations of and / or in the presence of reparixin where indicated. (b) Human ASC and immortalized mouse macrophages were subjected to migration toward serum-free medium (-) supplemented (+) with 1-2 ng/ml of or and neutralizing antibodies (ab) blocking or CXCR2. (c) and concentration in DU14 conditioned medium (CM) measured by LISA. (d) Human ASC, mouse macrophages and primary human PBMC-derived monocytes were subjected to migration toward DU14 CM. Where indicated CM was supplemented with neutralizing ab against,, or CXCR2. Plotted are relative numbers normalized to migration of cells towards 2% FBS set as 1%. Relative cell migration in the absence of CM was < %. p<. vs no-chemokine or no-antibody controls (Student s t-test). In all panels, graphs show mean ± s.e.m. for technical triplicates.
' \" 4\" 3\" 2\" 1\" \" - + BM HBM\"MSCs\" MSC SC HPC\"SC\"WAT\" ASC PP ASC HPC\"PP\"WAT\" BM MSC SC ASC PP")
 A representative flow cytometric analysis of MSC from mouse bone marrow (BM) and WAT stromal/vascular fraction")


4 BM MSC WAT SVF SSC.1% 7.2% Sca1 CD31 CD4 CD34 SSC % 6.% Rela%ve'migra%on'(%)' " 4" 3" 2" 1" " - + BM HBM"MSCs" MSC SC HPC"SC"WAT" ASC PP ASC HPC"PP"WAT" BM MSC SC ASC PP ASC Supplementary Figure 4 Bone marrow MSC are not subject to the - signaling. (a) A representative flow cytometric analysis of MSC from mouse bone marrow (BM) and WAT stromal/vascular fraction (SVF) showing the expression of on total and CD4-CD31- CD34+Sca1+ stromal cells. Arrows indicate subsequent gating steps. % of total viable cells is indicated. (b) Bone marrow-derived MSC from a cancer-free donor and ASC isolated from PP WAT of a non-obese prostate cancer patient were subjected to trans-well chamber migration toward medium with or without ng/ml. Plotted is relative migrated cells numbers normalized to migration of SC ASC toward 1% FBS set at 1%. Data represent mean ± s.e.m. for technical triplicates; P<.; P<.1 (Student s t-test) versus control (no ).
 2.3 MCP-1.19 MIP-1a.48! MIP-1b - MCSF.6 MIP-2.48 MIG.46 RANTS.86 VGF - TNFa - PO.91 xodus-2.76 MCP-.86 MIP-3b.76 MIP-3a.72 TARC.6 IL-16 1.34 Fractalkine.")
5 a b Analyte Obese / Lean Analyte Obese / Lean G-CSF 2. otaxin 1.71 GM-CSF - IFN-r - IL-1a.96 IL-1b.2 IL-2 - IL-4 - IL-3 - IL-.8 IL-6.92 IL-7.66 IL IL IL-12p4 1.9 IL-12p7.22 LIF - IL-13.6 LIX.93 IL IL-17 - IP-1.84 (KC) 2.3 MCP-1.19 MIP-1a.48! MIP-1b - MCSF.6 MIP-2.48 MIG.46 RANTS.86 VGF - TNFa - PO.91 xodus-2.76 MCP-.86 MIP-3b.76 MIP-3a.72 TARC.6 IL Fractalkine.88 IL-21 - IL IL IL-28b 1.12 MDC.62 IL IL TIMP IL-2 - IL-33-1! "! CXCR2 " c kda 7 37 β-actin CXCR2 2 Supplementary Figure Mouse chemokine and chemokine receptor analysis. (a) Activation of mouse in obesity / cancer. Plasma samples were collected from mice (n=/group) 11 weeks after subcutaneous ID8 cell grafting in to lean or obese mice. For each cytokine analyzed, presented are ratios of the mean plasma concentrations found for the indicated compared mouse groups. Highlighted are the Luminex panel analytes increased more than 2-fold in plasma of obese animals with tumors compared to lean animals with tumors. (-) analytes were undetectable in circulation. (b) Alignment of mouse and CXCR2 sequences with shrnas. Gene sequence alignment (starting at indicated nucleotide) shows the areas targeted by -sh and /2- sh. (c) Uncropped scans of the Western blotting (performed twice) shown in Fig. a.

 Proliferation (assessed by MTT assay) of RM1 cells in control medium (no ASC) or in medium conditioned by ASC isolated from SC and PP WAT of obese and non-obese prostate cancer patients.")
 Proliferation of RM1 cells in direct co-culture with GFP-labeled immortalized mouse ASC transduced with control-sh, -sh or /2-sh. Plotted are numbers of bnd.")
6 Relative RM1 cell number (%RFU) No ASC Non-obese SC Non-obese PP Obese SC Obese PP Control + Non-Obese +Non-Obese +Obese +Obese SC WAT PP WAT SC WAT PP WAT RM1 cell increase (fold) no ASC Control ASC -sh ASC /2-sh ASC days days 2 days 4 days 6 days c no ASC RM1 -sh ASC no ASC bnd3 -sh ASC Control ASC /2-sh ASC Control ASC /2-sh ASC Supplementary Figure 6 The effect of ASC on cancer cell growth. (a) Proliferation (assessed by MTT assay) of RM1 cells in control medium (no ASC) or in medium conditioned by ASC isolated from SC and PP WAT of obese and non-obese prostate cancer patients. Data represent mean ± s.e.m. for technical triplicates; P<.; P<.1 (Student s t-test) versus control (no WAT). (b) Proliferation of RM1 cells in direct co-culture with GFP-labeled immortalized mouse ASC transduced with control-sh, -sh or /2-sh. Plotted are numbers of bnd.3 (FITC-) cells collected after the indicated numbers of days. Data represent mean ± s.e.m. for technical triplicates. (c) Proliferation of RM1 and bnd3 (FITC-) cells in direct co-culture with GFP-labeled immortalized mouse ASC (FITC+) transduced with control-sh, -sh or /2- sh. Flow cytometry data post-fixation at day 8 of co-culture are shown. Data are representative of three independent experiments.
7 CXCR2 CXCR2 CXCR2 αsma Percent survival High Low Time (months) Supplementary Figure 7 / signaling and cancer progression. (a) A working model for mechanism of ASC trafficking in cancer. In vivo, ASC express / receptor and possibly CXCR2, expression of which in ASC is increased in cell culture. Obesityinduced secretion of and malignancy-induced secretion of by epithelial cancer cells creates chemokine gradients that enable ASC trafficking to tumors via /2. Upon recruitment of ASC to tumors, αsma expressed downstream of signaling mediates the pro-angiogenic effects of ASC that promote tumor growth. (b) A Kaplan Meier plot showing increased mortality in human prostate cancer patients with high expression of mrna (Z score >2) in the prostate. Based on data from
well for 2 h at rt. Each dot represents an individual mouse and bar is the mean ±
 Supplementary data: Control DC Blimp-1 ko DC 8 6 4 2-2 IL-1β p=.5 medium 8 6 4 2 IL-2 Medium p=.16 8 6 4 2 IL-6 medium p=.3 5 4 3 2 1-1 medium IL-1 n.s. 25 2 15 1 5 IL-12(p7) p=.15 5 IFNγ p=.65 4 3 2 1
Supplementary Figure 1. Deletion of Smad3 prevents B16F10 melanoma invasion and metastasis in a mouse s.c. tumor model.
 A B16F1 s.c. Lung LN Distant lymph nodes Colon B B16F1 s.c. Supplementary Figure 1. Deletion of Smad3 prevents B16F1 melanoma invasion and metastasis in a mouse s.c. tumor model. Highly invasive growth
Tbk1-TKO! DN cells (%)! 15! 10!
! 15! 10!") a! T Cells! TKO! B Cells! TKO! b! CD4! 8.9 85.2 3.4 2.88 CD8! Tbk1-TKO! 1.1 84.8 2.51 2.54 c! DN cells (%)! 4 3 2 1 DP cells (%)! 9 8 7 6 CD4 + SP cells (%)! 5 4 3 2 1 5 TKO! TKO! TKO! TKO! 15 1 5 CD8
a! T Cells! TKO! B Cells! TKO! b! CD4! 8.9 85.2 3.4 2.88 CD8! Tbk1-TKO! 1.1 84.8 2.51 2.54 c! DN cells (%)! 4 3 2 1 DP cells (%)! 9 8 7 6 CD4 + SP cells (%)! 5 4 3 2 1 5 TKO! TKO! TKO! TKO! 15 1 5 CD8
SUPPLEMENTARY INFORMATION
 DOI: 1.138/ncb3355 a S1A8 + cells/ total.1.8.6.4.2 b S1A8/?-Actin c % T-cell proliferation 3 25 2 15 1 5 T cells Supplementary Figure 1 Inter-tumoral heterogeneity of MDSC accumulation in mammary tumor
(a) Significant biological processes (upper panel) and disease biomarkers (lower panel)
 Significant biological processes (upper panel) and disease biomarkers (lower panel)") Supplementary Figure 1. Functional enrichment analyses of secretomic proteins. (a) Significant biological processes (upper panel) and disease biomarkers (lower panel) 2 involved by hrab37-mediated secretory
Supplementary Figure 1. Functional enrichment analyses of secretomic proteins. (a) Significant biological processes (upper panel) and disease biomarkers (lower panel) 2 involved by hrab37-mediated secretory
Suppl Video: Tumor cells (green) and monocytes (white) are seeded on a confluent endothelial
 and monocytes (white) are seeded on a confluent endothelial") Supplementary Information Häuselmann et al. Monocyte induction of E-selectin-mediated endothelial activation releases VE-cadherin junctions to promote tumor cell extravasation in the metastasis cascade
Supplementary Information Häuselmann et al. Monocyte induction of E-selectin-mediated endothelial activation releases VE-cadherin junctions to promote tumor cell extravasation in the metastasis cascade
Stewart et al. CD36 ligands promote sterile inflammation through assembly of a TLR 4 and 6 heterodimer
 NFκB (fold induction) Stewart et al. ligands promote sterile inflammation through assembly of a TLR 4 and 6 heterodimer a. mrna (fold induction) 5 4 3 2 1 LDL oxldl Gro1a MIP-2 RANTES mrna (fold induction)
Type of file: PDF Title of file for HTML: Supplementary Information Description: Supplementary Figures
 Type of file: PDF Title of file for HTML: Supplementary Information Description: Supplementary Figures Type of file: MOV Title of file for HTML: Supplementary Movie 1 Description: NLRP3 is moving along
Activated mast cells promote differentiation of B cells into effector cells
 Supplementary,information, Activated mast cells promote differentiation of B cells into effector cells Anna-Karin E. Palm 1, Gianni Garcia Faroldi 2, Marcus Lundberg 1, Gunnar Pejler 3, 2 and Sandra Kleinau
Targeting tumour associated macrophages in anti-cancer therapies. Annamaria Gal Seminar Series on Drug Discovery Budapest 5 January 2018
 Targeting tumour associated macrophages in anti-cancer therapies Annamaria Gal Seminar Series on Drug Discovery Budapest 5 January 2018 Macrophages: Professional phagocytes of the myeloid lineage APC,
Supplemental Table 1. Primer sequences for transcript analysis
 Supplemental Table 1. Primer sequences for transcript analysis Primer Sequence (5 3 ) Primer Sequence (5 3 ) Mmp2 Forward CCCGTGTGGCCCTC Mmp15 Forward CGGGGCTGGCT Reverse GCTCTCCCGGTTTC Reverse CCTGGTGTGCCTGCTC
Supplemental Information. Aryl Hydrocarbon Receptor Controls. Monocyte Differentiation. into Dendritic Cells versus Macrophages
 Immunity, Volume 47 Supplemental Information Aryl Hydrocarbon Receptor Controls Monocyte Differentiation into Dendritic Cells versus Macrophages Christel Goudot, Alice Coillard, Alexandra-Chloé Villani,
Supplementary Figure 1: TSLP receptor skin expression in dcssc. A: Healthy control (HC) skin with TSLP receptor expression in brown (10x
 skin with TSLP receptor expression in brown (10x") Supplementary Figure 1: TSLP receptor skin expression in dcssc. A: Healthy control (HC) skin with TSLP receptor expression in brown (10x magnification). B: Second HC skin stained for TSLP receptor in brown
Supplementary Figure 1: TSLP receptor skin expression in dcssc. A: Healthy control (HC) skin with TSLP receptor expression in brown (10x magnification). B: Second HC skin stained for TSLP receptor in brown
Supplemental Figure 1
 Supplemental Figure 1 1a 1c PD-1 MFI fold change 6 5 4 3 2 1 IL-1α IL-2 IL-4 IL-6 IL-1 IL-12 IL-13 IL-15 IL-17 IL-18 IL-21 IL-23 IFN-α Mut Human PD-1 promoter SBE-D 5 -GTCTG- -1.2kb SBE-P -CAGAC- -1.kb
Supplementary Figure 1 Chemokine and chemokine receptor expression during muscle regeneration (a) Analysis of CR3CR1 mrna expression by real time-pcr
 Analysis of CR3CR1 mrna expression by real time-pcr") Supplementary Figure 1 Chemokine and chemokine receptor expression during muscle regeneration (a) Analysis of CR3CR1 mrna expression by real time-pcr at day 0, 1, 4, 10 and 21 post- muscle injury. (b)
Supplementary Figure 1 Chemokine and chemokine receptor expression during muscle regeneration (a) Analysis of CR3CR1 mrna expression by real time-pcr at day 0, 1, 4, 10 and 21 post- muscle injury. (b)
Supplementary Figure 1. Characterization of basophils after reconstitution of SCID mice
 Supplementary figure legends Supplementary Figure 1. Characterization of after reconstitution of SCID mice with CD4 + CD62L + T cells. (A-C) SCID mice (n = 6 / group) were reconstituted with 2 x 1 6 CD4
Supplementary Figure 1. Generation of knockin mice expressing L-selectinN138G. (a) Schematics of the Sellg allele (top), the targeting vector, the
 Schematics of the Sellg allele (top), the targeting vector, the") Supplementary Figure 1. Generation of knockin mice expressing L-selectinN138G. (a) Schematics of the Sellg allele (top), the targeting vector, the targeted allele in ES cells, and the mutant allele in
Supplementary Figure 1. Generation of knockin mice expressing L-selectinN138G. (a) Schematics of the Sellg allele (top), the targeting vector, the targeted allele in ES cells, and the mutant allele in
Bezzi et al., Supplementary Figure 1 *** Nature Medicine: doi: /nm Pten pc-/- ;Zbtb7a pc-/- Pten pc-/- ;Pml pc-/- Pten pc-/- ;Trp53 pc-/-
 Gr-1 Gr-1 Gr-1 Bezzi et al., Supplementary Figure 1 a Gr1-CD11b 3 months Spleen T cells 3 months Spleen B cells 3 months Spleen Macrophages 3 months Spleen 15 4 8 6 c CD11b+/Gr1+ cells [%] 1 5 b T cells
Supplementary Material
 Supplementary Material accompanying the manuscript Interleukin 37 is a fundamental inhibitor of innate immunity Marcel F Nold, Claudia A Nold-Petry, Jarod A Zepp, Brent E Palmer, Philip Bufler & Charles
SUPPLEMENTARY INFORMATION
 DOI:.38/ncb3399 a b c d FSP DAPI 5mm mm 5mm 5mm e Correspond to melanoma in-situ Figure a DCT FSP- f MITF mm mm MlanaA melanoma in-situ DCT 5mm FSP- mm mm mm mm mm g melanoma in-situ MITF MlanaA mm mm
Chronic variable stress activates hematopoietic stem cells
 SUPPLEMENTARY INFORMATION Chronic variable stress activates hematopoietic stem cells Timo Heidt *, Hendrik B. Sager *, Gabriel Courties, Partha Dutta, Yoshiko Iwamoto, Alex Zaltsman, Constantin von zur
Supplementary Table 1. The primers used for quantitative RT-PCR. Gene name Forward (5 > 3 ) Reverse (5 > 3 )
 Reverse (5 > 3 )") 770 771 Supplementary Table 1. The primers used for quantitative RT-PCR. Gene name Forward (5 > 3 ) Reverse (5 > 3 ) Human CXCL1 GCGCCCAAACCGAAGTCATA ATGGGGGATGCAGGATTGAG PF4 CCCCACTGCCCAACTGATAG TTCTTGTACAGCGGGGCTTG
770 771 Supplementary Table 1. The primers used for quantitative RT-PCR. Gene name Forward (5 > 3 ) Reverse (5 > 3 ) Human CXCL1 GCGCCCAAACCGAAGTCATA ATGGGGGATGCAGGATTGAG PF4 CCCCACTGCCCAACTGATAG TTCTTGTACAGCGGGGCTTG
Supplementary Materials
 Supplementary Materials Figure S1. MTT Cell viability assay. To measure the cytotoxic potential of the oxidative treatment, the MTT [3-(4,5-dimethylthiazol- 2-yl)-2,5-diphenyl tetrazolium bromide] assay
Supplementary Figure 1
 Supplementary Figure 1 a Percent of body weight! (%) 4! 3! 1! Epididymal fat Subcutaneous fat Liver SD Percent of body weight! (%) ** 3! 1! SD Percent of body weight! (%) 6! 4! SD ** b Blood glucose (mg/dl)!
Supporting Information
 Supporting Information Chan et al. 1.173/pnas.9654916 A Patient B Xenograft C * remaining feature of normal lymph node * * * D lymphocytes Infiltrating transitional carcinoma cells E Enlarged axillary
Supplementary Figures
 Supplementary Figures Supplementary Fig. 1. Galectin-3 is present within tumors. (A) mrna expression levels of Lgals3 (galectin-3) and Lgals8 (galectin-8) in the four classes of cell lines as determined
Supplementary Figure 1. BMS enhances human T cell activation in vitro in a
 Supplementary Figure 1. BMS98662 enhances human T cell activation in vitro in a concentration-dependent manner. Jurkat T cells were activated with anti-cd3 and anti-cd28 antibody in the presence of titrated
Eosinophils are required. for the maintenance of plasma cells in the bone marrow
 Eosinophils are required for the maintenance of plasma cells in the bone marrow Van Trung Chu, Anja Fröhlich, Gudrun Steinhauser, Tobias Scheel, Toralf Roch, Simon Fillatreau, James J. Lee, Max Löhning
Supplemental Material
 Supplemental Material Supplementary Fig. 1. EETs stimulate primary tumor growth. a) Schematic presentation of genetic and pharmacological tools used to manipulate endogenous EET levels. b) Endothelial
sequences of a styx mutant reveals a T to A transversion in the donor splice site of intron 5
 sfigure 1 Styx mutant mice recapitulate the phenotype of SHIP -/- mice. (A) Analysis of the genomic sequences of a styx mutant reveals a T to A transversion in the donor splice site of intron 5 (GTAAC
Supplementary Figure 1
 Metastatic melanoma Primary melanoma Healthy human skin Supplementary Figure 1 CD22 IgG4 Supplementary Figure 1: Immunohisochemical analysis of CD22+ (left) and IgG4 (right), cells (shown in red and indicated
Supplementary Figure 1: Expression of NFAT proteins in Nfat2-deleted B cells (a+b) Protein expression of NFAT2 (a) and NFAT1 (b) in isolated splenic
 Protein expression of NFAT2 (a) and NFAT1 (b) in isolated splenic") Supplementary Figure 1: Expression of NFAT proteins in Nfat2-deleted B cells (a+b) Protein expression of NFAT2 (a) and NFAT1 (b) in isolated splenic B cells from WT Nfat2 +/+, TCL1 Nfat2 +/+ and TCL1 Nfat2
Supplementary Figure 1: Expression of NFAT proteins in Nfat2-deleted B cells (a+b) Protein expression of NFAT2 (a) and NFAT1 (b) in isolated splenic B cells from WT Nfat2 +/+, TCL1 Nfat2 +/+ and TCL1 Nfat2
Serum cytokine levels in control and tumor-bearing male and female mice at day 15.
 Supplementary Table 1. Serum cytokine levels in control and tumor-bearing male and female mice at day 15. Male Female Cytokine Control C-26 Control C-26 IL-1β 2.0 ± 0.8 9.6 ± 1.5* 1.8 ± 0.2 6.8 ± 1.4*
Supplementary Information Epigenetic modulation of inflammation and synaptic plasticity promotes resilience against stress in mice
 Supplementary Information Epigenetic modulation of inflammation and synaptic plasticity promotes resilience against stress in mice Wang et. al. IL-6 in plasma (pg/ml) Rac1/HPRT (% of control) PSD9/HPRT
SUPPLEMENTARY INFORMATION
 doi:1.138/nature1554 a TNF-α + in CD4 + cells [%] 1 GF SPF 6 b IL-1 + in CD4 + cells [%] 5 4 3 2 1 Supplementary Figure 1. Effect of microbiota on cytokine profiles of T cells in GALT. Frequencies of TNF-α
Supplementary Figure 1. SA-β-Gal positive senescent cells in various cancer tissues. Representative frozen sections of breast, thyroid, colon and
 Supplementary Figure 1. SA-β-Gal positive senescent cells in various cancer tissues. Representative frozen sections of breast, thyroid, colon and stomach cancer were stained with SA-β-Gal and nuclear fast
Nature Immunology: doi: /ni Supplementary Figure 1. Id2 and Id3 define polyclonal T H 1 and T FH cell subsets.
 Supplementary Figure 1 Id2 and Id3 define polyclonal T H 1 and T FH cell subsets. Id2 YFP/+ (a) or Id3 GFP/+ (b) mice were analyzed 7 days after LCMV infection. T H 1 (SLAM + CXCR5 or CXCR5 PD-1 ), T FH
Supplementary Figure 1. IL-12 serum levels and frequency of subsets in FL patients. (A) IL-12
 IL-12") 1 Supplementary Data Figure legends Supplementary Figure 1. IL-12 serum levels and frequency of subsets in FL patients. (A) IL-12 serum levels measured by multiplex ELISA (Luminex) in FL patients before
1 Supplementary Data Figure legends Supplementary Figure 1. IL-12 serum levels and frequency of subsets in FL patients. (A) IL-12 serum levels measured by multiplex ELISA (Luminex) in FL patients before
Supplementary Figure 1. NAFL enhanced immunity of other vaccines (a) An over-the-counter, hand-held non-ablative fractional laser (NAFL).
 An over-the-counter, hand-held non-ablative fractional laser (NAFL).") Supplementary Figure 1. NAFL enhanced immunity of other vaccines (a) An over-the-counter, hand-held non-ablative fractional laser (NAFL). (b) Depiction of a MTZ array generated by NAFL. (c-e) IgG production
Supplementary Figure 1. NAFL enhanced immunity of other vaccines (a) An over-the-counter, hand-held non-ablative fractional laser (NAFL). (b) Depiction of a MTZ array generated by NAFL. (c-e) IgG production
pplementary Figur Supplementary Figure 1. a.
 pplementary Figur Supplementary Figure 1. a. Quantification by RT-qPCR of YFV-17D and YFV-17D pol- (+) RNA in the supernatant of cultured Huh7.5 cells following viral RNA electroporation of respective
Supplementary Figure 1. Rab27a-KD inhibits speed and persistence of HEp3 cells migrating in the chick CAM. (a) Western blot analysis of Rab27a
 Western blot analysis of Rab27a") Supplementary Figure 1. Rab27a-KD inhibits speed and persistence of HEp3 cells migrating in the chick CAM. (a) Western blot analysis of Rab27a expression in GFP-expressing HEp3 cells. (b) Representative
Supplementary Figure 1. Rab27a-KD inhibits speed and persistence of HEp3 cells migrating in the chick CAM. (a) Western blot analysis of Rab27a expression in GFP-expressing HEp3 cells. (b) Representative
Supplementary Materials for
 www.sciencesignaling.org/cgi/content/full/2/1/ra81/dc1 Supplementary Materials for Delivery of MicroRNA-126 by Apoptotic Bodies Induces CXCL12- Dependent Vascular Protection Alma Zernecke,* Kiril Bidzhekov,
<10. IL-1β IL-6 TNF + _ TGF-β + IL-23
 3 ns 25 ns 2 IL-17 (pg/ml) 15 1 ns ns 5 IL-1β IL-6 TNF
SUPPLEMENTARY INFORMATION
 1. Supplementary Figures and Legends Supplementary Fig. 1. S1P-mediated transcriptional regulation of integrins expressed in OP/monocytoid cells. Real-time quantitative PCR analyses of mrna for two integrins,
Supplementary Figure 1. mtor LysM and Rictor LysM mice have normal cellularity and percentages of hematopoe>c cells. a. Cell numbers of lung, liver,
 a. b. c. Supplementary Figure 1. mtor LysM and Rictor LysM mice have normal cellularity and percentages of hematopoe>c cells. a. Cell numbers of lung, liver, and spleen. b. Cell numbers of bone marrow
Supplementary Fig. 1. GPRC5A post-transcriptionally down-regulates EGFR expression. (a) Plot of the changes in steady state mrna levels versus
 Plot of the changes in steady state mrna levels versus") Supplementary Fig. 1. GPRC5A post-transcriptionally down-regulates EGFR expression. (a) Plot of the changes in steady state mrna levels versus changes in corresponding proteins between wild type and Gprc5a-/-
Supplementary Fig. 1. GPRC5A post-transcriptionally down-regulates EGFR expression. (a) Plot of the changes in steady state mrna levels versus changes in corresponding proteins between wild type and Gprc5a-/-
Figure SⅠ: Expression of mir-155, mir-122 and mir-196a in allografts compared with
 Figure SⅠ: Expression of mir-155, mir-122 and mir-196a in allografts compared with isografts (control) at the 2nd week, 4th and 8th week by RT-PCR. At the advanced stage, the expression of these three
ANGPTL2 increases bone metastasis of breast cancer cells through. Tetsuro Masuda, Motoyoshi Endo, Yutaka Yamamoto, Haruki Odagiri, Tsuyoshi
 Masuda et al. Supplementary information for ANGPTL2 increases bone metastasis of breast cancer cells through enhancing CXCR4 signaling Tetsuro Masuda, Motoyoshi Endo, Yutaka Yamamoto, Haruki Odagiri, Tsuyoshi
Supplementary Information
 Supplementary Information GADD34-deficient mice develop obesity, nonalcoholic fatty liver disease, hepatic carcinoma and insulin resistance Naomi Nishio and Ken-ichi Isobe Department of Immunology, Nagoya
Supplemental Figure 1. IL-3 blockade with Fab CSL362 depletes plasmacytoid dendritic cells (pdcs), but not basophils, at higher doses.
, but not basophils, at higher doses.") Supplemental Figure 1. IL-3 blockade with Fab CSL362 depletes plasmacytoid dendritic cells (pdcs), but not basophils, at higher doses. Percentage of viable (A) pdcs (Sytox Blue-, Lin1-, HLADR+, BDCA2++)
Supplemental Figure 1. IL-3 blockade with Fab CSL362 depletes plasmacytoid dendritic cells (pdcs), but not basophils, at higher doses. Percentage of viable (A) pdcs (Sytox Blue-, Lin1-, HLADR+, BDCA2++)
Supplementary Figure 1. mrna expression of chitinase and chitinase-like protein in splenic immune cells. Each splenic immune cell population was
 Supplementary Figure 1. mrna expression of chitinase and chitinase-like protein in splenic immune cells. Each splenic immune cell population was sorted by FACS. Surface markers for sorting were CD11c +
Induction of Innate Immune Responses in HVTN 071: a Trial using the MRKAd5 gag/pol/nef Vaccine from the Step Study
 Induction of Innate Immune Responses in HVTN 71: a Trial using the MRKAd5 gag/pol/nef Vaccine from the Step Study Erica Andersen-Nissen Vaccine and Infectious Disease Institute Fred Hutchinson Cancer Research
Supplemental Table 1: Demographics and characteristics of study participants. Male, n (%) 3 (20%) 6 (50%) Age, years [mean ± SD] 33.3 ± ± 9.
![Supplemental Table 1: Demographics and characteristics of study participants. Male, n (%) 3 (20%) 6 (50%) Age, years [mean ± SD] 33.3 ± ± 9.](/thumbs/90/103696086.jpg "Supplemental Table 1: Demographics and characteristics of study participants. Male, n (%) 3 (20%) 6 (50%) Age, years [mean ± SD] 33.3 ± ± 9.") SUPPLEMENTAL DATA Supplemental Table 1: Demographics and characteristics of study participants Lean (n=15) Obese (n=12) Male, n (%) 3 (20%) 6 (50%) Age, years [mean ± SD] 33.3 ± 9.5 44.8 ± 9.1 White, n
SUPPLEMENTAL DATA Supplemental Table 1: Demographics and characteristics of study participants Lean (n=15) Obese (n=12) Male, n (%) 3 (20%) 6 (50%) Age, years [mean ± SD] 33.3 ± 9.5 44.8 ± 9.1 White, n
TMA-VARESE COHORT-1 TMA-BERN COHORT-2
 Supplementary Figure 1 TMA-VARESE COHORT-1 TOTAL SAMPLES #5 GLEASON SCORE Number Percentage 6 16 32% = 7 17 34% >7 17 34% TUMOR STAGE T2C 28 56% T3A- 21 42% T3C-T4 1 2% NODE STATUS N 42 84% N1 8 16% PSA
Supplementary Figure 1. Efficiency of Mll4 deletion and its effect on T cell populations in the periphery. Nature Immunology: doi: /ni.
 Supplementary Figure 1 Efficiency of Mll4 deletion and its effect on T cell populations in the periphery. Expression of Mll4 floxed alleles (16-19) in naive CD4 + T cells isolated from lymph nodes and
Supplement Material. Spleen weight (mg) LN cells (X106) Acat1-/- Acat1-/- Mouse weight (g)
 LN cells (X106) Acat1-/- Acat1-/- Mouse weight (g)") Supplement Material A Spleen weight (mg) C Mouse weight (g) 1 5 1 2 9 6 3 2 5 2 1 5 Male LN cells (X16) 4 ** ** Female B 3 2 1 Supplemental Figure I. Spleen weight (A), Inguinal lymph node (LN) cell number
Supplement Material A Spleen weight (mg) C Mouse weight (g) 1 5 1 2 9 6 3 2 5 2 1 5 Male LN cells (X16) 4 ** ** Female B 3 2 1 Supplemental Figure I. Spleen weight (A), Inguinal lymph node (LN) cell number
- 1 - Cell types Monocytes THP-1 cells Macrophages. LPS Treatment time (Hour) IL-6 level (pg/ml)
 IL-6 level (pg/ml)") Supplementary Table ST1: The dynamic effect of LPS on IL-6 production in monocytes and THP-1 cells after GdA treatment. Monocytes, THP-1 cells and macrophages (5x10 5 ) were incubated with 10 μg/ml of
Supplementary Table ST1: The dynamic effect of LPS on IL-6 production in monocytes and THP-1 cells after GdA treatment. Monocytes, THP-1 cells and macrophages (5x10 5 ) were incubated with 10 μg/ml of
Generation of ST2-GFP reporter mice and characterization of ILC1 cells following infection
 Supplementary Figure 1 Generation of ST2-GFP reporter mice and characterization of ILC1 cells following infection with influenza virus. (a) ST2-GFP reporter mice were generated as described in Methods.
Supplementary Table 1 Clinicopathological characteristics of 35 patients with CRCs
 Supplementary Table Clinicopathological characteristics of 35 patients with CRCs Characteristics Type-A CRC Type-B CRC P value Sex Male / Female 9 / / 8.5 Age (years) Median (range) 6. (9 86) 6.5 (9 76).95
Supplementary Figure 1. A. Bar graph representing the expression levels of the 19 indicated genes in the microarrays analyses comparing human lung
 Supplementary Figure 1. A. Bar graph representing the expression levels of the 19 indicated genes in the microarrays analyses comparing human lung immortalized broncho-epithelial cells (AALE cells) expressing
Supplemental Figure 1. Western blot analysis indicated that MIF was detected in the fractions of
 Supplemental Figure Legends Supplemental Figure 1. Western blot analysis indicated that was detected in the fractions of plasma membrane and cytosol but not in nuclear fraction isolated from Pkd1 null
Supplementary Figures for TSC1 controls macrophage polarization to prevent inflammatory disorder by Linnan Zhu et al
 Supplementary Figures for TSC1 controls macrophage polarization to prevent inflammatory disorder by Linnan Zhu et al Suppl. Fig. 1 Tissue DN C Proteins kd TSC1-17 TSC 1 loxp bp -48-285 ctin PEMs Neutrophils
L1 on PyMT tumor cells but Py117 cells are more responsive to IFN-γ. (A) Flow
 Flow") A MHCI B PD-L1 Fold expression 8 6 4 2 Fold expression 3 2 1 No tx 1Gy 2Gy IFN Py117 Py117 Supplementary Figure 1. Radiation and IFN-γ enhance MHCI expression and PD- L1 on PyMT tumor cells but Py117 cells
A MHCI B PD-L1 Fold expression 8 6 4 2 Fold expression 3 2 1 No tx 1Gy 2Gy IFN Py117 Py117 Supplementary Figure 1. Radiation and IFN-γ enhance MHCI expression and PD- L1 on PyMT tumor cells but Py117 cells
Supplementary Fig. 1 p38 MAPK negatively regulates DC differentiation. (a) Western blot analysis of p38 isoform expression in BM cells, immature DCs
 Western blot analysis of p38 isoform expression in BM cells, immature DCs") Supplementary Fig. 1 p38 MAPK negatively regulates DC differentiation. (a) Western blot analysis of p38 isoform expression in BM cells, immature DCs (idcs) and mature DCs (mdcs). A myeloma cell line expressing
Supplementary Fig. 1 p38 MAPK negatively regulates DC differentiation. (a) Western blot analysis of p38 isoform expression in BM cells, immature DCs (idcs) and mature DCs (mdcs). A myeloma cell line expressing
Supplementary Materials for
 www.sciencesignaling.org/cgi/content/full/8/381/ra59/dc1 Supplementary Materials for Analysis of single-cell cytokine secretion reveals a role for paracrine signaling in coordinating macrophage responses
(a) Schematic diagram of the FS mutation of UVRAG in exon 8 containing the highly instable
 Schematic diagram of the FS mutation of UVRAG in exon 8 containing the highly instable") Supplementary Figure 1. Frameshift (FS) mutation in UVRAG. (a) Schematic diagram of the FS mutation of UVRAG in exon 8 containing the highly instable A 10 DNA repeat, generating a premature stop codon
Supplementary Figure 1. Frameshift (FS) mutation in UVRAG. (a) Schematic diagram of the FS mutation of UVRAG in exon 8 containing the highly instable A 10 DNA repeat, generating a premature stop codon
Supplementary Table S1. Tumor samples used for analysis Tumor size (cm) BNG (grade) ERα PR. pn-
 BNG (grade) ERα PR. pn-") Supplementary Table S1. Tumor samples used for analysis Sample# Age Tumor size (cm) pn- Stage Stage BNG (grade) ERα PR HER2 (FISH) Triple negative T1 46 3 N1a III 2 Pos Neg N T2 58 1 N(i-) I 3 Pos Neg
Supplementary Table S1. Tumor samples used for analysis Sample# Age Tumor size (cm) pn- Stage Stage BNG (grade) ERα PR HER2 (FISH) Triple negative T1 46 3 N1a III 2 Pos Neg N T2 58 1 N(i-) I 3 Pos Neg
Supporting Information
 Supporting Information Aldridge et al. 10.1073/pnas.0900655106 Fig. S1. Flow diagram of sublethal (a) and lethal (b) influenza virus infections. (a) Infection of lung epithelial cells by influenza virus
Supplementary Table 1
 Supplementary Table 1 Flow Cytometry Antibodies Antibody Fluorochrome Clone Vendor CD45 PE-cyanine 7 30-F11 D ioscience CD3 Pacific lue 17A2 iolegend (San Diego, CA) CD11b APC M1/70 iolegend (San Diego,
W/T Itgam -/- F4/80 CD115. F4/80 hi CD115 + F4/80 + CD115 +
 F4/8 % in the peritoneal lavage 6 4 2 p=.15 n.s p=.76 CD115 F4/8 hi CD115 + F4/8 + CD115 + F4/8 hi CD115 + F4/8 + CD115 + MHCII MHCII Supplementary Figure S1. CD11b deficiency affects the cellular responses
SUPPLEMENTARY FIGURES
 SUPPLEMENTARY FIGURES Supplementary Figure 1: Chemokine receptor expression profiles of CCR6 + and CCR6 - CD4 + IL-17A +/ex and Treg cells. Quantitative PCR analysis of chemokine receptor transcript abundance
ECM1 controls T H 2 cell egress from lymph nodes through re-expression of S1P 1
 ZH, Li et al, page 1 ECM1 controls T H 2 cell egress from lymph nodes through re-expression of S1P 1 Zhenhu Li 1,4,Yuan Zhang 1,4, Zhiduo Liu 1, Xiaodong Wu 1, Yuhan Zheng 1, Zhiyun Tao 1, Kairui Mao 1,
Page 39 of 44. 8h LTA & AT h PepG & AT h LTA
 Page 39 of 44 Fig. S1 A: B: C: D: 8h LTA 8h LTA & AT7519 E: F: 8h PepG G: 8h PepG & AT7519 Fig. S1. AT7519 overrides the survival effects of lipoteichoic acid (LTA) and peptidoglycan (PepG). (A) Human
X P. Supplementary Figure 1. Nature Medicine: doi: /nm Nilotinib LSK LT-HSC. Cytoplasm. Cytoplasm. Nucleus. Nucleus
 a b c Supplementary Figure 1 c-kit-apc-eflu780 Lin-FITC Flt3-Linc-Kit-APC-eflu780 LSK Sca-1-PE-Cy7 d e f CD48-APC LT-HSC CD150-PerCP-cy5.5 g h i j Cytoplasm RCC1 X Exp 5 mir 126 SPRED1 SPRED1 RAN P SPRED1
Title of file for HTML: Supplementary Information Description: Supplementary Figures and Supplementary Table
 Title of file for HTML: Supplementary Information Description: Supplementary Figures and Supplementary Table Title of file for HTML: Peer Review File Description: Innate Scavenger Receptor-A regulates
Control GST GST-RAP. α2-mg. 170 kda. b-actin. 42 kda LRP-1
 % of max Supplementary Figure 1 Control GST GST-RP 17 kda α2-mg 42 kda b-actin Gate: CD11c+ (DCs) Gate: F4/8+ (Mfs) IgG Cd11cCre + Lrp1 fl/fl LRP-1 Supplementary figure 1. () MDCs were pretreated with
Defective STAT1 activation associated with impaired IFN-g production in NK and T lymphocytes from metastatic melanoma patients treated with IL-2
 Defective STAT1 activation associated with impaired IFN-g production in NK and T lymphocytes from metastatic melanoma patients treated with IL-2 SUPPLEMENTARY FIGURES AND TABLES Supplementary Figure S1:
Supplemental Figure S1. RANK expression on human lung cancer cells.
 Supplemental Figure S1. RANK expression on human lung cancer cells. (A) Incidence and H-Scores of RANK expression determined from IHC in the indicated primary lung cancer subgroups. The overall expression
Supplementary Figures
 Supplementary Figures Supplementary Figure 1 DOT1L regulates the expression of epithelial and mesenchymal markers. (a) The expression levels and cellular localizations of EMT markers were confirmed by
Supplementary Figure 1. DNA methylation of the adiponectin promoter R1, Pparg2, and Tnfa promoter in adipocytes is not affected by obesity.
 Supplementary Figure 1. DNA methylation of the adiponectin promoter R1, Pparg2, and Tnfa promoter in adipocytes is not affected by obesity. (a) Relative amounts of adiponectin, Ppar 2, C/ebp, and Tnf mrna
Supplementary Figure 1. PD-L1 is glycosylated in cancer cells. (a) Western blot analysis of PD-L1 in breast cancer cells. (b) Western blot analysis
 Western blot analysis of PD-L1 in breast cancer cells. (b) Western blot analysis") Supplementary Figure 1. PD-L1 is glycosylated in cancer cells. (a) Western blot analysis of PD-L1 in breast cancer cells. (b) Western blot analysis of PD-L1 in ovarian cancer cells. (c) Western blot analysis
Supplementary Figure 1. PD-L1 is glycosylated in cancer cells. (a) Western blot analysis of PD-L1 in breast cancer cells. (b) Western blot analysis of PD-L1 in ovarian cancer cells. (c) Western blot analysis
F-actin VWF Vinculin. F-actin. Vinculin VWF
 a F-actin VWF Vinculin b F-actin VWF Vinculin Supplementary Fig. 1. WPBs in HUVECs are located along stress fibers and at focal adhesions. (a) Immunofluorescence images of f-actin (cyan), VWF (yellow),
Nature Immunology: doi: /ni.3866
 Nature Immunology: doi:10.1038/ni.3866 Supplementary Figure 1 The effect of TIPE2 on chemotaxis. a, The expression of TIPE2 in dhl-60c, dhl-60t, TIPE2-expressing and 15/16Q-expressing dhl-60t neutrophils
Supplementary Figure 1. Dynamic Response of WT and mir-21 -/- mice to caerulein. (a) Representative histological sections of mouse pancreas stained
 Representative histological sections of mouse pancreas stained") Supplementary Figure 1. Dynamic Response of WT and mir-21 -/- mice to caerulein. (a) Representative histological sections of mouse pancreas stained with hematoxylin from caerulein-treated WT and mir-21
Supplementary Figure 1. Dynamic Response of WT and mir-21 -/- mice to caerulein. (a) Representative histological sections of mouse pancreas stained with hematoxylin from caerulein-treated WT and mir-21
Supplementary Figure 1.TRIM33 binds β-catenin in the nucleus. a & b, Co-IP of endogenous TRIM33 with β-catenin in HT-29 cells (a) and HEK 293T cells
 and HEK 293T cells") Supplementary Figure 1.TRIM33 binds β-catenin in the nucleus. a & b, Co-IP of endogenous TRIM33 with β-catenin in HT-29 cells (a) and HEK 293T cells (b). TRIM33 was immunoprecipitated, and the amount of
Supplementary Figure 1.TRIM33 binds β-catenin in the nucleus. a & b, Co-IP of endogenous TRIM33 with β-catenin in HT-29 cells (a) and HEK 293T cells (b). TRIM33 was immunoprecipitated, and the amount of
Supplemental Figure 1. Intracranial transduction of a modified ptomo lentiviral vector in the mouse
 Supplemental figure legends Supplemental Figure 1. Intracranial transduction of a modified ptomo lentiviral vector in the mouse hippocampus targets GFAP-positive but not NeuN-positive cells. (A) Stereotaxic
Supplementary Information and Figure legends
 Supplementary Information and Figure legends Table S1. Primers for quantitative RT-PCR Target Sequence (5 -> 3 ) Target Sequence (5 -> 3 ) DAB2IP F:TGGACGATGTGCTCTATGCC R:GGATGGTGATGGTTTGGTAG Snail F:CCTCCCTGTCAGATGAGGAC
activation with anti-cd3/cd28 beads and 3d following transduction. Supplemental Figure 2 shows
 Supplemental Data Supplemental Figure 1 compares CXCR4 expression in untreated CD8 + T cells, following activation with anti-cd3/cd28 beads and 3d following transduction. Supplemental Figure 2 shows the
Supplementary fig. 1. Crystals induce necroptosis does not involve caspases, TNF receptor or NLRP3. A. Mouse tubular epithelial cells were pretreated
 Supplementary fig. 1. Crystals induce necroptosis does not involve caspases, TNF receptor or NLRP3. A. Mouse tubular epithelial cells were pretreated with zvad-fmk (10µM) and exposed to calcium oxalate
Supplementary Figure 1. IDH1 and IDH2 mutation site sequences on WHO grade III
 Supplementary Materials: Supplementary Figure 1. IDH1 and IDH2 mutation site sequences on WHO grade III patient samples. Genomic DNA samples extracted from punch biopsies from either FFPE or frozen tumor
IL-34 is a tissue-restricted ligand of CSF1R required for the development of Langerhans cells and microglia
 Supplementary Figures IL-34 is a tissue-restricted ligand of CSF1R required for the development of Langerhans cells and microglia Yaming Wang, Kristy J. Szretter, William Vermi, Susan Gilfillan, Cristina
Supplementary Figure 1
 Supplementary Figure 1 Identification of IFN-γ-producing CD8 + and CD4 + T cells with naive phenotype by alternative gating and sample-processing strategies. a. Contour 5% probability plots show definition
Online supplement. Phenotypic, functional and plasticity features of classical and alternatively activated
 Online supplement Phenotypic, functional and plasticity features of classical and alternatively activated human macrophages Abdullah Al Tarique*, Jayden Logan *, Emma Thomas *, Patrick G Holt *, Peter
Supplementary Information
 Nature Immunology doi:1.138/ni.2477 Supplementary Information Capillary and arteriolar pericytes attract innate leukocytes exiting through venules and instruct them with pattern recognition and motility
Quantitative PPARγ expression affects the balance between tolerance and immunity
 Quantitative PPARγ expression affects the balance between tolerance and immunity Ya-Hui Liu 1, Yau-Sheng Tsai 1,2,3, Shih-Chieh Lin 4, Nan-Shih Liao 5, Ming-Shiou Jan 6, Chung-Tiang Liang 7, Shih-Wen Hsu
Serafino et al. Thymosin α1 activates complement receptor-mediated phagocytosis in human monocyte-derived macrophages. SUPPLEMENTARY FIGURES
 Supplementary Fig. S1. Evaluation of the purity and maturation of macrophage cultures tested by flow cytometry. The lymphocytic/monocytic cellular fraction was isolated from buffy coats of healthy donors
Supplementary Figure 1. Nature Neuroscience: doi: /nn.4547
 Supplementary Figure 1 Characterization of the Microfetti mouse model. (a) Gating strategy for 8-color flow analysis of peripheral Ly-6C + monocytes from Microfetti mice 5-7 days after TAM treatment. Living
B220 CD4 CD8. Figure 1. Confocal Image of Sensitized HLN. Representative image of a sensitized HLN
 B220 CD4 CD8 Natarajan et al., unpublished data Figure 1. Confocal Image of Sensitized HLN. Representative image of a sensitized HLN showing B cell follicles and T cell areas. 20 µm thick. Image of magnification
Supplemental Information
 Supplemental Information Prediction of Prostate Cancer Recurrence using Quantitative Phase Imaging Shamira Sridharan 1, Virgilia Macias 2, Krishnarao Tangella 3, André Kajdacsy-Balla 2 and Gabriel Popescu
Supplementary Figure 1. HOPX is hypermethylated in NPC. (a) Methylation levels of HOPX in Normal (n = 24) and NPC (n = 24) tissues from the
 Methylation levels of HOPX in Normal (n = 24) and NPC (n = 24) tissues from the") Supplementary Figure 1. HOPX is hypermethylated in NPC. (a) Methylation levels of HOPX in Normal (n = 24) and NPC (n = 24) tissues from the genome-wide methylation microarray data. Mean ± s.d.; Student
Supplementary Figure 1. HOPX is hypermethylated in NPC. (a) Methylation levels of HOPX in Normal (n = 24) and NPC (n = 24) tissues from the genome-wide methylation microarray data. Mean ± s.d.; Student