ANGPTL2 increases bone metastasis of breast cancer cells through. Tetsuro Masuda, Motoyoshi Endo, Yutaka Yamamoto, Haruki Odagiri, Tsuyoshi
|
|
|
- Edmund Ashley Snow
- 5 years ago
- Views:
Transcription
1 Masuda et al. Supplementary information for ANGPTL2 increases bone metastasis of breast cancer cells through enhancing CXCR4 signaling Tetsuro Masuda, Motoyoshi Endo, Yutaka Yamamoto, Haruki Odagiri, Tsuyoshi Kadomatsu, Takayuki Nakamura, Hironori Tanoue, Hitoshi Ito, Masaki Yugami, Keishi Miyata, Jun Morinaga, Haruki Horiguchi, Ikuyo Motokawa, Kazutoyo Terada, Masaki Suimye Morioka, Ichiro Manabe, Hirotaka Iwase, Hiroshi Mizuta and Yuichi Oike This file includes: Supplementary Figures and Tables legends Supplementary Figure S1-S18 Supplementary Table 1-3
2 Masuda et al. Supplementary information Supplementary Figure S1 List of the top 1 genes up-regulated in cells following ANGPTL2 knockdown, based on RNA sequencing analysis. Data are mean log 2 value of fold-change relative to control /milacz cells. Supplementary Figure S2 (A) Full length western blots of data presented in Figure 1B. Lane 1 represents an /milacz cell lysate and Lane 2 represents an /miangptl2 cell lysate. (B) Representative image of western blot analysis of /milacz and /miangptl2 cells using a CXCR4 antibody (ab274) different from the one used in A. (C) Relative CXCL12 expression in /ANGPTL2 cells. Data are means ±SEM from three experiments. Supplementary Figure S3 (A-C) Transwell migration assay of /milacz and /miangptl2 cells in the presence of several CXCL12 concentrations. (D) Representative image of a transwell migration assay of /miangptl2 and /milacz cells 18 h after CXCL12 treatment. Migrated cells were fixed with 4% paraformaldehyde and stained for 3 min with Giemsa stain (Wako). Scale bar = 1 µm. Supplementary Figure S4 Time course of invasion activity of /miangptl2 and /milacz
3 Masuda et al. cells with or without CXCL12 treatment. Data are means ±SEM from five experiments; P<.5 (unpaired two-tailed Studentʼs t-test). Supplementary Figure S5 Full length western blots representing data shown in Figure 2E. Lane 1 represents an /milacz cell lysate and Lane 2 represents an /miangptl2 lysate. Supplementary Figure S6 Time course showing representative immunoblotting of indicated cells for phosphorylated ERK1/2 (p-erk), total ERK1/2 and HSC7 after CXCL12 treatment. Supplementary Figure S7 (A) Full length western blots of data shown in Figure 3A. Lane 1 represents an /milacz cell lysate and Lane 2 represents an /miangptl2 lysate. (B) Representative image showing immunoblot of /Control and /ANGPTL2 cells for ANGPTL2 by anti-angptl2 antibody. Lane 1 represents an /Control cell lysate and Lane 2 represents an /ANGPTL2 lysate. Open arrowhead indicates FLAG-tagged ANGPTL2; filled arrowhead indicates endogenous ANGPTL2. (C) Relative CXCL12 expression in /ANGPTL2 cells. Data are means ±SEM from three experiments. (D) Full length western blots of data shown in Figure 3C. Lane 1 represents an /Control cell lysate and Lane 2 represents an /ANGPTL2 lysate.
4 Masuda et al. Supplementary Figure S8 Full length western blots of data shown in in Figure 3G. Lane 1 represents an /ANGPTL2 ETS1 sirna-control cell lysate, Lane 2 an /ANGPTL2 ETS1 sirna-1 lysate, and Lane 3 an /ANGPTL2 ETS1 sirna-2 lysate. Supplementary Figure S9 (A) Relative ANGPTL2 expression in T47-D/ANGPTL2 cells. Data are means ±SEM from three experiments. P<.1(unpaired two-tailed Studentʼs t-test). (B) Relative CXCR4 expression in T47-D/ANGPTL2 cells. Data are means ±SEM from three experiments. P<.1(unpaired two-tailed Studentʼs t-test). (C) Relative ETS1 expression in T47-D/ANGPTL2 cells. Data are means ±SEM from three experiments; P<.1(unpaired two-tailed Studentʼs t-test). (D) CXCR4 cell surface expression in T47-D/ANGPTL2 and T47-D/Control cells based on flow cytometry. Gray shaded area represents isotype control antibody group. T47-D/ANGPTL2 cells, dotted-line; T47-D/Control cells, solid line. Supplementary Figure S1 Full length western blots of data shown in Figure 4A. Lane 1 represents an /milacz/luc cell lysate and Lane 2 represents an /miangptl2/luc lysate. Supplementary Figure S11 (A) Relative number of proliferating /milacz/luc and
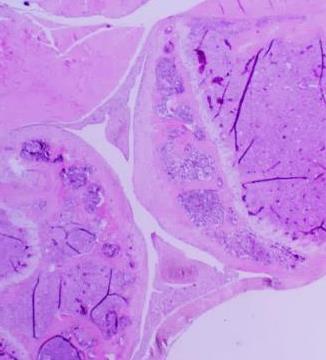
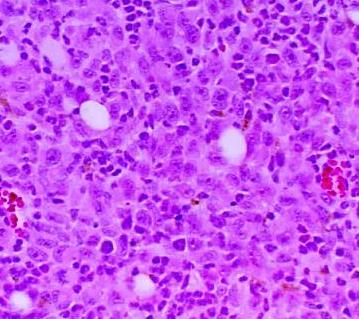
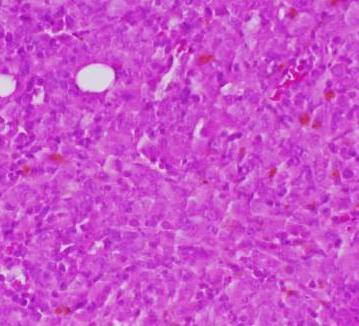
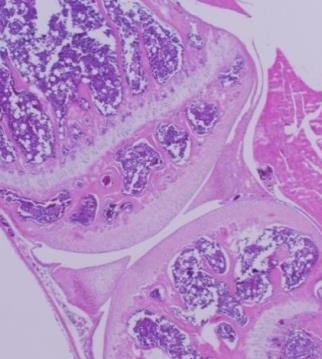
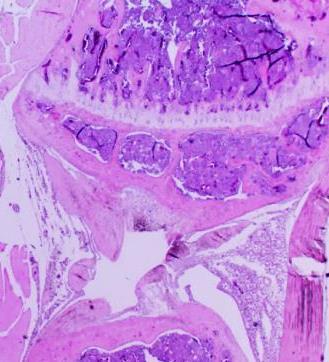
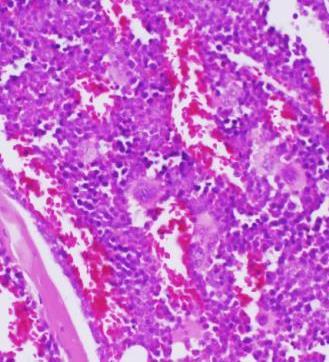
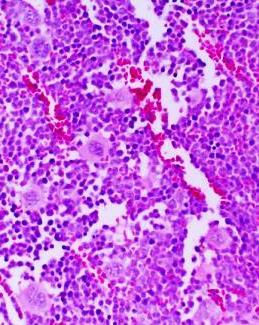
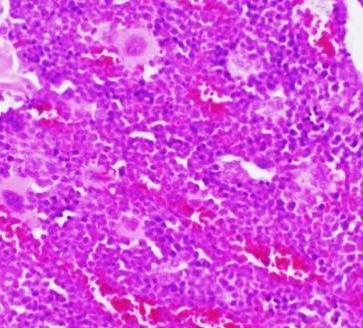
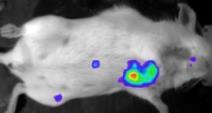
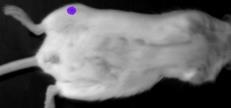
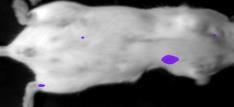
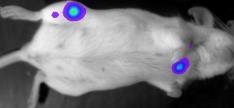
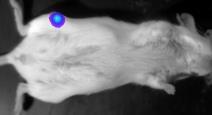
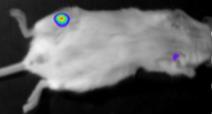
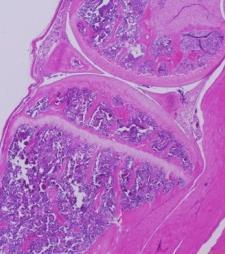
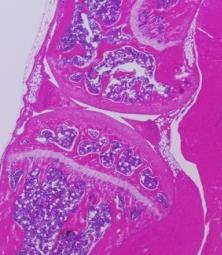
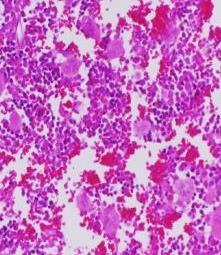
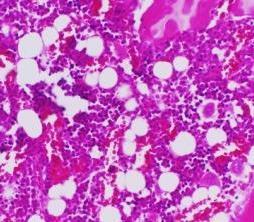
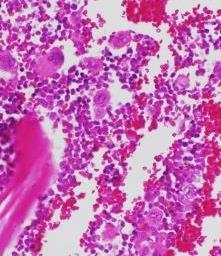
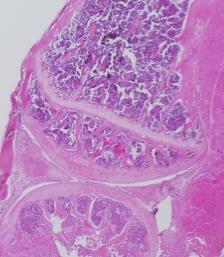
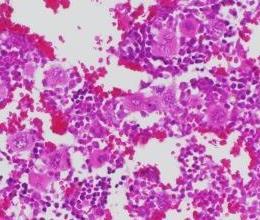
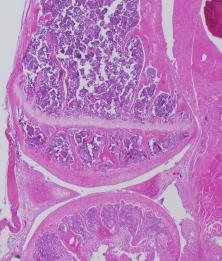
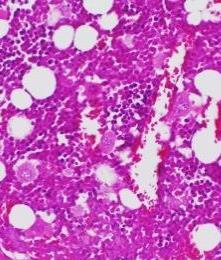
5 Masuda et al. /miangptl2/luc cells after 24, 48 or 72 hours of culture in normoxic or hypoxic conditions. Data are relative to the number of cells present at seeding and are means ±SEM from five experiments. (B) Growth of mouse primary tumors derived from /milacz/luc and /miangptl2/luc cells, 3 weeks after implantation (n=6). Scale bar=1 mm. Supplementary Figure S12 Additional images showing bioluminescence signals in xenografted mice and microscopy images of tumor cells shown in Figure 4. Left panels; bioluminescence signals were captured at indicated times after xenografting. Center and right panels, microscopy images of H&E-stained tumor cells metastasized to tibial bone located within the red circle seen in left figures, 4 weeks after injection of /milacz/luc (top 3) or /miangptl2/luc (bottom 3) cells. Right panels are magnifications of squares in center panels. Center image scale bar=1. mm; right image scale bar=1 µm. Supplementary Figure S13 (A) Comparison of ANGPTL2 levels in the culture medium of indicated cells. Data are means ±SEM from three experiments; P<.1(unpaired two-tailed Studentʼs t-test). (B) Representative images of bioluminescence signals in xenografted mice. /Control/luc or /ANGPTL2/luc cells were injected into the left cardiac ventricle of immunodeficient mice (n=5). At indicated times after xenografting, bioluminescence signals were captured. Images of weeks 1-4 are displayed on the same scale. (C) Kaplan-Meier survival curves of mice bearing tumors derived from /Control/luc (n=8) or
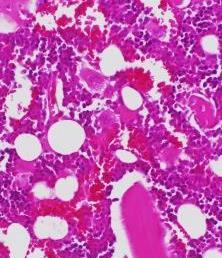
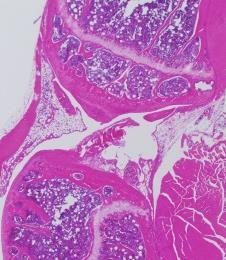
6 Masuda et al. /ANGPTL2/luc (n=8) cells. P<.5 (log-rank test). Supplementary Figure S14 (A) Relative CXCR4 expression in /ANGPTL2/miLacZ/luc and /ANGPTL2/miCXCR4/luc cells. Data are means ±SEM from three experiments; P<.5(unpaired two-tailed Studentʼs t-test). (B) CXCR4 cell surface expression in /ANGPTL2/miLacZ/luc and /ANGPTL2/miCXCR4/luc cells based on flow cytometry. Gray shaded area represents isotype control antibody group. /ANGPTL2/miCXCR4/luc cells, dotted-line; /ANGPTL2/miLacZ/luc cells, solid line. (C) /ANGPTL2/miLacZ/luc and /ANGPTL2/miCXCR4/luc cells were injected into the left cardiac ventricle of immunodeficient mice (n=6). At indicated times after xenografting, bioluminescence signals were captured. Images are displayed on the same scale. (D) Representative microscopy images of H&E-stained tumor cells metastasized to tibial bone, 3 weeks after injection with /ANGPTL2/miLacZ/luc (left 3) or /ANGPTL2/miCXCR4/luc (right 3) cells. Black arrowhead indicates tumor cells. Lower panels are magnifications of squares in upper panels. Upper image scale bar=1. mm; lower image scale bar=1 μm. Supplementary Figure S15 (A) ANGPTL2 and MMP-13 immunostaining within primary tumors derived from patients. Representative images of ANGPTL2-negative and MMP-13-negative (Pt. 3) and ANGPTL2-positive and MMP-13-positive (Pt.4) specimens. Scale bar=1 µm. (B) Distribution of ANGPTL2 and MMP-13 staining in tumor
7 Masuda et al. specimens from breast cancer patients. P<.1 (Fisher's exact test). Supplementary Figure S16 (A) CXCR4 and MMP-13 immunostaining within patient primary tumors. Representative images of CXCR4-negative and MMP-13-negative (Pt.5) and CXCR4-positive and MMP-13-positive (Pt.6) specimens. Scale bar=1 µm. (B) Distribution of ANGPTL2 and MMP-13 staining in tumor specimens from breast cancer patients. P<.1 (Fisher's exact test). Supplementary Figure S17 (A) Cohort of probability of distant relapse-free survival in ANGPTL2-positive (n=88) and ANGPTL2-negative (n=93) groups. (B) Cohort of probability of distant relapse-free survival in CXCR4-positive (n=75) and CXCR4-negative (n=16) groups. (C) Cohort of probability of distant relapse-free survival in MMP-13-positive (n=89) and MMP-13-negative (n=89) groups. Supplementary Figure S18 (A) Cell surface integrin!5"1 expression in /Control and /ANGPTL2 cells based on flow cytometry. Gray shaded area represents isotype control antibody group. /Control cells, dotted-line; /ANGPTL2 cells, solid line. (B) LILRB2 cell surface expression in /Control and /ANGPTL2 cells based on flow cytometry. Gray shaded area represents isotype control antibody group. /Control cells, dotted-line; /ANGPTL2 cells, solid line. (C) Relative CXCR4 expression in /Control and /ANGPTL2 cells, 24h after treatment with or
8 Masuda et al. without an anti-!5"1 antibody. Data from /ANGPTL2 cells was set at 1. Data are means ±SEM from five experiments; P<.5, P<.1(unpaired two-tailed Studentʼs t-test). Supplementary Table 1. Sequences of primers used for quantitative RT-PCR. Supplementary Table 2. Correlation of primary tumor ANGPTL2 expression and patient characteristics. ER indicates estrogen receptor. PgR indicates progesterone receptor. P<.1(Fisher's exact test). P<.1(Pearson's chi-square test). Supplementary Table 3. Correlation of primary tumor CXCR4 expression and patient characteristics. ER indicates estrogen receptor. PgR indicates progesterone receptor. P<.1(Fisher's exact test).
9 Symbol Mean log 2 (fold change) of transcripts ZNF LOC ZNF COBL 6.76 SNAP CACNA2D INHBA 5.74 BEX CCL GPR Figure S1 (Masuda et al)
 CXCR4 HSC7 (ab247) 1 2 1 2 117")


 1.2 1..8.6.4.")
")
10 A) CXCR4 ANGPTL2 HSC7 (ab124824) B) CXCR4 HSC7 (ab247) kda 117 kda 89 kda 89 kda 63 kda 63 kda 48 kda 48 kda 35 kda 35 kda 28 kda 21 kda 28 kda 21 kda Lanes: 1 = /milacz cell lysate 2 = /miangptl2 cell lysate Lanes: 1 = /milacz cell lysate 2 = /miangptl2 cell lysate C) Relative CXCL12 mrna expression (Fold) /milacz n.s. /miangptl2 Figure S2 (Masuda et al)
 CXCL12 () n.s.")

 Cell number per field D) 7 6 5")
 () /milacz /miangptl2")
11 A) CXCL12 : 5ng/ml B) Cell number per field CXCL12 () CXCL12 () n.s. /milacz n.s. /miangptl2 Cell number per field CXCL12 : 1ng/ml CXCL12 () CXCL12 () /milacz n.s. /miangptl2 C) Cell number per field D) CXCL12 : 2ng/ml CXCL12 () CXCL12 () /milacz n.s. /miangptl2 CXCL12 () () /milacz /miangptl2 Figure S3 (Masuda et al)
12 /miangptl2 CXCL12 () /miangptl2 CXCL12 () /milacz CXCL12 () /milacz CXCL12 () Confluence (%) (Hour) Figure S4 (Masuda et al)
 () () () () () () ()")


13 p-erk ERK HSC7 CXCL () () () () () () () () () () () () 117 kda 89 kda 63 kda 48 kda 35 kda 28 kda 21 kda Lanes: 1 = /milacz cell lysate 2 = /miangptl2 cell lysate Figure S5 (Masuda et al)
")
 after 5min.")
 after 1min.")
14 p-erk ERK HSC kda 89 kda 63 kda 48 kda 35 kda 28 kda 21 kda Lanes: 1 = /milacz cell CXCL12 () 2 = /miangptl2 cell CXCL12 () 3 = /milacz cell CXCL12 () after 5min. 4 = /miangptl2 cell CXCL12 () after 5min. 5 = /milacz cell CXCL12 () after 1min. 6 = /miangptl2 cell CXCL12 () after 1min. 7 = /milacz cell CXCL12 () after 2min. 8 = /miangptl2 cell CXCL12 () after 2min. Figure S6 (Masuda et al)

 D) ETS1 HSC7 1 2 1 2 (Fold) 1.2 n.s. 117 kda Relative CXCL12 mrna expression 1.")

15 A) ETS1 HSC B) ANGPTL2 HSC kda 117 kda 89 kda 89 kda 63 kda 63 kda 48 kda 35 kda 28 kda 21 kda Lanes: 1 = /milacz cell lysate 2 = /miangptl2 cell lysate 48 kda 35 kda 28 kda Lanes: 1 = /Control cell lysate 2 = /ANGPTL2 cell lysate C) D) ETS1 HSC (Fold) 1.2 n.s. 117 kda Relative CXCL12 mrna expression kda 63 kda /Control /ANGPTL2 48 kda 35 kda 28 kda 21 kda Lanes: 1 = /Control cell lysate 2 = /ANGPTL2 cell lysate Figure S7 (Masuda et al)


16 ETS1 HSC kda 89 kda 63 kda 48 kda 35 kda 28 kda 21 kda Lanes: 1 = /ANGPTL2 ETS1 sirna-control cell lysate 2 = /ANGPTL2 ETS1 sirna-1 cell lysate 3 = /ANGPTL2 ETS1 sirna-2 cell lysate Figure S8 (Masuda et al)
17 A) B) (Fold) 8! (Fold) 8! Relative ANGPTL2 mrna expression Relative CXCR4 mrna expression T47-D /Control T47-D /ANGPTL2 T47-D /Control T47-D /ANGPTL2 C) D) Relative ETS1 mrna expression (Fold) T47-D /Control! T47-D /ANGPTL2 Cell number (% of MAX) CXCR4 T47-D/Control T47-D/ANGPTL Figure S9 (Masuda et al)


18 ANGPTL2 HSC kda 89 kda 63 kda 48 kda 35 kda 28 kda 21 kda Lanes: 1 = /milacz/luc cell lysate 2 = /miangptl2/luc cell lysate Figure S1 (Masuda et al)
 B) /milacz /luc /miangptl2 /luc 3w after implantation Tumor volume (mm 3 ) 4 3 2 1 /milacz /luc n.s.")
19 A) (Fold) 4 Normoxia /milacz /miangptl2 (Fold) 3 Hypoxia /milacz /miangptl2 Relative cell number Relative cell number (Hour) (Hour) B) /milacz /luc /miangptl2 /luc 3w after implantation Tumor volume (mm 3 ) /milacz /luc n.s. /miangptl2 /luc Figure S11 (Masuda et al)


20 4w after injection /milacz /luc High Low /miangptl2 /luc Figure S12 (Masuda et al)


21 A) B) ANGPTL2 concentration in culture medium (ng/ml) /Control /luc /ANGPTL2 /luc /Control /luc /ANGPTL2 /luc Weeks after injection 1W 2W 3W 4W High Low C) Survival rate (%) /Control/luc /ANGPTL2/luc Days after injection Figure S13 (Masuda et al)


22 A) Relative CXCR4 mrna expression (Fold) /ANGPTL2 /milacz /luc /ANGPTL2 /micxcr4 /luc B) Cell number (% of MAX) /ANGPTL2/miLacZ/luc /ANGPTL2/miCXCR4/luc CXCR4 C) 3w after injection /ANGPTL2 /milacz /luc High /ANGPTL2 /micxcr4 /luc Low D) /ANGPTL2/miLacZ/luc /ANGPTL2/miCXCR4/luc 3w after injection Figure S14 (Masuda et al)
 ANGPTL2")
 Positive :n (%) P")
 6 (67.")
 58 (65.")
23 A) ANGPTL2 MMP-13 Pt. 3 Pt. 4 B) ANGPTL2 expression Negative n (%) Positive :n (%) P MMP-13 Negative (n=89) Positive (n=89) 6 (67.4) 29 (32.6).1 31 (34.8) 58 (65.2) Figure S15 (Masuda et al)
 CXCR4")
 Positive :n (%) P")
 67 (75.")
 52 (58.")
24 A) CXCR4 MMP-13 Pt. 5 Pt. 6 B) CXCR4 expression Negative n (%) Positive :n (%) P MMP-13 Negative (n=89) Positive (n=89) 67 (75.3) 22 (24.7).1 37 (41.6) 52 (58.4) Figure S16 (Masuda et al)
25 A) log-rank P <.1 Probability (%) Time (days) ANGPTL2-negative ANGPTL2-positive B) log-rank P =.87 Probability (%) Time (days) CXCR4-negative CXCR4-positive C) log-rank P =.5227 Probability (%) Time (days) MMP-13-negative MMP-13-positive Figure S17 (Masuda et al)

26 A) B) C) Relative CXCR4 mrna expression (Fold) /Control /ANGPTL2 /ANGPTL antibody
27 Supplementary Table 1. Sequences of primers used in quantitative RT-PCR Gene Sequences ANGPTL2 Forward AGTTTCCGCCTGGAACCTGAG Reverse GGAGTGGGCACAGGCGTTATAC CXCR4 Forward CTCCAGTAGCCACCGCATCA Reverse TCCTCGGTGTAGTTATCTGAAGT CXCL12 Forward AAGCCCGTCAGCCTGAGCTA Reverse TTAGCTTCGGGTCAATGCACAC MMP-13 Forward TTGATGATGATGAAACCTGGACAAG Reverse TTGCCGGTGTAGGTGTAGATAGGAA RSP18 Forward TTTGCGAGTACTCAACACCAACATC Reverse GAGCATATCTTCGGCCCACAC Sup Table 1 (Masuda et al)
28 Supplementary Table 2. ANGPTL2 expression Negative Positive :n (%) :n (%) P Age (53.1) 15 (46.9) 5 76 (51.) 73 (49.) T (Primary tumor) T1 69 (65.7) 36 (34.3) T2 22 (34.4) 42 (65.6) T34 2 (16.7) 1 (83.3).1 Nuclear grade (59.4) 39 (4.6) 2 (42.6) 27 (57.4) 16 (42.1) 22 (57.9) Lymph node metastasis Negative 81 (64.3) 45 (35.7) Positive 12 (21.8) 43 (78.2) Stage 61 (7.9) 25 (29.1) 3 (38.5) 48 (61.5) 2 (11.8) 15 (88.2).1.1 ER.292 Negative 18 (43.9) 23 (56.1) Positive 75 (53.6) 65 (46.4) PgR.3614 Negative 38 (55.9) 3 (44.1) Positive 55 (48.7) 58 (51.3) HER Negative 83 (53.9) 71 (46.1) Positive 1 (37.) 17 (63.) Sup Table 2 (Masuda et al)
29 Supplementary Table 3. CXCR4 expression Negative Positive :n (%) :n (%) P Age (5.) 16 (5.) 5 9 (6.4) 59 (39.6) T (Primary tumor) T1 77 (73.3) 28 (26.7) T2 39 (6.9) 25 (39.1) T34 6 (5.) 6 (5.).127 Nuclear grade (63.5) 35 (36.5) 24 (51.1) 23 (48.9) 21 (55.3) 17 (44.7) Lymph node metastasis Negative 87 (69.) 39 (31.) Positive 19 (34.5) 36 (75.5).1 Stage (66.3) 29 (33.7) 42 (53.8) 36 (46.2) 8 (47.1) 9 (52.9) ER.477 Negative 22 (53.7) 19 (46.3) Positive 84 (6.) 56 (4.) PgR.4367 Negative 37 (54.4) 31 (45.6) Positive 69 (61.1) 44 (38.9) HER Negative 94 (61.) 6 (39.) Positive 12 (44.4) 15 (55.6) Sup Table 3 (Masuda et al)
(a) Significant biological processes (upper panel) and disease biomarkers (lower panel)
 Significant biological processes (upper panel) and disease biomarkers (lower panel)") Supplementary Figure 1. Functional enrichment analyses of secretomic proteins. (a) Significant biological processes (upper panel) and disease biomarkers (lower panel) 2 involved by hrab37-mediated secretory
Supplementary Figure 1. Functional enrichment analyses of secretomic proteins. (a) Significant biological processes (upper panel) and disease biomarkers (lower panel) 2 involved by hrab37-mediated secretory
Supplementary Fig. 1: ATM is phosphorylated in HER2 breast cancer cell lines. (A) ATM is phosphorylated in SKBR3 cells depending on ATM and HER2
 ATM is phosphorylated in SKBR3 cells depending on ATM and HER2") Supplementary Fig. 1: ATM is phosphorylated in HER2 breast cancer cell lines. (A) ATM is phosphorylated in SKBR3 cells depending on ATM and HER2 activity. Upper panel: Representative histograms for FACS
Supplementary Fig. 1: ATM is phosphorylated in HER2 breast cancer cell lines. (A) ATM is phosphorylated in SKBR3 cells depending on ATM and HER2 activity. Upper panel: Representative histograms for FACS
(A) RT-PCR for components of the Shh/Gli pathway in normal fetus cell (MRC-5) and a
 RT-PCR for components of the Shh/Gli pathway in normal fetus cell (MRC-5) and a") Supplementary figure legends Supplementary Figure 1. Expression of Shh signaling components in a panel of gastric cancer. (A) RT-PCR for components of the Shh/Gli pathway in normal fetus cell (MRC-5) and
Supplementary figure legends Supplementary Figure 1. Expression of Shh signaling components in a panel of gastric cancer. (A) RT-PCR for components of the Shh/Gli pathway in normal fetus cell (MRC-5) and
Supplementary Figure 1. Deletion of Smad3 prevents B16F10 melanoma invasion and metastasis in a mouse s.c. tumor model.
 A B16F1 s.c. Lung LN Distant lymph nodes Colon B B16F1 s.c. Supplementary Figure 1. Deletion of Smad3 prevents B16F1 melanoma invasion and metastasis in a mouse s.c. tumor model. Highly invasive growth
SUPPLEMENTARY INFORMATION
 DOI: 10.1038/ncb2607 Figure S1 Elf5 loss promotes EMT in mammary epithelium while Elf5 overexpression inhibits TGFβ induced EMT. (a, c) Different confocal slices through the Z stack image. (b, d) 3D rendering
Supplementary Figure 1. SA-β-Gal positive senescent cells in various cancer tissues. Representative frozen sections of breast, thyroid, colon and
 Supplementary Figure 1. SA-β-Gal positive senescent cells in various cancer tissues. Representative frozen sections of breast, thyroid, colon and stomach cancer were stained with SA-β-Gal and nuclear fast
SUPPLEMENTARY FIGURES AND TABLE
 SUPPLEMENTARY FIGURES AND TABLE Supplementary Figure S1: Characterization of IRE1α mutants. A. U87-LUC cells were transduced with the lentiviral vector containing the GFP sequence (U87-LUC Tet-ON GFP).
Supplementary Figure S1 Expression of mir-181b in EOC (A) Kaplan-Meier
 Kaplan-Meier") Supplementary Figure S1 Expression of mir-181b in EOC (A) Kaplan-Meier curves for progression-free survival (PFS) and overall survival (OS) in a cohort of patients (N=52) with stage III primary ovarian
Supplementary Figure S1 Expression of mir-181b in EOC (A) Kaplan-Meier curves for progression-free survival (PFS) and overall survival (OS) in a cohort of patients (N=52) with stage III primary ovarian
Type of file: PDF Size of file: 0 KB Title of file for HTML: Supplementary Information Description: Supplementary Figures
 Type of file: PDF Size of file: 0 KB Title of file for HTML: Supplementary Information Description: Supplementary Figures Supplementary Figure 1 mir-128-3p is highly expressed in chemoresistant, metastatic
Supplementary Figure 1
 Supplementary Figure 1 14 12 SEM4C PLXN2 8 SEM4C C 3 Cancer Cell Non Cancer Cell Expression 1 8 6 6 4 log2 ratio Expression 2 1 4 2 2 p value.1 D Supplementary Figure 1. Expression of Sema4C and Plexin2
Supplementary Figures
 Supplementary Figures Supplementary Figure 1 DOT1L regulates the expression of epithelial and mesenchymal markers. (a) The expression levels and cellular localizations of EMT markers were confirmed by
Supplementary Fig. 1. GPRC5A post-transcriptionally down-regulates EGFR expression. (a) Plot of the changes in steady state mrna levels versus
 Plot of the changes in steady state mrna levels versus") Supplementary Fig. 1. GPRC5A post-transcriptionally down-regulates EGFR expression. (a) Plot of the changes in steady state mrna levels versus changes in corresponding proteins between wild type and Gprc5a-/-
Supplementary Fig. 1. GPRC5A post-transcriptionally down-regulates EGFR expression. (a) Plot of the changes in steady state mrna levels versus changes in corresponding proteins between wild type and Gprc5a-/-
SHREE ET AL, SUPPLEMENTAL MATERIALS. (A) Workflow for tumor cell line derivation and orthotopic implantation.
 Workflow for tumor cell line derivation and orthotopic implantation.") SHREE ET AL, SUPPLEMENTAL MATERIALS SUPPLEMENTAL FIGURE AND TABLE LEGENDS Supplemental Figure 1. Derivation and characterization of TS1-TGL and TS2-TGL PyMT cell lines and development of an orthotopic
SHREE ET AL, SUPPLEMENTAL MATERIALS SUPPLEMENTAL FIGURE AND TABLE LEGENDS Supplemental Figure 1. Derivation and characterization of TS1-TGL and TS2-TGL PyMT cell lines and development of an orthotopic
Plasma exposure levels from individual mice 4 hours post IP administration at the
 Supplemental Figure Legends Figure S1. Plasma exposure levels of MKC-3946 in mice. Plasma exposure levels from individual mice 4 hours post IP administration at the indicated dose mg/kg. Data represent
SUPPLEMENTARY INFORMATION
 DOI:.38/ncb3399 a b c d FSP DAPI 5mm mm 5mm 5mm e Correspond to melanoma in-situ Figure a DCT FSP- f MITF mm mm MlanaA melanoma in-situ DCT 5mm FSP- mm mm mm mm mm g melanoma in-situ MITF MlanaA mm mm
Figure S1: Effects on haptotaxis are independent of effects on cell velocity A)
") Supplemental Figures Figure S1: Effects on haptotaxis are independent of effects on cell velocity A) Velocity of MV D7 fibroblasts expressing different GFP-tagged Ena/VASP family proteins in the haptotaxis
Supplemental Figures Figure S1: Effects on haptotaxis are independent of effects on cell velocity A) Velocity of MV D7 fibroblasts expressing different GFP-tagged Ena/VASP family proteins in the haptotaxis
Supplementary Information
 Supplementary Information mediates STAT3 activation at retromer-positive structures to promote colitis and colitis-associated carcinogenesis Zhang et al. a b d e g h Rel. Luc. Act. Rel. mrna Rel. mrna
Supplementary Figure 1. Repression of hepcidin expression in the liver of mice treated with
 Supplementary Figure 1. Repression of hepcidin expression in the liver of mice treated with DMN Immunohistochemistry for hepcidin and H&E staining (left). qrt-pcr assays for hepcidin in the liver (right).
Expanded View Figures
 Shao-Ming Shen et al Role of I in MT of cancers MO reports xpanded View igures igure V1. nalysis of the expression of I isoforms in cancer cells and their interaction with PTN. RT PR detection of Ish and
p = formed with HCI-001 p = Relative # of blood vessels that formed with HCI-002 Control Bevacizumab + 17AAG Bevacizumab 17AAG
 A.. Relative # of ECs associated with HCI-001 1.4 1.2 1.0 0.8 0.6 0.4 0.2 0.0 ol b p < 0.001 Relative # of blood vessels that formed with HCI-001 1.4 1.2 1.0 0.8 0.6 0.4 0.2 0.0 l b p = 0.002 Control IHC:
Supplementary Figure 1.TRIM33 binds β-catenin in the nucleus. a & b, Co-IP of endogenous TRIM33 with β-catenin in HT-29 cells (a) and HEK 293T cells
 and HEK 293T cells") Supplementary Figure 1.TRIM33 binds β-catenin in the nucleus. a & b, Co-IP of endogenous TRIM33 with β-catenin in HT-29 cells (a) and HEK 293T cells (b). TRIM33 was immunoprecipitated, and the amount of
Supplementary Figure 1.TRIM33 binds β-catenin in the nucleus. a & b, Co-IP of endogenous TRIM33 with β-catenin in HT-29 cells (a) and HEK 293T cells (b). TRIM33 was immunoprecipitated, and the amount of
Supplementary Figure 1. mrna expression of chitinase and chitinase-like protein in splenic immune cells. Each splenic immune cell population was
 Supplementary Figure 1. mrna expression of chitinase and chitinase-like protein in splenic immune cells. Each splenic immune cell population was sorted by FACS. Surface markers for sorting were CD11c +
Supplementary Figure 1 IMQ-Induced Mouse Model of Psoriasis. IMQ cream was
 Supplementary Figure 1 IMQ-Induced Mouse Model of Psoriasis. IMQ cream was painted on the shaved back skin of CBL/J and BALB/c mice for consecutive days. (a, b) Phenotypic presentation of mouse back skin
Supplementary Figures
 Supplementary Figures Supplementary Figure 1 Characterization of stable expression of GlucB and sshbira in the CT26 cell line (a) Live cell imaging of stable CT26 cells expressing green fluorescent protein
SUPPLEMENTARY FIGURES
 SUPPLEMENTARY FIGURES Figure S1. Clinical significance of ZNF322A overexpression in Caucasian lung cancer patients. (A) Representative immunohistochemistry images of ZNF322A protein expression in tissue
Nature Neuroscience: doi: /nn Supplementary Figure 1
 Supplementary Figure 1 EGFR inhibition activates signaling pathways (a-b) EGFR inhibition activates signaling pathways (a) U251EGFR cells were treated with erlotinib (1µM) for the indicated times followed
Supplementary Figures
 Supplementary Figures Supplementary Fig. 1. Galectin-3 is present within tumors. (A) mrna expression levels of Lgals3 (galectin-3) and Lgals8 (galectin-8) in the four classes of cell lines as determined
BRaf V600E cooperates with Pten silencing to elicit metastatic melanoma (Nature Genetics Supplementary Information)
") BRaf V600E cooperates with Pten silencing to elicit metastatic melanoma (Nature Genetics Supplementary Information) David Dankort, David P. Curley, Robert A. Cartlidge, Betsy Nelson, Anthony N. Karnezis,
BRaf V600E cooperates with Pten silencing to elicit metastatic melanoma (Nature Genetics Supplementary Information) David Dankort, David P. Curley, Robert A. Cartlidge, Betsy Nelson, Anthony N. Karnezis,
Supplemental Figure S1. RANK expression on human lung cancer cells.
 Supplemental Figure S1. RANK expression on human lung cancer cells. (A) Incidence and H-Scores of RANK expression determined from IHC in the indicated primary lung cancer subgroups. The overall expression
Supplemental Figure 1. Western blot analysis indicated that MIF was detected in the fractions of
 Supplemental Figure Legends Supplemental Figure 1. Western blot analysis indicated that was detected in the fractions of plasma membrane and cytosol but not in nuclear fraction isolated from Pkd1 null
Supplementary Figure 1. Normal T lymphocyte populations in Dapk -/- mice. (a) Normal thymic development in Dapk -/- mice. Thymocytes from WT and Dapk
 Normal thymic development in Dapk -/- mice. Thymocytes from WT and Dapk") Supplementary Figure 1. Normal T lymphocyte populations in Dapk -/- mice. (a) Normal thymic development in Dapk -/- mice. Thymocytes from WT and Dapk -/- mice were stained for expression of CD4 and CD8.
Supplementary Figure 1. Normal T lymphocyte populations in Dapk -/- mice. (a) Normal thymic development in Dapk -/- mice. Thymocytes from WT and Dapk -/- mice were stained for expression of CD4 and CD8.
Supplementary Figure 1 Chemokine and chemokine receptor expression during muscle regeneration (a) Analysis of CR3CR1 mrna expression by real time-pcr
 Analysis of CR3CR1 mrna expression by real time-pcr") Supplementary Figure 1 Chemokine and chemokine receptor expression during muscle regeneration (a) Analysis of CR3CR1 mrna expression by real time-pcr at day 0, 1, 4, 10 and 21 post- muscle injury. (b)
Supplementary Figure 1 Chemokine and chemokine receptor expression during muscle regeneration (a) Analysis of CR3CR1 mrna expression by real time-pcr at day 0, 1, 4, 10 and 21 post- muscle injury. (b)
SUPPLEMENTARY FIGURES AND TABLES
 SUPPLEMENTARY FIGURES AND TABLES Supplementary Figure S1: CaSR expression in neuroblastoma models. A. Proteins were isolated from three neuroblastoma cell lines and from the liver metastasis of a MYCN-non
TEB. Id4 p63 DAPI Merge. Id4 CK8 DAPI Merge
 a Duct TEB b Id4 p63 DAPI Merge Id4 CK8 DAPI Merge c d e Supplementary Figure 1. Identification of Id4-positive MECs and characterization of the Comma-D model. (a) IHC analysis of ID4 expression in the
SUPPLEMENTARY INFORMATION
 DOI: 1.138/ncb3355 a S1A8 + cells/ total.1.8.6.4.2 b S1A8/?-Actin c % T-cell proliferation 3 25 2 15 1 5 T cells Supplementary Figure 1 Inter-tumoral heterogeneity of MDSC accumulation in mammary tumor
Supplementary Figure 1: TSLP receptor skin expression in dcssc. A: Healthy control (HC) skin with TSLP receptor expression in brown (10x
 skin with TSLP receptor expression in brown (10x") Supplementary Figure 1: TSLP receptor skin expression in dcssc. A: Healthy control (HC) skin with TSLP receptor expression in brown (10x magnification). B: Second HC skin stained for TSLP receptor in brown
Supplementary Figure 1: TSLP receptor skin expression in dcssc. A: Healthy control (HC) skin with TSLP receptor expression in brown (10x magnification). B: Second HC skin stained for TSLP receptor in brown
Supplementary Table 1. The primers used for quantitative RT-PCR. Gene name Forward (5 > 3 ) Reverse (5 > 3 )
 Reverse (5 > 3 )") 770 771 Supplementary Table 1. The primers used for quantitative RT-PCR. Gene name Forward (5 > 3 ) Reverse (5 > 3 ) Human CXCL1 GCGCCCAAACCGAAGTCATA ATGGGGGATGCAGGATTGAG PF4 CCCCACTGCCCAACTGATAG TTCTTGTACAGCGGGGCTTG
770 771 Supplementary Table 1. The primers used for quantitative RT-PCR. Gene name Forward (5 > 3 ) Reverse (5 > 3 ) Human CXCL1 GCGCCCAAACCGAAGTCATA ATGGGGGATGCAGGATTGAG PF4 CCCCACTGCCCAACTGATAG TTCTTGTACAGCGGGGCTTG
Supplementary Figure 1. HOPX is hypermethylated in NPC. (a) Methylation levels of HOPX in Normal (n = 24) and NPC (n = 24) tissues from the
 Methylation levels of HOPX in Normal (n = 24) and NPC (n = 24) tissues from the") Supplementary Figure 1. HOPX is hypermethylated in NPC. (a) Methylation levels of HOPX in Normal (n = 24) and NPC (n = 24) tissues from the genome-wide methylation microarray data. Mean ± s.d.; Student
Supplementary Figure 1. HOPX is hypermethylated in NPC. (a) Methylation levels of HOPX in Normal (n = 24) and NPC (n = 24) tissues from the genome-wide methylation microarray data. Mean ± s.d.; Student
Nature Genetics: doi: /ng.3731
 Supplementary Figure 1 Circadian profiles of Adarb1 transcript and ADARB1 protein in mouse tissues. (a) Overlap of rhythmic transcripts identified in the previous transcriptome analyses. The mouse liver
Title page. Title: MicroRNA-155 Controls Exosome Synthesis and Promotes Gemcitabine Resistance in
 Title page Title: MicroRNA- Controls Synthesis and Promotes Gemcitabine Resistance in Pancreatic Ductal Adenocarcinoma Authors Manabu Mikamori, Daisaku Yamada, Hidetoshi Eguchi, Shinichiro Hasegawa, Tomoya
Supplementary Materials. for Garmy-Susini, et al, Integrin 4 1 signaling is required for lymphangiogenesis and tumor metastasis
 Supplementary Materials for Garmy-Susini, et al, Integrin 4 1 signaling is required for lymphangiogenesis and tumor metastasis 1 Supplementary Figure Legends Supplementary Figure 1: Integrin expression
Supplementary. properties of. network types. randomly sampled. subsets (75%
 Supplementary Information Gene co-expression network analysis reveals common system-level prognostic genes across cancer types properties of Supplementary Figure 1 The robustness and overlap of prognostic
Tbk1-TKO! DN cells (%)! 15! 10!
! 15! 10!") a! T Cells! TKO! B Cells! TKO! b! CD4! 8.9 85.2 3.4 2.88 CD8! Tbk1-TKO! 1.1 84.8 2.51 2.54 c! DN cells (%)! 4 3 2 1 DP cells (%)! 9 8 7 6 CD4 + SP cells (%)! 5 4 3 2 1 5 TKO! TKO! TKO! TKO! 15 1 5 CD8
a! T Cells! TKO! B Cells! TKO! b! CD4! 8.9 85.2 3.4 2.88 CD8! Tbk1-TKO! 1.1 84.8 2.51 2.54 c! DN cells (%)! 4 3 2 1 DP cells (%)! 9 8 7 6 CD4 + SP cells (%)! 5 4 3 2 1 5 TKO! TKO! TKO! TKO! 15 1 5 CD8
Predictive PP1Ca binding region in BIG3 : 1,228 1,232aa (-KAVSF-) HEK293T cells *** *** *** KPL-3C cells - E E2 treatment time (h)
 HEK293T cells *** *** *** KPL-3C cells - E E2 treatment time (h)") Relative expression ERE-luciferase activity activity (pmole/min) activity (pmole/min) activity (pmole/min) activity (pmole/min) MCF-7 KPL-3C ZR--1 BT-474 T47D HCC15 KPL-1 HBC4 activity (pmole/min) a d
Relative expression ERE-luciferase activity activity (pmole/min) activity (pmole/min) activity (pmole/min) activity (pmole/min) MCF-7 KPL-3C ZR--1 BT-474 T47D HCC15 KPL-1 HBC4 activity (pmole/min) a d
Supplementary Figure 1: si-craf but not si-braf sensitizes tumor cells to radiation.
 Supplementary Figure 1: si-craf but not si-braf sensitizes tumor cells to radiation. (a) Embryonic fibroblasts isolated from wildtype (WT), BRAF -/-, or CRAF -/- mice were irradiated (6 Gy) and DNA damage
Supplemental Information
 Supplemental Information Tobacco-specific Carcinogen Induces DNA Methyltransferases 1 Accumulation through AKT/GSK3β/βTrCP/hnRNP-U in Mice and Lung Cancer patients Ruo-Kai Lin, 1 Yi-Shuan Hsieh, 2 Pinpin
hexahistidine tagged GRP78 devoid of the KDEL motif (GRP78-His) on SDS-PAGE. This
 on SDS-PAGE. This") SUPPLEMENTAL FIGURE LEGEND Fig. S1. Generation and characterization of. (A) Coomassie staining of soluble hexahistidine tagged GRP78 devoid of the KDEL motif (GRP78-His) on SDS-PAGE. This protein was expressed
SUPPLEMENTAL FIGURE LEGEND Fig. S1. Generation and characterization of. (A) Coomassie staining of soluble hexahistidine tagged GRP78 devoid of the KDEL motif (GRP78-His) on SDS-PAGE. This protein was expressed
Supplementary Materials for
 www.sciencesignaling.org/cgi/content/full/8/364/ra18/dc1 Supplementary Materials for The tyrosine phosphatase (Pez) inhibits metastasis by altering protein trafficking Leila Belle, Naveid Ali, Ana Lonic,
Supplementary Figure 1. PD-L1 is glycosylated in cancer cells. (a) Western blot analysis of PD-L1 in breast cancer cells. (b) Western blot analysis
 Western blot analysis of PD-L1 in breast cancer cells. (b) Western blot analysis") Supplementary Figure 1. PD-L1 is glycosylated in cancer cells. (a) Western blot analysis of PD-L1 in breast cancer cells. (b) Western blot analysis of PD-L1 in ovarian cancer cells. (c) Western blot analysis
Supplementary Figure 1. PD-L1 is glycosylated in cancer cells. (a) Western blot analysis of PD-L1 in breast cancer cells. (b) Western blot analysis of PD-L1 in ovarian cancer cells. (c) Western blot analysis
Supporting Information Table of Contents
 Supporting Information Table of Contents Supporting Information Figure 1 Page 2 Supporting Information Figure 2 Page 4 Supporting Information Figure 3 Page 5 Supporting Information Figure 4 Page 6 Supporting
m 6 A mrna methylation regulates AKT activity to promote the proliferation and tumorigenicity of endometrial cancer
 SUPPLEMENTARY INFORMATION Articles https://doi.org/10.1038/s41556-018-0174-4 In the format provided by the authors and unedited. m 6 A mrna methylation regulates AKT activity to promote the proliferation
Supplementary information. The proton-sensing G protein-coupled receptor T-cell death-associated gene 8
 1 Supplementary information 2 3 The proton-sensing G protein-coupled receptor T-cell death-associated gene 8 4 (TDAG8) shows cardioprotective effects against myocardial infarction 5 Akiomi Nagasaka 1+,
Supplementary Figure 1 ITGB1 and ITGA11 increase with evidence for heterodimers following HSC activation. (a) Time course of rat HSC activation
 Time course of rat HSC activation") Supplementary Figure 1 ITGB1 and ITGA11 increase with evidence for heterodimers following HSC activation. (a) Time course of rat HSC activation indicated by the detection of -SMA and COL1 (log scale).
Supplementary Figure 1 ITGB1 and ITGA11 increase with evidence for heterodimers following HSC activation. (a) Time course of rat HSC activation indicated by the detection of -SMA and COL1 (log scale).
Supplementary Figure 1: STAT3 suppresses Kras-induced lung tumorigenesis
 Supplementary Figure 1: STAT3 suppresses Kras-induced lung tumorigenesis (a) Immunohistochemical (IHC) analysis of tyrosine 705 phosphorylation status of STAT3 (P- STAT3) in tumors and stroma (all-time
Supplemental Table 1 Molecular Profile of the SCLC Cell Line Panel
 Supplemental Table 1 Molecular Profile of the SCLC Cell Line Panel p53 RB Myc Cell Line Mutation A Mutation A Amplification B COR-L103 C p.y234c p.d584e L-Myc NCI-H526 p.s33_splice None N-Myc NCI-H1048
Pathologic Stage. Lymph node Stage
 ASC ASC a c Patient ID BMI Age Gleason score Non-obese PBMC 1 22.1 81 6 (3+3) PBMC 2 21.9 6 6 (3+3) PBMC 3 22 84 8 (4+4) PBMC 4 24.6 68 7 (3+4) PBMC 24. 6 (3+3) PBMC 6 24.7 73 7 (3+4) PBMC 7 23. 67 7 (3+4)
(a) Schematic diagram of the FS mutation of UVRAG in exon 8 containing the highly instable
 Schematic diagram of the FS mutation of UVRAG in exon 8 containing the highly instable") Supplementary Figure 1. Frameshift (FS) mutation in UVRAG. (a) Schematic diagram of the FS mutation of UVRAG in exon 8 containing the highly instable A 10 DNA repeat, generating a premature stop codon
Supplementary Figure 1. Frameshift (FS) mutation in UVRAG. (a) Schematic diagram of the FS mutation of UVRAG in exon 8 containing the highly instable A 10 DNA repeat, generating a premature stop codon
Supplementary Figure 1: Digitoxin induces apoptosis in primary human melanoma cells but not in normal melanocytes, which express lower levels of the
 Supplementary Figure 1: Digitoxin induces apoptosis in primary human melanoma cells but not in normal melanocytes, which express lower levels of the cardiac glycoside target, ATP1A1. (a) The percentage
fl/+ KRas;Atg5 fl/+ KRas;Atg5 fl/fl KRas;Atg5 fl/fl KRas;Atg5 Supplementary Figure 1. Gene set enrichment analyses. (a) (b)
 (b)") KRas;At KRas;At KRas;At KRas;At a b Supplementary Figure 1. Gene set enrichment analyses. (a) GO gene sets (MSigDB v3. c5) enriched in KRas;Atg5 fl/+ as compared to KRas;Atg5 fl/fl tumors using gene set
KRas;At KRas;At KRas;At KRas;At a b Supplementary Figure 1. Gene set enrichment analyses. (a) GO gene sets (MSigDB v3. c5) enriched in KRas;Atg5 fl/+ as compared to KRas;Atg5 fl/fl tumors using gene set
Supplementary Figure 1. The CagA-dependent wound healing or transwell migration of gastric cancer cell. AGS cells transfected with vector control or
 Supplementary Figure 1. The CagA-dependent wound healing or transwell migration of gastric cancer cell. AGS cells transfected with vector control or 3xflag-CagA expression vector were wounded using a pipette
Supplementary Figure 1. Expression of CUGBP1 in non-parenchymal liver cells treated with TGF-β
 Supplementary Figures Supplementary Figure 1. Expression of CUGBP1 in non-parenchymal liver cells treated with TGF-β and LPS. Non-parenchymal liver cells were isolated and treated with or without TGF-β
GPR120 *** * * Liver BAT iwat ewat mwat Ileum Colon. UCP1 mrna ***
 a GPR120 GPR120 mrna/ppia mrna Arbitrary Units 150 100 50 Liver BAT iwat ewat mwat Ileum Colon b UCP1 mrna Fold induction 20 15 10 5 - camp camp SB202190 - - - H89 - - - - - GW7647 Supplementary Figure
Supplementary Figure 1. IDH1 and IDH2 mutation site sequences on WHO grade III
 Supplementary Materials: Supplementary Figure 1. IDH1 and IDH2 mutation site sequences on WHO grade III patient samples. Genomic DNA samples extracted from punch biopsies from either FFPE or frozen tumor
Supplementary Figure 1. AdipoR1 silencing and overexpression controls. (a) Representative blots (upper and lower panels) showing the AdipoR1 protein
 Representative blots (upper and lower panels) showing the AdipoR1 protein") Supplementary Figure 1. AdipoR1 silencing and overexpression controls. (a) Representative blots (upper and lower panels) showing the AdipoR1 protein content relative to GAPDH in two independent experiments.
Supplementary Figure 1. AdipoR1 silencing and overexpression controls. (a) Representative blots (upper and lower panels) showing the AdipoR1 protein content relative to GAPDH in two independent experiments.
mir-509-5p and mir-1243 increase the sensitivity to gemcitabine by inhibiting
 mir-509-5p and mir-1243 increase the sensitivity to gemcitabine by inhibiting epithelial-mesenchymal transition in pancreatic cancer Hidekazu Hiramoto, M.D. 1,3, Tomoki Muramatsu, Ph.D. 1, Daisuke Ichikawa,
Supplementary Materials for
 www.sciencesignaling.org/cgi/content/full/3/114/ra23/dc1 Supplementary Materials for Regulation of Zap70 Expression During Thymocyte Development Enables Temporal Separation of CD4 and CD8 Repertoire Selection
SUPPLEMENTARY INFORMATION
 DOI: 10.1038/ncb3021 Supplementary figure 1 Characterisation of TIMPless fibroblasts. a) Relative gene expression of TIMPs1-4 by real time quantitative PCR (RT-qPCR) in WT or ΔTimp fibroblasts (mean ±
EPIGENETIC RE-EXPRESSION OF HIF-2α SUPPRESSES SOFT TISSUE SARCOMA GROWTH
 EPIGENETIC RE-EXPRESSION OF HIF-2α SUPPRESSES SOFT TISSUE SARCOMA GROWTH Supplementary Figure 1. Supplementary Figure 1. Characterization of KP and KPH2 autochthonous UPS tumors. a) Genotyping of KPH2
Supplemental Table S1
 Supplemental Table S. Tumorigenicity and metastatic potential of 44SQ cell subpopulations a Tumorigenicity b Average tumor volume (mm ) c Lung metastasis d CD high /4 8. 8/ CD low /4 6./ a Mice were injected
An epithelial-to-mesenchymal transition-inducing potential of. granulocyte macrophage colony-stimulating factor in colon. cancer
 An epithelial-to-mesenchymal transition-inducing potential of granulocyte macrophage colony-stimulating factor in colon cancer Yaqiong Chen, Zhi Zhao, Yu Chen, Zhonglin Lv, Xin Ding, Renxi Wang, He Xiao,
Supplementary Figure 1. Characterization of NMuMG-ErbB2 and NIC breast cancer cells expressing shrnas targeting LPP. NMuMG-ErbB2 cells (a) and NIC
 and NIC") Supplementary Figure 1. Characterization of NMuMG-ErbB2 and NIC breast cancer cells expressing shrnas targeting LPP. NMuMG-ErbB2 cells (a) and NIC cells (b) were engineered to stably express either a LucA-shRNA
Supplementary Figure 1. Characterization of NMuMG-ErbB2 and NIC breast cancer cells expressing shrnas targeting LPP. NMuMG-ErbB2 cells (a) and NIC cells (b) were engineered to stably express either a LucA-shRNA
T H E J O U R N A L O F C E L L B I O L O G Y
 Supplemental material Díaz et al., http://www.jcb.org/cgi/content/full/jcb.201209151/dc1 T H E J O U R N A L O F C E L L B I O L O G Y Figure S1. Hypoxia induces invadopodia formation in different epithelial
SUPPLEMENTARY INFORMATION
 doi:10.1038/nature11095 Supplementary Table 1. Summary of the binding between Angptls and various Igdomain containing receptors as determined by flow cytometry analysis. The results were summarized from
Supplement Results, Figures and Tables
 Supplement Results, Figures and Tables Results PET imaging The SUV was significantly higher in tumours of the parental HSC-3 cell line than tumours of the EV and the MMP-8 overexpressing cell lines (Figure
Cancer cells in vitro
 Supplementary Figure S1 Cancer cells in vitro Pretreatment with Control IgG (18h) Pretreatment with anti-u-par (18h) Acid Wash/Pretreatment with Control IgG (18h) Acid Wash/Pretreatment with anti-u-par
Nature Structural & Molecular Biology: doi: /nsmb Supplementary Figure 1. Differential expression of mirnas from the pri-mir-17-92a locus.
 Supplementary Figure 1 Differential expression of mirnas from the pri-mir-17-92a locus. (a) The mir-17-92a expression unit in the third intron of the host mir-17hg transcript. (b,c) Impact of knockdown
TMA-VARESE COHORT-1 TMA-BERN COHORT-2
 Supplementary Figure 1 TMA-VARESE COHORT-1 TOTAL SAMPLES #5 GLEASON SCORE Number Percentage 6 16 32% = 7 17 34% >7 17 34% TUMOR STAGE T2C 28 56% T3A- 21 42% T3C-T4 1 2% NODE STATUS N 42 84% N1 8 16% PSA
Supplementary Information Titles Journal: Nature Medicine
 Supplementary Information Titles Journal: Nature Medicine Article Title: Corresponding Author: Supplementary Item & Number Supplementary Fig.1 Fig.2 Fig.3 Fig.4 Fig.5 Fig.6 Fig.7 Fig.8 Fig.9 Fig. Fig.11
B220 CD4 CD8. Figure 1. Confocal Image of Sensitized HLN. Representative image of a sensitized HLN
 B220 CD4 CD8 Natarajan et al., unpublished data Figure 1. Confocal Image of Sensitized HLN. Representative image of a sensitized HLN showing B cell follicles and T cell areas. 20 µm thick. Image of magnification
Supplementary Figure 1 Expression of Crb3 in mouse sciatic nerve: biochemical analysis (a) Schematic of Crb3 isoforms, ERLI and CLPI, indicating the
 Schematic of Crb3 isoforms, ERLI and CLPI, indicating the") Supplementary Figure 1 Expression of Crb3 in mouse sciatic nerve: biochemical analysis (a) Schematic of Crb3 isoforms, ERLI and CLPI, indicating the location of the transmembrane (TM), FRM binding (FB)
Supplementary Figure 1 Expression of Crb3 in mouse sciatic nerve: biochemical analysis (a) Schematic of Crb3 isoforms, ERLI and CLPI, indicating the location of the transmembrane (TM), FRM binding (FB)
Supplementary Figure 1
 Supplementary Figure 1 YAP negatively regulates IFN- signaling. (a) Immunoblot analysis of Yap knockdown efficiency with sh-yap (#1 to #4 independent constructs) in Raw264.7 cells. (b) IFN- -Luc and PRDs
SUPPLEMENTARY INFORMATION
 DOI: 1.138/ncb222 / b. WB anti- WB anti- ulin Mitotic index (%) 14 1 6 2 T (h) 32 48-1 1 2 3 4 6-1 4 16 22 28 3 33 e. 6 4 2 Time (min) 1-6- 11-1 > 1 % cells Figure S1 depletion leads to mitotic defects
Supplementary Figure 1. H-PGDS deficiency does not affect GI tract functions and anaphylactic reaction. (a) Representative pictures of H&E-stained
 Representative pictures of H&E-stained") 1 2 3 4 5 6 7 8 9 10 11 Supplementary Figure 1. H-PGDS deficiency does not affect GI tract functions and anaphylactic reaction. (a) Representative pictures of H&E-stained jejunum sections ( 200 magnification;
1 2 3 4 5 6 7 8 9 10 11 Supplementary Figure 1. H-PGDS deficiency does not affect GI tract functions and anaphylactic reaction. (a) Representative pictures of H&E-stained jejunum sections ( 200 magnification;
Supplementary Information
 Supplementary Information An orally available, small-molecule interferon inhibits viral replication Hideyuki Konishi 1, Koichi Okamoto 1, Yusuke Ohmori 1, Hitoshi Yoshino 2, Hiroshi Ohmori 1, Motooki Ashihara
Adiponectin/T-cadherin system enhances exosome biogenesis and decreases cellular
 Supplemental Data Adiponectin/herin system enhances exosome biogenesis and decreases cellular ceramides by exosomal release 5 Yoshinari Obata, Shunbun Kita, *,, Yoshihisa Koyama, Shiro Fukuda, Hiroaki
a. b. c. d. e. f. g. h. i. j. k. l. m. n. o. p.
 a. b. c. d. e. f. g. h. i. j. k. l. 2.5 2 1.5 1.5 IL-1β 12 8 6 4 2 IL-1β 9 8 7 6 4 3 3 2.9 IL-1β m. n. o. p. 1.8 1.6 1.4 1.2 1.8.6.4.2 6h LPS 2 15 1 5 6h LPS 2 6h LPS 6 4 3 6h LPS Supplementary Figure
EGFR shrna A: CCGGCGCAAGTGTAAGAAGTGCGAACTCGAGTTCGCACTTCTTACACTTGCG TTTTTG. EGFR shrna B: CCGGAGAATGTGGAATACCTAAGGCTCGAGCCTTAGGTATTCCACATTCTCTT TTTG
 Supplementary Methods Sequence of oligonucleotides used for shrna targeting EGFR EGFR shrna were obtained from the Harvard RNAi consortium. The following oligonucleotides (forward primer) were used to
Supplementary Figure 1 IL-27 IL
 Tim-3 Supplementary Figure 1 Tc0 49.5 0.6 Tc1 63.5 0.84 Un 49.8 0.16 35.5 0.16 10 4 61.2 5.53 10 3 64.5 5.66 10 2 10 1 10 0 31 2.22 10 0 10 1 10 2 10 3 10 4 IL-10 28.2 1.69 IL-27 Supplementary Figure 1.
hemodynamic stress. A. Echocardiographic quantification of cardiac dimensions and function in
 SUPPLEMENTAL FIGURE LEGENDS Supplemental Figure 1. Fbn1 C1039G/+ hearts display normal cardiac function in the absence of hemodynamic stress. A. Echocardiographic quantification of cardiac dimensions and
Only Estrogen receptor positive is not enough to predict the prognosis of breast cancer
 Young Investigator Award, Global Breast Cancer Conference 2018 Only Estrogen receptor positive is not enough to predict the prognosis of breast cancer ㅑ Running head: Revisiting estrogen positive tumors
Supplementary Figure 1. Baf60c and baf180 are induced during cardiac regeneration in zebrafish. RNA in situ hybridization was performed on paraffin
 Supplementary Figure 1. Baf60c and baf180 are induced during cardiac regeneration in zebrafish. RNA in situ hybridization was performed on paraffin sections from sham-operated adult hearts (a and i) and
Suppl Video: Tumor cells (green) and monocytes (white) are seeded on a confluent endothelial
 and monocytes (white) are seeded on a confluent endothelial") Supplementary Information Häuselmann et al. Monocyte induction of E-selectin-mediated endothelial activation releases VE-cadherin junctions to promote tumor cell extravasation in the metastasis cascade
Supplementary Information Häuselmann et al. Monocyte induction of E-selectin-mediated endothelial activation releases VE-cadherin junctions to promote tumor cell extravasation in the metastasis cascade
Supplementary Materials for
 www.sciencesignaling.org/cgi/content/full/2/1/ra81/dc1 Supplementary Materials for Delivery of MicroRNA-126 by Apoptotic Bodies Induces CXCL12- Dependent Vascular Protection Alma Zernecke,* Kiril Bidzhekov,
Supplementary information. MARCH8 inhibits HIV-1 infection by reducing virion incorporation of envelope glycoproteins
 Supplementary information inhibits HIV-1 infection by reducing virion incorporation of envelope glycoproteins Takuya Tada, Yanzhao Zhang, Takayoshi Koyama, Minoru Tobiume, Yasuko Tsunetsugu-Yokota, Shoji
Interleukin-6 promotes pancreatic cancer cell migration by rapidly activating the small GTPase CDC42
 Interleukin-6 promotes pancreatic cancer cell migration by rapidly activating the small GTPase CDC42 Gina L. Razidlo, Kevin M. Burton, and Mark A. McNiven SUPPORTING INFORMATION Figure S1. IL-6 promotes
Supplementary Materials
 Supplementary Materials Supplementary figure 1. Taxonomic representation summarized at genus level. Fecal microbiota from a separate set of Jackson and Harlan mice prior to irradiation. A taxon was included
Supplemental Figure 1
 Supplemental Figure 1 1a 1c PD-1 MFI fold change 6 5 4 3 2 1 IL-1α IL-2 IL-4 IL-6 IL-1 IL-12 IL-13 IL-15 IL-17 IL-18 IL-21 IL-23 IFN-α Mut Human PD-1 promoter SBE-D 5 -GTCTG- -1.2kb SBE-P -CAGAC- -1.kb
Supplemental Data. TGF-β-mediated mir-181a expression promotes breast cancer metastasis by targeting Bim.
 Supplemental Data TGF-β-mediated mir-181a expression promotes breast cancer metastasis by targeting Bim. Molly A. Taylor 1, Khalid Sossey-Alaoui 2, Cheryl L. Thompson 3, David Danielpour 4, and William
Supplementary Figure S I: Effects of D4F on body weight and serum lipids in apoe -/- mice.
 Supplementary Figures: Supplementary Figure S I: Effects of D4F on body weight and serum lipids in apoe -/- mice. Male apoe -/- mice were fed a high-fat diet for 8 weeks, and given PBS (model group) or
Supplementary Figure 1: Comparison of acgh-based and expression-based CNA analysis of tumors from breast cancer GEMMs.
 Supplementary Figure 1: Comparison of acgh-based and expression-based CNA analysis of tumors from breast cancer GEMMs. (a) CNA analysis of expression microarray data obtained from 15 tumors in the SV40Tag