Nature Immunology: doi: /ni.3631
|
|
|
- Oswin Webster
- 5 years ago
- Views:
Transcription
1
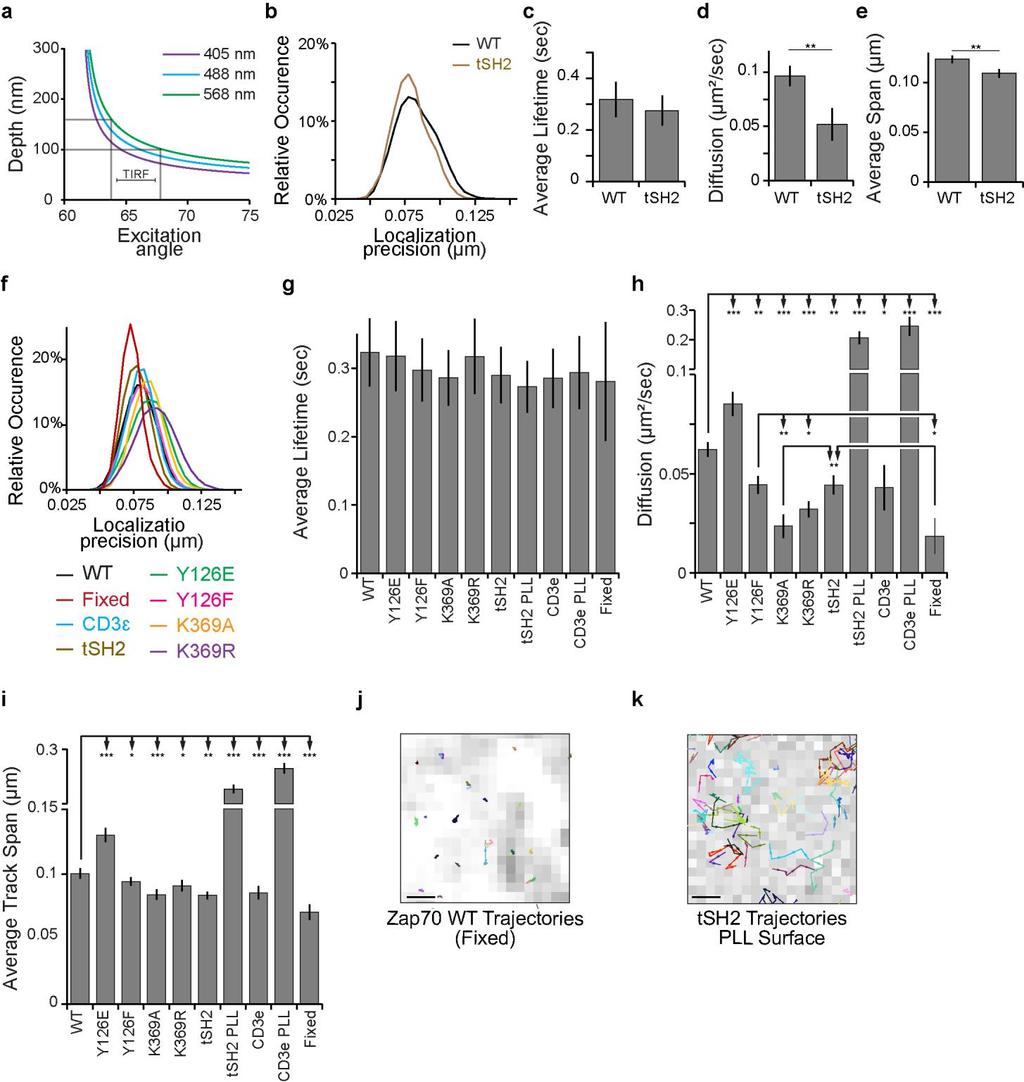
2 Supplementary Figure 1 SPT analyses of Zap70 at the T cell plasma membrane. (a) Total internal reflection fluorescent (TIRF) excitation at degrees limits single molecule detection to nm above the glass surface. (b) Distribution of single molecule localization precisions from all trajectories of murine wild-type Zap70 (WT; black) and the tandem SH module (tsh; brown) fused to PATagRFP in primary 5c.c7 T cells. (c) Average Trajectory lifetimes. (d) The average diffusion rate (τ = 500 ms). (e) Average trajectory spans (distance between the two furthest points in a trajectory). (f) Distribution of single molecule localization precisions from all trajectories in P116 Jurkat T cell lines expressing different forms of human Zap70 fused to PATagRFP. (g) Average trajectory lifetimes. (h) The average diffusion rate (τ = 500 ms). (i) Average trajectory spans. The T cell receptor (specifically CD3ɛ) was tracked on poly-l-lysine surfaces to reference free movement within the plasma membrane. (j) Zap70 trajectories in a fixed cell expressing WT overlaid with diffraction limited TCR microclusters (gray pixels). (k) Representative tracks of Zap70 s tsh module on non-stimulatory PLL surface. Data represents at least 3 independent experiments and 18 different cells for each condition. Significance was assessed with a two-tailed unpaired t-test between indicated samples (* p<0.05, ** p<0.01, *** p<0.001).
3 Supplementary Figure Inducible phosphorylation of Tyr16 in Zap70. (a) Detection of Y16 phosphorylation upon OKT3/OKT4 stimulation by mass spectrometry. Chromatogram of p-y16 containing peptide (sequence shown above) for non-stimulated (top) and stimulated (bottom) T cells. Graph (right) shows the percentage of p- Y16 phosphorylated peptide. (b) Western Blot analyses of lysates from non- and OKT3-stimulated P116 Jurkat T cells expressing WT, Y16E and Y16F using a rabbit serum raised against a peptide containing p-y16.
4
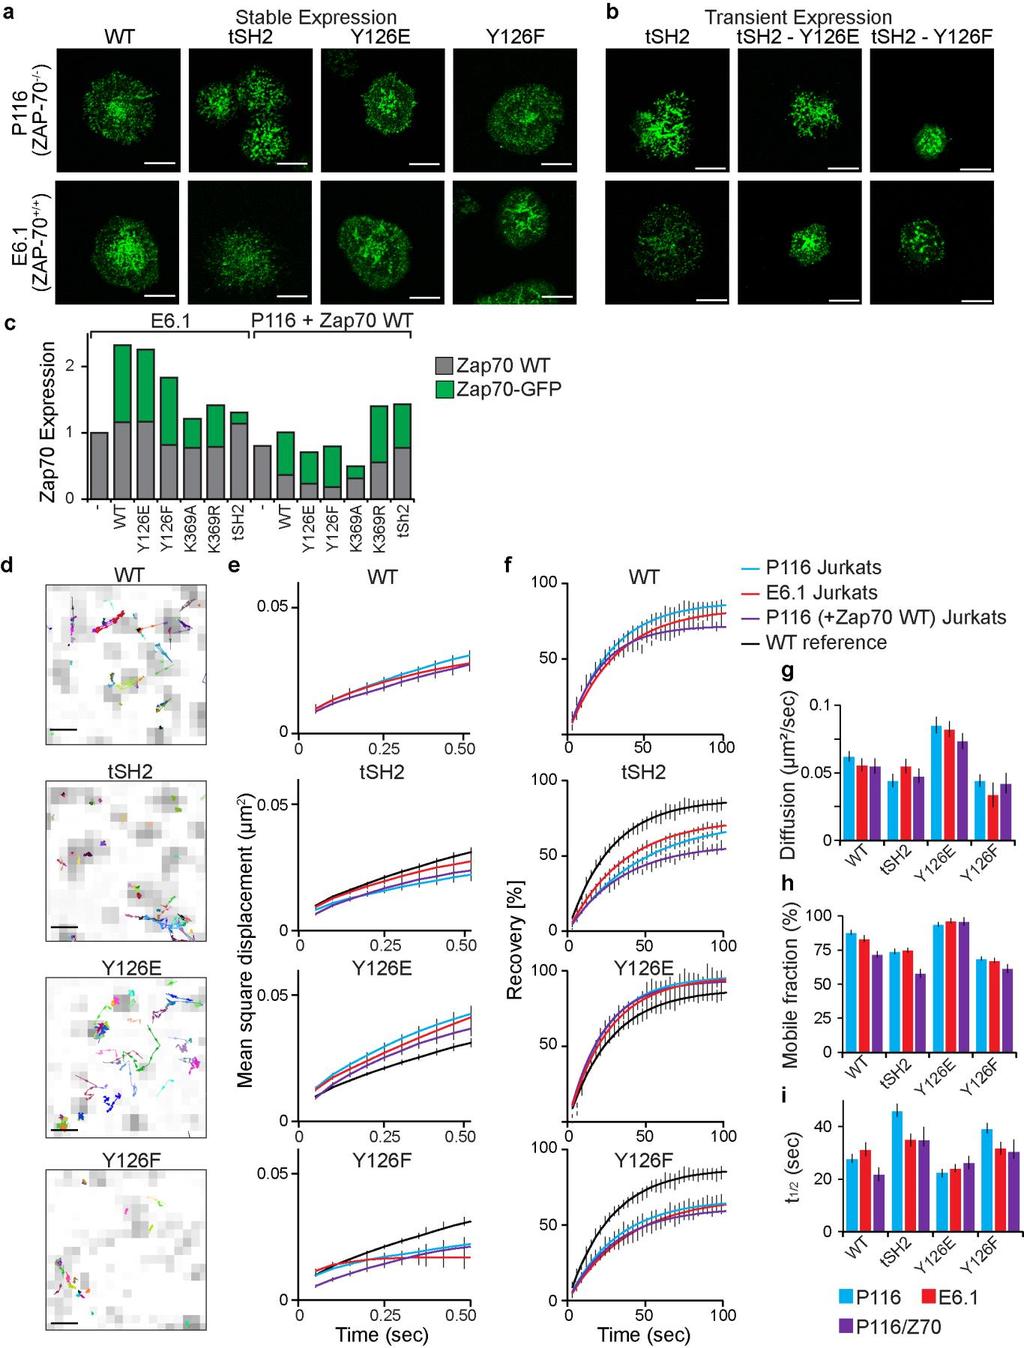
5 Supplementary Figure 3 Effects of endogenous Zap70 on the mobility of Zap70 mutants. (a) Confocal images of microclusters from fluorescence recovery after photobleaching (FRAP) experiments of GFP tagged Zap70 variants stably expressed in P116 (top) and E6.1 (bottom) Jurkat T cells. Scale bars represents 10 μm. (b) Microclusters of GFP tagged tsh, tsh-y16e and tsh-y16f transiently expressed in P116 (top) and E6.1 (bottom) Jurkat T cells. (c) Relative expression of Zap70-GFP constructs stably expressed in E6.1 cells with endogenous Zap70 and P116 exogenously expressing wild-type Zap70. (d) Trajectories of WT, tsh, Y16E and Y16F fused to PATagRFP in E6.1 Jurkat T cells expressing endogenous Zap70. Trajectories are overlaid on diffraction-limited images of TCR microclusters (CD3ζ-GFP; gray; 500nm scale bar). Pixels are nm. (e) Comparison of mean square displacement of Zap70 variants in P116 (cyan), E6.1 (red), and P116 + wild-type Zap70 Jurkat T cells (purple), with P116 WT curve as reference (black solid line). (f) FRAP recovery curves for WT, tsh, Y16E and Y16F fused to GFP in P116 (cyan), E6.1 Jurkat T cells (red), and P116 + wild-type Zap70 Jurkat T cells (purple). The data for WT in P116 Jurkat T cells is inserted as reference in each plot (solid black curve). (g) The average diffusion rate (τ = 500 ms) from SPT. (h) Bar graphs of average mobile fraction from FRAP. (i) average recovery rates (t 1/ ) from FRAP. Tracking data represents averages from at least ten cells from 3 independent experiments with ± s.e.m. Pixels are nm. FRAP data represent averages with s.e.m. from at least 11 different cells from 3 or more independent experiments. Error bars for mobile fractions and recovery rates (t 1/) represent the 95% confidence interval.
 Confocal images of microclusters from fluorescence recovery after photobleaching (FRAP) experiments of GFP tagged Zap70 ATP binding mutants (specifically K369A and K369R) stably expressed in P116")
6 Supplementary Figure 4 Inhibition of Zap70 s release at late time points requires Zap70 s kinase activity. (a) Confocal images of microclusters from fluorescence recovery after photobleaching (FRAP) experiments of GFP tagged Zap70 ATP binding mutants (specifically K369A and K369R) stably expressed in P116 (left) and E6.1 (right) Jurkat T cells. (b) Kinase dead Zap70s were analyzed in Zap70 deficient P116 (left) and E6.1 Jurkat T cells (right). Early time points (<10 min; black lines) are compared to data at late time points (>30 min; gray lines). (c) Bar graphs of average mobile fraction and average recovery rates (t 1/ ). FRAP data represent averages with s.e.m. from at least 15 different cells from 3 or more independent experiments. Error bars for mobile fractions and recovery rates t 1/ represent the 95% confidence interval.
 Flow cytometry analysis of original (left) and expression matched (right) WT, Y16E and Y16F expressing P116 Jurkat T cell lines.")
7 Supplementary Figure 5 Zap70 s release from the TCR controls downstream signaling. (a) Flow cytometry analysis of original (left) and expression matched (right) WT, Y16E and Y16F expressing P116 Jurkat T cell lines. Original cell lines were sorted for overlapping expression level (gray bar) and cultivated for one week before re-analyses. (b) Westernblot analyses of Y493 phosphorylation (p-y493, left) and total Zap70 protein (right) in non-sorted P116 Jurkat T cell lines after stimulation with different concentrations of OKT3. (c) Western-blot analyses of Lat phosphorylation (p-y171 + p-y191; left) and total Lat protein (right) in P116 Jurkat T cell lines after stimulation with different concentrations of OKT3.
8 Supplementary Figure 6 IL- secretion and Ca + flux of Jurkat T cell lines. (a) IL- secretion of P116 Jurkat T cell lines after stimulation with SEE pulsed Raji B cells. (b) IL- secretion of WT, Y16E and Y16F expressing P116 Jurkat T cell lines and E6.1 Jurkat T cells after stimulation with OKT3. Data represents averages ± s.e.m. from at least two independent measurements with duplicates. (c) Calcium flux of P116 Jurkat T cell lines stably expressing WT, Y16E and Y16F with 10 µg/ml, 1 µg/ml and 0.1 µg/ml OKT3. Ca-Flux was analyzed for T cells with matched GFP expression. The P116 Zap70 null cells and Kinase dead Zap70 mutants (K369A and K369R) are shown for 10 µg/ml OKT3 stimulation. Curves are population averages of the violet/blue ratio of Indo1 ratiometric calcium dye. (d) ER calcium release of sorted P116 WT, Y16E, and Y16F cell lines assessed by ratiometric Fura imaging on activating surfaces (10 μg/ml OKT3) in the absence of extracellular calcium. Curves represent averages ± s.e.m. from at least three independent experiments with at least ten cells analyzed from each experiment.
9
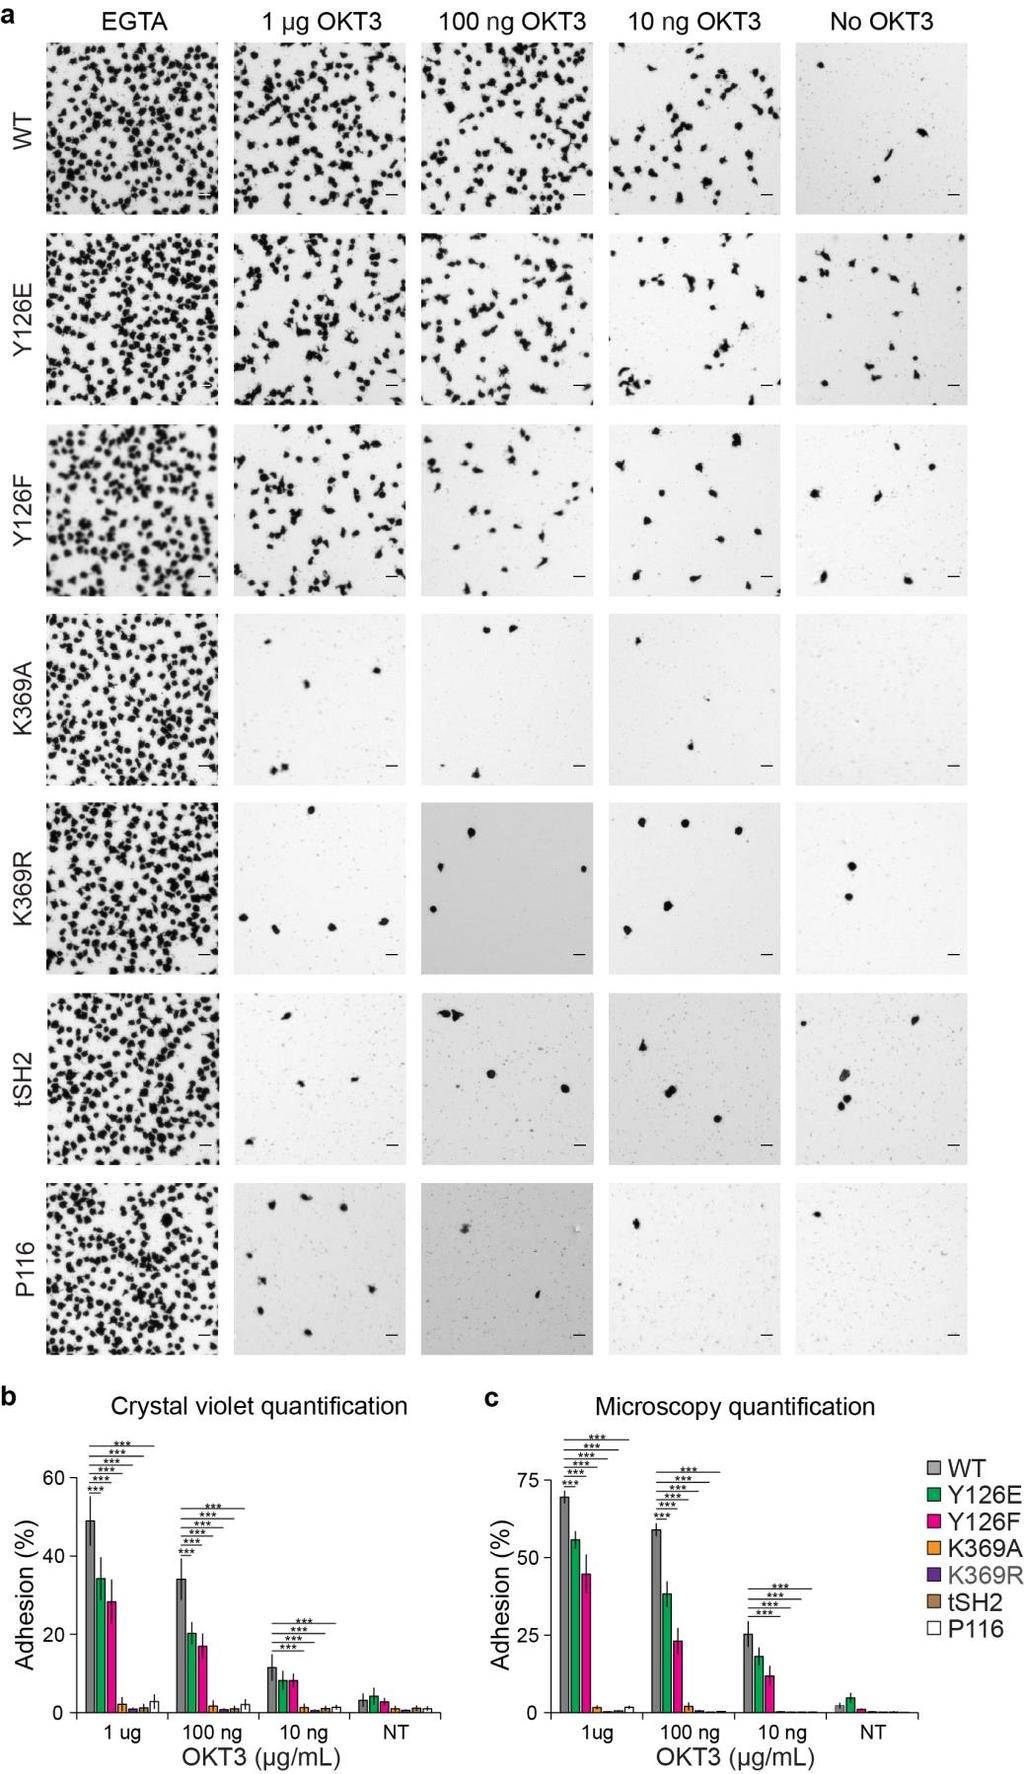
10 Supplementary Figure 7 Alteration of Zap70 s release from the TCR reduces adhesion to ICAM-1 after T cell stimulation. (a) Representative images of P116 Jurkat T cells stably expressing WT and mutant Zap70s adhered to ICAM-1 surfaces after stimulation with different concentrations of OKT3 (indicated above). Left column shows maximal adhesion upon treatment with MgCl /EGTA. (b) Quantification of cell adhesion by extraction of crystal violet from adherent cells in relation to MgCl /EGTA treatment. (c) Surface area covered by P116 Jurkat T cell lines in relation to MgCl /EGTA treatment. Scale bars are 0 μm. Error bars represent s.e.m. from three independent experiments with duplicates. Three images of different regions quantified for each sample. Significance was assessed with a two-tailed unpaired t-test (* p<0.05, ** p<0.01, *** p<0.001).

11 Supplementary Figure 8 The catch-and-release model for TCR signal amplification and dispersion. Proposed Catch-And-Release model for early and late Zap70 signaling at the TCR. Signaling events are indicated by numbered circles. In brief, upon TCR engagement by pmhc, Zap70 kinase is recruited to the Lck-phosphorylated ITAMs of the TCR-CD3- complex. During early signaling Zap70 is Lck- and/or auto-transphosphorylated on Y16, activated and binds ATP. Altogether, this induces Zap70 s release from the TCR into the plane of the plasma membrane. Released Zap70 translocates to other membrane domains to phosphorylate its substrates (e.g. LAT). The vacated p-itam is available to recruit, activate and release additional Zap70 molecules. This turns the TCR into a catalytic unit that amplifies antigenic stimuli. During later stages of T cell activation Zap70 release does not take place and Zap70 maintains TCR signaling while stably associated with p-itams, probably through phosphorylation of Y315 and Y319.
12 5c.c7 Primary T cells Lifetime (sec) Diffusion (µm /sec) Span (µm) WT ± ± ± tsh 0.76 ± ± ± Supplementary Table 1. SPT analyses of wild-type Zap70 and Zap70 s tsh module in Primary T cells. SPT analyses of WT and tsh Zap70 fused to PAtagRFP in primary 5c.c7 T cells on stimulatory surfaces. The diffusion (µm /sec), span (µm), and lifetime (sec) are averages ± s.e.m from at least 18 different cells from 3 or more independent experiments.
13 P116 T cells Lifetime (sec) Diffusion (µm /sec) Span (µm) WT 0.34 ± ± ± Y16E ± ± ± Y16F 0.98 ± ± ± K369A 0.86 ± ± ± K369R ± ± ± tsh 0.90 ± ± ± tsh on PLL 0.73 ± ± ± CD3ε 0.86 ± ± ± CD3ε on PLL 0.94 ± ± ± Fixed 0.81 ± ± ± Supplementary Table. SPT analyses of wild-type and mutant Zap70s in P116 cells. SPT analyses of WT and mutant Zap70s fused to PAtagRFP stably expressed in P116 T cells. T cells bound to non-activating (on PLL) and stimulatory surfaces (OKT3). The lifetime (sec), span (µm), and diffusion (µm /sec) are averages ± s.e.m from at least 18 different cells from 3 or more independent experiments.
14 Mobile fraction (f) P116 T cells E6.1 T cells t 1/ (sec) R Mobile fraction (f) P116 + wild-type Zap70 T cells t 1/ (sec) R Mobile t fraction (f) 1/ (sec) R WT 85 ± %.7 ± ± 3% 5.8 ± ± % 1.8 ± tsh 70 ± % 37.9 ± ± % 30.1 ± ± 3% 35.0 ± Y16E 94 ± % 19.5 ± ± % 18. ± ± 3% 6.3 ± Y16F 66 ± % 3.4 ± ± % 6.3 ± ± 3% 30.6 ± K369A 64 ± % 34.8 ± ± 3% 31.4 ± ± %.3 ± K369R 80 ± 1% 6.1 ± ± % 3.1 ± ± % 4.3 ± CD3ζ 13 ± 1% 15.3 ± ± 1% 1.3 ± Supplementary Table 3. FRAP analyses of wild-type and mutant Zap70s. FRAP analyses of wild-type and mutant Zap70s stably expressed in P116 (left), E6.1 (middle), and wild-type Zap70 P116 Jurkat T cells on OKT3 surfaces. The recovery (t 1/ ) is a measure for the time it takes 50% of the mobile fraction (f) to recover. Averages and s.e.m. were derived from exponential fits (R ) of each recovery curve from at least 15 cells from three independent experiments.
15 P116 T cells Mobile fraction (f) t 1/ (sec) R tsh 73 ± % 31.0 ± tsh-y16e 80 ± % 18.3 ± ZAP-70 Y16F 54 ± % 34.5 ± Supplementary Table 4. FRAP analyses of wild-type and mutant tandem SH domain modules. FRAP analyses of wild-type and mutant tshs transiently expressed in P116 (left) and E6.1 (right) Jurkat T cells on OKT3 surfaces. The recovery (t 1/ ) is a measure for the time it takes 50% of the mobile fraction (f) to recover. Averages and s.e.m. were derived from exponential fits (R ) of each recovery curve from at least 15 cells over three independent experiments.
16 Diffusion (µm /sec) P116 Cells E6.1 T cells P116 + wild type Zap70 T cells WT 0.06 ± ± ± Y16E ± ± ± Y16F ± ± ± K369A 0.04 ± ± ± K369R 0.03 ± ± ± tsh ± ± ± Supplementary Table 5. SPT analyses of wild-type and mutant Zap70s in P116 cells compared to E6.1 and Zap70 re-expression P116 cells. SPT analyses of WT and mutant Zap70s fused to PAtagRFP stably expressed in P116 (left), E6.1 (middle), and Zap70 WT re-expression P116 Jurkat T cells on OKT3 surfaces. The diffusion (µm /sec) averages ± s.e.m are from at least 11 different cells from 3 or more independent experiments.
17 Diffusion (µm /sec) Early Mobile fraction (f) t 1/ (sec) R Diffusion (µm /sec) Late Mobile fraction (f) t 1/ (sec) R WT 0.06 ± ± %.7 ± ± ± 1% 1.8 ± Y16E ± ± % 19.5 ± ± ± 1% 11.7 ± Supplementary Table 6. Mobility of Zap70 WT and Y16E at early and late signaling. SPT analyses measured the diffusion (µm /sec) of WT and Y16E fused to PATagRFP stably expressed in P116 Jurkat T cells on OKT3 surfaces at early (<10 minutes) and late (>30 minutes) signaling. FRAP analyses of WT and Y16E fused to GFP and stably expressed in P116 Jurkat T cells on OKT3 surfaces. The recovery (t 1/ ) is a measure for the time it takes 50% of the mobile fraction (f) to recover. Averages and s.e.m. were derived from exponential fits (R ) of each recovery curve from at least 10 cells over three independent experiments.
18 Cell line Mobile fraction (f) Early t 1/ (sec) R Mobile fraction (f) Late t 1/ (sec) R K369A P ± % 34.8 ± ± 4% 36.4 ± K369A E ± 3% 31.4 ± ± 1% 18.5 ± K369R P ± 1% 6.1 ± ± %.9 ± K369R E ± % 3.1 ± ± 1% 17.6 ± Supplementary Table 7. FRAP of Zap70 kinase mutants at early and late signaling in P116 and E6.1 cells. FRAP analyses of Zap70 kinase mutants stably expressed in P116 and E6.1 Jurkat T cells on OKT3 surfaces at early (<10 minutes) and late (>30 minutes) signaling. The recovery (t 1/ ) is a measure for the time it takes 50% of the mobile fraction (f) to recover. Averages and s.e.m. were derived from exponential fits (R ) of each recovery curve from at least 15 cells over three independent experiments.
19 ZAP-70 D461N : Competitor Competitor 1 : 3 1 : 1 1 : 0.3 ATP WT 0. ± ± ± ZAP-70 Y16E 0.69 ± ± ± ZAP-70 Y16F 0.17 ± ± ± tsh 0.13 ± ± ± tsh Y16E 0.41 ± ± ± tsh Y16F 0.14 ± ± ± ZAP-70 D461N 0.3 ± ± ± ZAP-70 K369A 0.06 ± ± ± ZAP-70 K369R 0.6 ± ± ± ZAP-70 D461N 0.5 ± ± ± ZAP-70 K369A 0. ± ± ± ZAP-70 K369R 0.3 ± ± ± Supplementary Table 8. Competition of wild-type and mutant Zap70s for p-cd3γ binding. The table represents binding (%) of tagged kinase dead Zap70 (D461N) to p-cd3γ when competing with the indicated ratios of untagged wild-type and mutant Zap70s. 100% equals binding of D461N without competitor. Each value represents averages of triplicate samples from at least three independent experiments and errors represent s.e.m.
20 K D (nm) k on (1/Ms) k off (1/s) X R WT 0.1 ± ± 0.9E ± 0.9E ± 0.08 >0.99 tsh Y16E* 76.8 ± 1..6 ± 0.5E ± 4.7E ± 0.01 >0.99 tsh Y16F.4 ± ± 0.5E ± 0.1E ± 0.05 >0.99 Supplementary Table 9. Binding constants of wild-type and mutant tandem SH domain modules binding to p-cd3γ. Binding constants (K D ), on-rates (k on ), and off-rates (k off ) for each tsh variant from three independent experiments. tsh-y16e* fits best to a two-component model and the effective binding constants shown here are the averages weighted by contributions of a weak and strong binding constants. Errors represent standard error about the mean. X and R values represent the average of fits from all experiments.
21 st set of constants nd set of constants ATP 1 K D (nm) 1 1 k on (1/Ms) 1 k off (1/s) (nm) k on (1/Ms) k off (1/s) Pop K D Fit X Fit R 1x10 4 1x10⁻⁴ 1x10 5 1x10 - Pop WT ±4.1.5±0.8.1±0. 9±% 114± ± ±0. 8±% 0.06±0.03 >0.99 WT +.5± ± ±0.9 7±% 116± ± ±0. 8±8% 0.05±0.0 >0.99 K369A - 3.6± ± ±0.1 89±% 87.1± ± ±0.1 11±% 0.09±0.03 >0.99 K369A + 5.1±0.9.0± ±0. 93±1% 88.7± ±0. 1.5±0.1 7±1% 0.03±0.01 >0.99 K369R - 3.6± ± ±0.1 85±3% 90.±17..3± ±0.1 15±3% 0.13±0.05 >0.99 K369R ± ± ±0.7 46±1% 70.6±15..8±0.3.3±0.1 54±1% 0.13±0.03 >0.99 D461N - 7.1±1.0 7.± ±0.7 71±1% 101± ±0. 1.3±0.1 9±1% 0.4±0.05 >0.99 D461N + 11.± ± ±0.9 49±1% 86.±5.3.4±0..1±0. 51±1% 0.16±0.04 >0.99 Supplementary Table 10. Binding constants of wild-type and kinase dead Zap70s binding to p-cd3γ derived from a two-component fit. Binding constants (K D 1+ ), on-rates (k on 1+ ), and off-rates (k off 1+ ) for wild-type and kinase dead Zap70 were derived from a two-component fit representing high affinity and the low affinity states. Binding constants represent means and standard errors about the mean from at least three independent experiments. X and R values represent the average of fits from all experiments.
22 eff k eff ATP K D (nm) on (1/Ms) k off (1/s) x 10 4 x 10⁻³ WT ± ± ± 0.0 WT ± ± ± 1.00 K369A ± ± ± 0.0 K369A ± ± ± 0.10 K369R ± ± ± 0.03 K369R ± ± ± 0.80 D461N ± ± ± 0.10 D461N ± ± ± 0.90 Supplementary Table 11. Effective binding constants of wild-type and kinase dead Zap70s binding to p-cd3γ. Effective binding constants (K D eff ), on-rates (k on eff ), and off-rates (k off eff ) for wild-type and kinase dead Zap70 were derived from the relative contribution of the high affinity and the low affinity state. Binding constants represent means and standard errors about the mean from at least three independent experiments. X and R values represent the average of fits from all experiments.
23 1 Antibody Clone Catalog # Company Mouse anti CD3epsilon OKT ebiosciences Mouse anti Myc-tag 9E10 MA1-980 Fisher Scientific Mouse anti HA-tag 1CA Becton Dickinson Mouse anti-gfp mab (biotinylated) 9F Rockland Mouse anti Zap70 C-terminus BD Biosciences Mouse anti Zap70 N-terminus F Upstate Rabbit anti Zap70 ER7() Epitomics Rabbit anti phosphoy9 Zap70 - sc-1945 Santa Cruz Rabbit anti phosphoy319 Zap70 - sc-1946 Santa Cruz Rabbit anti phosphoy49 Zap70 EP91Y 15-1 Epitomics Mouse anti phosphoy493 Zap MAB7694 R&D Systems Rabbit anti phosphoy16 Zap Generated with ProSci, Inc. Mouse anti phosphotyrosine 4G10 BE0194 Bio-X-Cell Rabbit anti phosphoy191 Lat Cell Signaling Technology Rabbit anti phosphoy171 Lat S Cell Signaling Technology Rabbit anti Lat Millipore Supplementary Table 1. List of primary antibodies.
Incorporation of photo-caged lysine (pc-lys) at K273 of human LCK allows specific control of the enzyme activity.
 at K273 of human LCK allows specific control of the enzyme activity.") Supplementary Figure 1 Incorporation of photo-caged lysine (pc-lys) at K273 of human LCK allows specific control of the enzyme activity. (a) Modeling of the kinase domain of LCK with ATP (left) or pc-lys
Supplementary Figure 1 Incorporation of photo-caged lysine (pc-lys) at K273 of human LCK allows specific control of the enzyme activity. (a) Modeling of the kinase domain of LCK with ATP (left) or pc-lys
(a) Significant biological processes (upper panel) and disease biomarkers (lower panel)
 Significant biological processes (upper panel) and disease biomarkers (lower panel)") Supplementary Figure 1. Functional enrichment analyses of secretomic proteins. (a) Significant biological processes (upper panel) and disease biomarkers (lower panel) 2 involved by hrab37-mediated secretory
Supplementary Figure 1. Functional enrichment analyses of secretomic proteins. (a) Significant biological processes (upper panel) and disease biomarkers (lower panel) 2 involved by hrab37-mediated secretory
Supplementary material. VAMP7 controls T cell activation by regulating recruitment and phosphorylation of vesicular
 Supplementary material VAMP7 controls T cell activation by regulating recruitment and phosphorylation of vesicular Lat to the TCR activation sites. Paola Larghi, David J Williamson, Jean-Marie Carpier,
Supplementary Information. Conformational states of Lck regulate clustering in early T cell signaling
 Supplementary Information Conformational states of Lck regulate clustering in early T cell signaling Jérémie Rossy, Dylan M. Owen, David J. Williamson, Zhengmin Yang and Katharina Gaus Centre for Vascular
Nature Biotechnology: doi: /nbt.3828
 Supplementary Figure 1 Development of a FRET-based MCS. (a) Linker and MA2 modification are indicated by single letter amino acid code. indicates deletion of amino acids and N or C indicate the terminus
Supplementary Figure 1 CD4 + T cells from PKC-θ null mice are defective in NF-κB activation during T cell receptor signaling. CD4 + T cells were
 Supplementary Figure 1 CD4 + T cells from PKC-θ null mice are defective in NF-κB activation during T cell receptor signaling. CD4 + T cells were isolated from wild type (PKC-θ- WT) or PKC-θ null (PKC-θ-KO)
Supplementary Figure 1. BMS enhances human T cell activation in vitro in a
 Supplementary Figure 1. BMS98662 enhances human T cell activation in vitro in a concentration-dependent manner. Jurkat T cells were activated with anti-cd3 and anti-cd28 antibody in the presence of titrated
Appendix. Table of Contents
 Appendix Table of Contents Appendix Figures Figure S1: Gp78 is not required for the degradation of mcherry-cl1 in Hela Cells. Figure S2: Indel formation in the MARCH6 sgrna targeted HeLa clones. Figure
SUPPLEMENTARY INFORMATION
 SUPPLEMENTARY INFORMATION doi:10.1038/nature11429 S1a 6 7 8 9 Nlrc4 allele S1b Nlrc4 +/+ Nlrc4 +/F Nlrc4 F/F 9 Targeting construct 422 bp 273 bp FRT-neo-gb-PGK-FRT 3x.STOP S1c Nlrc4 +/+ Nlrc4 F/F casp1
Schwarz et al. Activity-Dependent Ubiquitination of GluA1 Mediates a Distinct AMPAR Endocytosis
 Schwarz et al Activity-Dependent Ubiquitination of GluA1 Mediates a Distinct AMPAR Endocytosis and Sorting Pathway Supplemental Data Supplemental Fie 1: AMPARs undergo activity-mediated ubiquitination
LPS LPS P6 - + Supplementary Fig. 1.
 P6 LPS - - - + + + - LPS + + - - P6 + Supplementary Fig. 1. Pharmacological inhibition of the JAK/STAT blocks LPS-induced HMGB1 nuclear translocation. RAW 267.4 cells were stimulated with LPS in the absence
Supplementary Table; Supplementary Figures and legends S1-S21; Supplementary Materials and Methods
 Silva et al. PTEN posttranslational inactivation and hyperactivation of the PI3K/Akt pathway sustain primary T cell leukemia viability Supplementary Table; Supplementary Figures and legends S1-S21; Supplementary
Supplementary Materials for
 www.sciencesignaling.org/cgi/content/full/6/283/ra57/dc1 Supplementary Materials for JNK3 Couples the Neuronal Stress Response to Inhibition of Secretory Trafficking Guang Yang,* Xun Zhou, Jingyan Zhu,
Supplementary Figure 1. PD-L1 is glycosylated in cancer cells. (a) Western blot analysis of PD-L1 in breast cancer cells. (b) Western blot analysis
 Western blot analysis of PD-L1 in breast cancer cells. (b) Western blot analysis") Supplementary Figure 1. PD-L1 is glycosylated in cancer cells. (a) Western blot analysis of PD-L1 in breast cancer cells. (b) Western blot analysis of PD-L1 in ovarian cancer cells. (c) Western blot analysis
Supplementary Figure 1. PD-L1 is glycosylated in cancer cells. (a) Western blot analysis of PD-L1 in breast cancer cells. (b) Western blot analysis of PD-L1 in ovarian cancer cells. (c) Western blot analysis
a b G75 G60 Sw-2 Sw-1 Supplementary Figure 1. Structure predictions by I-TASSER Server.
 a b G75 2 2 G60 Sw-2 Sw-1 Supplementary Figure 1. Structure predictions by I-TASSER Server. a. Overlay of top 10 models generated by I-TASSER illustrates the potential effect of 7 amino acid insertion
Supplementary Figure 1.TRIM33 binds β-catenin in the nucleus. a & b, Co-IP of endogenous TRIM33 with β-catenin in HT-29 cells (a) and HEK 293T cells
 and HEK 293T cells") Supplementary Figure 1.TRIM33 binds β-catenin in the nucleus. a & b, Co-IP of endogenous TRIM33 with β-catenin in HT-29 cells (a) and HEK 293T cells (b). TRIM33 was immunoprecipitated, and the amount of
Supplementary Figure 1.TRIM33 binds β-catenin in the nucleus. a & b, Co-IP of endogenous TRIM33 with β-catenin in HT-29 cells (a) and HEK 293T cells (b). TRIM33 was immunoprecipitated, and the amount of
SUPPLEMENTAL FIGURE LEGENDS
 SUPPLEMENTAL FIGURE LEGENDS Supplemental Figure S1: Endogenous interaction between RNF2 and H2AX: Whole cell extracts from 293T were subjected to immunoprecipitation with anti-rnf2 or anti-γ-h2ax antibodies
T H E J O U R N A L O F C E L L B I O L O G Y
 T H E J O U R N A L O F C E L L B I O L O G Y Supplemental material Krenn et al., http://www.jcb.org/cgi/content/full/jcb.201110013/dc1 Figure S1. Levels of expressed proteins and demonstration that C-terminal
CD3 coated cover slips indicating stimulatory contact site, F-actin polymerization and
 SUPPLEMENTAL FIGURES FIGURE S1. Detection of MCs. A, Schematic representation of T cells stimulated on anti- CD3 coated cover slips indicating stimulatory contact site, F-actin polymerization and microclusters.
Type of file: PDF Title of file for HTML: Supplementary Information Description: Supplementary Figures
 Type of file: PDF Title of file for HTML: Supplementary Information Description: Supplementary Figures Type of file: MOV Title of file for HTML: Supplementary Movie 1 Description: NLRP3 is moving along
Supplemental Data Figure S1 Effect of TS2/4 and R6.5 antibodies on the kinetics of CD16.NK-92-mediated specific lysis of SKBR-3 target cells.
 Supplemental Data Figure S1. Effect of TS2/4 and R6.5 antibodies on the kinetics of CD16.NK-92-mediated specific lysis of SKBR-3 target cells. (A) Specific lysis of IFN-γ-treated SKBR-3 cells in the absence
Supplementary Figure 1. Properties of various IZUMO1 monoclonal antibodies and behavior of SPACA6. (a) (b) (c) (d) (e) (f) (g) .
 (b) (c) (d) (e) (f) (g) .") Supplementary Figure 1. Properties of various IZUMO1 monoclonal antibodies and behavior of SPACA6. (a) The inhibitory effects of new antibodies (Mab17 and Mab18). They were investigated in in vitro fertilization
Supplementary Figure 1. Properties of various IZUMO1 monoclonal antibodies and behavior of SPACA6. (a) The inhibitory effects of new antibodies (Mab17 and Mab18). They were investigated in in vitro fertilization
The clathrin adaptor Numb regulates intestinal cholesterol. absorption through dynamic interaction with NPC1L1
 The clathrin adaptor Numb regulates intestinal cholesterol absorption through dynamic interaction with NPC1L1 Pei-Shan Li 1, Zhen-Yan Fu 1,2, Ying-Yu Zhang 1, Jin-Hui Zhang 1, Chen-Qi Xu 1, Yi-Tong Ma
Supplementary Figure 1
 Supplementary Figure 1 Supplementary Figure 1. Neither the activation nor suppression of the MAPK pathway affects the ASK1/Vif interaction. (a, b) HEK293 cells were cotransfected with plasmids encoding
Supplementary Material and Methods
 Online Supplement Kockx et al, Secretion of Apolipoprotein E from Macrophages 1 Supplementary Material and Methods Cloning of ApoE-GFP Full-length human apoe3 cdna (pcdna3.1/zeo + -apoe) was kindly provided
SUPPLEMENTARY INFORMATION
 Supplementary Figures Supplementary Figure S1. Binding of full-length OGT and deletion mutants to PIP strips (Echelon Biosciences). Supplementary Figure S2. Binding of the OGT (919-1036) fragments with
Supplementary Fig. 1. GPRC5A post-transcriptionally down-regulates EGFR expression. (a) Plot of the changes in steady state mrna levels versus
 Plot of the changes in steady state mrna levels versus") Supplementary Fig. 1. GPRC5A post-transcriptionally down-regulates EGFR expression. (a) Plot of the changes in steady state mrna levels versus changes in corresponding proteins between wild type and Gprc5a-/-
Supplementary Fig. 1. GPRC5A post-transcriptionally down-regulates EGFR expression. (a) Plot of the changes in steady state mrna levels versus changes in corresponding proteins between wild type and Gprc5a-/-
Supplementary Materials for
 www.sciencesignaling.org/cgi/content/full/3/114/ra23/dc1 Supplementary Materials for Regulation of Zap70 Expression During Thymocyte Development Enables Temporal Separation of CD4 and CD8 Repertoire Selection
Rescue of mutant rhodopsin traffic by metformin-induced AMPK activation accelerates photoreceptor degeneration Athanasiou et al
 Supplementary Material Rescue of mutant rhodopsin traffic by metformin-induced AMPK activation accelerates photoreceptor degeneration Athanasiou et al Supplementary Figure 1. AICAR improves P23H rod opsin
genome edited transient transfection, CMV promoter
 Supplementary Figure 1. In the absence of new protein translation, overexpressed caveolin-1-gfp is degraded faster than caveolin-1-gfp expressed from the endogenous caveolin 1 locus % loss of total caveolin-1-gfp
Supplementary Figure 1
 Supplementary Figure 1 how HFD how HFD Epi WT p p Hypothalamus p p Inguinal WT T Liver Lean mouse adipocytes p p p p p p Obese mouse adipocytes Kidney Muscle Spleen Heart p p p p p p p p Extracellular
Expanded View Figures
 MO reports PR3 dephosphorylates TZ Xian-o Lv et al xpanded View igures igure V1. PR3 dephosphorylates and inactivates YP/TZ., Overexpression of tight junction proteins Pals1 () or LIN7 () has no effect
Supplementary Figures
 Supplementary Figures Supplementary Figure 1 Characterization of stable expression of GlucB and sshbira in the CT26 cell line (a) Live cell imaging of stable CT26 cells expressing green fluorescent protein
Functional analysis of LAT in TCR-mediated signaling pathways using a LAT-deficient Jurkat cell line
 International Immunology, Vol. 11, No. 6, pp. 943 950 Functional analysis of LAT in TCR-mediated signaling pathways using a LAT-deficient Jurkat cell line Weiguo Zhang, Brenda J. Irvin 1,2, Ronald P. Trible,
Supplementary Figure 1: Expression of NFAT proteins in Nfat2-deleted B cells (a+b) Protein expression of NFAT2 (a) and NFAT1 (b) in isolated splenic
 Protein expression of NFAT2 (a) and NFAT1 (b) in isolated splenic") Supplementary Figure 1: Expression of NFAT proteins in Nfat2-deleted B cells (a+b) Protein expression of NFAT2 (a) and NFAT1 (b) in isolated splenic B cells from WT Nfat2 +/+, TCL1 Nfat2 +/+ and TCL1 Nfat2
Supplementary Figure 1: Expression of NFAT proteins in Nfat2-deleted B cells (a+b) Protein expression of NFAT2 (a) and NFAT1 (b) in isolated splenic B cells from WT Nfat2 +/+, TCL1 Nfat2 +/+ and TCL1 Nfat2
SUPPLEMENTARY INFORMATION
 Supplemental Figure 1. Furin is efficiently deleted in CD4 + and CD8 + T cells. a, Western blot for furin and actin proteins in CD4cre-fur f/f and fur f/f Th1 cells. Wild-type and furin-deficient CD4 +
HEK293FT cells were transiently transfected with reporters, N3-ICD construct and
 Supplementary Information Luciferase reporter assay HEK293FT cells were transiently transfected with reporters, N3-ICD construct and increased amounts of wild type or kinase inactive EGFR. Transfections
Nature Genetics: doi: /ng Supplementary Figure 1. HOX fusions enhance self-renewal capacity.
 Supplementary Figure 1 HOX fusions enhance self-renewal capacity. Mouse bone marrow was transduced with a retrovirus carrying one of three HOX fusion genes or the empty mcherry reporter construct as described
Supplementary Figure 1: si-craf but not si-braf sensitizes tumor cells to radiation.
 Supplementary Figure 1: si-craf but not si-braf sensitizes tumor cells to radiation. (a) Embryonic fibroblasts isolated from wildtype (WT), BRAF -/-, or CRAF -/- mice were irradiated (6 Gy) and DNA damage
F-actin VWF Vinculin. F-actin. Vinculin VWF
 a F-actin VWF Vinculin b F-actin VWF Vinculin Supplementary Fig. 1. WPBs in HUVECs are located along stress fibers and at focal adhesions. (a) Immunofluorescence images of f-actin (cyan), VWF (yellow),
SUPPLEMENTARY INFORMATION. Supplementary Figures S1-S9. Supplementary Methods
 SUPPLEMENTARY INFORMATION SUMO1 modification of PTEN regulates tumorigenesis by controlling its association with the plasma membrane Jian Huang 1,2#, Jie Yan 1,2#, Jian Zhang 3#, Shiguo Zhu 1, Yanli Wang
SUPPLEMENTARY INFORMATION
 DOI: 10.1038/ncb2566 Figure S1 CDKL5 protein expression pattern and localization in mouse brain. (a) Multiple-tissue western blot from a postnatal day (P) 21 mouse probed with an antibody against CDKL5.
Rapid parallel measurements of macroautophagy and mitophagy in
 Supplemental Figures Rapid parallel measurements of macroautophagy and mitophagy in mammalian cells using a single fluorescent biosensor Sargsyan A, Cai J, Fandino LB, Labasky ME, Forostyan T, Colosimo
RAW264.7 cells stably expressing control shrna (Con) or GSK3b-specific shrna (sh-
 or GSK3b-specific shrna (sh-") 1 a b Supplementary Figure 1. Effects of GSK3b knockdown on poly I:C-induced cytokine production. RAW264.7 cells stably expressing control shrna (Con) or GSK3b-specific shrna (sh- GSK3b) were stimulated
1 a b Supplementary Figure 1. Effects of GSK3b knockdown on poly I:C-induced cytokine production. RAW264.7 cells stably expressing control shrna (Con) or GSK3b-specific shrna (sh- GSK3b) were stimulated
In vitro membrane reconstitution of the T-cell receptor proximal signaling network
 Supplemental Information In vitro membrane reconstitution of the T-cell receptor proximal signaling network Enfu Hui 1,2 & Ronald D Vale 1,2 1 The Howard Hughes Medical Institute, University of California,
Supplementary Figure 1 (previous page). EM analysis of full-length GCGR. (a) Exemplary tilt pair images of the GCGR mab23 complex acquired for Random
. EM analysis of full-length GCGR. (a) Exemplary tilt pair images of the GCGR mab23 complex acquired for Random") S1 Supplementary Figure 1 (previous page). EM analysis of full-length GCGR. (a) Exemplary tilt pair images of the GCGR mab23 complex acquired for Random Conical Tilt (RCT) reconstruction (left: -50,right:
S1 Supplementary Figure 1 (previous page). EM analysis of full-length GCGR. (a) Exemplary tilt pair images of the GCGR mab23 complex acquired for Random Conical Tilt (RCT) reconstruction (left: -50,right:
Supplemental Materials. STK16 regulates actin dynamics to control Golgi organization and cell cycle
 Supplemental Materials STK16 regulates actin dynamics to control Golgi organization and cell cycle Juanjuan Liu 1,2,3, Xingxing Yang 1,3, Binhua Li 1, Junjun Wang 1,2, Wenchao Wang 1, Jing Liu 1, Qingsong
Fig. S1. High K+ increases intracellular calcium level.
 Fig. S1. High K + increases intracellular calcium level. (A) Neuronal activation measured by calcium imaging using Fura-2. Intracellular calcium levels were continuously monitored by the fura-2 florescence
Supporting Information Table of Contents
 Supporting Information Table of Contents Supporting Information Figure 1 Page 2 Supporting Information Figure 2 Page 4 Supporting Information Figure 3 Page 5 Supporting Information Figure 4 Page 6 Supporting
SUPPLEMENTARY FIGURES AND TABLES
 SUPPLEMENTARY FIGURES AND TABLES Supplementary Figure S1: CaSR expression in neuroblastoma models. A. Proteins were isolated from three neuroblastoma cell lines and from the liver metastasis of a MYCN-non
Supplementary Information
 Supplementary Information Intrinsic Photosensitivity Enhances Motility of T Lymphocytes by Phan X. Thieu, Barbara Jaruga, Sandeep C. Pingle, Bidhan C. Bandyopadhyay, & Gerard P. Ahern Supplementary Figure
Supplementary Figure 1: Characterisation of phospho-fgfr-y463 antibody. (A)
") Supplementary Figure 1: Characterisation of phospho-fgfr-y463 antibody. (A) Cells over-expressing hfgfr1-pcdna3 (+) or pcdna3 (-) were stimulated for 10 minutes with 50ng/ml FGF2 and lysates immunoblotted
Supplementary Figure 1: Characterisation of phospho-fgfr-y463 antibody. (A) Cells over-expressing hfgfr1-pcdna3 (+) or pcdna3 (-) were stimulated for 10 minutes with 50ng/ml FGF2 and lysates immunoblotted
Fig. S1. Subcellular localization of overexpressed LPP3wt-GFP in COS-7 and HeLa cells. Cos7 (top) and HeLa (bottom) cells expressing for 24 h human
 and HeLa (bottom) cells expressing for 24 h human") Fig. S1. Subcellular localization of overexpressed LPP3wt-GFP in COS-7 and HeLa cells. Cos7 (top) and HeLa (bottom) cells expressing for 24 h human LPP3wt-GFP, fixed and stained for GM130 (A) or Golgi97
Fig. S1. Subcellular localization of overexpressed LPP3wt-GFP in COS-7 and HeLa cells. Cos7 (top) and HeLa (bottom) cells expressing for 24 h human LPP3wt-GFP, fixed and stained for GM130 (A) or Golgi97
MicroRNA sponges: competitive inhibitors of small RNAs in mammalian cells
 MicroRNA sponges: competitive inhibitors of small RNAs in mammalian cells Margaret S Ebert, Joel R Neilson & Phillip A Sharp Supplementary figures and text: Supplementary Figure 1. Effect of sponges on
Supplementary Figure S1 (a) (b)
 (b)") Supplementary Figure S1: IC87114 does not affect basal Ca 2+ level nor nicotineinduced Ca 2+ influx. (a) Bovine chromaffin cells were loaded with Fluo-4AM (1 μm) in buffer A containing 0.02% of pluronic
Supplementary Figure S1: IC87114 does not affect basal Ca 2+ level nor nicotineinduced Ca 2+ influx. (a) Bovine chromaffin cells were loaded with Fluo-4AM (1 μm) in buffer A containing 0.02% of pluronic
Supplementary Figure 1
 Supplementary Figure 1 6 HE-50 HE-116 E-1 HE-108 Supplementary Figure 1. Targeted drug response curves of endometrial cancer cells. Endometrial cancer cell lines were incubated with serial dilutions of
Supplementary information: Binding of N-methylscopolamine to the extracellular domain of muscarinic acetylcholine receptors
 Supplementary information: Binding of N-methylscopolamine to the extracellular domain of muscarinic acetylcholine receptors Jan Jakubík, Alena Randáková, Pavel Zimčík, Esam E. El-Fakahany, and Vladimír
marker. DAPI labels nuclei. Flies were 20 days old. Scale bar is 5 µm. Ctrl is
 Supplementary Figure 1. (a) Nos is detected in glial cells in both control and GFAP R79H transgenic flies (arrows), but not in deletion mutant Nos Δ15 animals. Repo is a glial cell marker. DAPI labels
T H E J O U R N A L O F C E L L B I O L O G Y
 Supplemental material Jewell et al., http://www.jcb.org/cgi/content/full/jcb.201007176/dc1 T H E J O U R N A L O F C E L L B I O L O G Y Figure S1. IR Munc18c association is independent of IRS-1. (A and
A. Generation and characterization of Ras-expressing autophagycompetent
 Supplemental Material Supplemental Figure Legends Fig. S1 A. Generation and characterization of Ras-expressing autophagycompetent and -deficient cell lines. HA-tagged H-ras V12 was stably expressed in
In Vivo Significance of ITK SLP-76 Interaction in Cytokine Production
 MOLECULAR AND CELLULAR BIOLOGY, July, p. 3596 3609 Vol. 30, No. 14 0270-7306/10/$12.00 doi:10.1128/mcb.01657-09 Copyright, American Society for Microbiology. All Rights Reserved. In Vivo Significance of
Lecture 7: Signaling Through Lymphocyte Receptors
 Lecture 7: Signaling Through Lymphocyte Receptors Questions to Consider After recognition of its cognate MHC:peptide, how does the T cell receptor activate immune response genes? What are the structural
Supplementary Materials for
 advances.sciencemag.org/cgi/content/full/3/6/e1700338/dc1 Supplementary Materials for HIV virions sense plasma membrane heterogeneity for cell entry Sung-Tae Yang, Alex J. B. Kreutzberger, Volker Kiessling,
NF-κB p65 (Phospho-Thr254)
") Assay Biotechnology Company www.assaybiotech.com Tel: 1-877-883-7988 Fax: 1-877-610-9758 NF-κB p65 (Phospho-Thr254) Colorimetric Cell-Based ELISA Kit Catalog #: OKAG02015 Please read the provided manual
Assay Biotechnology Company www.assaybiotech.com Tel: 1-877-883-7988 Fax: 1-877-610-9758 NF-κB p65 (Phospho-Thr254) Colorimetric Cell-Based ELISA Kit Catalog #: OKAG02015 Please read the provided manual
doi: /nature10632
 SUPPLEMENTARY INFORMATION doi:10.1038/nature10632 Supplementary Figure 1 Lyn mediates neutrophil wound responses as a redox sensor. a, A schematic model. Wounded epithelial cells release H 2 O 2 by an
SUPPLEMENTARY INFORMATION
 doi:10.1038/nature11095 Supplementary Table 1. Summary of the binding between Angptls and various Igdomain containing receptors as determined by flow cytometry analysis. The results were summarized from
Crystallization-grade After D After V3 cocktail. Time (s) Time (s) Time (s) Time (s) Time (s) Time (s)
 Time (s) Time (s) Time (s) Time (s) Time (s)") Ligand Type Name 6 Crystallization-grade After 447-52D After V3 cocktail Receptor CD4 Resonance Units 5 1 5 1 5 1 Broadly neutralizing antibodies 2G12 VRC26.9 Resonance Units Resonance Units 3 1 15 1 5
Ligand Type Name 6 Crystallization-grade After 447-52D After V3 cocktail Receptor CD4 Resonance Units 5 1 5 1 5 1 Broadly neutralizing antibodies 2G12 VRC26.9 Resonance Units Resonance Units 3 1 15 1 5
Supplementary Materials
 Supplementary Materials Figure S1. MTT Cell viability assay. To measure the cytotoxic potential of the oxidative treatment, the MTT [3-(4,5-dimethylthiazol- 2-yl)-2,5-diphenyl tetrazolium bromide] assay
SUPPLEMENTARY INFORMATION
 DOI: 10.1038/ncb2988 Supplementary Figure 1 Kif7 L130P encodes a stable protein that does not localize to cilia tips. (a) Immunoblot with KIF7 antibody in cell lysates of wild-type, Kif7 L130P and Kif7
LFA-1 activates focal adhesion kinases FAK1/PYK2 to generate LAT-GRB2-SKAP1 complexes that terminate T-cell conjugate formation
 Received 27 Sep 216 Accepted 23 May 217 Published 12 Jul 217 DOI: 1.138/ncomms161 OPEN LFA-1 activates focal adhesion kinases /PYK2 to generate -GRB2- complexes that terminate T-cell conjugate formation
Supplementary Data 1. Alanine substitutions and position variants of APNCYGNIPL. Applied in
 Supplementary Data 1. Alanine substitutions and position variants of APNCYGNIPL. Applied in Supplementary Fig. 2 Substitution Sequence Position variant Sequence original APNCYGNIPL original APNCYGNIPL
Nature Immunology: doi: /ni Supplementary Figure 1. Cytokine pattern in skin in response to urushiol.
 Supplementary Figure 1 Cytokine pattern in skin in response to urushiol. Wild-type (WT) and CD1a-tg mice (n = 3 per group) were sensitized and challenged with urushiol (uru) or vehicle (veh). Quantitative
Dynamic Partitioning of a GPI-Anchored Protein in Glycosphingolipid-Rich Microdomains Imaged by Single-Quantum Dot Tracking
 Additional data for Dynamic Partitioning of a GPI-Anchored Protein in Glycosphingolipid-Rich Microdomains Imaged by Single-Quantum Dot Tracking Fabien Pinaud 1,3, Xavier Michalet 1,3, Gopal Iyer 1, Emmanuel
SUPPLEMENTARY INFORMATION
 Complete but curtailed T-cell response to very-low-affinity antigen Dietmar Zehn, Sarah Y. Lee & Michael J. Bevan Supp. Fig. 1: TCR chain usage among endogenous K b /Ova reactive T cells. C57BL/6 mice
T H E J O U R N A L O F C E L L B I O L O G Y
 Supplemental material Chen et al., http://www.jcb.org/cgi/content/full/jcb.201210119/dc1 T H E J O U R N A L O F C E L L B I O L O G Y Figure S1. Lack of fast reversibility of UVR8 dissociation. (A) HEK293T
crossmark Ca V subunits interact with the voltage-gated calcium channel
 crossmark THE JOURNAL OF BIOLOGICAL CHEMISTRY VOL. 291, NO. 39, pp. 20402 20416, September 23, 2016 Author s Choice 2016 by The American Society for Biochemistry and Molecular Biology, Inc. Published in
Feedback Circuits Monitor and Adjust Basal Lck-Dependent Events in T Cell Receptor Signaling
 IMMUNOLOGY Feedback Circuits Monitor and Adjust Basal Lck-Dependent Events in T Cell Receptor Signaling Jamie R. Schoenborn, 1 * Ying Xim Tan, 1 Chao Zhang, 2 Kevan M. Shokat, 2,3 Arthur Weiss 1,3 The
Supplementary Figure 1. Using DNA barcode-labeled MHC multimers to generate TCR fingerprints
 Supplementary Figure 1 Using DNA barcode-labeled MHC multimers to generate TCR fingerprints (a) Schematic overview of the workflow behind a TCR fingerprint. Each peptide position of the original peptide
Supplementary Figure 1 Expression of Crb3 in mouse sciatic nerve: biochemical analysis (a) Schematic of Crb3 isoforms, ERLI and CLPI, indicating the
 Schematic of Crb3 isoforms, ERLI and CLPI, indicating the") Supplementary Figure 1 Expression of Crb3 in mouse sciatic nerve: biochemical analysis (a) Schematic of Crb3 isoforms, ERLI and CLPI, indicating the location of the transmembrane (TM), FRM binding (FB)
Supplementary Figure 1 Expression of Crb3 in mouse sciatic nerve: biochemical analysis (a) Schematic of Crb3 isoforms, ERLI and CLPI, indicating the location of the transmembrane (TM), FRM binding (FB)
Supplementary Figure 1
 Supplementary Figure 1 YAP negatively regulates IFN- signaling. (a) Immunoblot analysis of Yap knockdown efficiency with sh-yap (#1 to #4 independent constructs) in Raw264.7 cells. (b) IFN- -Luc and PRDs
Figure S1. Western blot analysis of clathrin RNA interference in human DCs Human immature DCs were transfected with 100 nm Clathrin SMARTpool or
 Figure S1. Western blot analysis of clathrin RNA interference in human DCs Human immature DCs were transfected with 100 nm Clathrin SMARTpool or control nontargeting sirnas. At 90 hr after transfection,
Supplementary Figure 1
 Supplementary Figure 1 a γ-h2ax MDC1 RNF8 FK2 BRCA1 U2OS Cells sgrna-1 ** 60 sgrna 40 20 0 % positive Cells (>5 foci per cell) b ** 80 sgrna sgrna γ-h2ax MDC1 γ-h2ax RNF8 FK2 MDC1 BRCA1 RNF8 FK2 BRCA1
SUPPLEMENTARY INFORMATION
 SUPPLEMENTARY INFORMATION doi:1.138/nature9814 a A SHARPIN FL B SHARPIN ΔNZF C SHARPIN T38L, F39V b His-SHARPIN FL -1xUb -2xUb -4xUb α-his c Linear 4xUb -SHARPIN FL -SHARPIN TF_LV -SHARPINΔNZF -SHARPIN
Supplementary Figure S1. Venn diagram analysis of mrna microarray data and mirna target analysis. (a) Western blot analysis of T lymphoblasts (CLS)
 Western blot analysis of T lymphoblasts (CLS)") Supplementary Figure S1. Venn diagram analysis of mrna microarray data and mirna target analysis. (a) Western blot analysis of T lymphoblasts (CLS) and their exosomes (EXO) in resting (REST) and activated
Supplementary Figure S1. Venn diagram analysis of mrna microarray data and mirna target analysis. (a) Western blot analysis of T lymphoblasts (CLS) and their exosomes (EXO) in resting (REST) and activated
Supplementary Figure 1. MAT IIα is Acetylated at Lysine 81.
 IP: Flag a Mascot PTM Modified Mass Error Position Gene Names Score Score Sequence m/z [ppm] 81 MAT2A;AMS2;MATA2 35.6 137.28 _AAVDYQK(ac)VVR_ 595.83-2.28 b Pre-immu After-immu Flag- WT K81R WT K81R / Flag
(a) Schematic diagram of the FS mutation of UVRAG in exon 8 containing the highly instable
 Schematic diagram of the FS mutation of UVRAG in exon 8 containing the highly instable") Supplementary Figure 1. Frameshift (FS) mutation in UVRAG. (a) Schematic diagram of the FS mutation of UVRAG in exon 8 containing the highly instable A 10 DNA repeat, generating a premature stop codon
Supplementary Figure 1. Frameshift (FS) mutation in UVRAG. (a) Schematic diagram of the FS mutation of UVRAG in exon 8 containing the highly instable A 10 DNA repeat, generating a premature stop codon
SUPPLEMENTARY FIGURES
 SUPPLEMENTARY FIGURES Supplementary Figure 1. (A) Left, western blot analysis of ISGylated proteins in Jurkat T cells treated with 1000U ml -1 IFN for 16h (IFN) or left untreated (CONT); right, western
Tbk1-TKO! DN cells (%)! 15! 10!
! 15! 10!") a! T Cells! TKO! B Cells! TKO! b! CD4! 8.9 85.2 3.4 2.88 CD8! Tbk1-TKO! 1.1 84.8 2.51 2.54 c! DN cells (%)! 4 3 2 1 DP cells (%)! 9 8 7 6 CD4 + SP cells (%)! 5 4 3 2 1 5 TKO! TKO! TKO! TKO! 15 1 5 CD8
a! T Cells! TKO! B Cells! TKO! b! CD4! 8.9 85.2 3.4 2.88 CD8! Tbk1-TKO! 1.1 84.8 2.51 2.54 c! DN cells (%)! 4 3 2 1 DP cells (%)! 9 8 7 6 CD4 + SP cells (%)! 5 4 3 2 1 5 TKO! TKO! TKO! TKO! 15 1 5 CD8
Supplementary information to: Mechanism of lipopolysaccharide-induced skin edema formation in the mouse
 Supplementary information to: Mechanism of lipopolysaccharide-induced skin edema formation in the mouse Ivan Zanoni*, Renato Ostuni*, Simona Barresi, Marco Di Gioia, Achille Broggi, Barbara Costa, Roberta
Signal-Transduction Cascades - 2. The Phosphoinositide Cascade
 Signal-Transduction Cascades - 2 The Phosphoinositide Cascade Calcium ion as a second messenger Tyrosine kinase and receptor dimerization scribd.com Faisal Khatib JU The Phosphoinositide Cascade Used by
Supplemental Figure 1. Western blot analysis indicated that MIF was detected in the fractions of
 Supplemental Figure Legends Supplemental Figure 1. Western blot analysis indicated that was detected in the fractions of plasma membrane and cytosol but not in nuclear fraction isolated from Pkd1 null
Influenza A virus hemagglutinin and neuraminidase act as novel motile machinery. Tatsuya Sakai, Shin I. Nishimura, Tadasuke Naito, and Mineki Saito
 Supplementary Information for: Influenza A virus hemagglutinin and neuraminidase act as novel motile machinery Tatsuya Sakai, Shin I. Nishimura, Tadasuke Naito, and Mineki Saito Supplementary Methods Supplementary
Lentiviral Delivery of Combinatorial mirna Expression Constructs Provides Efficient Target Gene Repression.
 Supplementary Figure 1 Lentiviral Delivery of Combinatorial mirna Expression Constructs Provides Efficient Target Gene Repression. a, Design for lentiviral combinatorial mirna expression and sensor constructs.
SHREE ET AL, SUPPLEMENTAL MATERIALS. (A) Workflow for tumor cell line derivation and orthotopic implantation.
 Workflow for tumor cell line derivation and orthotopic implantation.") SHREE ET AL, SUPPLEMENTAL MATERIALS SUPPLEMENTAL FIGURE AND TABLE LEGENDS Supplemental Figure 1. Derivation and characterization of TS1-TGL and TS2-TGL PyMT cell lines and development of an orthotopic
SHREE ET AL, SUPPLEMENTAL MATERIALS SUPPLEMENTAL FIGURE AND TABLE LEGENDS Supplemental Figure 1. Derivation and characterization of TS1-TGL and TS2-TGL PyMT cell lines and development of an orthotopic
Suppl Video: Tumor cells (green) and monocytes (white) are seeded on a confluent endothelial
 and monocytes (white) are seeded on a confluent endothelial") Supplementary Information Häuselmann et al. Monocyte induction of E-selectin-mediated endothelial activation releases VE-cadherin junctions to promote tumor cell extravasation in the metastasis cascade
Supplementary Information Häuselmann et al. Monocyte induction of E-selectin-mediated endothelial activation releases VE-cadherin junctions to promote tumor cell extravasation in the metastasis cascade
Supplementary Figure 1. A. Bar graph representing the expression levels of the 19 indicated genes in the microarrays analyses comparing human lung
 Supplementary Figure 1. A. Bar graph representing the expression levels of the 19 indicated genes in the microarrays analyses comparing human lung immortalized broncho-epithelial cells (AALE cells) expressing
Supplementary Materials for
 www.sciencesignaling.org/cgi/content/full/8/364/ra18/dc1 Supplementary Materials for The tyrosine phosphatase (Pez) inhibits metastasis by altering protein trafficking Leila Belle, Naveid Ali, Ana Lonic,
Time after injection (hours) ns ns
 ns ns") Platelet life span (% iotinylated platelets) 1 8 6 4 2 4 24 48 72 96 Time after injection (hours) 6 4 2 IgG GPIα GPIβ GPII GPVI Receptor expression (GeoMean, fluorescence inteity) Supplementary figure
Platelet life span (% iotinylated platelets) 1 8 6 4 2 4 24 48 72 96 Time after injection (hours) 6 4 2 IgG GPIα GPIβ GPII GPVI Receptor expression (GeoMean, fluorescence inteity) Supplementary figure
SUPPLEMENTARY INFORMATION
 doi:10.1038/nature10353 Supplementary Figure 1. Mutations of UBQLN2 in patients with ALS and ALS/dementia. (a) A mutation, c.1489c>t (p.p497s), was identified in F#9975. The pedigree is shown on the left
Immunology Basics Relevant to Cancer Immunotherapy: T Cell Activation, Costimulation, and Effector T Cells
 Immunology Basics Relevant to Cancer Immunotherapy: T Cell Activation, Costimulation, and Effector T Cells Andrew H. Lichtman, M.D. Ph.D. Department of Pathology Brigham and Women s Hospital and Harvard