CHARACTERISING HEPATIC B CELL SUBSETS IN HUMAN CHRONIC LIVER DISEASE
|
|
|
- Zoe Potter
- 5 years ago
- Views:
Transcription
1 CHARACTERISING HEPATIC B CELL SUBSETS IN HUMAN CHRONIC LIVER DISEASE By Sudha Purswani BSc. (Hons.), MRes A thesis submitted to The University of Birmingham for the degree of DOCTOR OF PHILOSOPHY Centre for Liver Research, 5th Floor IBR Medical School Building The University of Birmingham Edgbaston Birmingham B15 2TT United Kingdom November 216
2 University of Birmingham Research Archive e-theses repository This unpublished thesis/dissertation is copyright of the author and/or third parties. The intellectual property rights of the author or third parties in respect of this work are as defined by The Copyright Designs and Patents Act 1988 or as modified by any successor legislation. Any use made of information contained in this thesis/dissertation must be in accordance with that legislation and must be properly acknowledged. Further distribution or reproduction in any format is prohibited without the permission of the copyright holder.
3 Abstract B cells have been proven to have a significant role in liver fibrosis. We postulate that enrichment of B cell subsets in hepatic diseases may implicate this population in liver pathogenesis. When comparing total B cells from human immune and non-immune-mediated liver disease explants, we found an enrichment of CD2+ B cells in PBC. Furthermore, phenotypic characterization of 11 B cell subsets in matched liver and blood highlighted an enriched naïve peripheral population, and activated B cell subsets in livers. Newly identified CD19+CD24-CD38- and CD19+CD24-CD38int B cells were also augmented in livers compared to matched blood. Furthermore, CD24-CD38- B cells were elevated in PBC and formed aggregates in tissues, whereas CD24-CD38int B cells localized around bile ducts and along fibrotic tracts in PBC. CD24-CD38int B cells secreted pro-inflammatory (IL-6, IFN-γ) and immunosuppressive (IL-1) cytokines following stimulation with CpG compared to other B cell subsets, implying that CD24- B cells may play a role in liver disease pathogenesis. Our findings suggest that B cells may be influential in hepatic disease progression and pathogenesis. Elucidating their role further could provide possible therapeutic targets for prevention or treatment of chronic liver disease.
4 Two there are who are never satisfied: the lover of the world, and the lover of knowledge ~Rumi
5 Dedication Dedicated with love, to my Mum and Dad, mother-in-law and father-in-law, for all your encouragement, Dada, Dadi and Shruthi, for believing in me, and Shakil for your endless support. You are all truly amazing. In loving memory of my loving grandfather and grandmother, Kishanchand Chadiramani ( ) and Kamla Purswani ( ), and my inspirational aunty, Dr. Ravi Vajpeyi ( ). You all valued the importance of education and would have been proud to see this day.
6 Preface The work described in this thesis was carried out in the Centre of Liver Research at The University of Birmingham, during the period October 213 to July 216. Except where stated, the following is the original work of Sudha Purswani. This thesis has not been submitted, in part or in to any other university. Acknowledgements First and foremost, I would like to thank my supervisor and co-supervisor Dr. Zania Stamataki and Prof. David Adams, for your endless guidance and support throughout my Ph.D. Your continued encouragement and enthusiasm has been greatly appreciated. I would also like to thank Dr. Brian Chung and Dr. Graham Wallace for their feedback and support particularly during my writing up phase. To all members of the Liver Labs, past and present, thank you for all your help in the lab. You made my Ph.D. experience an enjoyable one. A special thanks goes to Scott, Ben, Kostas and Susan, for always motivating me, listening to me complain when times were hard, and helping me in the lab when I was swamped with liver samples! A debt of gratitude goes to Gary Reynolds, for investing time to help me perfect my immunohistochemistry technique and providing me with a countless number of liver sections. I would also like to thank Gill Muirhead for supplying me with various hepatic cell lines, without which many of my assays would not have been possible. This project was funded by The Wellcome Trust, for which I am overwhelmingly grateful.
7 I am deeply grateful for my grandparents Lachmi and Ghanshyam, my parents Kavita and Vijay, and my sister beautiful Shruthi, for supporting me through the difficult times, listening to me when I just needed to talk and all the encouragement. To my lovely husband Shakil, thank you for supporting me from day one of my PhD; for being patient with me, believing in me, and keeping me sane when I needed a break from working long hours. A massive thank you goes to my mother-in-law and father-in-law, with their du as, belief, and guidance; I got through my write-up phase, which often seemed impossible. I would also like to say a big thank you to my close friend Sajidah Ali for all your kind encouragement, laughter and support, which made the toughest days seem more bearable.
8 Abbreviations BCR TCR DC APC MHC Tfh Ig SHM CSR ECM mab LPS TLR DAMPs NLRs FO MZ GC BEC HSC HSEC almf NK NKT Breg HCC NAFLD NASH ALD PSC PBC AIH HCV HBV BAFF ANCAs AMAs ANAs IHC ABC LIMCs IMCs SLO B cell receptor T cell receptor Dendritic cell Antigen presenting cell Major histocompatibility complex T follicular helper cell Immunoglobulin Somatic hypermutation Class switch recombination Extra cellular matrix Monoclonal antibody Lipopolysaccharides Toll-like receptor Damage-associated molecular patterns Nod-like receptors Follicular Marginal zone Germinal center Biliary epithelial cell Hepatic stellate cell Hepatic sinusoidal endothelial cells Activated liver myofibroblasts Natural killer cell Natural killer T cell Regulatory B cell Hepatocellular carcinoma Non-alcoholic fatty liver disease Non-alcoholic steatohepatitis Alcoholic liver disease Primary sclerosing cholangitis Primary biliary cirrhosis Autoimmune hepatitis Hepatitis C virus Hepatitis B virus B-cell activating factor Anti-neutrophil cytoplasmic antibody Anti-mitochondrial antibody Anti-nuclear antibody Immunohistochemistry Age-associated B cells Liver infiltrating mononuclear cells Isotype matched controls Secondary lymphoid organs
9 Table of contents 1.1. THE FUNCTION OF B CELLS B CELL DEVELOPMENT B CELL STIMULATION AND ACTIVATION THE B CELL COMPARTMENT IN HUMANS AND MICE THE LIVER ARCHITECTURE, FUNCTION AND MICROENVIRONMENT CHRONIC LIVER DISEASES... 58
10 1.7. CO-CULTURE MODELS TO STUDY THE EFFECTS OF LIVER CELLS ON B CELL BIOLOGY PROJECT AIMS LIVER TISSUE SAMPLES MULTI-COLOUR FLOW CYTOMETRY ROUTINE TECHNIQUES SPECIFIC TECHNIQUES LOCALISATION OF B CELLS IN HEPATIC DISEASE USING IMMUNOHISTOCHEMISTRY... 1
11 2.6. STATISTICAL ANALYSIS INTRODUCTION RESULTS DISCUSSION INTRODUCTION RESULTS DISCUSSION INTRODUCTION RESULTS DISCUSSION
12 6.1. GENERAL DISCUSSION FUTURE WORK CONCLUSION
13 Figure 1 Figure 2 Figure 3 Figure 4 Figure 5 Figure 6 Figure 7 Figure 8 Figure 9 Figure 1 Figure 11 Figure 12 Figure 13 Figure 14 Figure 15 Figure 16 Figure 17 Figure 18 Figure 19 Figure 2 Figure 21 Figure 22 Figure 23 Figure 24 Figure 25 Figure 26 Figure 27 List of figures B cell activation...3 Stages of B cell development in the bone marrow...8 Stages of B cell selection in the bone marrow.1 Comparing the secondary lymphoid structure to TLS...18 Dynamics of GC initiation...2 The GC reaction..23 B cells development in mice and humans...27 The blood supply of the liver...38 The architecture of the liver45 Gating strategy and calibration of the flow cytometer73 B cell subpopulation in patients suffering from polycystic liver disease..75 Gating strategy of naïve and non-switched memory B cells.85 Gating strategy of switched B cells86 Gating strategy of plasmablasts and plasma cells..87 Gating strategy of human B1-type cells..88 Gating strategy of centroblasts and centrocytes.89 Gating strategy of B1 cells and transitional Bregs9 The B cell subset profile in patient blood and matched liver Isotype distribution of switched memory B cells in liver and blood125 Composition of hepatic B cells compared to those in blood and SLO127 Quantifying B cells and B cell subsets across hepatic diseases129 Localisation of B cells within the liver 132 Quantifying B cell aggregates across hepatic diseases..134 Germinal center-like structures in an ALD patient136 Hepatic lymphoid aggregates, B cell follicles and tertiary lymphoid structures139 Enrichment of CD24- B cells in the liver compared to matched blood and SLOs..16 Phenotypic characterization of hepatic CD24- B cells.163
14 Figure 28 The composition of CD24- B cells in matched liver and blood, and matched liver and perihepatic lymph nodes..165 Figure 29 Phenotypic characterization of CD24-CD38- B cells168 Figure 3 Phenotypic characterization of CD24-CD38int B cells 169 Figure 31 The correlation between hepatic CD24- B cells and age17 Figure 32 Gating strategy of ABCs in the liver173 Figure 33 Gating strategy of exhausted B cells in the liver Figure 34 Percentage of ABC markers on the surface of liver and blood B cells..177 Figure 35 Percentage of exhausted B cell markers on the surface of liver and blood B cells178 Figure 36 ABC markers on B cell subsets in chronic hepatic diseased livers.18 Figure 37 The effects of co-culture with liver stromal cells on CD24 expression..182 Figure 38 The effects of cytokine co-culture on CD24 expression..184 Figure 39 Assessing whether CD24 is lost via internalization on B cells185 Figure 4 Localisation of CD24- B cells in the liver architecture..2 Figure 41 Distribution of CD24- B cells across chronic end stage liver disease.22 Figure 42 Distribution of CD24-CD38- and CD24-CD38+ B cells in end stage liver disease24 Figure 43 Comparing CD24- B cell aggregates in human liver and tonsil.26 Figure 44 Assessing the proliferation of hepatic CD24- B cells..28 Figure 45 Assessing whether CD24- B cells can be generated in vitro and if these populations are comparable to hepatic CD24- B cells..21 Figure 46 Cytokine production of B cell subsets in liver and blood following TLR9 (CpG) stimulation and activation.214 Figure 47 The effects of TLR stimulation on cytokine production of B cell subsets in liver and blood.221 Figure 48 Comparing the effects of TLR stimulation on cytokine production between B cell subsets in liver and blood..228 Figure 49 B cell activation with TLR7 in the presence of IL-21 and IFN-γ..233 Figure 5 Summary of findings human B cell subsets blood vs. liver.264
15 List of tables Table 1 B cell subtypes and their cytokine production4 Table 2 Phenotypes of Breg cells...32 Table 3 The Cellular composition of the liver..43 Table 4 Studies on visualizing/quantifying human intrahepatic B cells...51 Table 5 Cytokines in liver disease54 Table 6 Antibodies and isotype controls used in the old B cell panel 1.79 Table 7 Antibodies and isotype controls used in the old B cell panel 1.79 Table 8 Antibodies and IMCs used in expanded B cell panel 1..8 Table 9 Antibodies and IMCs used in expanded B cell panel Table 1 Antibodies and IMCs used in expanded B cell panel Table 11 Antibodies and IMCs used to identify exhausted and age related B cells.83 Table 12 Ingredients of media used to culture various liver cell lines / primary cells.92 Table 13 The concentration of cytokines used in co-culture experiment with healthy donor PBMCs.94 Table 14 Samples involved in CD24 internalisation assay and their respective surface and intracellular stains...95 Table 15 Antibodies used to form intracellular cytokine panel..97 Table 16 Combinations of stimuli and their working concentrations, used to induce cytokine production from hepatic B cells / various hepatic B cell subsets..98 Table 17 Reagents used for the duration of all immunohistochemical techniques...11 Table 18 Antibodies and isotype-matched controls used for the duration of all immunohistochemical techniques..13 Table 19 Surface staining expression for identification of three B cell aggregate phenotypes..18 Table 2 Disease aetiologies of liver explants and their respective abbreviations..12 Table 21 Surface marker expression used to define human and mouse ABCs and human exhausted B cells..157
16
17 1.1. THE FUNCTION OF B CELLS B lymphocytes form part of the adaptive immune system and contribute to between 5 1% of the total human lymphocyte population (5). They are defined through their expression of membrane-bound surface immunoglobulin molecules known as B cell receptors (BCR) (6), which are able to recognize cognate antigen through the variable region. Like macrophages and dendritic cells (DCs), B cells act as professional antigen presenting cells (APCs), which internalize antigens via the BCR (7), and process them into antigen peptides via lysosomal degradation. These peptides are then presented to T helper cells along with co-stimulatory signals, causing T cell activation, clonal expansion and the general sustenance of effector T cell responses to pathogens (6, 7). This highlights the importance of B cells in linking the innate and adaptive immune systems, as well as in effectively propagating the adaptive immune response through T cell activation. MHC class II presentation of antigenic peptides to activated T helper cells, consequently leads to B cell activation through signal transduction; initiating B cell proliferation and differentiation into antibody producing plasma cells and memory B cells (Figure 1) (6-8). Long lived memory B cells produce rapid secondary responses upon re-exposure to the primary antigen, whereas antibodies released by the plasma cells neutralize antigens, opsonize antigens for destruction, and activate the membrane attack complex (MAC) via the complement pathway to initiate
18 bacterial lysis (6). These processes triggered by B cell activation are important in the immediate removal of circulating pathogens. Figure 1 B cell activation. After initially binding an antigen to the B cell receptor (BCR), B cells internalize antigen and present it on MHC class II. A helper T cell recognizes the MHC class II antigen complex and activates the B cell. As a result, memory B cells and plasma cells are produced (9). Image adapted from Rye C et al. 212 (1).
 (13, 14) See Table 1.")
19 Once activated, B cells enhance cell-mediated immunity by boosting T cell responses via production of pro-inflammatory cytokines TNF-α, IFN-γ and IL-12 (11, 12). Conversely, B cells also control inflammation through the release of regulatory cytokines such as IL-1 and TGF-β from regulatory B cells (Bregs) (13, 14) See Table 1. In this way, the production of both pro-inflammatory and anti-inflammatory cytokines highlights their importance in immunoregulation in response to antigens. Table 1 - B cell subtypes and their cytokine production. B cells produce specific cytokines depending on their exposure to the surrounding environment. B cells exposed to Th1 cells produce Be 1 cytokines and those exposed to Th2 cells produce Be 2 Type cytokines (15-21).
20 B cell function also extends beyond cytokine production, where they are involved in MAIT cell activation (Mucosal-associated invariant T cells), which are MHC class Ibrestricted innate-like lymphocytes with anti-bacterial functions (22). Furthermore, B cells are pivotal in maintaining secondary lymphoid organ (SLO) structure (23) and also impact follicular T helper (Tfh) cells (24), which explains the ability of B cells to orchestrate and shape inflammatory responses. B cells have been implicated in the pathogenesis of multiple diseases. They are important in optimal activation of CD4 + /CD8 + T-cells during anti-tumour responses (23) (25), and have also been implicated in autoimmune diseases such as Systemic Lupus Erythematosus (SLE) (26, 27), rheumatoid arthritis (28) and type 1 diabetes (29) through auto-antibody production. For this reason, B cells have been an attractive target for therapeutic intervention using drugs such as rituximab, which knocks out CD2+ B cells via monoclonal antibody and has proven effective in treating autoimmune diseases such as PBC (3), autoimmune hepatitis (31) and rheumatoid arthritis (32). Overall, B cells are essential in playing multiple roles in inflammation, and disease. It is firstly important to establish whether these B cell functions are assigned to particular B cell subsets. Consequently, this would broaden our understanding of how B cells could be targeted therapeutically in the future to effectively combat disease.
21 1.2. B CELL DEVELOPMENT In order to understand B cell biology, it is important to understand the origin of B cells. B cell development is well characterized in the mouse, where the fetal liver is the main site of B lymphopoiesis during embryonal life (33). The development of pre- B cell colonies has been described on day 15 within fetal liver cells, with these colonies increasing with gestational age and peaking at day 19 (33). This development of early B lymphopoiesis has been described as a two part process, the first of which requires the presence of stromal cells to encourage the differentiation of B22- cells to B22+ cells. The second step requires the presence of IL-7 to encourage proliferation and differentiation of B22+IgM- cells to become IgM+ (33). Stromal cells in the bone marrow provide cell-cell contacts with developing B cells and also produce cytokines and chemokines, creating an ideal microenvironment for B cell maturation, differentiation and development (34-36). B cell development in the bone marrow occurs independently of antigen and is essential in regulating the construction of antigen receptors (BCR), as well as ensuring that each B cell has one specificity. The bone marrow also provides an environment for self-reactive B cells to be deleted and useful B cells to be exported to the periphery (6). Stages of B cell differentiation in the bone marrow are defined by various phases of surface immunoglobulin (Ig) gene arrangement. Progenitor pro-b cells derive from pluripotent hematopoietic stem cells, which in the mouse are defined by cell surface expression of B22, CD43 and c-kit (37). Pro-B cells are the earliest known B cell
22 lineage, where rearrangement of the Ig heavy-chain locus occurs; D H to J H joining occurs at the early pro-b cell stage followed by V H -DJ H joining at the late pro-b cell stage (37, 38). Efficient VDJ H joining results in expression of an intact heavy chain, which leads to pre-b cell development (6, 37). Here, the heavy chain is expressed alone intracellularly as well as transiently at the cell surface along with a surrogate light chain, forming a pre-b cell receptor (37, 38). Expression of the pre-b cell receptor initiates cell divisions leading to the formation of small-pre cells, where the VJ light chain (VJ L ) of the Ig molecule begins to rearrange (6). Once rearrangement of the heavy and light chains is complete, a complete IgM molecule is assembled and expressed on the surface of the immature B cell (6), which then leaves the bone marrow to mature in the periphery (6, 39) (See Figure 2).

23 Figure 2 Stages of B cell development in the bone marrow (6). B cells develop from a haematopoietic stem cell, though to pro- and pre-b cell stages, and finally to an immature B cell which then continues maturation in the periphery. Figure adapted from Murphy et al., 211.
24 In order to regulate B cell development, B cells undergo positive and negative selection in the bone marrow. Positive selection occurs when developing B cells bind to environmental and self-antigens with low affinity via the pre-b receptor. This ligand binding generates survival signals which promotes B cell survival and development (6). Negative selection occurs when immature B cells are tested for strong reactivity against autoantigens. Self-reactive B cells encounter one of three fates (6, 4), the first of which is clonal deletion or receptor editing in the bone marrow. When developing B cells express receptors that recognize multivalent ligands, for example, ubiquitous self cell-surface molecules such as those of the MHC, they are deleted from the repertoire, via clonal deletion. These B cells either undergo receptor editing, so that the self-reactive receptor specificity is deleted, or the cells themselves undergo programmed cell death or apoptosis (6, 41, 42). Secondly, immature B cells which bind soluble self-antigens and are able to cross-link the BCR, downregulate their surface IgM receptor expression, before migrating into the peripheral lymphoid tissues (6). Although these B cells express IgD and migrate to the periphery, they are unresponsive to antigen, therefore rendering them anergic. If in competition with other peripheral B cells, these B cells are rapidly lost. Thirdly, it is also possible for immature B cells that bind soluble self-antigens with low affinity to not receive any signal as a result of this interaction. These B cells mature normally to express both IgM and IgD at the cell surface, and are potentially self-reactive, however they are classed as clonally ignorant as their ligand is present but is unable to activate them (6) (See Figure 3)

25 Figure 3 Stages of B cell selection in the bone marrow (6). There are four possible outcomes for self-reactive immature B cells, which is dependent on the type of ligand to which they are capable of binding. These fates include cell death by apoptosis; the production of a new receptor known as receptor editing; the induction of a permanent state of unresponsiveness to antigen known as anergy; and ignorance. Figure adapted from Murphy et al., 211.
26 Once developed, immature B cells leave the bone marrow and enter the peripheral blood as transitional B cells, which have been identified in mice (T1, T2, and T3) and in humans (T1 and T2) (43, 44). Transitional B cells are the intermediate cells between immature B cells in the bone marrow and fully mature naïve B cells (CD19 + CD2 + IgM + IgD + CD38-) in peripheral blood and secondary lymphoid tissues (45). It has been proposed that after being selected for self-tolerance and leaving the bone marrow, transitional B cells undergo a series of peripheral checks to ensure that they will not develop into autoimmune plasma cells (46). Those that survive these peripheral checks are then able to develop further into mature naive B cells, which express IgD and IgM (Figure 2) (47, 48). These B cells remain naïve and circulate through peripheral lymphoid tissues until they encounter their specific foreign antigen via their surface BCR (6). Just as in mice, mature naive B cells in human lymphoid tissues can be stimulated by foreign antigen and activated by T cells to form germinal centers (GC), where class-switch recombination (CSR) and somatic hypermutation (SHM) takes place to produce plasma cells and memory cells (6). This overall response to antigens by B cells is known as the humoral immune response (6).
27 1.3. B CELL STIMULATION AND ACTIVATION Induction of cytokine production from B cells requires stimulation and activation. In vivo this usually takes place either via T cell-dependent activation, or T cellindependent activation (6). During T cell-dependent activation, B cells internalize and degrade BCR bound antigen via receptor mediated endocytosis (Signal 1 to B cell), and present antigen peptides on MHC class II receptors to the TCR on T cells, triggering T cell activation. The activated T cell then provides the B cell with a secondary signal through the production of cytokines such as IL-4 and IL-21, and the surface protein CD4L. Engagement of both the BCR and CD4 via α-bcr and IgM/IgD crosslinking in vitro results in classical synergistic activation of B cells (49), resulting in B cell expansion, differentiation and cytokine production (6, 5). B cell activation under these conditions can be measured by monoclonal antibody (mab) production, B cell differentiation, blast formation and proliferation using FACS analysis and thymidine uptake respectively (51-53). However, one group has postulated that naïve B cells required three stimulations for activation: 1. Stimulation via antigen:bcr, 2. Costimulation through T cell ligation of CD4 and 3. Activation of TLRs (54). The importance of B cells in CD4+ T cell activation has been highlighted in several B cell depletion experiments, especially autoimmune disease-related studies (55-57). Autoimmune hepatitis is considered a T cell mediated disease. However, one study has shown that AIH patients refractory to conventional treatment have been successfully treated with anti-cd2-mediated B-cell depletion with rituximab (58).
28 Following B cell depletion, patients harboured significantly fewer antigenexperienced CD4+ and CD8+ T cells, and T-cell proliferation was significantly reduced. This is primarily due to the fact that B cells served as antigen-presenting cells to CD4+ T cells, and their reduction caused reduced antigen presentation to T cells, and consequently, reduced T cell activation (58). Another report showed that B cell depletion via rituximab in MS patients resulted in reduced secretion of soluble products (lymphotoxin and TNF-α) from activated B cells (59). Consequently, this significantly diminished proinflammatory responses of CD4+ and CD8+ T cells, in vivo and ex vivo (59). These findings provided novel insights into the mechanisms that facilitate B and T cell interactions, and highlighted the therapeutic effects of B cell depletion in human autoimmune diseases. T cell-independent activation usually occurs through antigens such as foreign polysaccharides (e.g. LPS) or unmethylated CpG DNA, which causes direct B cell activation through binding to toll-like receptors (TLRs) on the B cell surface (6). Other T cell-independent antigens consist of highly repetitive structural epitopes (e.g. on encapsulated bacteria) (61). These repetitive antigens cause extensive crosslinking of the BCRs consequently leading to B cell activation (6). Toll-like receptors (TLRs) are germ-line encoded receptors, which recognise a broad range of microbial antigens, and in combination with signaling through the BCR, are known to play a role in B cell development and differentiation (62). Ligation of TLRs causes them to mount immune responses to infection by initiating downstream signaling, although the outcome of TLR signaling in B cells is context dependent
29 (63). Thirteen vertebrate members of the TLR family have been identified, however human B cells are known to differentially express TLR1 1, where signaling following ligation orchestrates inflammation (62). TLR signaling also causes cytokine production, proliferation, antibody production, increased antigen uptake and presentation (63). TLR expression is varied amongst B cell subsets. Resting B cells express low levels of TLR7, TLR9 and TLR1, however they temporarily upregulate expression upon BCR-crosslinking and CD4L or TLR stimulation (64). Naïve B cells express low levels of TLR9 and TLR1 but upon activation, these TLRs are expressed at high levels (64). TLR6, TLR7, TLR9 and TLR1 on the other hand, are highly expressed in memory B cells, where expression of TLR1, TLR2 and TLR4 expression is low (64). PB/PC express TLR 1 8 and express particularly high levels of TLR9 and RP15 (65). TLR4 is expressed on the surface of B cells and is ligated by LPS (65). Its expression and function is elevated on B cells in inflammatory disease patients upon stimulation through surface IgM and CD4 combined with IL-4 (66). Previous studies showed that TLR4 stimulation can cause decreased IL-1 production in inflammatory disease patients, which is coupled with TLR4-induced increases in pro-inflammatory cytokine production (67). This highlighted B cell TLR4 ligation contributed to systemic inflammation through multiple mechanisms. However, TLR4 ligation on B cells does not just provide an inflammatory signal, as murine studies have also highlighted the importance of TLR4 signaling in anti-inflammatory responses, where LPS stimulation has been found to increase IL-1 production from murine B1 cells as a result of TLR4 signaling (68, 69).
30 RP15 is a TLR4 homologue capable of signaling by using the same downstream cascades as TLR4 (7). This molecule s expression across B cell subsets is not well elucidated. However, functionally, RP15- B cells have been shown to play a role in inflammation by producing autoantibodies therefore participating in the pathophysiology of SLE (71). Furthermore, RP15 stimulation of B cells combined with LPS or CpG results in proliferation and differentiation of B cells and increased secretion of IL-6, IL-1 and TNF-α (7). CpG is commonly used to stimulate B cells via TLR9 in order to induce their proliferation and production of cytokines such as IL-1 in vitro in the presence of phorbol 12-myristate 13-acetate (PMA) (72) (73). TLR9 is expressed intracellularly within endosomal compartments by binding to DNA rich in CpG motifs (65). TLR7 is expressed intracellularly and is important in binding to single stranded RNA (ssrna) resulting in B cell proliferation and CSR (65). Stimulation of both TLR7 and TLR9 ligands results in B cell secretion of IL-6, IL-8 and IL-1 (74-77). IL-1β and IL-2 secretion in particular have been detected in response to B cell-specific CpG-ODN stimulation (75). Genetic deficiency of TLR7 or TLR9 often leads to reduced production of antibodies (78), and increased expression of TLR7 on B cells causes susceptibility to autoimmune diseases (79). Different B cell subsets require different combinations of stimulations in order to become activated (8, 81). For example, memory B cells proliferate and differentiate more readily than naïve B cells in response to TLR stimulation (65), whereas most studies agree that both CD4L and BCR signals are required for proliferation and differentiation of naïve B cells and Bregs (5). B cells release different cytokines and
31 perform different functions depending on their exposure to different conditions and forms of activation (82-85). Studies showed that naïve B cells only required single TLR9 engagement for activation through CpG oligodeoxynucleotide (86, 87). Bregs are known to appear under inflammatory conditions. This population can be stimulated most commonly via TLR9 or TLR4, to secrete IL-1; a cytokine involved in dampening inflammation (69, 88, 89). In fact, in mice, IL-1-producing B cells have also been shown to be stimulated via BCR signaling, TLR2/TLR4/MYD88, CD4/CD4L, IL-21/IL-21L and BAFF (9, 91). These IL-1 producing Bregs can be found within subpopulations in mice such as B1a, transitional, FO and MZ B cells (89). Recently, Bouaziz et al. demonstrated that stimulation of human B cells with anti-ig and CpG enriched CD27 + memory and CD38 hi transitional B cell compartments, and induced IL-1 secretion (92). Mauri et al. also demonstrated that human Bregs were CD19 + CD24 hi CD38 hi transitional B cells in the peripheral blood of healthy individuals, as following CD4 stimulation, this population was able to produce IL-1 (93). On the contrary, B cells can also contribute to inflammation, where stimulation of CD2+ B cells with leptin significantly increases production of pro-inflammatory cytokines IL-6 and TNF-α (12). Follicular B cells can be primed to become effector B cells following stimulation by Th1 cells and antigen, to make cytokines associated with type 1 immune responses such as IFN-γ and IL-12. However B cells primed by Th2 cells and antigen are associated with allergic immune responses, and secrete IL-2, IL-13 and IL-4 (15).
32 Secondary lymphoid organs (SLOs) located in the periphery, such as the spleen and lymph nodes, are the sites of lymphocyte activation by antigens (6). Key features of SLOs are the presence of lymphoid follicles, which can be classified as primary, secondary, or tertiary. Primary follicles contain aggregates of FDCs and B cells, which have not experienced antigen-driven responses (94). The B cells contained within these follicles are mostly naïve, and are mobile, therefore allowing free B cell recirculation in search of antigen. Secondary follicles arise following B cell exposure to antigen, and are a result of B cell activation (95). These follicles contain germinal centers (GCs) with mature and differentiated B cell populations (94). Tertiary lymphoid structures (TLS) effectively represent secondary lymphoid follicles, however are not located in a typical SLO (6, 95). Ectopic lymphoid structures can also exist outside of SLOs, and represent primary follicle-like structures that are less well developed compared to TLS (94) (Figure 4).
, which can contain either primary or secondary B cell follicles.")
33 Figure 4 Comparing the secondary lymphoid follicle structure to the tertiary lymphoid structure (TLS). Structure of a typical SLO (left), which can contain either primary or secondary B cell follicles. Primary follicles contain mostly naive B cell and FDC clusters, whereas secondary follicles contain more mature, organised germinal centers. A TLS (right) is similar to secondary follicles but is situated in peripheral tissues, which are ectopic to the SLO. DC: dendritic cell, FDC: Follicular Dendritic Cell, HEV: High Endothelial Venule, GC: Germinal Centre. Adapted from Pimenta et al., 214 (96). Germinal centers form following T cell-dependent reactions within B cell follicles, where rapidly proliferating cells differentiate into high-affinity antibody-producing plasma cells and memory cells which are able to specifically target exogenous antigens (6). This GC reaction propagates robust immune protection and rapid memory, which is achieved via immunoglobulin diversifying events, somatic hypermutation (SHM), and immunoglobulin class switching, class switch recombination (CSR), respectively (6, 95). SHM encourages the selection of hypermutated antibodies with very high affinity for antigen, and CSR permits the changing of antibody effector functions through a switch in isotype (95).
34 Germinal centers develop 3 4 days after antigen exposure and can persist for several weeks depending on the type of antigenic stimulus (97, 98). Initiation of the GC reaction involves recognition of antigen presented by DCs, which are recognised by mature follicular B cells via the BCR (99). Following this recognition, the follicular B cell migrates to the T cell zone border within the SLO (95, 99). T cell and B cell interactions involving CD4L ligation promote survival, activation and proliferation of B cells. At this point, B cells commit to one of two paths, one of which leads to the GC reaction, and the other resulting in plasmablast development. Plasmablast development involves migration to extrafollicular regions with subsequent class switching but with minimal SHM (99, 1). It is here that extrafollicular plasmablasts are able to provide a more rapid, but less targeted antibody response (99). In the GC pathway, B cell recruitment to the GC microenvironment occurs depending on the specific expression of chemokine receptors, particularly CXCR5 (11). CXCR5 attracts B cells towards the lymphoid follicle, and the G Protein Coupled Receptor (EBI2) is downregulated, thereby promoting migration to extrafollicular B cell sites, and increasing GC commitment (11). The transcription factor Bcl-6 promotes differentiation into GC specific B cells and also encourages CD4 T cell differentiation into specialised T follicular helper cells (TFH), which play a significant role in germinal centers (95, 12). Once within the follicle, the newly activated B cells known as GC precursor B cells, proliferate (12). This displaces the occupying mature B cells into the peripheral area known as the marginal / mantle zone, which signifies the start of the GC reaction (11, 12). The procedure of GC initiation is illustrated in Figure 5.

35 Figure 5 The dynamics of Germinal Centre initiation. GCs take an estimated 7 days to mature (12). T cell help and CD4 ligation are essential in the initiation of the reaction. Proportions of B cells do not enter the GC and instead commit to a plasmablast phenotype. Dark zone and light zone compartmentalisation occurs in the later stages of the reaction. Figure adopted from De Silva et al., 215. As the B cell blasts rapidly proliferate in the GC, 2 compartments are established: the dark zone and the light zone, which are surrounded by naive follicular mantle B cells (11). The dark zone contains rapidly proliferating B cells known as centroblasts, which express the proliferation antigen ki-67, localise close to T cell areas, and have decreased surface immunoglobulin expression (13). The density of B cells is lower in the light zone which contains a network of surrounding FDCs and TFH cells (14). Light-zone B cells are small, non-proliferating cells known as centrocytes, which express surface immunoglobulins, undergo antibody selection,
36 CSR and differentiation into plasma cells and memory B cells (11, 14). Compartmentalization of GC B cells into dark and light zones is dependent on the presence of CXCL12 and CXCL13 chemokines. Centroblasts expressing high levels CXCR4 receptor are attracted to the dark zone via the CXCL12 ligand, and centrocytes expressing low levels of CXCR4 and high levels of CXCR5 are attracted to the CXCL13 ligand, which is more concentrated in the light zone (15). GC derived B cells and plasma cells undergo affinity maturation in the dark zone (SHM), resulting in the production of specific, high affinity antibodies. SHM is driven by AID, which is highly expressed in centroblasts. It occurs in rapidly proliferating centroblasts via point mutations within the IgV genes, resulting in the production of diverse immunoglobulins with varying affinities (16, 17). These B cells are then ready for antigen-driven selection and CSR, which takes place in the light zone. The benefits of selection for GC B cells with high affinity BCRs in the light zone are survival and expansion, with subsequent differentiation and exit from the GC or recycling into the dark zone for further SHM (16, 17). FDCs and TFH cells are important accessory cells in the GC light zone, which aid in the selection process for GC B cells through prolonged antigen presentation. Once in the light zone, GC B cells have upregulated MHC class II and increased antigen uptake and processing capabilities compared to other subsets en(18). FDCs are a major source of CXCL13 in GC light zones and do not express MHC II molecules, however are essential in trapping and retaining unprocessed antigen in the form of immune complexes through Fc and complement receptors (14). In this way, they serve as long-term antigen deposits, therefore are important for selection of high-
37 affinity GC B-cell clones, as well as the generation and maintenance of immunologic memory (14). The amount of antigenic peptide-mhc complex found on the surface of centrocytes correlates to the affinity of the surface Ig, BCR signaling and subsequent endocytosis of antigen. This impacts the level of TFH help and therefore, selection (19). TFH cells are CXCR5 expressing CD4+ T cells, which are crucial for induction of GC responses as they provide B cell survival signals via CD4, Il-4, Il-21 and BAFF (19). This extracellular survival signaling is particularly influential for the fate of GC B cells as they are prone to apoptosis, due to the significant their downregulation of the anti-apoptotic molecule Bcl-2 (11). As well as inducing B cell survival and differentiation, TFH cell-dependent paracrine activation of B cells also results in the induction of AID (19). AID is the principal enzyme responsible for CSR in the light zone. Its mechanism involves an intrachromosomal deletion recombination event, which includes AIDmediated DNA breaks in the Switch (S) region, a locus of tandem repeats upstream of the CH gene. AID driven DNA lesions in the S region is then followed by endjoining recombination of the S and CH regions, resulting in altered isotypes from IgM, such as IgD, IgG, IgA or IgE (111). Finally, it should be noted that selection mechanisms are not only targeted to eliminate low affinity B cells via apoptosis, but also to remove autoreactive B cells (11). A schematic illustration of a GC is shown below in Figure 6.
.")
38 Figure 6 The Germinal Centre reaction. A schematic diagram of the germinal center reaction. Light zone and dark zone compartmentalisation is highlighted, as well as respective sites of mechanisms of affinity maturation, such as somatic hypermutation and class switch recombination (17). Selection, CSR and differentiation events are also shown in the light zone and are mediated by FDCs and TFH cells. Figure adopted from Klein et al., 28.
39 1.4. THE B CELL COMPARTMENT IN HUMANS AND MICE B cell development is well characterized in the mouse, however antigen markers used to define stages in human B cell development differ (112, 113), highlighting differences in the B cell compartment between mice and humans (113). Follicular B- 2 cells comprise the major B cell subset in the mouse, which are also found in humans. These cells generate immune responses against thymus-dependent antigens and require T cell help to experience GC reactions, leading to the generation of high affinity antibodies with increased antigen specificity (2, 6). In addition to this, B-1 cells are a specialized murine subset which has not yet been definitively identified in humans ( ). Furthermore, although marginal zone B- cells (MZ B-cells) are present in mice and humans, their functions and locations differ slightly between the two (117). B-1 cells are a population of B cells located in the murine peritoneal cavities (118). They are the main producers of natural, highly polyspecific (crossreactive) IgM antibodies in the mouse, which bind both self and microbial antigens ( ). Despite lacking immunological memory and the ability to undergo affinity maturation, B-1 cells are more efficient at presenting antigens than B-2 cells (122). They are able to maintain tissue homeostasis through their production of natural IgM antibodies and possess the ability to bind altered self-antigens, such as those expressed by apoptotic cells (123). Unlike follicular B-2 cells which are replaced by new cells from the murine bone marrow, B-1 cells are able to self-renew in the
40 periphery (124), and are split into B-1a and B-1b subpopulations according to their levels of CD5 expression. Whereas B-1a cells are IgMhiIgDloCD45loCD23lo/ CD43+CD5+, B-1b cells express all B-1a cell surface markers except CD5 (CD5-) (125). B-1b cells are also regulated separately from B- 1a cells, fulfill distinct immune functions, and appear to develop in line with B-2 cells (123). The marginal zone (MZ) is enriched with macrophages, DCs and MZ B cells (117). In rodents, this region develops 3-4 weeks after birth (126, 127). MZ B cells are defined as mature, non-circulating B cells, which anatomically localize to the spleen (128, 129). In mice, these cells can be clearly defined from follicular B cells and B-1 cells via their high expression of sigm, CD21, CD1 and CD9 (128, 13, 131). Similarly to B-1 cells, MZ B cells react in a T cell-independent manner to antigens such as LPS and self-antigens ( ). They provide the first line of defense against systemic blood-borne antigens which enter the circulation and become trapped in the spleen (132, 133). Compared to follicular B-2 cells, MZ B cells have a lower threshold for activation and have the ability to differentiate rapidly into antibody producing plasma cells (133, 134, 136), thereby contributing to an accelerated primary immune response.
41 Although the mouse model provides an insight into B cell development and disease, the markers used to define B cell subsets in mice are not always recapitulated in humans (See Figure 7). Additionally, conflicting arguments over markers used to define specific human B cell subsets still exist.
42 Located in 2 lymphoid organ Located in bone marrow Cells circulating in both bone marrow and in 2 lymphoid organ Figure 7 B cell development in mice and humans (1) (2) (3, 4). Antigen markers highlighting the B cell differentiation stages in mice and humans. B cells differentiate according to the cellular environment, differentiation state and other factors. Adapted from Maecker et al., 212; Garraud et al., 212; Meyer-Bahlburg, et al.; Allman et al., 28.
43 For example, the B1 extrafollicular compartment contributes to one of the two B cell compartments in mice (CD19+B22+), but has thus far eluded identification in humans. Although a study in 211 described human B1 subsets with the phenotype CD2+CD27+CD43+CD7- in peripheral blood (116), there have been no further studies since which corroborate these findings. The existence of human MZ B cells also proves to be controversial. Although MZ B cells in humans (CD19+IgM+IgD+CD27+) share many similarities with murine MZ B cells (B22+CD19+CD21hiCD22hiIgMhiCD9+IgDlo), striking differences also exist (113, 134). The B cell subsets which contribute to the human B cell compartments are discussed in more detail below. Mature naïve B cells predominantly reside in lymphoid follicles of secondary and tertiary lymphoid organs, such as spleen and lymph nodes; therefore are known as follicular (FO) B cells (137). Just as in rodents, FO B cells in humans make up the largest B cell subset, and can be characterized as CD19+IgD+CD38-CD27- B cells (138-14). Immune responses are usually propagated in lymphoid organs where highly organized follicular lymphoid structures termed germinal centers (GC) exist (6); identified by the presence of FDCs (follicular dendritic cells), and T cell zones which lie adjacent to B cell zones (141). This structure permits activated FO B cells to interact with activated T helper cells, thereby resulting in FO B cells mounting immune responses to T cell-dependent antigens (137, 141). One study in human tonsil identified the presence of a B cell subset with a unique phenotype (IgD+CD38 CD23-CD71+) (142). This subset was described as being the founder
44 cell of the GC reaction and appeared to be morphologically distinct, presenting an intermediate phenotype between naïve B cells and GC B cells (a pro-gc cell) (142). Once activated by antigen specific T cells, pro-gc B cells enter the GC to become centroblasts (IgD /CD38 + /CD77 + ), which form the GC dark zone. Centroblasts proliferate, differentiate, diversify their immunoglobulins and increase their affinity for antigen through processes such as SHM (143), where they then migrate to the light zone of the GC and differentiate into centrocytes (IgD /CD38 + /CD77 ) (142). Centrocytes undergo selection by competing for survival signals through Tfh cells in the presence of FDCs, during which CSR can occur (6, 141, 144). While most CD77 hi GC B cells are centroblasts and CD77 lo GC B cells are centrocytes, some centroblasts and centrocytes both express intermediate levels of CD77. Some studies even argue that the CD77 population represents a heterogeneous subset of cells, comprising centroblasts, centrocytes, and plasmablasts (145). Following the GC reaction, the maturing B cell receives signals to leave the GC as a memory cell (CD19+CD2+CD27+CD38-) or plasmablast (CD19+CD2- CD27hiCD38hiCD138-) (6). Plasmablasts are immature plasma cells, which secrete fewer antibodies than mature plasma cells. They proliferate rapidly and circulate in the peripheral blood where they are later recruited to bone marrow or mucosa niches. Depending on their chemokine receptor expression and stimuli in these niches, plasmablasts may receive the necessary survival factors to differentiate into antibody producing plasma cells (CD19+CD2-CD38hiCD27hiCD138+), through
45 positive expression of the extracellular matrix (ECM) receptor: syndecan-1 (CD138) (85, ). The low plasma cell counts found in healthy human blood (2/μL) makes the detailed characterisation of plasma cells difficult, and few studies characterizing these cells have been performed in tissues other than secondary lymphoid tissues (149, 15). Memory B cells can be defined by SHM of rearranged immunoglobulin genes and fast recall responses to antigens. CD27+ B cell expression is a hallmark for SHM and memory, where CD27+ B cells contain a heterogeneous memory population of pre-switched (CD19+IgM+IgD-CD27+) B cells and post-switched human MZ B cells (otherwise known as natural effector cells) (CD19+IgM+IgD+CD27+) ( ). A study in 211 described six B cell subsets known to contain genetic hallmarks of memory, with findings demonstrating that human memory B cells originate from three distinct GC-dependent and independent maturation pathways (154). More recently a double negative (CD19+IgD-CD27-) B cell population has been identified as an additional memory subset, mainly due to the majority of these cells harboring mutated Igs ( ). These cells contained fewer SHM compared to post-switch MZ B cells, implying that these cells may be representative of a distinct memory B cell lineage (158, 159).
46 Regulatory B cells (Bregs) act as immunosupressors by preventing expansion of pro-inflammatory lymphocytes and pathogenic T cells through IL-1 and TGF-β production. The importance of Breg development and their role in suppressing chronic inflammation has already been highlighted in mice (14, ), where many Breg subsets have been described to date. Such subsets include transitional 2 marginal-zone precursor cells (T2-MZP), B1 cells (CD5+CD1dhi), MZ B cells, CD138+ plasma cells and plasmablasts (72, 73, ). A range of Breg cells in humans have also been described, despite current findings being unable to reconcile the various phenotypes of human Breg cells. Human Bregs have most commonly been identified as CD19+CD24hiCD38hiCD1dhi and CD19+CD24hiCD27+ B cells (69, 93, 169). Upon in vitro CD4 engagement, peripheral CD19+CD24hiCD38hi B cells have been found to produce high levels of IL-1, and were the only subset able to suppress Th1 differentiation (93). As well as inhibiting Th1 responses and Th17 differentiation, CD19+CD24hiCD38hi Bregs were also able to convert CD4+ T cells into Tregs and Tr1 cells. (169) One study found that stimulation of B cells isolated from human spleen and blood via CpG-B + anti-ig, led to an increase of IL-1 producing B cells within the memory (CD27+) and transitional (CD38hi) B cell populations (92). More recently, TIM-1 and CD9 have also been described as unique markers for the identification of human (17), and human and murine(171, 172) IL-1+ Breg subpopulations, respectively. Specifically, frequencies of TIM-1+ IL-1+ B cells were found to be significantly decreased in systemic sclerosis patients compared to healthy controls, and decreased numbers of IL-1 producing CD9+ and CD27 B cell subsets were discovered in pemphigus
47 patients. To date, a number of reports describe different Breg subsets present in humans and their mechanisms of suppression, summarized in Table 2 below. Table 2 Phenotypes of human Breg cells. A list of reports describing human Breg cells and their mechanisms of suppression. Interestingly, a study in 21 described that over 7% of CD19+CD1dhiCD5+ human B cells previously reported to be regulatory in murine inflammation models, were also contained within the human transitional CD19+CD24hiCD38hi IL-1 producing B cell subset in SLE patients (93). This population of CD19 + CD24 hi CD38 hi B cells isolated from the peripheral blood of patients with SLE lacked the suppressive capacity possessed by their counterparts in healthy individuals (93). Further studies in MS patients with helminth infections have demonstrated higher
48 frequencies of IL-1-producing CD19+CD1dhi B cells, which play a role in suppressing T cell proliferation and IFN-γ production, resulting in a better clinical outcome (178). Studying the role of Bregs in SLE patients undergoing rituximab therapy (B cell depletion) has generally provided useful insight into Breg contributions to the maintenance of tolerance(48, 179). A higher immature to memory ratio correlated with long-term remission in rituximab treated patients, suggesting that repopulation with immature Bregs may have associations with improved disease outcome (48, 179, 18). This is further supported by results in another cohort of rituximab-treated SLE patients, where normalization of CD1d expression on newly repopulated CD19+CD24hiCD38hi B cells corresponded to improved clinical responses, and normalization of the inkt cell numbers and function, which were otherwise impaired in SLE patients (181). Collectively, these studies highlight the importance of Bregs in immune regulation and prevention of human autoimmune diseases. Depletion of B cells via the anti-cd2 monoclonal antibody rituximab has widespread use in the treatment of patients with autoimmune disorders such as MS, in which B cells were not previously considered to be significant (182). This B celldepletion has been proven to boost B cell regulatory functions, including restoration of IL-1 production and the Th1/Th2 balance, recruitment of regulatory T cells, and TGF-β release leading to apoptosis of effector T cells (183). Studies have shown that the timing of rituximab administration is important in restoring the balance between effector and Breg cells. In animal models, depletion of Bregs prior disease induction can aggravate autoimmune responses, and rituximab
49 therapy can exacerbate diseases such as ulcerative colitis and psoriasis ( ). One study demonstrated that in a mouse model of MS (EAE), depletion of B cells after antigen stimulation abrogated inflammatory responses to this antigen. However, B cell depletion prior to antigen stimulation resulted in an exacerbation of the immune response, which is thought to be attributed to the depletion of IL-1 producing CD1dhiCD5+ regulatory B cells (164). B cell depletion therapy has also been associated with increased rejection in transplantation. One clinical study administered rituximab as an induction therapy in patients undergoing renal transplantation. However the study was suspended shortly after recruitment, owing to an increased incidence of acute cellular rejection in the rituximab group (186). Similar to the mouse study, it was hypothesized that depletion of immunoregulatory B cells may have contributed to this increased rejection in the rituximab-treated patient cohort (186) Murine B1 cells (CD19hiCD43+CD23-CD1dint) in mice are known to express and produce high levels of natural IgM serum antibodies, which bind to a range of antigens with low affinity (123, 187). Until recently, a human B1 equivalent had not been identified. However in 211, one study identified human B1 cells as a CD2 + CD27 + CD43 + CD7 population of cells, contributing to 5 1% of B cells in umbilical cord and adult peripheral blood (116). This population was classified based on spontaneous IgM secretion, efficient T cell stimulation, and tonic intracellular signaling (116). However, these findings proved controversial, with subsequent findings concluding that this B cell phenotype was most likely a pre-plasmablast or
50 memory B cell subset (188-19). Since 211, there have been no further reports on these cells in the literature. Many differences exist between the murine and human MZ B cell subsets, however their main commonality is their ability to mount rapid T cell-independent immune responses to blood borne antigens (bacteria & viruses) recruited to splenic follicular areas. Unlike the short development time in mice, MZs in humans take up to two years to develop, and are generally less well organized in comparison to the mouse (2, 126, 129, 191). In mice the MZ population is a heterogeneous population, where over 8% of MZ B cells are naïve (B22+CD19+CD21hiCD22hiIgMhiCD9+IgDlo) (129, 191). However, in humans, MZ B cells begin as naïve, but rapidly diversify through SHM, which is triggered by a poorly understood process (129, 192). As a result of these rapid mutations, many human MZ B cells appear to be identical to somatically mutated, IgM + memory cells (CD19+CD27+IgD+IgM+), leading many to believe that MZ B cells represent a memory population (129, 191, 192). In fact, some studies argue that human CD19+IgM+IgD+CD27+ B cells are not MZ B cells but are memory B cells responding to T cell-independent antigens which leave the GC reaction prior to switching to other isotypes (193, 194). Although the spleen is required for MZ B cell generation in mice and men, murine MZ B cells solely localize to the spleen, whereas human IgM+CD27+ B cells freely recirculate (137, 195) and localize to various other anatomical sites (129, 154). It is
51 unlikely however, that these differences between murine and human B cells affect the functional ability of MZ B cells to respond to blood-borne pathogens (129).
52 1.5. THE LIVER ARCHITECTURE, FUNCTION AND MICROENVIRONMENT Weighing between kilograms, the liver is the largest organ in the human body (196). It extends across the abdominal cavity and is situated next to the stomach, just inferior to the diaphragm (196). The liver consists of two main lobes: the left and right lobes, and two smaller lobes: the caudate and quadrate lobes, which can be viewed from the visceral surface (197). The right lobe is the larger of the two main lobes, and is separated by the falciform ligament anteriorly and the ligamentum teres inferiorly (196). Both ligaments provide a structural support by assisting in the suspension of the liver together with the walls of the abdomen (196). The liver receives a dual blood supply, receiving 8% of its nutrient-rich blood from the gut through the portal vein and the remaining 2% of oxygen rich blood from the heart via the hepatic artery (198) (See Figure 8A). These blood supplies mix on entry to the liver before travelling through a complex system of branched sinusoidal vessels (198), where the blood then gathers at the central vein, and travels through the hepatic vein to the inferior vena cava to be re-oxygenated (196) (See Figure 8B). The blood supply network further segments the liver into eight portions, each with its individual arterial blood supply and bile drainage system (198, 199). This separation of the liver permits parts of the liver to be removed with ease during instances such as liver resection surgery (199, 2).


53 A B Figure 8 The blood supply of the liver. Image adapted from adapted from Schwartz's Principles of Surgery, 9 th edition, 29 (21). A. Diagram to demonstrate the internal anatomy of the liver including the dual blood supply from the hepatic vein and the aorta. B. Histological anatomy of the liver lobule and portal triad (22).
54 The liver has over 5 different functions and contains the biggest reticuloendothelial cell network (23). Some of its functions include glycogen storage, detoxification, hormone production, digestion and metabolism (24). As well as metabolic functions, the liver also performs unique immunological roles, and is involved in maintaining peripheral tolerance as well as protecting against harmful pathogens (23, 25). Furthermore, over 1.5 liters of blood passes through the liver every minute, making it an important organ in immune cell transit (26). Bile is a substance which consists of water, bile salts, cholesterol and bilirubin (27, 28). It is produced by hepatocytes in the liver to actively assist in the role of digestion, and travels through bile ducts before being stored in the gallbladder (25, 27, 28). As fat containing foods reach the duodenum, cells release a chemical hormone known as cholecystokinin, which stimulates the gallbladder to release bile through the bile ducts and into the duodenum (25). It is there that fats are emulsified which aids digestion (24, 27). As well as producing bile, hepatocytes of the liver are responsible for metabolizing carbohydrates, lipids, and proteins into biologically useful materials (24, 25, 28). Blood entering the liver through the hepatic portal vein is enriched in glucose from digested food (24). Hepatocytes metabolise carbohydrates into glucose, which can then be absorbed and stored as energy in the form of glycogen (24, 28, 29). The absorption and release of glucose by the hepatocytes helps to maintain homeostasis of blood glucose levels (21).
55 Lipid metabolism involves the breakdown of fatty acids by hepatocytes to generate ATP, which is important for the contraction and relaxation of muscles (28). Glycerol, another lipid component, is converted into glucose by hepatocytes through the process of gluconeogenesis (29, 21). Hepatocytes can also produce lipids such as cholesterol, phospholipids, and lipoproteins that are used by other cells throughout the body (28, 211). The degradation of proteins and amino acids is another important metabolic process in the liver. Amino acids require metabolic processing before they can be used as an energy source in the form of ATP, carbohydrates or fats (29). Furthermore, amino acid metabolism can lead to the formation of enzymes required in urea production from nitrogen (28). Hepatocytes are constantly monitoring the blood contents, which enter the liver from the gut through the hepatic portal circulation. They remove many toxic substances, which would otherwise pass into the rest of the body, causing damage (24, 28, 212). Toxic substances such as alcohol and drugs such as paracetamol are metabolized by the liver into harmless, inactive metabolites, which can then be transformed into bile (24, 25, 28, 212).
56 The liver stores several essential nutrients, vitamins, and minerals obtained from blood passing through the hepatic portal system (24, 28). Glucose is transported into hepatocytes under the influence of the hormone insulin and stored as the polysaccharide glycogen (28). Hepatocytes also absorb and store fatty acids from digested triglycerides (28). Vitamins A, D, E, K, and B12, and the minerals iron and copper are also continuously stored by the liver (28), thereby providing a constant supply of these essential substances to the tissues of the body. The storage of these nutrients allows the liver to maintain the homeostasis of blood glucose (28). The liver is also responsible for the production of several vital protein components of blood plasma: prothrombin, fibrinogen, and albumins (28), which are important in blood clot formation and maintenance of the blood isotonic environment. Despite the human liver harboring a variety of cells, 6% of cells in the liver are parenchymal cells called hepatocytes, which account for 8% of the liver mass (25, 213). Hepatocytes are large, polarized, polygonal epithelial cells, which are involved in many of the liver functions (refer to ). They form plates which are one cell thick, and their membranes are linked by tight junction proteins, allowing contact to be made with neighboring hepatocytes and other non-parenchymal cells (214). The hepatocyte apical surfaces form cannicular structures, allowing the secretion of bile which travels through the canaliculi and merges with the bile ducts (215). On the basolateral hepatocyte surfaces, the venous blood receives other secretions such as serum factors ( ).
57 The remaining 2% of liver cells are made up from non-parenchymal cells which include hepatic stellate cells (HSC), biliary epithelial cells (BEC) and hepatic sinusoidal endothelial cells (HSEC) (See Table 3 for parenchymal and nonparenchymal cell functions) (213). Non-parenchymal cells also include immune cells such as Kupffer cells, NKT cells, PiT cells and hepatic DCs (213).
58 Table 3 The cellular composition of the liver. The roles and definitions of parenchymal and non-parenchymal cells located in the liver (213, ). Type of cell Function / definition Parenchymal cells Hepatocytes Involved in detoxification of drugs, protein synthesis and storage, carbohydrate and fat metabolism Non-parenchymal cells Hepatic sinusoidal endothelial cells (HSEC) Biliary Epithelial Cells (BEC) Hepatic Stellate Cells (HSC) Kupffer cells (Liver specific macrophages) NKT cells (Natural killer T cells) Hepatic Dendritic Cells PiT-cells (Liver-specific NK cells) Activated human myofibroblast (almf) cells Removal of smaller particles from the circulation Also known as cholangiocytes. Contributes to bile production, dilutes and neutralizes bile, and transports it to the gall bladder and duodenum. Stores Vitamin A Intravascular tissue macrophages involved in the removal of large particles from the circulation Involved in anti-tumour and anti-viral roles Involved in phagocytosis and cytokine release in response to Toll-like receptor (TLR) stimulation NK cells located under fibroblasts and endothelial cells Only present in the injured liver. Transform from HSCs and are involved in angiogenesis and liver regeneration, however is also the cause for fibrosis.
59 Hepatic B cells Hepatic T cells Not much known. Contained in lymphoid structures which are enriched in diseases such as HCV and PBC. Produces autoantibodies in PBC. CD8+ T cells outnumber CD4+ T cells. Effector/memory T cells are greater in liver than blood. T cells demonstrate a bias towards tolerance. Local presentation of antigen causes T cell inactivation, tolerance and apoptosis. Sinusoids are vascular channels which provide hepatocytes with blood and are located between hepatocyte plates (226). The sinusoidal walls are lined with an endothelial cell known as HSEC (215), which acts as a molecular sieve due to the presence of fenestrations and lack of a basement membrane. This permits nutrients and other factors to pass through and into the sub-endothelial space known as the Space of Disse (215), which contains various ECM components such as collagen, fibronectin (215, 227, 228) and stromal cells including HSC, which are in constant contact with hepatocytes (229, 23). As well as being involved in vitamin A storage (213, 231, 232), HSCs also respond to liver injury by transforming into a liver myofibroblast cell (almf cell) (232). almfs are responsible for collagen deposition which can lead to fibrosis (233). BEC make up 5% of total liver cells and are located in the biliary tract (226). They are often the first point of contact for pathogens, which enter the liver through the bile ducts, therefore respond to various pathogens through the production of cytokines (226, 234). The structure of the liver architecture as described is demonstrated below in Figure 9.


60 Space of Disse Figure 9 The architecture of the liver. Positioning and architecture of parenchymal and non-parenchymal cells present in the liver as well as the Space of Disse, otherwise known as the perisinusoidal space. Non-parenchymal cells demonstrated include HSEC, HSC, Kupffer cells and BEC (surrounding bile duct not labeled). Adapted from Gordillo et al., 215 (226, ).
61 The blood from the gastrointestinal tract is rich in nutrients, harmless food antigens and pathogens that have breached the intestinal barrier (238). This blood passes through the liver via the portal vein, allowing hepatocytes to metabolize specific substances, whilst also exposing them to microbial antigens (239). Furthermore, the liver is exposed to cytokine-rich blood from the spleen and metabolite-rich blood from the systemic artery, and is the site of acute phase protein production, which also contributes to the liver immune function (239). These factors put constant pressure on the liver to induce tolerance to food antigens (24, 241). Although specialised immune cells, such as Kupffer and HSEC exist in the liver, other immune cells such as lymphocytes and NK cells also exist (24, 241). The fenestrated HSEC permits blood, Kupffer cells, DC s and lymphocytes to pass from the sinusoids into the space of Disse, where they make contact with hepatocytes (24, 242). Furthermore, HSECs are important APCs, which have the ability to engulf antigens through mannose and scavenger receptors, and present exogenous antigen on MHC class I and II molecules with a similar proficiency to DCs (243, 244). The presented antigens then interact with naïve and CD8+ and CD4+ T cells migrating into the liver ( ). In this way, it has been found that antigen presentation via HSECs leads to T cell tolerance (246, ).
62 Kupffer cells are liver-resident macrophages located in the hepatic sinusoids, which phagocytose pathogens and foreign particles entering the liver. They represent 8-9% of total macrophages in the body, and play a role in tolerance and immunity through T cell activation (251). Furthermore, Kupffer cells are also able to detect and bind bacterial pathogens via scavenger receptors, TLRs, complement and antibody receptors (252). This triggers Kupffer cell activation and drives cytokine and chemokine production, alerting other components of the immune system to the presence of harmful pathogens (253). Although numerous populations of DCs exist in the liver, liver derived DCs have a reduced capacity to drive T cell activation than DCs from other tissues (254, 255). This is in part due to their contact with HSECs and hepatocytes, as well as the presence of high IL-1 levels and low IL-12 levels in the liver (256, 257). Despite the function of liver-resident DCs under basal conditions, the efficiency of liver DCs to present antigens and to induce strong, antigen-specific activation of T cells can be inhibited by IL-1 or activation via TLRs (256, 258, 259). One study demonstrated that freshly isolated murine liver DC were refractory to the exogenous TLR-4 ligand, bacterial LPS. This led to impaired TLR9 signaling via CpG, reduced IL-12 and IFNγ production, and consequently, compromised T cell responses. The study went on to prove that this deficiency was associated with enhanced expression of negative regulators of TLR signaling (DAP12 and IRAK-M), and with inhibitory IL-6/STAT3 activity by liver DCs (26). Similar experiments can be designed using B cells, to investigate whether hepatic B cells have reduced APC capacity and impaired
63 cytokine production following TLR ligation. PiT cells are known to be liver-specific NK cells (245, 249, 261, 262), which adhere to Kupffer cells and endothelial cells (263, 264). They contain large granules containing perforin and granzymes which aid in NK-mediated cytotoxicity against tumour cells (262). Furthermore, they release IFN-γ, which triggers hepatocytes, and HSECs to secrete CXCL9, consequently promoting T cell recruitment and immunity (261, 265). NKT cells are enriched in the liver and express a TCR which recognizes lipid antigen presented by the MHCI-like molecule CD1d (266). They represent a potent immunomodulatory lymphocyte population, which is able to actively patrol the liver vasculature in search of pathogens. When activated through pathogen interactions or cytokines, NKT cells either release anti-inflammatory cytokines causing immune suppression (267), or synthesise large amounts of IL-4 causing B cell activation and antibody release (268, 269). The liver contains both resident and transiting lymphocytes, which differ from those in tissues. An enrichment of CD8+ T cells exists in the liver as well as one of the largest γδ T cell populations (27, 271). Both hepatic CD4+ and CD8+ T cell populations are activated, where CD4+ T cells produce high levels of IL-4 and IFN-γ (5, 245, 272), although conflicting findings state that T cell responses are dampened in the liver (273, 274). Recent findings have also elucidated the distinct phenotypic and functional profile of MAIT cells, which are an abundant and distinctive T cell
64 subset found enriched in both the gut and in the liver (275, 276). In humans, MAIT cells represent between 12% and 5% of T cells (277). This population expresses a specific TCR, has a unique innate phenotype driven by the transcription factors RORγt and PLZF, and performs a broad range of effector functions (278, 279). Although previously associated with mucosal defenses and anti-bacterial functions, recent studies have established MAIT cells are also specifically activated by pathogenic viruses such as HCV in vivo and in vitro; driving cytokine release, Granzyme B upregulation, and a reduction of IFN-γ-mediated HCV replication in vitro (276). 51% of lymphocytes in the liver are B cells, the majority of which express CD5 (5). However, further phenotyping and functional characterisation of human liver-resident B cells have been less widely illustrated (28). In mice, over 5% of intrahepatic lymphocytes are B cells, making the murine liver ideal for the study of hepatic B cells (5, 281, 282). Murine B cells have been found to display BCR-independent complement-mediated phagocytic activity, with bactericidal properties similar to Kupffer cells (282, 283). Additional studies have highlighted differences between hepatic B cells in response to LPS compared to lymphoid and splenic B cells. Results concluded that hepatic B cells produced significantly higher levels of proinflammatory cytokines (IFN-γ, and TNF-α), and significantly lower levels of antiinflammatory cytokines (IL-1) in comparison to splenic B cells (283, 284). Furthermore, liver resident B cells demonstrated their ability to activate hepatic myeloid DCs to produce pro-inflammatory cytokines IL-6, 1L-12 and IFN-γ, compared to splenic B cells which inhibited their activation (284). Other data indicated that hepatic Bregs activated by TLR4 ligation secrete reduced IL-1
65 compared with lymphoid tissue B cells, indicating a reduced regulatory capacity of Bregs in the liver (284). These studies implied that hepatic B cells may have initiated inflammatory processes in the liver and that liver resident B cells may have had a different role to B cells found in other tissues. The majority of studies with regard to intrahepatic B cells are in reference to murine studies. Although a few studies exist on B cells in the peripheral blood of liver disease patients, very few studies have been conducted in reference to B cells in the human liver. Table 4 below lists the main recent findings from investigations into human intrahepatic B cells (285).
66 Table 4 Studies on visualizing or quantifying human intrahepatic B cells. A list of studies, findings, and conclusions on human liver B cells.
67
68 Despite the liver receiving cytokine-rich blood from the spleen, constitutive hepatic cytokine production is absent or low (284, 299). Hepatocytes harbor an array of cytokine and growth factor receptors, therefore making the liver highly susceptible to cytokine activity (3, 31). Cytokines are not only involved in the metabolism of amino acids, proteins, lipids and carbohydrates (31-34), but also play a role in liver regeneration (34). Increased pro-inflammatory cytokine production results in hepatic inflammation, cholestasis, fibrosis and ultimately liver failure (34). The various roles of cytokines in liver diseases can be viewed in Table 5.
69 Table 5 Cytokines in liver disease. Table demonstrating cytokines and their effect / role in the liver. Adapted from (299, 31). Function / Effect in the liver Cytokines involved in immune responses Cytokines IL-2, IL-4, IL-7, IL-9, IL-12, IL-15, IL- 17 Th1 cytokines (IL-2, IFN-γ) Th2 cytokines (IL-4, IL-5, IL-1) Pro-inflammatory cytokines IL-1α, IL-1β, TNF-α IL-6 type cytokines (IL-6, IL-11, LIF, OSM, CNTF, CT) IFN-γ IL-12 IL-18 Anti-inflammatory cytokines IL-1Ra Soluble IL-1 receptor type II Soluble TNFR p55/p75 IL-1 IL-4, IL-13 Cytokines and acute liver failure Fas, Fas ligand TNF and TNFR p55/p75 IFN-γ IL-18 Fibrogenic cytokines TGF-β PDGF FGF Anti-fibrogenic cytokines IFN-α
70 Although lymphocytes are able to modify liver immune responses, non-immune cells such as stellate cells, BEC, HSEC also produce and respond to hepatic cytokines (299); contributing to local immunological potential. Infectious and non-infectious agents trigger cytokine production, and collectively the roles of the lymphocytes and liver cells determine the outcome of immunological stimulation in the liver (299, 31, 34). Inflammatory cytokines such as IL-6, IFN-γ and TNF-α are produced by Kupffer cells and have been known to cause hepatocyte damage and acute liver damage leading to chronic liver disease (251, 299, 31). TNF-α in particular has been identified as a central mediator for apoptosis and necrotic damage in acute liver failure models, where infiltration of neutrophils and T cells also exists (299, 35). Furthermore, studies have proved that TNF-α levels are elevated in fatty liver disease, alcoholinduced liver injury, hepatitis and autoimmune liver diseases (36-39). Despite being associated with liver injury, TNF-α has also proven to be essential in hepatic regeneration, where liver regeneration is impaired when TNF-α is blocked following chemical liver injury (31, ). IL-6 is also an inflammatory cytokine which is also produced by macrophages, endothelial cells and T cells (251). In Kupffer cells, IL-6 production triggers the release of acute-phase proteins via the IL-6R on hepatocytes (299, 315), which emphasizes this cytokine s ability to control local and systemic inflammatory reactions. IL-6 levels are also elevated in liver cirrhosis and non-alcoholic fatty liver disease, highlighting its negative impact on the liver (33, 39). Contrary to its damaging associations, IL-6 has also been found to have some beneficial roles in the liver. As well as inducing cell growth and T cell differentiation, IL-6 has an
71 important role in liver regeneration and in preventing liver damage ( ). It is also important in inducing B cell terminal differentiation and supporting B cell production of IgG (319). IL-6 secreting B cells also propagate B cell-driven pathogenesis of T cell-driven autoimmune diseases such as Experimental autoimmune encephalomyelitis (EAE) and multiple sclerosis (32). Collectively, these studies stress the relevance of pro-inflammatory cytokines in liver damage, control of liver inflammatory reactions and in liver regeneration. Important immunosuppressive and anti-inflammatory cytokines in the liver include TGF-β and IL-1 (31). Whilst activated Kupffer cells in the liver are a major source of inflammatory cytokines, they have also been found to secrete IL-1 and TGF-β in the non-inflamed liver (321) (322, 323). The importance of immunosuppressive cytokines in hepatic disease was highlighted in a study, which demonstrated that IL- 1 used to treat patients with chronic hepatitis C resulted in reduced hepatic fibrosis (324). Additional findings demonstrated that IL-1 knockout mice treated with CCL4 to induce fibrosis, demonstrated significantly higher levels of fibrosis and hepatic TNF-α levels compared with wild-type controls (325). Other growth factors such as hepatocyte growth factor (HGF) have also been linked with the attenuation of liver fibrosis and increased hepatic regeneration (299, 31, 326). Not all anti-inflammatory cytokines are anti-fibrotic in the liver. TGF-β1 is the most common isoform found in the liver and is secreted by immune cells such as Kupffer cells, hepatic stellate cells and epithelial cells. As a paracrine and autocrine key mediator of increased deposition of ECM proteins, it is unsurprising that previous studies showed that the expression of TGF-β1 is upregulated in experimental models of CCL 4 induced hepatic fibrosis (39, 327) (328).
72 Growth factors such as B cell activating factor (BAFF) are also abundant in the liver. BAFF is a member of the tumor necrosis factor (TNF) superfamily and contributes to the survival and maturation of B cells (329, 33). It is a growth factor produced by macrophages, neutrophils, DCs, and T cells patients (33, 331). Its presence in the liver is significant, as studies show that BAFF levels are increased in the blood of liver disease patients, and that BAFF contributes to liver injury and disease development in patients suffering from autoimmune hepatic diseases ( ) (332).
73 1.6. CHRONIC LIVER DISEASES A broad range of immune mediated and non-immune mediated end-stage liver disease explants were used in this study to investigate the role of B cells in endstage chronic hepatic disease. Although hallmarks of all chronic liver diseases similarly progress from inflammation to fibrosis and cirrhosis, each disease is triggered by various contributing factors. For this reason the liver disease explants used can be categorised into three broad categories including: viral, autoimmune and environmental (dietary injury). Non-Alcoholic Fatty Liver Disease (NAFLD) encompasses a spectrum of diseases including hepatocellular steatosis, Non-Alcoholic Steatohepatitis (NASH), fibrosis and irreversible cirrhosis. NAFLD is caused by fat deposition and obesity, which leads to cytokine accumulation and oxidative stress in the liver (334) (39), resulting in liver cell injury and inflammation. NAFLD progresses to the chronic disease NASH, which resembles ALD, but occurs with little or no alcohol consumption (335). NASH is usually a silent disease with few or no symptoms, however progression of the diseases can result in cirrhosis, liver failure and hepatocellular carcinoma (HCC), which can lead to the manifestation of symptoms such as fatigue, weight loss, and weakness (334, 335). Although a relatively common disease, NASH is not definitively diagnosed from fatty liver until a liver biopsy is taken to show fat accumulation along with inflammation and damage to liver cells.
74 Innate immune cells, consisting of Kupffer cells, neutrophils, DCs and NK cells, have all been shown to play a role in the pathogenesis of NASH (336). Kupffer cells are activated by both pathogen-associated molecular patterns (PAMPs) and damageassociated molecular patterns (DAMPs) leading to secretion of pro-inflammatory cytokines, such as TNF-α, IL-6, and IL-1β (251). This results in T cell activation and induction of apoptosis and HSCs. Furthermore DCs and NKT cells also appear to play an important protective role in NASH, as recent reports have shown that DC and NKT cell depletion results in worsening of NASH severity (337, 338). Alcoholic Liver Disease (ALD) is a major cause of liver disease in Western countries. Caused by alcohol overconsumption, it encompasses fatty liver disease, alcoholic hepatitis, HCC and chronic hepatitis with liver fibrosis or cirrhosis. ALD is characterized by inflammation, hepatocellular destruction and fat accumulation in hepatocytes. Surprisingly, of all chronic heavy drinkers, only 15 2% develop hepatitis or cirrhosis, where risk factors include gender, genetic factors, pattern of drinking and diet (339). Like NASH patients, in the early stages, patients with ALD exhibit subtle and often no abnormal physical findings, unless detected through abnormal liver enzyme readings and liver biopsies, which are mostly indistinguishable from symptoms of NAFLD (339). Both innate and adaptive immune responses contribute to ALD. It has been shown that chronic alcohol consumption increases gut permeability, allowing bacteria to enter the blood stream to the liver (34, 341). These bacteria activate hepatic Kupffer cells via TLRs and NOD-like receptors (NLRs), which then secrete the pro-
75 inflammatory cytokines IL-6 and TNF-α (34). These cytokines then attract more immune cells that contribute to liver injury. Furthermore, in alcoholic hepatitis, neutrophils are recruited to the intralobular region of the liver, where inflammatory mediators such as IL-8 and IL-17 chemokines, play a pivotal role in neutrophil infiltration in ALD (342). Th17 cells have also been identified in peripheral blood of alcoholic cirrhosis patients, and have been shown to correlate with disease severity (343). Other effects of alcohol on the liver include oxidative stress, lipid peroxidation, and acetaldehyde toxicity (344). Primary biliary cirrhosis (PBC) is an autoimmune disease, which mainly affects women. It characterized by the slow progressive destruction of small bile ducts leading to the accumulation of bile and toxins in the liver. This results in liver cell damage, inflammation, fibrosis and cirrhosis (345, 346). PBC is usually diagnosed through liver enzyme tests, the detection of anti-mitochondrial antibodies (AMAs), detection of other autoantibodies (anti-nuclear antibodies (ANAs) and abdominal ultrasound (346). Though predominantly asymptomatic, some PBC sufferers experience extreme fatigue, itching and jaundice. The cause of PBC has an immunological basis, where 95% of patients have AMAs an against pyruvate dehydrogenase complex (PDC-E2), an enzyme complex found in mitochondria (347, 348). A significant proportion of B cells which form 1% of the inflammatory infiltrate present within the portal tract, produce antibodies which are reactive against PDC epitopes (349). Furthermore, T cells have also been found to
76 play a pivotal role in the autoimmune response in PBC, where studies have shown that there is overlap in the PDC-E2-specific T and B cells, where CD4+ and CD8+ T cells contribute to a significant proportion of the inflammatory infiltrate within the portal tracts of patients with PBC (35, 351) (352). Primary sclerosing cholangitis (PSC) is a chronic liver disease strongly associated with inflammatory bowel disease and ulcerative colitis (353), and is more commonly found in men. It is characterized by a progressive course of cholestasis (decreased bile duct flow) with inflammation and fibrosis of the larger intrahepatic and extrahepatic bile ducts, which leads to liver cirrhosis, portal hypertension and HCC (353, 354). The aetiology of PSC is still relatively unknown. Immune responses against selfantigens in the bile ducts have been proposed to play an important role in the pathogenesis, as large numbers of autoantibodies are detected in PSC patients (286). Anti-neutrophil cytoplasmic antibodies (ANCA) in particular are a fairly consistent feature of PSC occurring in up to 88% of patients (355). However, controversy exists as to whether PSC should be termed an autoimmune or merely immune-mediated disease, because the specificity of these antibodies is generally low, and the frequencies vary largely between different studies (355). Other possible contributors to PSC disease pathogenesis are the portal tract infiltrate of functional T cells, a restricted T cell receptor repertoire, and aberrant expression of HLA molecules on BEC (356, 357). These may assist in the initiation of the immune response by admission of bacteria into the portal circulation through the diseased
77 and permeable bowel wall. Furthermore, blood levels of TNF-α, IL-1, and IL-8 (a neutrophil activation marker) were found to be significantly higher in PSC compared to patients with alcoholic cirrhosis or normal controls. However, this did not correlate with ANCA titers (351). Hepatitis B and C virus infections (HBV and HCV respectively) can be asymptomatic. However, chronic infection can cause hepatocyte destruction, inflammation, fibrosis and cirrhosis, leading to liver failure and HCC disorders (358, 359). HCV in particular has also been linked with diabetes, autoimmune thyroiditis and B cell lymphoproliferative disorders (36, 361). HCV is characterised by lymphocytic infiltrates which aggregate to form tertiary structures and GCs (362). Successful clearance of HCV infection involves activation of NK cells, processing of viral antigens by dendritic and Kupffer cells and consequent activation of CD4+ and cytotoxic CD8+ T cells through IFN-γ production. Cytotoxic T cells then cause direct lysis of infected cells and inhibit viral replication through cytokine production (363). An inefficient immune system, and in particular failure of NK cells, dendritic cells, and CD4+ cells, can lead to ineffective cytokine responses leading to failure in in eliminating HCV. In some cases, although humoral and cellular immune responses are induced, persistent infection is generally associated with weak CD4+ and CD8+ T cell responses (364, 365). In HBV, it is the adaptive immune response, which is thought to be responsible for viral clearance and disease pathogenesis (366). During successful clearance of viral
78 infection, the antibody response clears circulating virus particles and prevents viral spread within the host, whilst the vigorous T cell responses eliminate infected cells. The T cell responses to HBV are vigorous in acutely infected patients who successfully clear the virus and weak in chronically infected patients, suggesting that clearance of HBV is T cell dependent (366) It is necessary to study the normal B cell subset composition of a healthy donor liver, however normal liver tissue is difficult to obtain. During this study, donor livers rejected for transplants due to being steatotic and resection margins from HCC livers, under chemotherapy, were used to approximate healthy tissues. These models are not representative of the normal immunological liver environment, which will be taken into consideration during analysis of the results.
79 1.7. CO-CULTURE MODELS TO STUDY THE EFFECTS OF LIVER CELLS ON B CELL BIOLOGY I was interested in identifying how B cells interact with the liver microenvironment. To address this question, B cells were co-cultured with liver cell lines which will be described further in the method section (Chapter 2). LX2 cells are a human HSC line, originally developed to help elucidate pathways of human hepatic fibrosis (367). Following activation into fibrogenic myofibroblast-like cells, HSCs contribute to collagen accumulation during chronic liver disease (368, 369). To overcome issues of species specificity and culture variability, and to provide a stable and unlimited source of human HSCs that are homogenous, two immortalized HSC cell lines were developed (367). SV4 T antigen immortalization and spontaneous immortalisation in low serum conditions were used to produce LX- 1 and LX-2 cell lines respectively. These cell lines have been extensively characterised and retain key features of cytokine signaling, neuronal gene expression, retinoid metabolism, and fibrogenesis, making them highly suitable for culture based studies of human hepatic fibrosis. LX2s in particular, have high transfectability and ability to withstand serum free conditions. As a well-characterized cell line, the LX2 hepatic stellate cell line was used in co-cultures with B cells to mimic interactions with stellate cells (367).
80 Hepatic portal fibroblasts are responsible for generating collagen, glycosaminoglycans, elastic fibers and glycoproteins (37). This accumulation of ECM causes liver fibrosis, which is present in the majority of chronic liver diseases (371). Fibrosis can result in cirrhosis, liver failure, and portal hypertension which often requires liver transplantation (372). It is well established that fibroblasts are derived from activated stellate cells (371). Unlike epithelial cells, fibroblasts do not form a flat monolayer and lack a basal lamina (37). Lymphocytes including B cells are most frequently found lining the fibrotic septa during liver inflammation (373). Little is known about the contribution of this interaction to B cell biology, yet a role for B cells in liver fibrogenesis has been postulated, where one study showed that in B cell deficient, CCl 4 -treated mice, there was deceased liver fibrosis and collagen deposition in comparison with CCl 4 -treated WT BALB/c mice. Mice with normal B cell numbers that lacked Ig or contained low Ig in their serum were found to develop a similar degree of CCl 4 -induced liver fibrosis when compared with wild type mice (282, 374). This led to the hypothesis that in the absence of B cells the ability of macrophages to clear expiring hepatocytes was enhanced, and that B cells contributed to fibrosis in an antibody and T cell-independent manner (282, 374). In mice with experimentally induced liver fibrosis, lymphocytes were only found in the proximity of activated HSC/aLMF, suggesting that there is a direct interaction between liver myofibroblasts and infiltrating lymphocytes (373). Furthermore, previous studies have found that transient interactions between integrins (such as fibronectin, β1, α4 and α5 integrins) and the ECM matrix may favor B cell migration along collagen (375). This suggests that B cells may stimulate fibroblasts by directly interacting at sites of liver damage to facilitate the matricellular changes associated
81 with fibrosis and chronic inflammation, or by forming contact-dependent interactions with other cells that favor a profibrotic microenvironment (373). It is also possible that B cells produce the profibrotic cytokine IL-6, which may contribute to liver fibrosis by inducing the differentiation of HSCs into myofibroblasts, inducing fibroblast proliferation, and increasing collagen and tissue inhibitor of metalloproteinase (TIMP) synthesis (374). BEC, or cholangiocytes, line a complex network of conduits, which make up the biliary tree in the liver (226). Although BEC only comprise 3 5% of cells within the liver, they are essential for the formation of bile ducts in the liver and assist with the transport of bile into the duodenum (226, 376, 377). The function of BEC varies across the biliary tree. For example, when bile passes through large BEC lined channels, the bile is alkalinized and diluted via BEC s secretory and absorptive processes (226, 376, 377). However, BEC lining small bile ducts also possess proliferative capabilities, plasticity and a reparative phenotype in certain disease conditions (226). Furthermore, these cells are targeted by autoantibodies in autoimmune conditions such as PBC (345) and are also damaged in PSC (378, 379), therefore their potential interactions with B cells and/or plasma cells may be of clinical importance.
82 HSECs are one of the first cell populations in the liver to become exposed to blood components therefore have an important role in receptor-mediated clearance of endotoxins and bacteria. The most defining feature of HSEC are the presence of multiple fenestrae throughout the cell, which acts as a mechanical sieve, facilitating the transfer of nutrients and molecules from the sinusoidal space to the hepatic parenchyma, and restricting the access of blood bound compounds to the parenchyma (38). Although HSEC have been shown to rarely express cell adhesion molecules such as selectins, other adhesion proteins such as vascular adhesion protein (VAP-1), ICAM-1, VCAM-1, and CLEVER-1, aid B cell transmigration through HSEC layers, and are responsible for capturing leukocytes and recruiting them to areas of inflammation (38-382). While P-selectin has been found to be weakly expressed in portal endothelial cells (383), there are no reports of P-selectin being expressed on HSEC specifically. Some B cells are found in the sinusoids, although consequences of the potential interaction between B cells and HSEC have not yet been identified.
83 1.8. PROJECT AIMS The precise composition of the B cell compartment in the human liver remains uncharted. I hypothesize that as a tolerogenic organ, the human liver harbors a range of defined B cell subsets, and that distinct disease mechanisms across liver diseases imprint unique B cell signatures reflecting relevant populations in the liver. I aimed to define the role of B cells in the human liver and hepatic inflammation. This would indicate the role of B cells in hepatic disease progression, providing a possible therapeutic target for the treatment or prevention of chronic liver disease. Firstly I wanted to develop a flow cytometry panel that would aid in the identification of B cell subsets in the human liver, and use immunohistochemistry (IHC) to localize B cells in liver tissues. By phenotypically characterizing B cell subsets in the liver, I will be able to determine whether subsets with specific functions are enriched in certain end-stage liver diseases, thereby assisting in thoroughly elucidating the role of B cells in hepatic disease. Identifying the location of B cells across liver diseases may indicate where and how B cells may contribute to liver damage and hepatic disease progression. Secondly, I wanted to compare B cell subsets in human blood and liver, as strong differences between liver and blood may further highlight the functional role of hepatic B cells, and indicate whether previously undefined B cell subsets are enriched in the liver compared to blood.
84 Finally, I wanted to compare B cell populations in patients across various immune and non-immune-mediated liver disorders, as enrichment of specific B cell subsets in certain hepatic diseases may be indicative of a role of B cells in liver disease progression or prevention.
85
86 2.1. LIVER TISSUE SAMPLES Liver tissue explants were obtained from patients suffering from end stage hepatic disease, at the Queen Elizabeth Hospital, Birmingham. These samples were used following patient consent and were in approval with the local research ethics committee guidelines. The liver explants received were taken from patients with chronic end stage liver disease who were undergoing transplantation due to suffering from various etiologies such as PBC, PSC, ALD and NASH. Furthermore, liver tissue was also received in the form of donor livers from patients who had passed away, but were unsuitable for transplantation due to liver size or being too steatotic. These livers formed part of the donor cohort. All tissues were processed promptly after collection to ensure that a high yield of viable liver infiltrating mononuclear cells were obtained (LIMCS), as well as HSEC and BEC which were isolated by Gill Muirhead and used in my co-culture experiments.
87 2.2. MULTI-COLOUR FLOW CYTOMETRY Flow cytometry provides both quantitative and qualitative data, analyzing various characteristics of single cells passing through a laser light beam. This procedure allows cells to be stained with fluorochromes for various markers and properties, where the fluorescence of these single cells can later be measured. As interception of the laser beam occurs, light is scattered and the fluorescent dyes used to mark the cells are excited. The scattered light is collected and converted to an electric signal by photon multiplier tubes (PMT). Filters are able to direct the emitted light to different PMTs according to their wavelength (384). Cell populations can usually be identified according to their physical properties, such as size (defined by forward scatter) and granularity (defined by side scatter). Gates were drawn based on forward and side scatter around lymphocytes, whilst excluding debris and doublets (Fig. 1A). In order to control for autofluorescence and non-specific binding of antibodies, isotype matched control antibodies were used in each experiment. Negative controls were used to set the voltages by placing their histograms within the first decade in correspondence with the fluorochrome used to label the cells (Fig. 1B). This meant that cells that demonstrated peaks beyond the first decade were considered as positive. However, the emission spectrum demonstrates a significant overlap of different dyes, which is a problem when using multi-colour flow cytometry. In this scenario, overlaps must be compensated, by running samples stained with individual fluorochromes. In my experiments I used compensation beads (OneComp ebeads, , ebioscience, UK) to do this. Compensation is important to avoid detection of false positive signals. For example, if there is spectral overlap between flourochromes PE and FITC, it means light detected by FL1 (FITC) and FL2
 (Fig. 1C).")

88 (PE) contains light from each other s dye. FL2 can detect excess fluorescent signals due to the intensity of FITC emission, thereby leading to false positive PE signals. Therefore, by subtracting the total percentage of FITC signal generated in FL1 from the total PE signal generated from FL2, this overlap can be compensated (385) (Fig. 1C). All compensation was performed following data collection using the compensation matrix within the FlowJo software. 6K 5 1K SS Lin: SS 4K 2K Pulse Width: Pulse Width 3 2 # Cells K 4K 6K FS Lin: FS K 4K 6K FS Lin: FS CD # Cells 1 5 # Cells 2 1 # Cells <FL 2 Log>: PE <FL 6 Log>: Violet <FL 1 Log>: FITC Figure 1 Gating strategy and calibration of the flow cytometer. (A) Gating strategy of lymphocytes from LIMCs, followed by selection of single cells and the CD19+ population of B cells. (B) Histograms in the unstained sample of LIMCs, where all voltages are set to remain within the first decade, to allow accurate detection of positive staining. (C) A demonstration of the overlap, which can occur between voltages. This overlap needs to be compensated to allow accurate detection of positive staining.
89 Due to the large number of stains used on each panel, it was important to assess whether the Fortessa was more sensitive to picking up B cell subpopulations compared to the Dako CyAN. LIMCs from a patient with polycystic liver disease were isolated (As stated in ) and stained using B cell and Breg panels (Table 5 7 in ). 2x panel stains were prepared for each Breg and B cell panel so that each sample could be run through both the Fortessa and the Dako CyAn.
90
91 The data from this comparison experiment (Fig. 7) shows that although percentages were slightly higher in samples collected using the Fortessa, the separation of populations were clearer when data was collected using the CyAn. Furthermore, many populations aggregated around the axis when collected with the Fortessa, making it difficult to place exact gates to quantify B cell subsets. For these reasons, the Dako CyAn was used to collect all patient data henceforth.
92 2.3. ROUTINE TECHNIQUES Liver tissue slices were weighed, macerated using scalpels and rinsed in cold sterile PBS until washes ran clear. The tissue was transferred to a stomacher 4 circulator bag (Seward Limited, UK) with 3ml of RPMI media (Gibco Life Technologies, UK), before being sealed and placed in the Stomacher 4 circulator machine (Seward Limited, UK) for 5 minutes at 26RPM. The liver-rpmi solution was then poured through a fine mesh beaker and washed through with sterile PBS. The filtrate was distributed into 5ml tubes (Corning incorporated, UK) prior to centrifugation for 5 minutes at 75g. Pellets were pooled, washed and centrifuged several times until two 5ml tubes remained. These two 5ml tubes were washed and centrifuged for a further 5 minutes at 75g. The supernatant was disposed of and the pellet resuspended in >3ml PBS, allowing all residual debris to sink to the bottom of the tube. The new supernatant was then layered on 2ml of lympholyte cell separation media (Cedarlane, UK), taking care to avoid the pellet of heavy sediment at the bottom of the tube. This was centrifuged at 7g for 2 min with no brake. The LIMC buffy coat layer was harvested and washed once with PBS prior to being resuspended in 1ml of FACS buffer (1% FBS diluted with sterile PBS) and counted using trypan blue (Sigma-Aldrich, UK).
93 Consented unmatched and matched blood was received from the Queen Elizabeth Hospital from patients suffering from haemochromatosis. Blood was diluted 1:1 with PBS in 5ml tubes (Corning, UK) before being layered on 2ml of Lympholyte cell separation media (Cedarlane, UK). This was centrifuged at 7g for 2min with no brake. The PBMC buffy coat layer was harvested and washed once with PBS prior to being resuspended in 1ml of FACS buffer (1% FBS diluted with sterile PBS) and counted using trypan blue (Sigma-Aldrich, UK). 1.5 x 1 6 isolated LIMCs were distributed to each sample FACS tube (BD Falcon, UK) for staining. Compensation bead tubes were prepared using one drop of OneComp ebeads (ebiocences, , UK) with 1μl of FACS buffer per FACS tube. Relevant antibodies and isotype-matched controls were then added at the dilution stated (Table 6 & 7 for old two-colour panels, Table 8 1 for updated threecolour panels) and left to incubate for 2 minutes in the dark at room temperature. Following incubation, beads were washed in 1ml of FACS buffer, centrifuged for 5 minutes at 75 and resuspended in 3μl of PBS. If required, some samples were fixed using 1% PFA (Sigma-Aldrich, UK) for 1 minutes at room temperature before being washed and resuspended in 3μl of PBS. Samples were stored at 8 C in the dark until data could be collected using the cyan flow cytometer (CyAn ADP Analyser, Beckman Coulter Inc., UK). Tables 6 and 7 below describe the initial two panel stains developed to identify seven B cell subsets. This panel was later expanded to a more extensive three eight-colour panels (Tables 8 1), which stained for over 11 B cell subsets.
94 Table 6 Antibodies and IMCs used in the old B cell panel 1. All IMCs were used at the same dilution as the matching antibody. This panel allowed the characterisation of memory, naïve, and natural effector cells. Plasma cells and plasmablasts were also identified using this panel. All antibodies used in this panel were from MACS, Miltenyi Biotec, UK Old Antibody Panel 1- B cells CD19-PerCP-Vio7, human CD38-PE-Vio77, human CD138 (44F9)- VioBlue, human Catalogue number Working dilution Isotype Matched Control (IMC) IMC catalogue number /1 Mouse IgG1-PerCP-Vio /1 Mouse IgG2b-PE-Vio /1 Mouse IgG1-VioBlue Anti-IgD-APC, human /1 Mouse IgG1-APC Anti-IgM-PE, human /1 Mouse IgG1-Pe CD27-APC-Vio77, human /1 Mouse IgG1-APC-Vio Table 7 Antibodies and IMCs used in Breg panel 2. All IMCs were used at the same dilution as the matching antibody. This panel allowed the characterisation of human B1 regulatory cells and transitional Breg cells. All antibodies used in this panel were from MACS, Miltenyi Biotec, UK Old Antibody Panel 2 Bregs CD19-PerCP- Vio7, human CD38-PE-Vio77, human Catalogue number Working dilution Isotype Matched Control (IMC) IMC catalogue number /1 Mouse IgG1-PerCP-Vio /1 Mouse IgG2b-PE-Vio CD1d-PE, human /1 Mouse IgG2b-PE CD24-APC, human /5 Mouse IgG1-APC CD5-VioBlue, human /1 Mouse IgG1-VioBlue
95 The following tables (Tables 8 1) describe three extended B cell panels which allowed the continued characterisation of the seven B cell subsets mentioned previously (See Tables 6 and 7), as well as the phenotypic characterisation of the newly identified CD24-CD38- and CD24-CD38int B cell populations. Furthermore, this panel allowed staining for four additional B cell subsets including GC B cells (CD77), activated B cell subsets (CD5 and CD69), class switched B cells through surface Ig expression (IgA, IgD, IgG, IgM) and the human B-1 panel (CD19+CD7- CD43+CD27+) as described by Griffin et al. 211 J Exp Med. Table 8 Antibodies and IMCs used in expanded B cell panel 1. All IMCs were used at the same dilution as the matching antibody. This panel allowed the characterisation of transitional, memory, naïve, GC, non class-switched, CD24-CD38- and CD24-CD38int B cell populations and natural effector cells. Plasma cells and plasmablasts were also identified using this panel. Expanded antibody Panel 1 CD19 PeCy5, anti-human (Biolegend, UK) CD24 APC anti-human (MACS, Miltenyi Biotec, UK) CD38 Pe-Vio77, anti-human (MACS, Miltenyi Biotec, UK) CD27-APC-Vio77, human (MACS, Miltenyi Biotec, UK) CD138 (44F9)-VioBlue, antihuman (MACS, Miltenyi Biotec, UK) Anti-IgM-PE, anti-human (MACS, Miltenyi Biotec, UK) IgD BV51, Mouse antihuman (Biolegend, UK) CD77 FITC, anti-human (Biolegend UK) Catalogue number Working dilution Isotype Matched Control (IMC) /2 Mouse IgG1- PeCy5 (Biolegend, UK) /5 Mouse IgG1-APC (MACS, Miltenyi Biotec, UK) /1 Mouse IgG2b-PE-Vio77 (MACS, Miltenyi Biotec, UK) /1 Mouse IgG1-APC-Vio77 (MACS, Miltenyi Biotec, UK) /1 Mouse IgG1-VioBlue (MACS, Miltenyi Biotec, UK) /1 Mouse IgG1-PE (MACS, Miltenyi Biotec, UK) /1 Brilliant Violet 51 Mouse IgG2a (Biolegend, UK) /1 FITC Mouse IgM (Biolegend, UK) IMC catalogue number
96 Table 9 Antibodies and IMCs used in expanded B cell panel 2. All IMCs were used at the same dilution as the matching antibody. This panel allowed the characterisation of CD24-CD38- and CD24- CD38int B cell populations, B1 regulatory, activated and IgA expressing B cells. Expanded antibody Panel 2 CD19 PeCy5, anti-human (Biolegend, UK) CD24 APC anti-human (MACS, Miltenyi Biotec, UK) Company and catalogue number Working dilution Isotype Matched Control (IMC) /2 Mouse IgG1- PeCy5 (Biolegend, UK) /5 Mouse IgG1-APC (MACS, Miltenyi Biotec, UK) IMC catalogue number CD38 Pe-Vio77, anti-human (MACS, Miltenyi Biotec, UK) CD5-VioBlue, anti- human (MACS, Miltenyi Biotec, UK) /1 Mouse IgG2b-PE-Vio77 (MACS, Miltenyi Biotec, UK) /1 Mouse IgG1-VioBlue (MACS, Miltenyi Biotec, UK) CD3 BV51, anti-human (Biolegend, UK) CD1d PE, anti-human (MACS, Miltenyi Biotec, UK) /1 Brilliant Violet 51 Mouse IgG2a (Biolegend, UK) /1 Mouse IgG2b-PE (MACS, Miltenyi Biotec, UK) Brilliant Violet 51 Mouse 4268 IgG2a IgA FITC, Goat antihuman (Bethyl, UK) CD69 APC-Vio77 (MACS, Miltenyi Biotec, UK) A8-12F 2/1 Goat IgG FITC (Southern Biotech, UK) /1 Mouse IgG1 APC-Vio77 (MACS, Miltenyi Biotec, UK)
97 Table 1 Antibodies and IMCs used in expanded B cell panel 3. All IMCs were used at the same dilution as the matching antibody. This panel allowed the characterisation of CD24-CD38- and CD24-CD38int B cell populations, human B1 (CD19+CD7-CD43+CD27+) and IgG expressing B cells. Expanded antibody Panel 3 CD19 PeCy5, anti-human (Biolegend, UK) CD24 APC anti-human (MACS, Miltenyi Biotec, UK) CD38 Pe-Vio77, anti-human (MACS, Miltenyi Biotec, UK) CD7 FITC, anti-human (Biolegend, UK) CD43 APCCY7, anti-human (MACS, Miltenyi Biotec, UK) CD5-VioBlue, anti- human (MACS, Miltenyi Biotec, UK) CD27 PE, anti-human (MACS, Miltenyi Biotec, UK) IgG BV51, anti-human (BD Biosciences, UK) Company and catalogue number Working dilution Isotype Matched Control (IMC) /2 Mouse IgG1- PeCy5 (Biolegend, UK) /5 Mouse IgG1-APC (MACS, Miltenyi Biotec, UK) /1 Mouse IgG2b-PE-Vio77 (MACS, Miltenyi Biotec, UK) /1 FITC Mouse IgG1 (Biolegend, UK) /1 Mouse IgG1 APC-Vio77 (MACS, Miltenyi Biotec, UK) /1 Mouse IgG1-VioBlue (MACS, Miltenyi Biotec, UK) /1 Mouse IgG1-PE (MACS, Miltenyi Biotec, UK) N/A Mouse IgG1-Brilliant Violet 51 (Biolegend, UK) IMC catalogue number
98 LIMCs were isolated from human liver as described in LIMCs were the stained for age-associated B cells using the same process as described in however using a different three colour panel as demonstrated in Table 11 below. Table 11 Antibodies and IMCs used to identify exhausted and age related B cells. All IMCs were used at the same dilution as the matching antibody. This panel allowed the characterisation of age-associated B cells ABC phenotype IgD-CD21-CD23-CD11c+Tbet+CD8hi. Age related B cell panels CD19 PeCy5, anti-human (Biolegend, UK) CD24 APC anti-human (MACS, Miltenyi Biotec, UK) CD38 Pe-Vio77, anti-human (MACS, Miltenyi Biotec, UK) Panel Number Company and catalogue number Working dilution Isotype Matched Control (IMC) All /2 Mouse IgG1- PeCy5 (Biolegend, UK) All /5 Mouse IgG1-APC (MACS, Miltenyi Biotec, UK) All /1 Mouse IgG2b-PE-Vio77 (MACS, Miltenyi Biotec, UK) IMC catalogue number Anti-IgD-APC, human All /1 Mouse IgG1-APC CD27-APC-Vio77, human (MACS, Miltenyi Biotec, UK) Brilliant Violet 421 anti- Tbet antibody (Biolegend, UK) Alexa Fluor 488 antihuman CD11c (Biolegend, UK) CD21 PE, anti-human (BD Biosciences, UK) CD95 FITC, anti-human (Biolegend, UK) CD23 PE, anti-human (Biolegend, UK) CD8 FITC, anti-human (Biolegend, UK) IgE PE, anti-human (Biolegend, UK) All /1 Mouse IgG1-APC-Vio77 (MACS, Miltenyi Biotec, UK) All /1 Mouse IgG1- Brilliant Violet 421 (Biolegend, UK) /1 Mouse IgG1- Alexa Fluor 488 (Biolegend, UK) /2 Mouse IgG1-PE (Biolegend, UK) /1 Mouse IgG1- FITC (Biolegend, UK) /1 Mouse IgG1- PE (Biolegend, UK) /1 Mouse IgG1- FITC (Biolegend, UK) /1 Mouse IgG1- PE (Biolegend, UK)
99 After collecting events on the Dako CyAn flow cytometer, total CD19+ B cells and B cell subpopulations were gated from lymphocytes and single cells as shown in Figure 1A. Following the selection of total CD19+ B cells, specific gating strategies were used to quantify subpopulations of B cells. It was difficult to consolidate the literature when deciding the most appropriate way to phenotypically characterise B cell subsets. The majority of B cell subpopulations described in this project were defined according to the surface markers described in Van Zelm, 27 and Allman et al, 28. However, specific studies were used to investigate more recently defined human B cell subpopulations such as human B-1 cells, double negative memory and human MZ B cells (155, 195, 386).
100 Non-switched memory (natural effector/mz) B cells and naïve B cells have been described as both CD38- and CD38+ populations (48, 93, 138). Therefore, to begin defining naïve and natural effector B cells, the CD38- to CD38+ population was selected, after which Naïve and natural effector populations were differentiated according to IgD+CD27-CD77- and IgD+CD27+IgM+ (138, 144) (154) expression respectively (Figure 12). 6K SS Lin: SS 4K 2K CD38 IgD IgD CD # Cells % of Max CD CD IgM Figure 12 Gating strategy of CD19+CD38+IgD+CD27- naive and CD19+CD38+IgD+CD27+ natural effector (non-switched memory) B cells. Cells are first gated as in Fig. 6A, to include CD19+ B cells, then gated on CD38- to CD38+ population, followed by the use of IgD and CD27 antigens to identify naïve and natural effector (non-switched memory) cells. All final percentages were expressed as a percentage of total CD19+ B cells.
. 6K 55.9 47.")
101 Switched memory B cells are most commonly described in the literature as CD19+CD38-CD27+IgD- (112) (138, 193). To begin quantifying switched memory B cells, CD38lo/- cells were first selected. From this population CD27+IgD- cells were subsequently gated to reveal the switched memory B cell subset percentage (Figure 13). 6K SS Lin: SS 4K 2K IgD CD CD27 Figure 13 Flow plots demonstrating the gating strategy of CD19+CD38- CD27+IgD- switched memory B cells. Cells are first gated as in Fig. 6A, to include CD19+ B cells, then gated on CD38-/lo population, followed by the IgD-CD27+ population. All final percentages were expressed as a percentage of total CD19+ B cells.
. 74.6 1.")
102 Plasmablast and Plasma cells are identified as CD19+CD27hiCD38hi cells with plasma cells additionally expressing CD138 also known as syndecan-1 (138, 15, 387). Firstly, B cells, which were CD38hi CD27hi, were gated. CD138 was then used as a marker to separate this gated population into plasmablasts and plasma cells (Figure 14) CD CD CD CD CD CD138 Figure 14 - Gating strategy of CD19+CD38hiCD138- plasmablasts and CD19+CD38hiCD138+ plasma cells. Cells are first gated as in Fig. 6A, to include CD19+ B cells, then gated on CD38hi population, followed by the use of CD138 antigen to identify plasma cells from plasma blasts. All final percentages were expressed as a percentage of total CD19+ B cells.
103 B-1 cells, originally discovered in mice, derived from a distinct B cell lineage which differs functionally and anatomically from B-2 cells. Findings from a study by Griffin et al. 211 identified a phenotype of human B-1-type cells based on sorting B cells according to their fundamental B-1 cell functions, including tonic intracellular signaling, T cell stimulation and most importantly, spontaneous IgM secretion (386). In humans, B-1-type cells were defined by this study as CD2+CD27+CD43+CD7- (386). I adopted the same gating strategy as this study to identify B1-type cells, however replaced CD2 staining for CD19 to preserve consistency when identifying other B cell subsets. After selecting CD19+ B cells, the CD7- population was selected, followed by the selection of the CD43 and CD27 double positive populations (Figure 15) # Cells 1 CD CD CD43 Figure 15 - Gating strategy of CD19+CD7-CD27+CD43+ human B-1-type cells. Cells are first gated as in Fig. 6A, to include CD19+ B cells, then gated on CD7- population, followed by the use of CD27 and CD43 antigens to identify double positive B-1-type cells in humans. All final percentages were expressed as a percentage of total CD19+ B cells.
. Literature states that GC dark zones are rich in proliferating centroblasts, whereas centrocytes in the light zone are CD38+IgD- CD77- (138, 388).")
104 CD77 was used as a primary marker in identifying the presence of centroblasts and centrocytes in hepatic tertiary lymphoid structures followed by the quantification of these subsets (138, 144, 388, 389). Literature states that GC dark zones are rich in proliferating centroblasts, whereas centrocytes in the light zone are CD38+IgD- CD77- (138, 388). Consequently, centroblasts within the hepatic B cell compartment from liver explants were classified as CD19+CD77+ cells. In order to investigate centrocytes, CD19+CD77- B cell population was selected, followed by a CD38+IgDpopulation (Figure 16). 6K 12.1 SS Lin: SS 4K 2K CD77 6K SS Lin: SS 4K 2K CD CD IgD Figure 16 - Gating strategy of CD19+CD77+ centroblasts and CD19+CD77- CD38hiIgD- centrocytes. Cells are first gated as in Fig. 6A, to include CD19+ B cells, then gated on CD77- or CD77+ population accordingly. Following selection of the CD77- population, centrocytes were as CD38hiIgD- B cells. All final percentages were expressed as a percentage of total CD19+ B cells.
.")
..79 9.")
105 Transitional B cells represent a population which has not yet fully matured from immature BM lineage cells to mature naïve B cells (45). They are identified as being CD38hiCD24hi B cells which produce IL-1, therefore possess a regulatory phenotype (45, 39). In mice, Breg cells (B1s) are identified as CD5+CD1dhi populations, and this gating strategy has also been used to identify a population of human Bregs (14, 93, 163). Both Transitional and human B1s were gated from CD19+ B cells using CD5+CD1dhi and CD38hiCD24hi gates respectively (Figure 17) CD1d 1 2 CD CD CD38 Figure 17 - Gating strategy of B1 cells (left) and Transitional Bregs (right). Cells are first gated as in Fig. 6A, to include CD19+ B cells. B1 cells are gated as CD1dhiCD5+ B cells. Transitional Bregs are gated as CD38hiCD24+ B cells. All final percentages were expressed as a percentage of total CD19+ B cells.
106 2.4. SPECIFIC TECHNIQUES Consented lymph nodes located within the mesentery of donor livers were weighed and finely macerated using scalpels on a petri dish. The macerated tissue was placed in a GentleMacs C tube (Miltenyi Biotec, UK ) with 1ml RPMI (Supplemented with 1% FBS +1%PSG+1%NEAA+1%L-Glutamine). The C tube was placed in the gentlemacs tissue dissociator (Miltenyi Biotec, UK ) on setting spleen_1. The lymph node-rpmi solution was then poured through a fine mesh beaker and washed through with sterile PBS. Filtrates were distributed into 5ml tubes (Corning incorporated, UK) prior to centrifugation for 5 minutes at 75g. Pellets were pooled, washed and centrifuged several times until one 5ml tube remained. This final 5ml tube was washed once more and centrifuged for a further 5 minutes at 75g. The supernatant was disposed of and the pellet resuspended completely in >3ml PBS prior to being layered on 2ml of lympholyte cell separation media (Cedarlane, UK). This was centrifuged at 7g for 2 minutes with no brake. The mononuclear cell buffy coat layer was harvested and washed once with PBS prior to being resuspended in 1ml of FACS buffer (1% FBS diluted with sterile PBS) and counted using trypan blue (Sigma-Aldrich, UK).
107 BECs, HSEC and fibroblasts isolated from explanted diseased livers were cultured on rat-tail collagen (Sigma, UK) coated 24-well plates and incubated at 37 C in the relevant media (See Table 12) until confluent. LX2 cells (a hepatic myofibroblast cell line) were also seeded on a 24-well plate and incubated until confluent. PBMCs were isolated from healthy human blood on a lympholyte gradient. The PBMCs were then washed in PBS on a slow spin (2g, acc 7, brake 1 for 1 minutes) to deplete platelets, and were then resuspended in BEC/HSEC/fibroblast/LX2 cell media, at a concentration of 2x1 6 PBMCs/ml. 1ml of PBMCs were co-cultured with liver stromal cell lines for 1 hour and 24 hours, after which they were harvested and stained for CD19, CD38 and CD24 (See Table 6). Ingredients of media used to culture various liver cell lines / primary cells These cell lines were generated in house by Gill Muirhead. Cell line / Liver stromal cells LX2 cells HSEC Culture medium DMEM (Gibco, UK) +2% FBS (Gibco, UK) +1% Penicillin/Streptomycin (Gibco, UK) 12ml Human Endothelial Serum Free Media (Gibco, , UK) +2ml human serum (HD Supplies, CS 3, UK) +2μl HGF at 1μg/ml (Peprotech, UK) +2μl VEGF at 1μg/ml (Peprotech, UK). BEC 9ml Hams F12 media (Sigma, UK) +9ml DMEM +2ml human serum +2μl HGF at 1μg/ml (Peprotech, UK) +2μl EGF at 1μg/ml (Peprotech, UK) + 2ml cholera toxin (Sigma, UK, C852) at 1μg/ml +2ml Hydrocortisone (QE pharmacy) at 2μg/ml +248μl Insulin (QE Pharmacy) +2ml of.2m Penicillin/Streptomycin +2ml Tri-ido-thyronine (T3 Sigma T5516) Fibroblasts DMEM +2% FBS +1% Penicillin/Streptomycin +1% NEAA +1% L-Glutamine
108 The purpose of this procedure was to assess whether co-culture with liver stromal cells induced downregulation of CD24 on PBMCs compared to controls at H, 1 hour and 24 hours in media alone. Stromal cells were also stained for P-selectin (CD24 ligand), to detect whether any CD24 downmodulation may be due to a ligand specific mechanism. All samples were then fixed and data was collected using the Cyan flow cytometer (CyAn ADP Analyser, Beckman Coulter Inc., UK). Healthy human blood was layered on lympholyte and left to spin for 2 minutes, acceleration 9, brake at 7g. The PBMCs were harvested, counted and resuspended at a concentration of 1.5x1 6 /1μl using RPMI. 1μl of PBMCs were added into the appropriate number of wells in two round bottom 96-well plates were labeled (1 hour and 24 hours). The plate was centrifuged for 5 minutes, acceleration 9 brake at 75g, and the media was flicked away to leave the pellet. Cytokines (Peprotech, UK) were diluted in RPMI+1% FBS +1%PSG+1%NEAA+1%L- Glutamine (See Table 13), and each relevant cytokine was used to resuspend the PBMC pellets. The PBMCs were incubated for 1 hour and 24 hours respectively before being stained at room temperature in the dark for 2 minutes for CD19, CD38 and CD24 (Concentrations as in Table 8). These samples were fixed and data was collected using the CyAn flow cytometer (CyAn ADP Analyser, Beckman Coulter Inc., UK), to assess whether different cytokines induced downmodulation of CD24 on B cells individually and in combination with other cytokines.
109 used individually and in combination (pro-inflammatory & antiinflammatory), to assess whether cytokines which were present in the liver cause CD24 downmodulation. All Cytokines were obtained from Peprotech, UK. Cytokine Dilution Catalogue Final Concentration No. IFN-γ 1/ ng/ml TNF-α 1/1 3-1A 1 ng/ml Mixture TNF α & IFN γ 1/1 1 ng/ml IL-1β 1/1 2-1B 1 ng/ml IL-6 1/ ng/ml IL-2 1/ ng/ml TGFβ1 1/ ng/ml IL-1 1/ ng/ml Proinflam mix: IL-6, IL-2, IL-1β, TNF-α & IFN-γ Anti-inflamm mix: TGFβ & IL-1 An assay was developed to assess whether CD24 downmodulation on hepatic B cells was due to internalization (See Table 14 below). LIMCs were isolated from the liver as described in and 7x1 6 LIMCs were used in this experiment. 1x1 6 LIMCs were left unstained, 1x1 6 LIMCs were surface stained for CD19, CD24 and CD38 and 1x1 6 LIMCs were surface stained for the corresponding isotype matched controls (See and Table 8). In parallel 2x1 6 LIMCs were surface stained for CD19 and CD38 alone and a further 2x1 6 LIMCs were surface stained with the corresponding isotype matched controls (Table 8). All seven samples were fixed in 1μl 1% PFA (Sigma-Aldrich, UK) for 15 minutes. Samples 1 3 were washed, resuspended in 2μl PBS and placed in the fridge. Samples 4 and 5 were resuspended in 15μl.1% saponin and
110 samples 6 and 7 remained in fixing buffer. All remaining samples were incubated for 2 minutes at room temperature. Following incubation samples were washed and 4 and 5 were resuspended in 1μl CD24 antibody and 1μl IgG1 APC diluted in saponin respectively (See Table 8). Samples 6 and 7 were resuspended in 1μl CD24 antibody and 1μl IgG1 APC diluted in FACS buffer respectively. All samples were incubated for 2 minutes at room temperature before being washed in PBS and resuspended in 3μl PBS (See Table 14 below for clarity on all seven samples and their respective treatments). Samples were then run through the Dako Cyan to assess what percentage of CD24 was downmodulated from the surface compared to the percentage of CD24 which was present intracellularly. Samples involved in CD24 internalisation assay and their respective surface and intracellular stains. All antibodies and dilutions were used as stated in Table 6. Sample number Sample Name Surface stain Intracellular Stain 1 Unstained LIMCs None None 2 Surface Stained only CD19-pecy5, None CD38-pecy7, CD24-APC 3 Surface stained IMC Mouse IgG1- PeCy5 Mouse IgG1- APC Mouse IgG2B- PE VIO77 None 4 Surface and intracellular (Fix & perm) 5 Surface and intracellular IMC (Fix & perm) 6 Surface and intracellular (Fix NO perm) 7 Surface and intracellular IMC (Fix NO perm) CD19-pecy5, CD38-pecy7, Mouse IgG1- PeCy5 Mouse IgG2B- PE VIO77 CD19-pecy5, CD38-pecy7, Mouse IgG1- PeCy5 Mouse IgG2B- PE VIO77 CD24-APC in saponin Mouse IgG1- APC In saponin CD24-APC in FACs buffer Mouse IgG1- APC In FACs buffer
111 In order to understand whether CD24- hepatic B cells were pro- inflammatory or antiinflammatory, an assay was developed to stimulate hepatic B cells and assess production of cytokine such as IFN-γ, TNF-α, IL-6 and IL-1 via intracellular cytokine staining. LIMCs were isolated from explanted human livers as described in before being stimulated for 5 hours and 24 hours in CpG (Invivogen, ODN 26 (DN 799) used at 15.4μg/ml), PMA (Sigma Aldrich P1585, used at 5ng/ml) and Ionomycin (Sigma Aldrich I9657, used at 1μM) along with Brefeldin A (Sigma Aldrich B7651, used at 1μg/ml) all diluted in RPMI +1%FBS+1% GPS and plated in wells of a 96-well Falcon tissue culture plate (Fisher Scientific, B). Controls included supplemented RPMI alone as well as CpG control (Invivogen, ODN 26 Control (ODN2137) and were also incubated with LIMCs in a 96-well plate for 5 and 24 hours. Following stimulation, Cells were washed in 1ml FACs buffer, centrifuged and stained for surface CD19, CD24 and CD38 as described in See Table 8. After staining, the FoxP3/Transcription Factor Staining Buffer Set (ebioscience, -5523) was used to fix LIMCs following surface staining by mixing 2ml of fix/perm concentrate (ebioscience, -5123) with 6ml of fix/perm diluent (ebioscience, ), after which 5μl of fix buffer was added per sample, then left to incubate in the fridge for 3 minutes. The permeabilization buffer 1X (ebioscience, -8333) was made up to 1x using ddh 2, and samples were washed in 2ml PBS and resuspended in 1ml of 1X permeabilization buffer prior to being immediately centrifuged again (75g, acc 9, brake 9, 5 minutes). 1μl cytokine antibody cocktails were added at their respective dilutions in 1x Permeabilisation buffer (Refer
112 to Table 15) to LIMC samples and left to incubate at room temperature for 3 minutes in the dark. They were washed in 5μl Permeabilization buffer and resuspended in PBS. Data was collected using the Dako CyAN. Table 15 Antibodies used to form intracellular cytokine panel. This panel was used to define which hepatic CD24- B cells produced cytokines and whether this cytokine profile differed to CD24+ B cells. IMCs are used at the same concentration as their corresponding antibodies. All antibodies were diluted using the permeabilisation buffer as part of the FoxP3/ Transcription Factor Staining Buffer Set (ebioscience, -5523) Intracellular Cytokine antibody panel TNF-α APC/Cy7 (Biolegend, UK) IL-1 BV421 (Biolegend, UK) Catalogue number Working dilution Isotype Matched Control (IMC) /1 Mouse IgG1- APC/Cy7 (Biolegend, UK) /1 Rat IgG1 BV421 (Biolegend, UK) IMC catalogue number IL-6 PE (Biolegend, UK) IFNγ FITC (Biolegend, UK) /1 Rat IgG1 PE (Biolegend, UK) /1 Mouse IgG1 FITC (Biolegend, UK) Later experiments used additional TLR and BCR stimuli plus unstimulated cells to assess the effect of stimulation on B cell and B cell subset cytokine production using the same procedure outlined above. Cells were surface stained for CD19, CD38 and CD24 and intracellular stained for IL-6, IL-1, TNF-α and IFN-γ. Stimuli types and concentrations are outlined in detail in Table 16 below.
113 Table 16 Combinations of stimuli and their working concentrations, used to induce cytokine production from hepatic B cells / various hepatic B cell subsets. All stimuli (including unstimulated sample 1) included use of Brefeldin A at 1μg/ml (Sigma Aldrich B7651), PMA 5ng/ml (Sigma Aldrich P1585) and Ionomycin 1μM (Sigma Aldrich I9657) Stimulation Stimulations Working Company number concentration 1 Brefeldin 1μg/ml Sigma Aldrich B7651 (Unstimulated) 2 CpG (TLR9) 15.4μg/ml Invivogen, UK #tlrl-26 3 TLR7/8 (R848) 1μg/ml Invivogen, UK #tlrl-r848 4 TLR4 (LPS) 1μg/ml Invivogen, UK #tlrl-eklps 5 RP15 1μg/ml Biolegend, UK CD4 IgM/IgG 1μg/ml 1μg/ml Biolegend, UK, ebioscience, UK # CD4 IgM/IgG LPS 8 CD4 IgM/IgG RP15 9 CD4 IgM/IgG R848 1 CD4 IgM/IgG CpG 11 R848 IFN-γ 1 ng/ml Peprotech, UK, CD4 IgM/IgG R848 IFN-γ 13 R848 Il-21 1ng/ml Biolegend, UK, # CD4 IgM/IgG R848 Il-21
114 Ki67 staining of LIMCs was performed in order to assess whether CD24- B cells proliferated more or less in comparison to CD24+ B cell subsets, therefore allowing further functional characterization of CD24- hepatic B cells. LIMCs were isolated from end stage diseased liver explants as described in before being stimulated with PMA, ionomycin and CpG with brefeldin A as described in Following stimulation, LIMCs were surface stained for CD19, CD24 and CD38 and their matching isotype controls as described in Table 8. After staining, the FoxP3/Transcription Factor Staining Buffer Set was used to fix and permeabilise LIMCs using the same procedure as in Intracellular staining this time was with Ki67 (Biolegend, Pacific Blue, 35512) (4/1) and its isotype matched control (2/1) (Biolegend, Mouse IgG1, Pacific Blue, 4151). In order to investigate whether activated B cells were more susceptible to losing CD24, PBMCs isolated from patient chronic diseased livers were stained at Day to assess CD19, CD38 and CD24 surface expression (as described in ), as well as the naïve and memory B cell profiles within CD24- B cell populations using IgD and CD27. The remaining LIMCs were co-cultured in DMEM (Supplemented with 1% FBS +1%PSG+1%NEAA+1%L-Glutamine) (Gibco Life Technologies, UK) with anti-cd4 (Biolegend, UK, 33434) and IgM/IgG (anti-bcr) (ebioscience, UK # ) both at 1μg/ml. This co-culture was left to incubate for 5 days at 37 C, before the blasts were harvested, washed, and stained for B cell panel 1 and corresponding isotype matched controls (as described in and Table 8).
115 Following staining, samples were run through the Dako CyAn and analysed via FlowJo software LOCALISATION OF B CELLS IN HEPATIC DISEASE USING IMMUNOHISTOCHEMISTRY Immunohistochemistry (IHC) was used to detect the location of various B cell subsets in end stage chronic liver disease formalin-fixed sections. All end-stage liver disease samples were preserved in a fixative known as formalin. This formal saline solution preserved the tissue and its constituents by cross-linking hydroxyl (OH) groups with proteins in the tissue. Each sample was then embedded in paraffin wax which hardened each sample, allowing it to be sliced and placed onto ice to harden further. Each tissue section was then sliced further using a microtome (Pfm Rotary 33, pfmmedical, 33) into 3μm sections. Tissue sections were then subsequently left floating in a water bath set at 3 C to allow the paraffin wax to expand therefore eliminating any creases in the tissue. Glass slides were used to collect individual sections, which were stored at 6 C for one hour to allow tissue to adhere sufficiently before proceeding with immunohistochemical stains. The reagents and antibodies used for the duration of IHC staining is shown in Table 17 and 18 below respectively.
116 Table 17 - Reagents used for the duration of all immunohistochemical techniques. All respective manufacturers and catalogue numbers are also displayed Reagent Manufacturer Catalogue Number High ph Antigen Unmasking Solution Vector H-331 Envision FLEX Wash Buffer (2X) (TBS) Dako SEA-134-A Casein (1X Solution) Vector SP-52 Dako REAL Peroxidase Blocking Solution Dako S223 ImmPRESS Bloxall Blocking Solution Vector ZA52 ImmPACT DAB Chromagen Vector ZA325 Mayer s Haematoxylin Pioneer Research Chemicals Ltd PRC/R/42 Absolute Ethanol AnalaR NORMAPUR VWR Chemicals Xylene Pioneer Research Chemicals Ltd PRC/R/21 Industrial Denatured Alcohol (IDA) 99% Pioneer Research Chemicals Ltd PRC/R/11
117 ImmPact NovaRED Vector SK-485 Mounting Media DPX CellPath SEA-134-A DAB Peroxidase (HRP) Substrate Kit (with Nickel), 3,3 - diaminobenzidine Vector SK-41 ImmEdge Hydrophobic Barrier Pen (Wax Pen) Vector H-4 ImmPRESS -AP Anti- Mouse IgG (alkaline phosphatase) Polymer Detection Kit StayGreen/AP substrate (Alcohol and Xylene Substitute Compatible) ClariTech XTF Mounting medium Vector Abcam CellPath MP-542 Ab SEA-44-A ClariTech XTF Clearing Agent CellPath EBG-XXXX-A
118 Table 18 - Antibodies and isotype matched controls used for the duration of all immunohistochemical techniques. All respective manufacturers and catalogue numbers are also displayed. Antibody Manufacturer Catalogue Number Working Concentration (mg/ml) Monoclonal Vector VPRM15 Rabbit CD79α 2.5x1-3 Clone SP18 Monoclonal Mouse Anti- Human CD19 Clone LE-CD19 Dako M7296 Single: 4.15x1-4 Double: 3.32x1-3 Monoclonal Mouse Anti- Human CD24 Abcam ab x1-2 Clone 8.B.76 Mouse Anti- Human CD62P / P- Selectin Antibody (AK-6) ThermoFisher Scientific MA x1-2 Monoclonal Mouse Anti- Human Ki-67 Dako M x1-3 Clone MIB-1 Monoclonal Mouse Anti- Human CD31 Dako M823 2x1-2 Clone JC7A FDC Clone CNA.42 Monoclonal Mouse Anti-Human Follicular Dendritic Cell M x1-3 Mouse IgG1 Isotype Control Cell Signalling Technology x1-2 Clone G3A1
119 Rabbit IgG1 Isotype Control Cell Signalling Technology x1-3 Clone DA1E Amplifier Antibody Anti- Mouse IgG Vector ZA37 N/A ImmPRESS Universal peroxidase reagent kit (Anti- Mouse/ Rabbit) Vector MP-75 N/A Amplifier Antibody Anti- Rabbit IgG Vector N/A ImmPRESS Excel Amplified HRP Polymer Staining Kit (Anti-Mouse IgG) ImmPRESS Excel Amplified HRP Polymer Staining Kit (Anti-Rabbit IgG) Monoclonal Mouse Anti- Human CD2 Clone L26 Polyclonal Rabbit Anti-Human CD3 Monoclonal Mouse Antihuman BCL-2 Clone 124 Vector MP-762 N/A Vector MP-761 N/A Impath Dako A452 3 Dako M
120 All sections were prepared in the same way before being stained using specific techniques, which were previously optimized. Slides were labeled with the date and placed in a slide rack, then placed into 3 consecutive xylene baths to remove paraffin wax from the sample slides. Next, slides were exposed to 3 industrial denatured alcohol baths for 3 minutes each to remove excess xylene residue. In order to rehydrate the samples, slides were placed into water. 1ml of High ph Antigen Unmasking solution was placed into a plastic bucket with 1ml of ddh2, and heated in the microwave for 1 minutes on high power. Slides were transferred into the preheated solution and placed back in the microwave for a further 2 minutes on high power, which was followed by a 1 minute cooling incubation. This step was performed in order to expose antigens prior to antibody staining. Slides were transferred into the dehumidifier box where wax pen was used to enclose the tissue sample. Slides were then washed in Tris buffered saline, ph7.6 (TBS) for 5 minutes before being ready to immunostain. In order to investigate the localization of liver-enriched CD19+CD24- B cells, double stains were performed on sections of liver from various end-stage hepatic diseases. All the reagents used are listed in Table 17 and 18. Following preparation as described in , 2 drops of Bloxall blocking solution was added to each slide and incubated for 1 minutes. Samples were washed in TBS for 5 minutes, followed by a 1 minute incubation with 2% casein (diluted from a X1 solution). Following incubation, CD24 primary antibody was prepared to a concentration of 5 x 1-2 mg/ml
121 in PBS and 1μl was applied to each slide before being left for a 3 minute incubation. PBS diluent ensured antibody stabilization and ensured full coverage of the tissue section. Samples were washed twice in TBS for 5 minutes, before 2 drops of Amplifier Antibody (secondary antibody) was applied to each slide for 15 minutes, which increases sensitivity and specificity of antibody detection. Slides were then washed in TBS again for 5 minutes, following which ImmPRESS Excel Reagent (tertiary antibody) was applied and allowed to incubate for 3 minutes. The tertiary antibody is coupled to horseradish peroxidase micropolymers which binds to the secondary Amplifier Antibody. Another two 5 minute TBS washes were conducted to wash away unbound secondary antibody and to disrupt weak interactions to non-specific sites. ImmPACT DAB chromogen dye was then produced following the manufacturers guidelines, with the addition of nickel and applied to each slide for 5 minutes. The slides were again washed twice in TBS for 5 minutes each time, before being incubated with the 2% casein solution for 1 minutes. The second primary antibody (anti-cd79α) was then prepared to a concentration of 2.5 x 1-3 mg/ml, and 1μl was applied for 1 hour. Subsequently, sample slides were washed with TBS for 5 minutes, followed by the addition of Amplifier Antibody for a further 15 minutes. The slides were again washed in TBS for 5 minutes, after which ImmPRESS Excel Reagent was applied and allowed to incubate for 3 minutes. Unbound secondary antibody was again washed off with two 5 minute TBS washes. ImmPACT NovaRED chromagen dye was prepared following manufacturers guidelines and applied to each slide for a further 5 minutes. The slides were again washed in TBS for 5 minutes, before being dismounted from the sequenza and placed in a water filled coplin jar. The process was finalised as stated in section
122 α Triple staining was performed using the same slide preparation procedure as described in 2.5.1, with all reagents used listed in Table 17 and 18. Double staining to locate CD24- B cells was performed as in , however on this occasion both casein blocks were performed for 5 minutes, and primary antibodies were incubated for 3 minutes. After the ImmPACT NovaRED chromagen addition of the double stain, a 5 minute TBS wash was performed, followed by a 5 minute casein block. The third primary antibody (Ki67/CD31/P-selectin) was added to the slides at a dilution specified in Table 18. Subsequently, sample slides were washed with TBS for 5 minutes, followed by the 1μl addition of ImmPRESS-AP Anti-Mouse IgG (alkaline phosphatase) secondary antibody for a further 3 minutes. Another two 5 minute TBS washes were conducted to wash away unbound secondary antibody. StayGreen Alkaline Phosphatase chromagen was then prepared and used according to the manufacturers instructions and applied to sample slides for 2 minutes. To finalise the triple immunostaining, slides were subjected to rapid dehydration in absolute ethanol twice for 3 seconds. Slides were then exposed to CellPath ClariTech XTF Clearing Agent for 5 minutes before being mounted using CellPath ClariTech XTF Mounting medium. These sections were left to dry overnight before being scanned via the Zeiss Axio Scanner and analysed via the Zen Blue software.
123 B cell aggregates were categorized according to their surface expression of surface markers into three groups: Lymphoid aggregates, B cell follicles and tertiary lymphoid structures. Lymphoid aggregates can be characterized as an aggregation containing both clustered B cells and a dense T cell population. B cell follicles are rich in B cells however lack substantial evidence to be characterized as a tertiary lymphoid structure. A tertiary lymphoid structure is a follicle, which has supporting evidence of an ongoing GC reaction. Single staining using Bcl-2, CD2 and CD3 primary antibodies were performed (See Table 18) on serial section slides from each patient and compared to staining from other hepatic diseases, as well as positive and negative controls. Interpretation of this staining into the three B cell aggregation phenotypes is demonstrated in Table 19. Table 19 - Surface staining expression for identification of three B cell aggregate phenotypes. +: Moderate staining ++: Strong positive staining - :Absent staining Lymphoid aggregate B cell follicle Tertiary lymphoid structure CD CD Bcl-2 +/++ +/++ -
124 This phenotypic classification was used to quantify the distribution of B cell related aggregates from HCV, PBC, ALD and NASH patient cohorts with n=1 patients for each disease. B cell aggregates were enumerated manually using a clicker counter. Use of graphic labeling prevented recounting of the same aggregates. Numerical data was then converted into a ratio to the surface area of the entire tissue section image. Surface area was calculated using Zen graphics software, where careful free hand drawing was used to outline tissue borders, allowing the subsequent surface area to calculated by Zen. This same quantification method was applied throughout the investigation. Proportions of each B cell aggregate phenotype were calculated as a percentage of total B cell aggregate numbers for each tissue sample, to allow comparisons between and within hepatic diseases. In order to investigate the localization of B cells and tertiary lymphoid structures in the liver, single stains were performed on serial sections of liver tissue from ALD, NASH, PBC and HCV end-stage hepatic disease sections. All the reagents used are listed in Table 17 and 18, following preparation as described in drops of Bloxall blocking solution was added to each slide and incubated for 1 minutes. Samples were washed in TBS for 5 minutes, followed by a 1 minute incubation with 2% casein (diluted from a X1 solution). Following the casein block, 1μl of primary antibody diluted in PBS (CD2/CD3/Bcl-2) (See Table 18) was pipetted onto the tissue and incubated for 1 hour. Samples were subsequently washed twice in TBS for 5 minutes, before 2 drops of secondary Amplifier Antibody was applied to each slide for 15 minutes. Slides were then washed in TBS again for 5 minutes, following
125 which the tertiary antibody, ImmPRESS Excel Reagent, was applied and allowed to incubate for 3 minutes. Another two 5 minute TBS washes were conducted to wash away unbound secondary antibody. Following the washes. ImmPACT DAB EqV was added, which is an equal part mixture of chromagen and buffer. 1μl was added to the tissue for 5 minutes to allow a sufficient staining intensity to develop. The slides were then prepared following this immunostaining to prepare the slides as described in A series of steps need to be performed following immunostaining in order to complete the protocol and finalise the preparation. Following the water wash, Mayer s Haemotoxylin was used to counterstain slides for 3 seconds. This stains the nucleus and acts as an aid for the interpretation of immunostaining. Following this, slides were immersed in cold water for 2 minutes followed by hot water for a further 2 minutes. Absolute ethanol was then added to the slides for 2 seconds before being poured off. This step was repeated again for 4 seconds. Finally, slides were placed into xylene for a further 3 minutes. A resin based mounting media, DPX was then added to the center of a coverslip which was placed over the top of each section to create a final preparation. These sections were left to dry overnight before being scanned via the Zeiss Axio Scanner and analysed using the Zen Blue software.
126 CD2 expression was investigated through DAB staining of paraffin embedded PBC, PSC, ALD, NASH and HCV liver specimens. Following slide scanning, computer assisted quantification of positively stained (brown) cells was performed through use of single colour threshold analysis using ImageJ software. Detection of a single colour on an image permitted the subsequent calculation of the percentage area of the entire image, which the positive stain occupies. This process was repeated across 1 fields of view to yield an average percentage area of CD2+ staining. Dimensions and colour thresholds of the images were kept consistent throughout. The overage percentage area of CD2+ staining in all patients was compared between diseases. Positive controls for primary antibodies were performed in tonsil sections due to this secondary lymphoid organ being enriched in B cells. Isotype-matched controls are negative controls which assist in detection of primary antibody background staining as a result of non-specific interaction between the primary antibody and Fc receptors in the tissue. Isotype control antibodies are matched to the species and antibody class of the primary antibodies used and therefore will stain non-specific Fc receptors for that class to highlight false positive staining. In this project, mouse and rabbit IgG isotype control antibodies were used to stain a representative proportion of tissue samples from the patient cohort. Concentration of isotype antibodies was calculated to match that of primary antibodies.
127 The Zeiss Axio Scanner enabled entire sections of stained tissue to be scanned and photographed under a high power magnification (x2). Using this method meant that the entire tissue could be examined thoroughly in opposed to a small region of interest. After scanning the tissue, it was possible to zoom into the image at an even higher magnification which was essential in analyzing the localization of single cells which were either total B cells (CD79α+) or CD79α+CD24- with a high degree of accuracy.
128 2.6. STATISTICAL ANALYSIS Statistical analysis was conducted using GraphPad Prism software. Non-parametric statistical tests were performed in cases where when assumptions of a normal or Gaussian distribution could not be tested, permitting the calculation of statistical significance without assuming normal distribution of data. This included all B cell phenotype assays including the quantification of total B cells, B cell subsets, cytokine producing B cells and ABCs. It also included CD2+ IHC staining. Due to the donor liver not being completely representative of a healthy liver, significant differences in B cell numbers or percentages were analysed in all experiments across end stage liver diseases using a non-parametric One-way ANOVA test (Kruskal-Wallis test). This is with the exception of where two specific data sets were being compared, in which case an unpaired non-parametric t-test was used with a Mann-Whitney test. Data are shown as the mean ± standard deviation % unless otherwise stated.
129
130 3.1. INTRODUCTION Although data suggests that 5 1% of lymphocytes in the human liver are B cells (5) (391, 392), the exact phenotype and role of intrahepatic B cells and B cell subsets still remains to be thoroughly elucidated. The significance of human liver B cells in the presence and absence of hepatic disease is so far uncharted, however, B cells in mice have been found to contribute to liver inflammation and fibrosis. B cell depletion has been found to effectively promote the remission of liver inflammation in a mouse model of type 2 autoimmune hepatitis (58). Furthermore, depletion of B cells in a mouse model of CCl 4 -induced liver injury demonstrated significantly reduced collagen deposition in comparison to non-b cell depleted mice suffering from hepatic fibrosis over a 6-week period (282). Further findings demonstrated that the potential B cell contribution to fibrosis is antibody and T cell-independent, causing further speculation that other factors such as cytokines could be involved (282). However, no studies since have supported these results. Another mouse study indicated that HSCs initiate an immune regulatory role by influencing B cells to become pro-fibrogenic via retinoic acid signaling (393). CD4 induced B cell activation has also been identified as key in promoting a necro-inflammatory response in murine livers through IFN-γ and TNF-α dependent mechanisms (394). In recent years various studies have implicated B cells in the pathogeneses and subsequent development of specific human chronic liver diseases. A recent patient study showed that quantities of intrahepatic CD2+ B cells positively correlated with ALT, AST, ALP and GGT levels, as well as with increased liver inflammatory grades
131 (287). This emphasised that B cells may play a pathological role in hepatic inflammation across chronic liver diseases. However, the proportion of B cells found in liver inflammation were found to bear no association with increased liver fibrosis (287). Other studies have highlighted that B cells play a role in viral hepatitis. Conflicting immunohistochemical findings from another human study, showed a positive correlation between intrahepatic IgD+ B cells and the degree of liver fibrosis in HBV patients (296). This correlation could be explained by B cells producing the profibrotic cytokine IL-6, which may contribute to fibrosis by enhancing HSC differentiation and collagen synthesis In HBV patients (395). Naïve B cells have been shown to take up Hepatitis B core antigen (HBcAg) and present them to T helper cells whilst simultaneously expressing co-stimulatory molecules CD8 and CD86 (395). HBcAg has also been found to promote IgM antibody production by B cells via a T cell-independent mechanism (396, 397). Conversely, clinical studies indicate that B cell depletion via rituximab in HBV infection resulted in latent HBV reactivation in a cohort of patients suffering from B cell lymphoma (398). Disease flares and poor CD8+ T cell responses have been associated with an enriched population of IL-1 producing B cells. It is possible that this correlation causes the suppression of anti-hbv CD4+ T helper cells and CD8+ T cells (399). HCV infection has been found to cause B cell activation and B cell subset bias (4). A risk factor for lymphomas, lymphoproliferative disorders and B cell dysregulation, HCV also has the capacity to infect B cells directly, permitting viral replication within and evasion of antiviral interferon responses (41). The virus enters the B cells through interactions
132 with the HCV E2 envelope protein and B cell CD81, which subsequently leads to hepatocyte transinfection with boosted infectivity (42). B cell participation in autoimmune disease has been evidential. As well as the involvement of B cells in antigen presentation to autoreactive T cells, autoreactive B cells are central to the pathogenesis of PBC through the production of antimitochondrial antibodies (AMAs). Murine study findings have linked high frequencies of plasma cells in portal aggregates with autoimmune inflammatory diseases such as PBC (225, 43). Supporting findings show that genetically, B cell deficient mouse models of autoimmune cholangitis demonstrate reduced biliary cystic changes and hepatic inflammation compared to controls (44). In AIH and PBC patients, B cell depletion with rituximab treatment resulted in improved outcomes (3, 31). One AIH mouse model demonstrated reduced liver inflammation and improved liver function following treatment with a single dose of anti-cd2 antibody (58). As AIH is a primarily T cell-mediated disease, this effect was speculated to be due to the consequential reduction in T cell populations and activation in the liver. Despite previous studies highlighting B cell contributions to autoimmune liver diseases, one study involving B cell depletion via anti-cd79α and anti-cd2 in mice with PBC, produced conflicting results. Depletion of B cells in this study was associated with the release of superoxides (IL-6), TNF-α production, enhanced T cell liver infiltration and disease exacerbation compared to controls (45). Collectively, these murine and human studies indicate that hepatic B cells may play a role across end stage liver disease and may possibly have different characteristics to B cells elsewhere in the body. Establishing whether specific human B cell subsets
133 contribute to, or prevent defined hepatic diseases, could lead to therapeutic targeting of B cells in the future to treat liver disease. I hypothesize that the human liver contains a range of defined B cell subsets, and that distinct disease across liver conditions possess unique B cell signatures reflecting relevant populations in the liver. Chapter objectives. To understand the role of B cells and B cell subsets in chronic liver disease, I designed experiments: 1. To isolate and quantify total B cells and B cell subsets from human livers and compare to the B cell compartment in blood and SLO using flow cytometry. 2. To establish B cell subset bias by quantifying B cell subsets across end stage hepatic disease livers. 3. To investigate and characterize B cell aggregates in the liver using immunohistochemistry.
134 3.2. RESULTS Little is known regarding the human liver B cell subset composition. I first asked whether the B cell subset profile in the liver differed in comparison to blood, as strong differences between liver and blood may further highlight the functional role of B cells in the liver. I aimed to obtain livers from patients suffering from a range of chronic end stage hepatic diseases (See Table 2) from The Queen Elizabeth Hospital Birmingham, and isolate LIMCs. Isolation of LIMCs aided in my investigation on hepatic B cells in vivo, allowing me to stain for B cell subset markers to make quantitative comparisons across chronic liver diseases. Occasionally donor liver tissue was also donated for research purposes. However these tissues were usually rejected for transplant due to the presence of underlying disease aetiologies and normal healthy tissue was only obtained in rare cases of surplus tissue to requirements at the time of transplantation. PBMCs were isolated from matched patient blood on a density gradient using the method outlined in Following PBMC and LIMC isolation from blood and liver respectively, B cells were surface stained for three eight-colour panels of phenotypic markers, to identify and quantify 11 B cell subsets, allowing comparisons of the B cell subset profiles to be made between blood and liver. Obvious differences in B cell profiles between liver diseases and patient blood could highlight biological markers uniquely found on hepatic B cells, aiding in the deployment of new diagnostic measures in the future. Furthermore, identifying whether some B cell subsets are present in liver tissue within certain hepatic diseases and absent in others, or whether some B cell subsets may be enriched or reduced in specific hepatic diseases, would hint towards a possible role of B cells in disease progression or prevention.
135 Table 2 - The main disease aetiologies of liver explants and their respective abbreviations. Explants were obtained and used routinely to isolate B cells in this study at the Centre for Liver Research, University of Birmingham. Abbreviation ALD NASH NAFLD Disease Alcoholic Liver Disease Non-alcoholic Steatohepatitis Non-alcoholic fatty liver disease PBC Primary Biliary Cirrhosis PSC Primary Sclerosing Cholangitis Donor Tissue from rejected donor liver HCC Hepatocellular carcinoma HCV Hepatitis C Virus HBV Hepatitis B Virus Other Genetic disorders (e.g. polycystic liver disease) and enzyme deficiencies (e.g. α1 anti-trypsin.
136 Comparing B cell profiles highlighted differences in the proportions of specific subsets present between the blood and liver (Fig. 18). In particular, double negative memory B cell populations were found to be significantly enriched in the liver compared to matched patient blood, (double negative memory: 27.±14.7%, double negative memory blood: 8.5±5.1%, where p=.8). Conversely, naïve B cell populations were more significantly enriched in the blood compared to in the liver (naïve liver: 38.2±13.8% and naïve blood: 62.±11.1% where p=.3).


137 A % of CD19+ B cells P=.4 P=.8 Blood Blood Liver Liver


 and double negative memory (CD19+IgD-CD27-)")

, plasmablasts (CD19+CD38hiCD27+CD138-), and plasma cells")
, centroblasts (CD19+CD77+) and centrocytes")


138 g B Figure 18 The B cell subset profile in patient blood differs to that of matched liver from chronic end-stage liver disease patients. (A) Subset profiles of naïve (CD19+CD27-IgD+), switched memory (CD19+CD27+IgD-), non-switched memory (CD19+CD27+IgD+) and double negative memory (CD19+IgD-CD27-) B cell populations in matched blood and liver from patients suffering from chronic liver disease. Data is representative of n=7. (B) Subset profile of Transitional/Breg (CD19+CD24hiCD38hi), B1-type (CD19+CD1dhiCD5+), plasmablasts (CD19+CD38hiCD27+CD138-), and plasma cells (CD19+CD38hiCD27+CD138+) where data is representative of n=7, as well as human B1-type (CD19+CD7- CD43+CD27+), centroblasts (CD19+CD77+) and centrocytes (CD19+CD77- CD38+IgD-) where data represents n=4 independent repeats. Data is expressed as a percentage of total CD19+ B cells. Statistical comparison was executed to compare blood and liver groups using multiple t tests correcting for multiple comparisons using the Holm-Sidak method in (A) and non-parametric Mann-Whitney t tests in (B). Significant differences between blood and liver are highlighted by the p values on the graphs, where P<.5.
139 After observing that some B cell subset profiles differed in proportions between matched blood and liver samples, I then sought to identify whether blood and liver B cells were qualitatively different. To address this question I investigated surface immunoglobulin expression in memory B cells. Memory B cells (CD19+CD27+IgD-) contained different isotype distributions in matched patient blood and liver (Fig.19). For this approach, LIMCs and PBMCs isolated from the liver and blood respectively were surface stained for the B cell marker CD19, along with memory markers (CD27+IgD-) and isotype markers (IgA/IgG/IgM). Data was collected by running stained B cells through the flow cytometer, after which it was analysed using FlowJo software. All isotype staining was expressed as a percentage of memory B cells. The percentage of IgA + memory B cells was significantly enriched in the blood compared to the matched liver samples (blood: 46.8±16.5% and liver: 1.8±4.3% where p=.5), and that the liver contained a significantly higher percentage of IgG + memory B cells compared to matched blood (liver: 16.3±1.4% and blood: 2.±1.3% where p=.3). This demonstrated that the memory B cell compartment in liver differed to that of blood, and further highlighted the overall difference in the B cell compartment between the two.
140 % of CD19+CD27+IgD- Memory B cells IgM P=.3 IgG P=.5 Figure 19 Switched memory B cells in liver have a different isotype distribution to those in blood. Percentages (%) of IgA+, IgG+, and IgM+ CD19+IgD-CD27+ memory B cell populations in the total CD19+ subset of matched blood and chronic diseased liver patient samples. Data is representative as n=4, except in the case of IgM where n=7. Statistical comparison was executed to compare blood and liver groups using multiple t tests correcting for multiple comparisons using the Holm-Sidak method. Significant differences between blood and liver are highlighted where p<.5. IgA Blood Liver
141 In order to further understand the human hepatic B cell compartment, hepatic B cell subsets were compared to those present in the blood and secondary lymphoid organs (SLOs) such as hepatic mesenteric lymph nodes. To perform this investigation PBMCs and LIMCs from blood and liver were stained for total B cells, naïve mature B cells (CD19+CD27-IgD+) and memory B cells (CD19+IgD-CD27+) (Fig. 2). Mononuclear cells were extracted from SLOs via mechanical digestion using the GentleMACs as described in prior to being stained using the same technique. Findings from this experiment indicated that the frequencies of CD19+ B cells in the liver were comparable to the total percentage of CD19+ B cells located in the blood (Fig. 2A). However, comparisons in the subset composition of the B cell compartment between blood, liver and secondary lymphoid tissues demonstrated that the subset composition of hepatic B cells (naïve and memory) were qualitatively more similar to SLOs, as both groups contained a higher proportion of memory B cells and a lower proportion of naïve B cells compared to blood (Fig. 2B & C).
142 CD19+ B cells (% of MC) Blood SLO Liver Naive Mature B cells (% of CD19+) E N D Memory B cells (% of CD19+) E N y D Figure 2 The composition of B cells in the liver was more similar to that of secondary lymphoid organs (SLO) compared to human blood. (A) CD19+ B cells as a percentage of total mononuclear cells, (B) percentage of naïve (CD27- IgD+) CD19+ B cells and (C) percentage of memory (CD27+IgD-) CD19+ B cells in Blood, SLO and liver respectively. Blood was represented by healthy donors, haemochromatosis patients and chronic liver disease patients (CLD) where n=4, n=8 and n=16 respectively. Liver was represented by donor livers and CLD patients where n=9 and n=75. Liver and blood samples in this data set are unmatched. Whiskers are representative of min and max values.
143 Following the understanding that the hepatic B cell compartment bears some similarities with B cells in SLOs, the next question was whether the B cell compartment differed between patient livers with various aetiologies. Answering this question could also be pivotal in establishing whether B cells may have a role in specific end stage hepatic diseases. To address this, LIMCs were isolated from various end stage chronic diseased livers and surface stained with a total of 18 surface markers to allow the phenotypic characterization and the subsequent quantification of 11 B cell subsets as in the first figure of this chapter (Fig. 18A & B). PBC liver explants contained a higher number and percentage of total B cells compared to donor livers and end stage liver diseases (Fig. 21A). All other diseases were comparable to donor livers. Results indicated that B cell subsets in liver diseases of various aetiologies were similar in proportions and absolute numbers (Fig 21B & C). This is with the exception of the proportion of naïve mature B cells per gram of tissue, which were significantly higher in PBC liver explants compared to donor livers (PBC: 1365±9419% and donor: 1358±1253% where p=.2) (Fig. 21C).
144 Donor PBC PSC NASH ALD Viral Other % CD19+ B cells Donor PBC PSC NASH ALD Viral Other No. of CD19+ B cells per g of tissue r C C H D l r C C H D l C C H D l Donor PBC PSC NASH ALD Viral Other C Donor PBC PSC NASH ALD Viral Other 1 2 3
145 4 P= C C H D l r C C H D l r C C H D l C C D l r C C H D l r C C Figure 21 B cell subsets are similar in proportions and absolute numbers across chronic liver diseases, with the exception of naïve B cells in PBC. (A) The percentages (%) and the absolute number of total CD19+ B cells across chronic hepatic diseases and (B) The percentages (%) of B cell subsets across Donor, PBC, PSC, NASH, ALD, Viral and Other livers (n=9, 12, 17, 12, 27, 1 and 13 respectively), except for centroblasts, centrocytes and b1-types (n=7, 9, 1, 9, 16, 7 and 6 respectively). (C) The absolute number of B cell subsets across in Donor, PBC, PSC, NASH, ALD, Viral and Other livers (n=8, 9, 13, 9, 19, 9 and 6 respectively), except in the case of centroblasts, centrocytes and b1-types (n=6, 8, 9, 8, 16, 7 and 6 respectively). Error bars represent the mean and standard deviation. A one-way non-parametric ANOVA (Kruskal-Wallis test) was conducted to compare the means across hepatic diseases. Significant differences are displayed where p<.5. Donor PBC PSC NASH ALD Viral Other Donor PBC PSC NASH ALD Viral Other
146 To assess the distribution of B cells within the liver architecture, IHC stains were performed on human liver sections from end stage hepatic disease patients using anti-cd2 (as described in 2.5.) (Fig.22A-G). Use of anti-cd2 resulted in detection of all B cells with the exception of plasmablasts and plasma cells, where the CD2 marker is downmodulated. Following the staining procedure, the sections were scanned and 1 random pictures were taken per field of view. The percentage area of CD2+ DAB stain was calculated before values for each hepatic disease (ALD, NASH, PBC, PSC, HCV) were averaged and plotted (Fig.22G). To confirm the validity of the B cell stains, human tonsil was used as a positive control and isotype matched controls used as negative controls on human liver tissue sections (Fig. 22E&F). Results from B cell IHC quantification corroborated findings from the flow data, demonstrating that total B cells were elevated in PBC (Fig.22G & 22A). IHC staining further highlighted that the proportion of CD2+ B cells in PBC were significantly higher compared to those present in PSC (PBC: 1.72±1.46% and PSC:.2±.18% where p=.14) (Fig. 22G).

, (B) around portal veins (PBC), (C) in lobular areas (HCV) and (D) within")

 CD2+ staining control in human tonsil (F) CD2 isotype matched control (negative")


147 6 p=.14 % Area of CD PBC PSC ALD NASH HCV Figure 22 B cells localize across the liver architecture and are enriched in PBC. IHC staining demonstrating the presence of CD2+ B cells (A) aggregating around bile ducts (PBC), (B) around portal veins (PBC), (C) in lobular areas (HCV) and (D) within the fibrotic septa (HCV). All images with taken at 1x magnification with 44%, 16%, 1%, 15%, 17% and 1% zoom respectively. (E) CD2+ staining control in human tonsil (F) CD2 isotype matched control (negative control) in human PBC liver section (G) The enumeration of total B cells in liver diseases of various aetiologies. CD2+ stains are represented as a percentage (%) of the total area. Patient sample values are additionally plotted with error bars representing the mean and standard deviation, where n=1. All statistics were performed as a oneway non-parametric ANOVA (Kruskal-Wallis test) comparing the mean of each hepatic disease with the mean of every other hepatic disease. Significant differences are displayed on the graphs where p<.5.
148 B cell aggregates have previously been reported and characterised to a great extent in HCV patients, however there are no qualitative or quantitative comparative data across liver diseases. To further investigate the frequency of B cell aggregates in end stage hepatic diseases, IHC stains were performed on liver sections from chronic liver disease patients using CD79α, which is a pan-b cell marker and is associated with the surface BCR. B cell aggregates were quantified in a cohort of n=77 patients comprising of 67 patients with end stage chronic liver disease (ALD, NASH, PBC, PSC, AIH, HCV and HBV) and 1 donor liver samples. This method of quantification is outlined in On average, patients suffering from chronic HCV demonstrated the highest frequency of aggregates per unit area of tissue, followed closely by PBC (Fig. 23B). Statistical comparisons of the data highlighted that PBC liver sections contained a significantly higher frequency of B cell aggregates in comparison to NASH and donor livers (PBC: 3.236e-8±2.98e-8%, NASH: 4.734e-1±1.497e-9% and donor: 3.873e-9±1.68e-8%, where p=.7 and p=.3 respectively), which was also true for HCV livers compared to NASH and donor patients (HCV: 6.653e- 8±5.6e-8% where p=.1 and p=.9 respectively). This data highlighted variation in B cell aggregate frequencies across patients suffering from different end-stage chronic liver diseases.

149 Frequency of B cell aggregates / μm * ** *** *** Donor AIH PBC PSC ALD NASH HBV HCV Figure 23 Proportions of B cell aggregates vary between end stage hepatic diseases. (A) x1 magnification of a HCV liver demonstrating the presence of several B cell aggregates in the liver. CD79α+ B cells were visualised by DAB staining shown in brown and highlighted by the arrowheads. (B) Quantification of B cell aggregates identified by CD79α IHC staining across liver diseases of various aetiologies n=77. Error bars are representative of the standard deviation and mean. Significant differences are represented as P<.5*, P<.1**, P<.1***
150 To investigate the presence of tertiary lymphoid structures beyond autoimmune and viral hepatitis, serial sections from an ALD liver were stained with tertiary lymphoid markers for CD19 (B cells), CNA42 (FDC marker) and a marker of proliferation (Ki67) (Fig. 24). This work was performed by Rebecca Smith (BMedSci) in our laboratory. Results from this stain indicated that certain lymphoid aggregates presented characteristics similar to that of a tertiary lymphoid structure. As well at the entire follicle staining positive for the presence of CD19+ B cells, the presence of FDCs and high endothelial venule-like structures (HEV) were also detected. The positive staining for Ki67 on half of the follicle also demonstrated the presence of proliferation, highlighting a possible light and dark zone within the aggregate.
 in a patient with ALD.")
151 Figure 24 GC-like structure in an Alcoholic Liver Disease (ALD) patient. Immunohistochemical staining of a hepatic follicle with evidence of a GC-like structure (a tertiary lymphoid structure) in a patient with ALD. CD19; B cell marker, FDC: FDC marker; CNA42, Ki67; dark zone proliferation marker. DZ: Dark Zone, LZ: Light Zone. Figure from Rebecca Smith (BMedSci).
152 The phenotypic characterization of B cell aggregates involves categorization into three distinct groups: lymphoid aggregates, B cell follicles and tertiary lymphoid structures. Distinctions between these groups were predominantly defined by three antigens: the B cell antigen CD2, the T cell antigen CD3 and the anti-apoptotic protein Bcl-2 (Fig. 25). Bcl-2 is an anti-apoptotic protein, and their absences is important in the identification of GC-like structures, as GC B cells downregulate the expression of Bcl-2 protein and are therefore more prone to apoptosis in order to eliminate autoreactive and low-affinity B cells (11). Lymphoid aggregates contain a mixed population of T and B cells and consequently are known to present with high levels of CD3+ staining within the aggregate, with low to moderate staining for CD2 and Bcl-2. B cell follicles present with a more dense aggregation of B cells, and contain fewer T cells than a lymphoid aggregate (Fig. 25B). These follicles resemble primary follicles usually located in SLOs, and are rich in CD2 and Bcl-2 positive cells with a low to moderate positivity of CD3 staining, making these structures distinct from GC structures (Fig. 25C). Tertiary lymphoid structures bear close resemblance to organized GC-like structures. Their phenotype can be described as rich in CD2, with moderate to low aggregates of CD3. Unlike in lymphoid aggregates and B cell follicles, GC B cells (tertiary lymphoid structures) lack Bcl-2 expression, which is otherwise located on other B and T cell subsets. Therefore, tertiary lymphoid structures contain a significant proportion of clustered Bcl-2 negative cells. Positive staining for Ki67 represents the presence of proliferation and is therefore also indicative of a GC-like follicle (Fig. 25D).
153 To investigate the distribution of B cell aggregates in end stage chronic liver diseases, phenotypic and quantitative analysis was performed on B cell aggregates in HCV, PBC, ALD and NASH livers (n=1 per disease). The IHC staining system for identifying the three B cell aggregate subgroups (described above) permitted the identification and subsequent quantification of B cell aggregates into lymphoid aggregates, B cell follicles and tertiary lymphoid structures. Percentages of lymphoid aggregates, B cell follicles and tertiary lymphoid structures out of total B cell aggregates were then normalized to surface area prior to investigating and calculating differences in these three aggregates between diseases. Results demonstrated that between liver diseases, lymphoid aggregates in ALD and NASH suffers demonstrated the highest mean percentages of approximately 77% and 73% respectively in comparison to HCV and PBC (55% each) (Fig. 25E). Similarly, the mean percentage scores for the presence of B cell follicles in PBC and HCV were 44% and 42% respectively, in comparison to 22% and 27% respectively in ALD and NASH patients (Fig. 25F). PBC suffers demonstrated the highest mean percentage for tertiary lymphoid structures (4%), compared to ALD (3%), HCV (2%) and NASH (.5%) patients (Fig. 25G). All these differences however, did not present with statistical significance, thereby denoting any obvious similarities between these diseases.
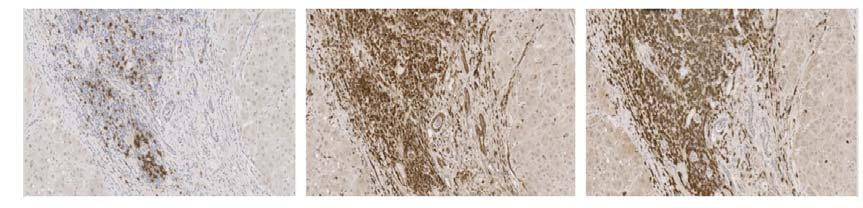
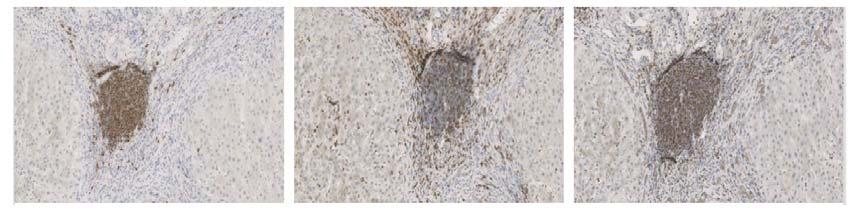
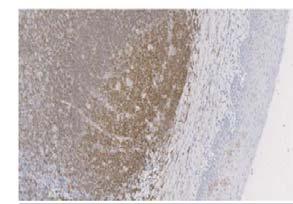
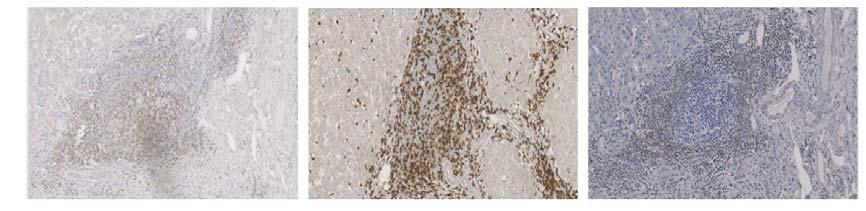
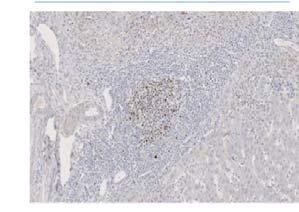
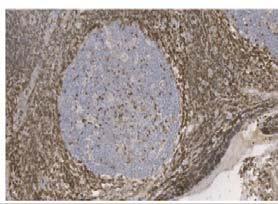
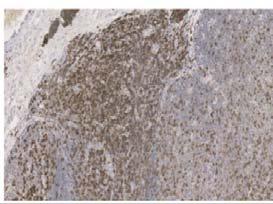
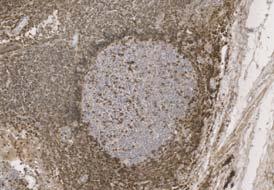
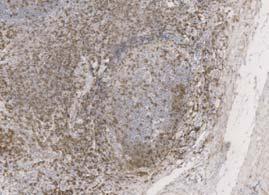
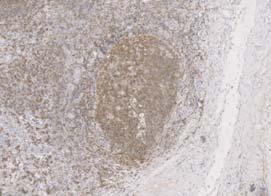
154
155 HCV PBC ALD NASH HCV PBC ALD NASH HCV PBC ALD NASH Figure 25 Lymphoid aggregates, B cell follicles and tertiary lymphoid structures exist in liver. (A) Positive control staining in human tonsil where CD2 staining depicts a germinal center, CD3 staining of a T cell area within a follicle and Bcl-2 staining in extrafollicular areas surrounding a germinal center follicle. Remaining IHC staining highlights examples of (B) lymphoid aggregates, (C) B cell follicles (D) tertiary lymphoid structure through CD2, CD3 and Bcl-2 staining. Each row is representative of the same aggregate from serial sections of a tissue sample from a single patient. Successful Ki-67 staining was demonstrated within the dark zone of a tertiary lymphoid in one patient. Lymphoid aggregates were identified as rich CD3 positivity relative to CD2, with Bcl-2 positivity. B cell follicles were identified as rich CD2 and Bcl-2 positivity relative to moderate or low CD3 positivity. Tertiary lymphoid structures were identified as an aggregate rich in CD2 positivity over a corresponding clustered area of Bcl-2 negativity, whilst CD3 staining may be variable. Images were taken at x5 magnification and scanned from a Zeiss Axio slide scanner. Figure from Bardia Guevel (BMedSci). Percentages (%) of (E) lymphoid aggregate, (F) B cell follicle and (G) tertiary lymphoid structures of total B cell aggregates per m 2 for n=1 of HCV, PBC, ALD and NASH. Error bars represent the mean and standard deviation.
156 3.3. DISCUSSION The B cell compartment in the human liver has never been characterised or quantified in depth. However B cells have actively been found to play a role in hepatic disease, such as in autoimmune mediated diseases like PBC and viral mediated diseases like HCV. This highlights the necessity to investigate the B cell compartment in human liver further, as enrichment of specific B cell subsets in the presence of defined chronic liver disease could be an indicative of B cell mediated pathogenesis or B cell mediated protective responses in the liver. Furthermore, identifying the role of B cells in the liver could highlight a target, which could be manipulated therapeutically in the future to prevent hepatic disease progression. Numerous B cell subtypes have previously been characterized in human peripheral blood. In this chapter, I sought to identify B cell subsets in human blood before confirming whether the same subsets were present in human livers. Formerly, human B cells were characterized in tonsil using the Bm1-Bm5 classification system using CD19, IgD, CD38 and CD27 antigens. These markers were used to identify naïve cells (Bm1: IgD +CD38 ); activated naïve cells (Bm2: IgD+CD38lo); pre-gc cells (Bm2 : IgD+CD38++); GC cells (Bm3-centroblasts), centrocytes: (Bm4-IgD-CD38++); and memory cells (Bm5: IgD-CD38+/ ) (14) (144) (138). More recently, alternative marker combinations have been used to phenotype B cell subsets in human tonsil and blood (139, 46). These include: Bregs (Transitional/B1) (93), switched memory B cells (IgD-CD27+) (47) naïve B cells (IgD+CD27-) (139) and less well described subsets such as marginal zone B cells (non-switched memory) (IgD+CD27+) (195) and human B1-type cells (CD2+CD7-CD43+CD27+) (386). Human B cell characterisation is less well
157 established compared to murine B cell subsets, therefore it is unsurprising that conflicting views exist on how to definitively phenotype B cell subsets in humans. The first part of this chapter involved the consolidation of findings from existing studies, to organise three eight-colour flow cytometry panels to identify over 11 B cell subsets in human peripheral blood. The presence of all 11 B cell subsets were confirmed in peripheral blood, after which the same panels were used to confirm the presence of these B cell subsets in human liver. Direct comparisons were then made in B cell subsets within human peripheral blood vs. human liver using matched patient samples. Data from Figure 18 demonstrates that all B cell subsets located in human peripheral blood were also present in the liver. It is also clear that the profile of these B cell subsets vary between the two, with peripheral blood containing a higher percentage of naïve B cells, and the liver containing a significantly higher percentage of the double negative memory and centroblast B cell compartment. This difference in profile suggests that either B cells home to the liver following circulation (possibly through blood from the gut) where they are activated, or that the liver harbours its own distinct tissue resident memory B cell population. Considering that the liver tissue experiences several thorough washes during LIMC isolation to remove contaminating blood lymphocytes, it is fair to speculate that the latter explanation is more than plausible. In order to further compare the memory B cell compartment in blood and liver, surface isotype staining for IgM, IgG and IgA was performed on memory B cells isolated from matched blood and liver (Figure 19). Unfortunately, due to difficulty obtaining a high yield of PBMCs from precious blood samples, and the lack of space
158 on our B cell panels, I was unable to assess the IgE surface expression on memory B cells at this point. Interestingly, memory B cells were found to have significantly higher surface expression of IgA in peripheral blood compared to matched chronic diseased livers, whereas IgM surface expression was significantly higher on hepatic memory B cells. This result was surprising, as impaired hepatic clearance of circulating IgA immune complexes has previously been reported in liver disease patients, and a high incidence of IgA nephropathy has been previously discovered in patients with liver cirrhosis (48, 49). Furthermore, as IgA is a mucosal antibody, it is rarely found to be enriched in the blood, however has been previously been found to be enriched in human hepatic bile (41). These data show that when assaying memory B cell function from patients with liver disease, data from peripheral blood may be misleading. I set out to establish if the hepatic B cell compartment resembled the frequency and composition of B cells in peripheral blood, or in SLOs (Figure 2). Mononuclear cells isolated from spleen and lymph nodes harvested from the mesentery of donor explants were surface stained for the B cell panel as previously performed on blood and liver. Results showed that liver B cells may be similar in total numbers to blood, but in composition were similar to SLOs, with naïve B cells being reduced in liver and SLOs, and the memory subset being enriched in liver and SLOs compared to blood. These data further implied that the liver may harbor more activated, antigen experienced B cells in comparison to blood and that memory B cells specifically were sequestered or expanded in the liver. Previous studies have described what is now known as the liver graveyard theory. This graveyard theory suggested that the liver was able to exclusively eliminate activated antigen specific CD8+ T cells,
159 programmed to undergo apoptosis (411, 412). In this way, the liver was able to actively contribute to the hepatic tolerance effect. As is the case for CD8+ T cells, it is possible that memory B cells are also sequestered and cleared in the liver via apoptosis, adding further speculation to the liver graveyard theory (411, 413). To elucidate the role of B cells in chronic liver diseases, a recent study investigated the infiltration of B cells in human liver tissues of chronic liver disease patients by immunohistochemistry. They found that chronic liver disease patients with higher inflammatory grades had significantly more CD2+ B cell infiltration in their livers compared to those with lower grades. However, intrahepatic CD2+ B cells were not positively associated with liver fibrosis stages in these patients (287). Considering a diverse spectrum of end stage hepatic disease exists, I also wanted to investigate differences within the B cell compartment between chronic liver disease types. These disease types included dietary injury (ALD, NASH), autoimmune (PBC, PSC), viral (HCV/HCC) and genetic/enzyme deficiencies (other). Whereas the previous study used IHC to enumerate B cells in hepatic disease, I primarily used flow cytometry to elucidate the role of B cells in chronic liver diseases, where results highlighted that an increased quantity of CD19+ B cells existed in PBC compared to other hepatic conditions, although these results were not statistically significant (Fig. 21A). These findings were supported with immunohistochemistry, where quantification of CD2+ stains were performed on AIH, PBC, PSC, NASH, ALD and HCV liver tissue sections, and demonstrated that a significantly higher quantity of CD2+ B cells existed in PBC compared to PSC (p=.14) (Fig. 22G). This result was corroborated by recent data which detected significantly fewer CD2+ B cells surrounding portal tracts and bile ducts in PSC compared to PBC using
160 immunohistochemistry and flow cytometry (286, 287). It is possible that thorough washes performed on liver tissue to remove circulating blood B cells during the LIMC isolation process consequently leads to a loss in hepatic B cells. This would make us unable to always highlight significant differences between hepatic subsets using flow cytometric quantification. I therefore support that histology is a more reliable method to estimate liver B cell quantities in various liver diseases. Furthermore, I was able to score AIH sections by histology, as they were available in our tissue collection, whereas AIH explants were rarely available in our clinic. Immunohistochemical staining of liver tissue sections demonstrated that CD2+ B cells localised to parenchymal and fibrotic areas within the liver architecture, with B cells predominantly localising around portal veins and bile ducts (Fig. 22 A D). Aggregates of B cells around bile ducts and portal veins were frequently observed in HCV and PBC livers (Fig. 23B), an observation which is supported by another recent study by Takahashi et al, (224). This study found that in PBC patients, CD2+ B cells aggregated in a follicle-like fashion around inflamed portal tracts, and where intrahepatic bile ducts were usually located (224). Other studies characterising B cell aggregates in the liver however, have been defined best in HCV patients in particular, further supporting that B cell aggregates in the liver may be disease specific ( ). With the exception of mature naïve B cells being enriched in PBC, unlike total B cell numbers, B cell subsets in liver diseases of various aetiologies were similar in proportions and absolute numbers (Fig. 21B). This may be due to the similar hallmarks expressed in all end stage liver diseases, such as fibrosis and cirrhosis of tissue. Excess scar tissue and inflammation could mean that detectable differences
161 in B cell populations in early-mid stage hepatic disease were undetectable in end stage hepatic disease. Alternatively, the excess fibrosis in end stage liver explants may result in difficulty isolating all B cells from liver tissue, resulting in insignificant differences between hepatic diseases when analysing B cell subsets. Research has highlighted a possible role of B cells in PBC, where B cell depletion with Rituximab results in reduced autoantibody production and improved symptoms in PBC patients (3, 417). Furthermore, it is known that liver infiltrating lymphocytes, including CD19+ B cells, are recruited around bile ducts through the constitutive expression of chemokine CXCL12 (stromal cell-derived factor 1 - SDF-1) where they participate in the destruction process of targeted bile ducts through AMA production (224). Our data shows a significant increase in the proportion of naïve mature B cells in PBC compared to donor livers (p =.2). It is possible that these naïve B cells are recruited to the liver as a consequence of the autoimmune inflammatory response, however further investigations would need to be performed in order to determine whether this is the case. It is likely that expansion in subsets yet to be identified and missed by our antigen combination schemes could explain this increase of B cell numbers in PBC patient livers. Given that many characteristics of chronic liver diseases are similar as a consequence of common liver pathology, histological variation in B aggregate presence in chronic liver diseases could be of use diagnostically. With this in mind, it was important to investigate the quantitative differences in B cell aggregates across various hepatic aetiologies. To quantify differences in B cell aggregation numbers between chronic liver diseases, B cells were stained with CD79α, which is a pan-b
162 cell marker and forms part of the BCR with CD79b. Following staining, aggregates of these B cells were visualized (Fig. 23A). ImageJ software analysis was then used to quantify these aggregates across end stage hepatic disease. Results concluded that HCV and PBC livers had a significant enrichment of B cell aggregates compared to NASH (p=.1 and p=.7) and Donor (p=.9 and p=.3) patients. (Fig. 23B). This finding replicates data for HCV (362) and PBC where B cell rich lymphoid aggregation has been frequently mentioned in biopsy reporting s (224, 418). Additionally, results showed B cell aggregates to mostly be a phenomenon of diseased and not donor liver. This is with the exception of a few samples in our donor cohort, which may be a result of disease occurrences in rejected donor samples (e.g. excess fat content) and other such case reports. Centroblasts are a proliferative B cell type involved in the GC reaction, which were found to be enriched in human liver compared to matched peripheral blood samples (Fig. 18B). Investigations by a BMedSci student in our lab located a GC-like structure in an ALD patient with a dark and light zone, which contained B cells (Fig. 24). Small structures resembling HEV were also identified, which are indicative of GC-like structures. One observation was that within the follicle, FDCs were identified in the dark zone, whereas GCs are described with FDCs being present in the light zone. A previous investigation by Mosnier et al and Murukami et al. supports the theory of the presence of GC-like structures in liver. Using IHC staining, they found a proportion of liver B cell aggregates (ectopic lymphoid structures) in HCV patients which expressed markers comparable to those located in GCs of typical secondary lymphoid tissues (lymph nodes or tonsils) (419) (362). These data in conjunction with our findings highlight similarities between the liver and secondary lymphoid tissue, at
163 least in HCV infection. Even this study however, indicated that GC-like B cell follicles were not universal in HCV patients, and the presence of FDCs in the dark zone raises some doubt as to whether these structures can definitively be identified as GCs, provoking further questions into why and if GCs are present in certain patients and what the distribution of other types of B cell aggregates may be (362, 42). To confirm the presence of GCs across human liver disease, future work could involve investigation of further markers indicative of a GC reaction, such as Activation- Induced (Cytidine) Deaminase (AID), as AID is the principal enzyme responsible for class switch recombination in the GC light zone. As well as forming associations with HCV, studies have demonstrated that ectopic lymphoid structures can also be found in patients and in mouse models with chronic liver diseases such as HBV and PBC, where increased numbers of such aggregates have been associated with poor prognosis (223). It has also been proposed that the B and T cells present in ectopic lymphoid structures, create a pro-inflammatory, cytokine-rich environment, and that this environment in conjunction with surrounding hepatocytes supports the growth of hepatocellular carcinoma progenitor cells within the aggregate, thereby promoting de novo hepatocarcinogenesis (421, 422). With this in mind, targeting the cells in ectopic lymphoid structures might provide therapeutic benefit for end stage chronic liver disease patients. Quantifying the distribution of types of B cell aggregates across hepatic diseases would not only confirm previous findings, but would also assist in identifying immunopathological differences between hepatic diseases, thereby aiding in diagnostics and understanding of pathophysiology. To perform this characterization, a panel of antibodies was used which were chosen
164 and optimized by our intercalating medical student Bardia Guevel. These markers included CD2 (pan B cell), CD3 (pan T cell) and Bcl-2 (GC-negative B cells, T cells), which allowed robust categorisation of B cell aggregates based on phenotype. By means of immunohistochemistry, varying patterns of staining intensity described in permitted the classification of B cell aggregates into lymphoid aggregates, B cell follicles or tertiary lymphoid structures. (Fig. 25 E G) presents the quantification of B cell aggregate types across end stage hepatic disease, where no statistical differences between the percentages of lymphoid aggregates, B cell follicles or tertiary lymphoid structures were identified between hepatic diseases. This is likely due to high variation between livers, therefore would require an increased cohort size to confirm these results. In summary, I have established a reliable technique to characterise 11 B cell subsets across end stage hepatic diseases through flow cytometry, the results of which have been confirmed by immunohistochemistry. Data from over seventy livers supports that proportions of hepatic B cell subsets did not vary significantly between hepatic liver diseases with the exception of the naïve mature B cell compartment. This may be due to the fact that there are few differences in overall hallmarks of end stage hepatic disease, with all livers eventually experiencing fibrosis, cirrhosis and inflammation. Supportive of the initial hypothesis that the B cell compartment varies according to disease specificity, PBC patients presented with a higher overall proportion of B cells, and contained a higher proportion of B cell aggregates compared to dietary injury livers. These aggregates were predominantly located around portal veins as well as bile ducts, which are known to be targeted by autoantibodies during disease, further indicating the possible pathogenic role of B
165 cells in PBC. It is important to understand which B cells subsets are specifically expanded to account for the increase in PBC B cell numbers in the liver, as this information may indicate which cells are involved in disease pathogenesis and therefore can be targeted therapeutically going forward.
166
167 4.1. INTRODUCTION While performing phenotypic analyses to compare matched blood and liver for B cell subset distributions, I noticed that CD24- B cells were enriched in the human liver compared to matched blood. This instigated a series of investigations to characterise CD24- B cells in donor livers and in liver inflammation. This chapter will focus on CD24- B cells in the liver. CD24 is a mature sialoglycoprotein (423) and is expressed on the surface of haematopoietic cells such as B cells ( ), some T cells ( ), neutrophils (429, 43), eosinophils (431), DCs (432, 433) and macrophages (434). It is also found on non-haematopoietic cells such as neural cells (435, 436), ganglion cells (437, 438), epithelia (439, 44), keratinocytes (441), pancreas (442), and muscle cells (443). CD24 is known to be overexpressed on many types of cancers, and is recognised as an important diagnostic and prognostic marker (444). Loss of CD24 expression on tumour cells has been associated with inhibited invasive growth, apoptosis and decreased proliferation (445). The wide distribution of CD24 in conjunction with its variable glycosylation, means that it has many ligands and so numerous unrelated functions have been associated with this glycoprotein (446). Studies have definitively shown that CD24 is able to bind P-selectin on human tumour cells, endothelium and activated platelets, and that this interaction can be blocked by soluble anti-cd24 (447). CD24 found on immune cells such as B cells, some T cells and neutrophils, could possibly interact with P- selectin on platelets and endothelium, although these interactions have yet to be investigated. Other CD24 ligands include CD171 in the brain, TAG-1 and contactin
168 (448-45), which are all involved in mediating CD24-induced inhibition of neural cell growth. CD24 plays a role in inflammation by binding DAMPs such as high mobility group box protein 1 (HMGB-1), Heat-shock protein and nucleolins along with Siglec- 1 to selectively repress the host response to tissue injury (451). Although various immunological functions have been associated with CD24, due to its variable glycosylation the true function of CD24 remains an enigma for most cell types. CD24 is however, known to mediate signal transduction through the recruitment of Src family protein tyrosine kinases (PTKs) via membrane rafts, and activates the mitogen-activated protein kinase pathway (MAPK), which triggers B and T cell development and apoptosis, cell binding and granulocyte oxidative burst ( ). Furthermore, the mouse equivalent to CD24, known as heat stable antigen (HSA), has been implicated in cellular adhesion (457) and lymphocyte activation (458-46). Expression of CD24 is high on B cell progenitors and mature resting B cells but not on terminally differentiated plasma cells (461). It influences B cell growth and activation responses through a calcium-mobilising signal transduction pathway (424, 462) and mediates cell-cell adhesion on naive B cells in mice (463). Previous studies also show that this gradual loss of CD24 expression on maturing B cells is necessary for a commitment to differentiation (464, 465) (466). One study further highlighted the importance of CD24 in early B cell development, by characterising mice lacking a functional HSA gene, constructed by homologous recombination in embryonic stem cells. Results proved that while T cell and myeloid development
169 appeared normal, HSA knockout mice presented with a leaky block in B cell development and a reduction in late pre-b and immature B cell populations in the bone marrow (463). On the other hand, data also shows that transgenic mice that overexpress HSA experience a significant reduction in pro-b and pre-b lymphocytes (467). As HSA performs as an adhesion molecule for P-selectin to facilitate the homing and stabilization of B cell precursors to the bone marrow, HSA overexpression is thought to retain B cell precursors on the bone marrow stroma, thereby preventing further maturation (468). HSA has since been implicated as a potent negative regulator of B cell development and activation, where another study reported that cross-linking HSA with the M1/69 monoclonal antibody induced the apoptosis of cultured B cell precursors in a stromal cell and cytokine-independent manner and that sensitivity to HSA-mediated cell death increased with developmental maturity. This study went on to prove that cross-linking of HSA did not induce apoptosis in mature splenic B cells, but instead inhibited their ability to proliferate in response to anti-cd4 + IL-4 (469). CD24 expression is also linked to increased vulnerability to autoimmune disease development (47), where CD24 deficiency causes deletion of autoreactive T cells that normally escape negative selection, and abrogates the development of EAE in transgenic mice with a TCR specific for a pathogenic autoantigen (471). Furthermore, CD24 polymorphisms have been identified as an important genetic factor in regulating susceptibility to autoimmune diseases, including multiple sclerosis (472, 473) and ulcerative colitis in humans (474) (475).
170 A newer flow cytometric approach has emerged over recent years to distinguish human memory B cells from naïve B cells, using B cell antigens CD19 with CD24 and CD38. These three antigens allowed the characterization and quantification of memory B cells (CD19+CD24+CD38-), Transitional/Breg type cells (CD19+CD24hiCD38hi) and mature naïve B cells (CD19+CD24intCD38int) (93) (476). One study used this gating strategy to investigate B cell subsets in the peripheral blood of the elderly, and discovered the presence of a new memory B cell subset identified as CD19+CD24-CD38- B cells. This CD24- B cell population was enriched in the elderly compared to younger controls and was found to produce TNF-α following stimulation with CpG, thereby leading to a hypothesis that this expanded population may contribute to the increased inflammatory status in the elderly known as inflamm-aging (477). The CD19+CD38-CD24- B cell population has also been found to be significantly enriched in the blood of atopic dermatitis patients compared to healthy control and psoriasis patients. This correlated with higher chronic activation amongst these patients, further supporting the hypothesis that CD24- B cells may contribute an inflammatory phenotype (478). In addition to the Buffa study, there have been numerous reports on age-associated B cells (ABCs) (479, 48). ABCs are defined as an antigen-experienced population, which process and present antigen, and accumulate with age (479, 48). Although this subset shares many phenotypic characteristics with exhausted memory B cells (481), ABCs lack CD21 and CD23 expression (479), express high levels of the transcription factor T-bet (482), and respond poorly to BCR engagement (483) (See Table 19). Following TLR stimulation in vitro however, ABCs have been found to
171 class switch (48, 482), produce antibodies and secrete a spectrum of immunomodulatory cytokines such as IFN-γ and IL-1 (483). Further in vivo studies demonstrated that ABCs were also producers of pro-inflammatory cytokine TNF-α (484), and that the sustained accumulation of ABCs could lead to autoinflammatory and autoimmune pathologies (48, 482). Overall, although previous studies have implied CD24- B cells may contribute to inflammation, the function of CD24- B cells and their role in inflammation still remains to be thoroughly elucidated. Chapter objectives. To understand the phenotype of CD24- B cells across end-stage liver disease, I designed experiments: 1. To compare proportions of CD24-CD38- and CD24-CD38int B cells in human diseased liver and matched blood using flow cytometry. 2. To quantify CD24-CD38- and CD24-CD38int B cells across end stage hepatic diseases. 3. To investigate the phenotype of the CD24- B cell population by flow cytometry by characterizing their expression of B cell subset markers, activation antigenic markers and age-associated B cell markers. 4. To understand how expression of the CD24 glycoprotein is lost from B cells using co-culture assays.
172 Table 21 Surface marker expression used to define human and mouse ABCs and human exhausted B cells (483). Expression markers of human and mouse antigens defining ABC and exhausted B cell phenotypes are shown as high, positive (+), intermediate (int), negative (-) or N/A (unknown). The first three columns compare expression of surface markers of mouse and human ABCs reported by Hao et al. in mice, and Rubtsov et al. in mice and humans respectively. The last column characterises exhausted human B cells.
173 4.2. RESULTS CD24- B cells were found to be present in the liver, which could be further separated into CD24-CD38- and CD24-CD38int subsets (Fig. 26A). Given that CD24 is involved in cell migration, B and T cell activation, signaling, and autoimmune disease, I sought to determine if liver B cells expressed a greater proportion of CD24- B cells in comparison to matched and unmatched blood samples. In order to investigate the presence of CD19+CD24-CD38- and CD19+CD24- CD38int populations in the liver, I stained PBMCs from matched patient blood and LIMCs from liver for CD19, CD24 and CD38 antigens. I observed an enrichment of CD19+CD24-CD38- populations in 6 out of 7 diseased livers (where the fold change for NASH1, NASH2, ALD1, ALD3, PSC and PBC was 1.9, 1,.6,.6, 1.2 and 12.7 respectively), and enrichment of CD19+CD24-CD38int in 7 out of 7 livers compared to matched blood (where the fold change for NASH1, NASH2, ALD1, ALD2, ALD3, PSC and PBC was 2.2, 2.1, 1.1,.32, 1.35, 11.8 and 25.8 respectively) (Figure 26 A & B). Of these matched blood and liver donors, autoimmune patients demonstrated the greater fold increase of CD24- B cell subsets compared to matched blood, whereas the fold change between matched blood and metabolic liver disease demonstrated a lower fold change. To establish whether CD24- B cells were enriched in SLOs or were specific to the liver, the percentages of CD24-CD38- and CD24-CD38int subsets per gram of tissue in donor and diseased livers were compared to perihepatic lymph nodes and donor
174 spleens. Results demonstrated that the percentage of CD24-CD38int B cells were significantly enriched in healthy livers (6.4±8.2%) compared to perihepatic lymph nodes (4.±4.4%) and spleen (2.7±2.28%) (where p=.18 and.14 respectively). However, there were no significant differences between hepatic CD24-CD38- B cell proportions (healthy 6.4±8.2% and chronic liver disease 14.13±15.34%) compared to secondary lymphoid tissues (lymph node 4.±4.43% and spleen 2.7±2.28%) (Fig. 26C). Taken together, these results indicate that CD24- B cells are specifically enriched in liver when compared to matched and unmatched blood and SLO samples.
 1 8 6 4 2 SLO Liver CD24-CD38int B cells (% of CD19+) 1 8 6 4 2 SLO * * Liver.")
175 Blood Liver CD Memory 2. Naive 3. Transitional/Breg 4. CD24- CD38- B cells 5. CD24- CD38int B cells 6. Plasmablasts CD CD24-CD38- CD24-CD38int CD24-CD38- B cells (% of CD19+) SLO Liver CD24-CD38int B cells (% of CD19+) SLO * * Liver. Figure 26 CD24- B cells are enriched in liver compared to matched blood and SLO samples. (A) Gating strategy for CD24-CD38- and CD24-CD38int B cells, and other subsets in a matched PBC liver and blood sample. (B) Fold change increase of CD24- B cells within liver samples compared to matched blood (n=7) from patients with different chronic liver diseases. (C) Percentage (%) of CD24-CD38- and CD24- CD38int B cells present per gram of tissue in SLO (perihepatic LN and spleen), donor and chronic diseased livers. All statistics were performed as a one-way nonparametric ANOVA (Kruskal-Wallis test) comparing the mean of each tissue cohort with the mean of every other tissue cohort. Significant differences are displayed on the graphs where *p<.5.
176 I wanted to establish whether CD24-CD38- and CD24-CD38int B cell populations in liver and blood were heterogeneous, and if so, whether they were similar to naïve or memory B cells. To investigate this, I used CD27 and IgD antigens to quantify the percentage of naïve mature, switched memory, non-switched memory and double negative B cells within the CD24-CD38- and CD24-CD38int B cell subsets (Fig. 27). Experiments revealed that in donor livers, the phenotype of CD24-CD38- B cells were mainly naïve, and harbored a significantly higher proportion of naïve B cells (41.5±21.%) compared to non-switched memory B cells ( marginal zone-like cells) (11.5±15.9%) where p=.3. Conversely, CD24-CD38int B cells in donor livers did not contain significant enrichment of any B cell phenotype (Fig 27B). In diseased livers, the CD24-CD38- population also contained a significantly higher proportion of naïve B cells (where 46±21.%) compared to non-switched memory (1±1%), switched memory (16±13%) and double negative B cells (28±17%), where p=.1, p=.1 and p=.6 respectively. The hepatic CD24-CD38int population contained B cells with a significantly higher naive phenotype compared to switched memory and double negative memory (naïve: 34±25%, switched mem: 13±13%, double negative mem: 11±9%), where p=.1 and.1 respectively. This population also contained a significantly higher proportion of non-switched memory B cells compared to switched memory and double negative memory B cells (non-switched memory: 43±26%), where p=.1 and p=.1 respectively (Fig 27B). Interestingly, the trend in terms of proportions of B cell subsets within the
177 CD24-CD38int B cell compartment was similar between human blood and diseased liver samples. In healthy blood, the phenotypic profile of CD24- B cells differed to that found in donor and diseased livers, as both CD24-CD38- and CD24-CD38int groups contained a significantly high non-switched memory B cell compartment (CD24- CD38-: 46.8±12.6% and CD24-CD38int: 64.6±11.2%, p=.1) compared to double negative memory B cells (CD24-CD38-: 3.8±2.7% and CD24-CD38int: 1.8±1.4%, p<.1) (Fig 27B). CD24-CD38int B cells in blood also contained a significantly higher proportion of naïve cells compared to switched memory (where naïve: 21.5±6.7% and switched memory: 27.95±11.7% and p=.3), and significantly enriched non-switched B cells compared to switched memory (where non-switched: 46.75±12.6% and switched: 27.95±11.7% and p=.3). These data show that CD24-CD38- and CD24-CD38int B cells are phenotypically distinct in the liver and their subset composition may differ between anatomical locations.
 ) s 1 8 6 4 2 e Diseased liver ** **** **** ) ** **** ) s % CD24-CD38int B cells 1 8 6 4 2 Naive Memory (non-switched) * **** * Memory (switched)")

178 Blood Liver CD27 g y FL 7 L Vi l t CD24-CD38- B cells CD24-CD38int B cells IgD % CD24-CD38- B cells Blood **** 1 5 e Donor liver * ) ) s e Diseased liver ** **** **** ) ** **** ) s % CD24-CD38int B cells Naive Memory (non-switched) * **** * Memory (switched) Double Negatives Naive Memory (non-switched) Memory (switched) Double Negatives %C 9 C C 38 t ce s Naive **** **** **** **** Memory (non-switched) Memory (switched) Double Negatives Figure 27 - Liver and blood CD27 and IgD expression of CD24-CD38- and CD24-CD38int B cells reveals phenotype in blood and liver. (A) Flow cytometry plots highlight differences between naïve mature, non-switched memory, switched memory and double negative B cells (as gated in Fig. 18A) within the CD19+CD24- CD38- and CD19+CD24-CD38int compartment in diseased liver and healthy donor blood. (B) The percentage (%) of naïve mature, non-switched memory, switched memory and double negative B cells present in the CD19+CD24-CD38- and CD19+CD24-CD38int compartment of healthy donor blood, donor liver and diseased liver. Error bars represent the mean and standard deviation, where n=6 for healthy bloods, n=7 for donors and n=57 for diseases livers. Statistical differences were calculated with a non-parametric one-way ANOVA (Kruskal-Wallis test), corrected for multiple comparisons (Dunn s). Statistical differences were represented when p<.5*, p<.5** and p<.5****.
179 To test if CD24- B cells in the liver were more phenotypically comparable to blood or LN from the same donor, I compared matched tissues from three end stage liver disease donors with PBC, ALD and NASH (matched blood and liver) and two donor livers (matched liver and LN) (Fig. 28). These experiments showed that the proportion of naïve and memory B cells within the CD24- compartment were different between the liver and the periphery, and between the liver and perihepatic lymph nodes in every individual patient.
180 Naive Memory (non-switched) Memory (switched) Double Negatives A CD24-CD38- CD24-CD38int Blood Liver Blood Liver ALD ALD PBC N NASH B CD24-CD38- CD24-CD38int LN Liver LN Liver Donor 1 Donor 2 Figure 28 The composition of CD24- B cells differs between matched blood and liver and between different individuals. The proportions of naïve, nonswitched memory, switched memory and double negative B cells within the CD24- B cell compartment in (A) matched blood and liver patients, and (B) matched lymph node and liver. Each row is representative of an individual donor.
181 To help establish whether the absolute number of CD24-CD38- and CD24-CD38int B cells varied proportionally between end stage chronic hepatic disease, I stained LIMCs isolated from end stage hepatic liver disease explants (viral, autoimmune and dietary injury) with CD19, CD38 and CD24. Secondly, I phenotypically characterised the CD24- B cell compartments further, by staining these cells to quantify proportions of naïve mature (IgD+CD27), non-switched memory (IgD+CD27+), switched memory (IgD-CD27+) and double negative B cells (IgD-CD27-). Fig. 29A demonstrates that the number of CD24-CD38- B cells per gram of tissue was significantly enriched in PBC livers compared to donor livers (PBC: 6541±7681% and donor: 274±338% where p=.2). The number of CD24-CD38int B cells per gram of tissue was not increased in PBC (Fig. 3A) compared to other chronic liver diseases. The proportions of naïve, non-switched memory, switched memory and double negative B cells also did not vary significantly between end stage hepatic diseases within both CD24-CD38- and CD24-CD38int B cell compartments (Fig. 29B & 3B). In order to further characterize the CD24- B cell populations, surface antigens were quantified for B cell activation (CD69), antigen presentation (CD1d) and classswitched B cells (IgG & IgA) (Fig. 29B & 3B). Within the CD24-CD38- B cell compartment, the percentage of CD1d expression was significantly increased within donor patient livers compared to dietary liver disease patients (donor: 1.6±4.2%, and ALD: 2.13±2.36% NASH:.66±.8% where p=.3 and, p=.7 respectively). This result was also true within the CD24-CD38int B cells compartment, where CD1d expression was significantly increased within donor patient livers in comparison to
182 NASH liver patient livers, (donor: 14.8±8.1% and NASH: 3.11±5.64% where p=.19). PSC patient livers demonstrated a significantly higher proportion of IgG class switched CD24-CD38- B cells compared to viral livers (PSC: 5.5±6.7% viral: 2.65±3.35% where p=.37) (Fig. 29B), however no such difference was demonstrated within the CD19+CD24-CD38int compartment (Fig. 3B).
183 1 No. of CD19+CD24-CD38- B cells /g tissue r p=.2 C C H 1 D l 8 8 Naive CD C C H D y l % CD19+CD24-CD38- B cells Memory (S) Memory (NS) r C C H D l CD1d+ IgG *** * g * C r C C H D l DN 6 4 IgA+ B cells C C D l r C C H D l Figure 29 The percentage of CD24-CD38- B cells varied phenotypically across end-stage liver diseases. n=7,9,9,9,16 and 7 for donor, PBC, PSC, NASH, ALD and Viral livers respectively. (A) Proportions of CD24-CD38- B cells across end stage hepatic diseases per gram of tissue. (B) Percentages (%) of naïve mature, non-switched memory, switched memory, double negative, CD69+, CD1d+, IgG+ and IgA+ cells within the CD19+CD24-CD38- B cell compartment. Error bars represent the mean and standard deviation. Statistical differences were calculated with a non-parametric one-way ANOVA (Kruskal-Wallis test), corrected for multiple comparisons (Dunn s). Statistical differences were represented when p<.5*, p<.5** and p<.5***, or with the original p value.
184 1 No. of CD19+CD24-CD38int B cells /g tissue r C C H 1 D l 8 8 Naive 6 4 CD % CD19+CD24-CD38int B cells Memory (NS) Memory (S) CD1d+ IgG r C * C H D l DN Figure 3 The percentage of CD24-CD38int B cells varied phenotypically across end-stage liver diseases. n =7,9,9,9,16 and 7 for donor, PBC, PSC, NASH, ALD and Viral livers respectively. (A) Proportions of CD24-CD38int B cells across end stage hepatic diseases per gram of tissue. (B) Percentages of naïve mature, non-switched memory, switched memory, double negative, CD69+, CD1d+, IgG+ and IgA+ cells within the CD19+CD24-CD38int B cell compartment. Error bars represent the mean and standard deviation. Statistical differences were calculated with a non-parametric one-way ANOVA (Kruskal-Wallis test), corrected for multiple comparisons (Dunn s). Statistical differences were represented where p<.5*. IgA
185 Buffa et al. showed that the proportion of CD24-CD38- B cells was increased in the blood of the elderly (477). I wanted to assess whether an age correlation existed between our CD19+CD24-CD38- and CD19+CD24-CD38int hepatic B cells and patient age. Age data was obtained for patient livers used in our cohort, from a range of hepatic diseases. This data was then analysed for the correlation between patient age and the number of CD24-CD38- and CD24-CD38int B cells obtained per gram of liver tissue. No. of CD24-CD38- B cells /g of tissue Fig. 31 demonstrates an inverse correlation exists between increased patient age and the number of CD24-CD38- and CD24-CD38int B cells per gram of tissue. Older patients with end stage chronic hepatic disease had reduced numbers of CD24- CD38- and CD24-CD38int B cells, where r=-.27 and -.35, and p=.2 and.4 respectively. Furthermore, no correlation was observed between types of hepatic disease, age, and the number of CD24- B cells/g of tissue r= -.27 p=.2* Age No. of CD24-CD38int B cells /g of tissue r= -.35 p=.4** Figure 31 The number of CD24-CD38- and CD24-CD38int B cells in human chronic diseased livers decrease with age. Scatter graph demonstrating the linear regression between the number of CD24-CD38 and CD24-CD38int B cells per gram of human chronic liver diseased tissue with age. Each dot is representative of a different disease as indicated by the key. The other cohort is representative of patients with enzyme deficiencies or polycystic liver disease. Correlations between the variables were assessed by calculating Pearson correlation coefficients (twotailed) with 95% confidence intervals, where n=64. Age PSC ALD Fatty liver PBC HBV/HCV Other NASH
186 The Buffa study initiated our interest in age-associated B cell populations. ABCs are a specific B cell subset found to be enriched in peripheral blood in the elderly. These cells have phenotypically been described in the literature as CD19+CD11c+CD8/86hiT-bet+CD21-CD23-IgD- (483). Furthermore, a recent study discovered CD21- ABCs in human blood to contain a CD38-CD24low population of B cells (485). ABCs have been proven to play a role in autoimmune disease (48, 482), and my data shows that CD24-CD38- B cells were enriched in PBC. For these reasons, I was driven to investigate whether the phenotype of exhausted and ABCs correlated with our hepatic CD19+CD24-CD38- and CD19+CD24-CD38int B cell population, to further understand the function of these CD24- liver B cells. To address these points, LIMCs were stained for CD19+ B cells, CD38 and CD24 antigen markers and ABC markers across three panels: (1) CD21, IgD, CD11c, T-bet (2) CD23, T-bet and (3) CD8, T-bet respectively (see methods ). Stained LIMCs were run through the flow cytometer. The gating strategy of the three ABC antigen panels using total hepatic CD19+ B cells is outlined in Fig. 32A. Fig. 32B demonstrates that when ABCs (antigen combination staining panels 1, 2 and 3) (blue) were overlaid onto total CD19+ B cells in the liver (red), the majority mapped onto the CD24-CD38int population, indicating that a large amount of ABCs located in the liver may be contained within the CD24-CD38int population. In panels 1 and 2, a few ABC-like cells were also found to map within the memory B cell compartment (CD19+CD38-CD24+). ABCs are known to lack CD23 expression but
187 exhausted B cells are CD23+. I decided to investigate whether hepatic B cell populations contained exhausted B cell markers. Fig. 33 shows that like ABC-like cells, exhausted-like B cells (CD19+CD21lowCD23+CD11c+IgD-CD8hi) were also mainly contained within the CD24-CD38int population.


 ABCs identified in panel 1, 2 and 3")
188 g g 5 4 # Cells CD21 - IgD - CD11c + T-bet FL 8 Log L : APC I D CD8 + T-bet CD23 - T-bet CD TBET FL 8 Log : APC Figure 32 ABCs were contained within the CD24-CD38int hepatic B cell compartment. (A) Sequential gating strategy of ABCs across three panels (CD21- IgD-CD11C+Tbet+, CD8hiTbet+ and CD23+Tbet+) after first gating on total CD19+ B cells from a PSC liver sample. (B) ABCs identified in panel 1, 2 and 3 (blue) were overlayed onto total CD19+ B cells from the PSC liver (red) to highlight ABCs within the total B cell population.


 after first gating on total CD19+ B")
 ABCs identified in panel 1, 2 and 3 (blue) were overlayed onto total")
189 g 5 4 # Cells CD21 low IgD - CD11c CD8 hi FL 1 L FITC CD PE FL 5 L C Figure 33 Exhausted B cells were contained within the CD24-CD38int hepatic B cell compartment. (A) Sequential gating strategy of exhausted B cells across three panels (CD21lowIgD-CD11C+, CD8hi and CD23+) after first gating on total CD19+ B cells from a PSC liver sample. (B) ABCs identified in panel 1, 2 and 3 (blue) were overlayed onto total CD19+ B cells from the PSC liver (red) to highlight exhausted B cells within the total B cell population.
190 Following the indication that ABCs may be contained within the CD24-CD38int B cell subset, I decided to perform a quantitative analysis of ABCs within B cell subsets in the liver. LIMCs were stained from chronic liver disease tissue and PBMCs from healthy donor blood with the three ABC panels to allow comparisons of ABC-like cells within B cell subsets between the liver and blood (Fig. 34). Results indicate that ABCs may be enriched within the CD24-CD38- B cell compartment in healthy blood, as the percentage of CD21-CD11c+Tbet+ and CD23- Tbet+ cells was significantly higher in the CD24-CD38- B cell compartment compared to the naïve and transitional B cell subsets (CD24-CD38-: 3.3±2%, and naïve:.9±.22% transitional:.6±.4%, where p=.125 and p=.5 respectively). Furthermore, the percentage of CD23-Tbet+ cells was also significantly higher in the CD24-CD38- B cell compartment compared to the naïve and transitional B cell subsets (CD24-CD38-: 5.96±3.49% and naïve:.53±.21% transitional:.88±.29%, where p=.6 and p=.2 respectively). In agreement with Fig. 32B, Fig. 34 demonstrates that unlike in blood, ABCs may be contained in the hepatic CD24-CD38int compartment in end stage liver disease. Quantitative analysis of ABC markers in B cell subsets in the liver showed that the percentage of CD21-CD11c+Tbet+ was significantly increased within the CD24-CD38int B cell compartment compared to transitional B cells (CD24-CD38int: 1.15±7.9% an transitional: 1.1±1.79% where p=.8**), and that the percentage of CD8+T-bet+ B cells were also significantly higher in the CD24-CD38int compartment compared to the transitional and memory B cell subset (CD24-CD38int: 15.28±1.54% and transitional: 2.28±5.54%, memory:.1±.14% where p=.2* and p=.2* respectively).
191 A similar analysis to detect exhausted B cell markers in the liver (Fig. 32 & 33) showed that showed that like ABCs, exhausted B cell markers CD21lowCD11c+ were significantly higher in CD24-CD38int B cells compared to transitional (CD24- CD38int: 21.74±21.66% and transitional:.75±1.17% where p=.4), and CD8hi were significantly higher in CD24-CD38int B cells compared to transitional and naïve B cells, (CD24-CD38int: 16.63±15.4% and transitional:.±.% naïve:.2±.4%, where p=.4 and p=.1 respectively) (Fig. 35). In blood, panel 1 showed that peripheral CD24-CD38- B cells had a significantly higher proportion of exhausted markers (CD21lowCD11c+IgD-) compared to transitional B cells (CD24- CD38-: 2.87±1.18% and transitional:.9±.6% where p=.4). Conversely, panel 3 in blood demonstrated that it was the CD24-CD38int B cell subset which contained a significantly high proportion of CD23+ B cells compared to memory B cells (CD24-CD38int: 68.5±9.4% and memory: 19.82±6.58% where p=.1). Panel 2 showed that the exhaustion marker CD8hi did not vary significantly between B cell subsets in blood.
192 Blood 5 *** * Liver ** ** 5 5 * * l C t * *** l C t Figure 34 ABCs appear enriched in the CD24-CD38- B cell compartment of healthy blood, and the CD24-CD38int compartment in end stage disease liver. The percentages (%) of transitional, naïve, memory, plasmablast/plasma cells, CD24-CD38- and CD24-CD38int B cells expressing ABC markers (labeled panels 1, 2 and 3). Error bars represent the mean and standard deviation, where n=6 for blood and liver. Statistical differences were calculated with a non-parametric one-way ANOVA (Kruskal-Wallis test), corrected for multiple comparisons (Dunn s). Statistical differences were represented where p<.5*, p<.5** or p<.5***.
193 Blood Liver ** *** ** * *** **** * ** * C t 2 2 Figure 35 Exhausted B cells may be enriched in the CD24-CD38int compartment in end stage disease livers. The percentages (%) of transitional, naïve, memory, plasmablast/plasma cells, CD24-CD38- and CD24-CD38int B cells expressing exhausted B cell markers (labeled panels 1, 2 and 3). Error bars represent the mean and standard deviation, where n=6 for blood and liver. Statistical differences were calculated with a non-parametric one-way ANOVA (Kruskal-Wallis test), corrected for multiple comparisons (Dunn s). Statistical differences were represented where p<.5*, p<.5**, p<.5*** or p<.1****.
194 Figure 36 demonstrates that supportive of Fig. 34, B cells expressing ABC markers (CD11c+CD21-T-bet+ B cells) resided mainly in the CD24-CD38- compartment of healthy blood donors. In non-inflamed livers the expression of ABCs markers were split between the CD24-CD38- and CD24-CD38int compartment. In immunemediated liver inflammation such as PBC, PSC and ALD, B cells expressing CD11c+CD21-T-bet+ were mainly confined to CD24-CD38int B cells, suggesting that ABCs were probably enriched in this compartment. This supports previous studies, which have found that ABCs have played a role in autoimmune disease (486) (48, 482, 483). CD21low exhausted-type B cells in healthy donor blood were variably distributed between B cell subsets, however in non-inflamed livers they were enriched within the naïve B cell population, eluding to the fact that exhausted B cells may be enriched the naïve compartment. In PSC patients in particular, the exhausted B cell marker CD21low was enriched in the CD24-CD38int B cell compartment. This implies that CD24-CD38int B cells may also be representative of an exhausted population, which may have associations with liver disease pathogenesis (Fig. 36).
195 Transitional naive memory PB/PC CD24-CD38- CD24-CD38int % CD11c+T-bet+CD21- (ABC markers) A B C D E F Healthy Blood Seronegative NCPH ALD/HCC PBC/ALD PSC PSC Livers Transitional naive memory PB/PC CD24-CD38- CD24-CD38int %CD21low B cells (Exhausted marker) A B C D E F Healthy Blood T t l 845 T t l 851 Seronegative NCPH ALD/HCC PBC/ALD PSC PSC Livers T t l 875 Figure 36 ABC markers are mainly found on CD24-CD38int B cells within inflamed liver diseases Bars representing total CD19+ B cells and the percentage proportion of ABCs and exhausted B cell markers contained within B cell subsets in healthy blood and diseased liver. Each bar is representative of a separate donor, where liver disease of each donor is indicated. B cell subsets displayed are Transitional, naïve, memory, plasmablast/plasma cells, CD24-CD38- and CD24- CD38int B cells from top to bottom respectively.
196 I demonstrated that CD24- B cells were enriched in human liver compared to blood (Figure 26B) To explore how CD24 was lost on hepatic B cells, and whether CD24 loss was induced by the hepatic environment, co-cultures between blood B cells and liver stromal cells, or blood B cells and cytokines, were performed. PBMCs from HFE patients were isolated and co-cultured for 1 hour and 24 hours in the presence of liver stromal cells (LX2, HSEC, BECs & Fibroblasts) (See method 2.4.2). Following co-culture with liver stromal cells, PBMCs were rested in media alone for an hour to assess if any loss of CD24 on B cells could be regained. PBMCs were stained prior to and following co-culture to assess whether CD24 surface expression had been downmodulated. Results from Fig. 37 demonstrate that B cells did not lose CD24 expression after 1h and 24-hour co-culture with liver stromal cells. This was true for all liver stromal cells including BEC, LX2 cells, fibroblasts and HSEC. In all experiments, there were no significant differences in the percentage of CD24-CD38- and CD24-CD38int B cells post isolation compared to co-cultures, cultures in media alone, or cultures in media alone following co-cultures with liver stromal cells.
197 3 BEC 3 Fibroblasts % CD24-CD38- B cells LX HSEC 1 1 h 1h 1h PBMC only 1h + 1hR 24h 24h PBMC only 24h + 1hR h 1h 1h PBMC only 1h + 1hR 24h 24h PBMC only 24h + 1hR 3 BEC 3 Fibroblasts % CD24-CD38int B cells LX HSEC 1 1 h 1h 1h PBMC only 1h + 1hR 24h 24h PBMC only 24h + 1hR h 1h 1h PBMC only 1h + 1hR 24h 24h PBMC only 24h + 1hR Figure 37 CD24 expression on peripheral blood B cells is unaffected following co-culture with liver stromal cells. CD19+CD24-CD38- and CD19+CD24-CD38int expression on B cells in blood directly ex vivo (h) and following co-culture with BEC, LX2 cells, fibroblasts or HSEC for 1h and 24h. PBMCs cultured in media alone for 1h or 24h were used as a control. After 1h and 24h co-cultures, PBMC were placed in media alone to be rested (R=recovery) for 1h (1hR) to assess whether CD24 expression was further lost or regained. Error bars display the mean and SD where n=3 for all co-cultures. Statistical analysis was performed using a one-way ANOVA, where all treatments were compared to the h controls, and corrected for multiple comparisons (Dunn s).
198 The inflamed liver is a hub for growth factors, chemokines and cytokine activity, which affects many cells within the liver including Kupffer cells and hepatocytes (31, 34). In order to investigate whether the cytokine microenvironment present in the liver induced CD24 downmodulation on hepatic B cells, PBMCs isolation from HFE donors were co-cultured in media with an array of cytokines for 1 hour and 24 hours (See method ). Percentage CD24 expression on these cells were assessed at h as well as 1 and 24 hours following co-culture, to determine whether CD24 expression was affected by cytokines present in the liver microenvironment. Fig. 38 shows that neither pro-inflammatory or anti-inflammatory cytokine treatments induced an increased percentage in CD24-CD38- and CD24-CD38int B cell populations. All 1 hour and 24 hour treatments were compared to the percentage of CD24-CD38- and CD24-CD38int B cell populations at h (immediately post isolation).
199 % CD24-CD38- B cells h media alone TNFα IFNγ TNFα & IFNγ IL-6 IL-2 IL-1β TGFβ IL-1 Proinflammatory anti-inflammatory 1h 24h % CD24-CD38int B cells h media alone TNFα IFNγ TNFα & IFNγ IL-6 IL-2 IL-1β TGFβ IL-1 Proinflammatory anti-inflammatory Figure 38 CD24 expression on B cells is not affected by cytokines present in the liver. The percentage (%) of CD24-CD38- and CD24-CD38int B cells before and after 1h and 24h co-culture with pro-inflammatory (TNF-α, IFN-γ, IL-6, IL-2, IL-1β) and anti-inflammatory (IL-1 and TGFβ) cytokine treatment. Error bars indicate the mean and SD where n=3 for all co-cultures. Statistical analysis was performed using a one-way ANOVA, where all treatments were compared to the h controls, and were corrected for multiple comparisons (Dunn s).
200 To determine whether loss of CD24 on hepatic B cells was due to internalization rather than being shed from hepatic B cells, B cells were isolated from human end stage diseased livers, permeabilised and stained as stated in Once prepared, samples were run through the flow cytometer to assess intracellular and surface expression of CD24. Fig 39. Demonstrates that the % of CD24 stain on the surface and within hepatic B cells does not equate to 1% in all three experiments. This indicates that CD24 is not internalized on hepatic B cells following the loss of surface expression, and may instead be lost via a ligand dependent mechanism. % CD24+ B cells Surface + Internalised Surface Figure 39 CD24 molecule is not internalized on hepatic B cells. Bar graph demonstrating the percentage of CD24+ B cells where B cells were stained for surface markers alone (CD19, CD24 & CD38) and surface with intracellular staining (CD19 & CD38 surface, CD24 intracellular). N=3 where each experiment is separated into 1, 2 and 3.
201 4.3. DISCUSSION A large population of CD24- B cells were present in the liver. Upon further investigation I found that the CD24- B cell population could be further categorized into CD24-CD38- and CD24-CD38int subsets (Fig. 26A). When compared to matched blood, it was found that both these CD24- B cell populations were enriched in human liver B cells compared to peripheral blood (Fig. 26B). Of these matched blood and liver donors, autoimmune patients demonstrated a greater fold increase of CD24- B cell subsets compared to matched blood, whereas the fold change between matched blood and dietary liver disease consistently demonstrated a lower fold change, highlighting that the proportion of CD24- B cells demonstrate a possible disease bias in autoimmune livers. Loss of CD24 expression on MDA-MB-231 breast cancer cells and mouse pre-b cells lines has been found to increase SDF-1- mediated cell migration and signaling via CXCR4, which correlated with enhanced tumour formation in NOD/SCID mice compared with cells overexpressing CD24 (487). Given that CD24 is expressed on B cells prior to differentiation, the loss of CD24 on hepatic B cells could mean that B cells migrate into the liver, resulting in a reduced population of CD24- B cells in the blood (461). The percentage of CD24-CD38- and CD24-CD38int subsets in donor and diseased livers was compared to SLOs such as perihepatic lymph nodes and donor spleens. Although the proportion of CD24-CD38- B cells did not differ significantly between liver and SLO populations, healthy livers contained a significantly higher percentage of CD24-CD38int B cells compared to perihepatic lymph node and spleen samples, indicating that this population is enriched in the liver compared to secondary
202 lymphoid tissues. B cell progenitors and mature resting B cells are known to express high levels of CD24, but this expression is absent on terminally differentiated cells such as plasma cells (461). Another study has shown that activation of naïve human tonsillar B cells through CD44 co-ligation causes progression towards a GC B cell phenotype, involving an upregulation of GC markers and a downregulation of CD24 (488). These findings suggest that the high proportion of CD24-CD38int B cells in the liver may be indicative of an activated B cell population, possibly even GC-like B cells. It is anticipated that an activated immune population would exist in the healthy liver given that the liver is a tolerogenic organ, and given that it encounters a constant influx of antigen-rich blood from the gut (489, 49). I next wanted to identify whether these CD24-CD38- and CD24-CD38int populations were homogenous, and if they were similar to naïve or memory B cells. This was performed by gating on CD24-CD38- and CD24-CD38int populations and separating them into naïve, switched memory, non-switched memory and double negative B cells using CD27 and IgD expression markers (Fig. 27). Results showed that both CD24- B cell populations were heterogeneous in the diseased and donor livers. The CD24-CD38- population in diseased and donor livers contained significantly more naïve (IgD+CD27-) cells and the CD24-CD38int population in diseased livers contained significantly more naïve and non-switched MZ-like memory (IgD+CD27+) cells. The profile of hepatic CD24-CD38- B cells differed to blood and harbored a significantly higher proportion of non-switched memory cells compared to other subsets. This phenotypic variation in the CD24-CD38- B cell compartment between blood and liver further highlights that functionally, the B cell compartment may also differ between the two. Interestingly, although differences existed between liver and
203 blood with regards to the CD24-CD38- B cell populations, the general trend of MZlike and naïve B cells being enriched in the CD24-CD38int B cell compartment was replicated in both diseased liver and blood samples. Results from Fig. 28 demonstrated that matched blood and liver from individual patients suffering from chronic liver disease contained variable proportions of B cell subtypes within the CD24- B cell population, highlighting further that the B cell compartment in the blood and liver are heterogeneous. These differences were also observed between matched perihepatic lymph nodes and liver patients, which indicates that in order to study the effect of CD24- B cells on chronic liver disease in detail, B cells isolated directly from the liver tissue should be investigated as the impact of these cells within the liver tissue may be different to those in the blood. The difference in B cell profile between chronic liver diseases further indicates that the role of CD24- B cells in the liver compartment in particular may be disease relevant, and therefore this B cell population within specific chronic liver diseases should be further investigated. Fig. 29A & 3A helped to establish whether the absolute number of CD24-CD38- and CD24-CD38int B cells varied significantly between end stage hepatic diseases. Whereas the proportion of CD24-CD38int B cells did not vary significantly between end stage liver diseases, the number of CD24-CD38- was significantly enriched in PBC livers compared to donor livers per gram of tissue. On the contrary, CD24 deficiency has previously been associated with an increased efficiency in clonal deletion, and in mice, with higher resistance to autoimmune disease (47, 471). Furthermore, murine studies have shown that HSA cdna from activated B cells
204 encode CD8/CD86 which are important in inducing CD4+ T cell activation and clonal expansion in mice (427, 459). With this in mind, one would expect a lack of CD24 on B cells to result in reduced inflammation, which contradicts the high levels of inflammation found in a chronic autoimmune disease like PBC. Nonetheless, enrichment of CD24-CD38- B cells in PBC in this case alludes to a potential role of this subset in disease pathogenesis. However the positive or negative role this population remains to be determined. CD1d expression was significantly decreased on CD24-CD38- hepatic B cells in ALD and NASH patients and on CD24-CD38int hepatic B cells in NASH patients compared to donor livers (Fig. 29B). These differences were not observed for CD24+ B cell populations, which is indicative of this marker having a possible role in CD24- B cells in dietary injury. CD1d is involved in the presentation of lipid antigens to NKT cells, which leads to their activation and subsequent secretion of Th1/Th2 cytokines such as IFN-γ and IL-4 (266, 491). In the case where CD1d expression is downregulated in dietary injured livers, it is possible that fewer NKT cells are activated. Studies have shown that NKT cells play an important role in immune regulation, and that dysfunction of deficiency of NKT cells leads to development of autoimmune diseases or cancer (492, 493), highlighting a possible susceptibility in ALD and NASH patients. These findings contradict those from other studies that find that cellular and molecular mechanisms underlying ALD are known to involve complex interactions between innate immune cells such as NKT cells, parenchymal cells (hepatocytes) and non-parenchymal cells (HSEC, Kupffer cells, HSCs and DCs). Furthermore, murine models of chronic plus binge ethanol feeding, and models of mice, which are fed alcohol via an intragastric tube, have demonstrated an
205 increased number of activated type I NKT cells ( ). Jα18 / mice (which are deficient in type I NKT cells) and CD1d / mice (which are deficient in both NKT cell subsets) have also demonstrated protection against liver injury after alcohol intake (495). A publication by Buffa et al. 213, has been the only study to date known to identify a CD24-CD38- B cell population enriched in the blood of elderly patients (477). Furthermore, a recent study by Thorarinsdottir and colleagues, discovered that CD21- ABCs in human blood contained a CD38-CD24low population of B cells (485). In order to assess whether an age correlation existed within CD19+CD24- CD38- and CD19+CD24-CD38int hepatic B cell populations, I obtained age information from the majority of livers used in our cohort from a range of hepatic diseases. Results showed that contrary to the Buffa study where CD24- B cells increased with age in healthy blood, our CD19+CD24-CD38- and CD19+CD24- CD38int hepatic B cells significantly decreased with age, demonstrating an inverse correlation (Fig. 31). This difference in observation could be due to the fact that unlike in the Buffa study, the ages of the patients in this cohort study do not exceed aged 8, and only four patients in this study cohort representative of younger donors below the age of 3. In the future, it would be interesting to see if separating this cohort into separate diseases would highlight any correlation between age and CD24- B cell proportions. Nonetheless, this Buffa study sparked our interest in ABC populations. Since then, there have been numerous reports on ABCs, which have no reference to CD24 expression. Although ABCs were discovered in aging, they can also be found in the
206 young (479). They respond poorly to BCR and CD4 ligation and are instead stimulated by TLR ligation (479). As well as also accumulating with age, they have a unique phenotype in humans (CD19+CD11c+CD8/86hiT-bet+CD21-CD23-IgD-), and are mainly characterized by their high T-bet expression, which in B cells has recently been discovered as being pivotal in controlling chronic viral infection (479, 48) (497). ABCs are not to be confused with exhausted B cells. A large proportion of the published CD21low B cells which are postulated to be exhausted B cells, have been shown to contain a CD24-CD38- B cell population (485). This prompted our investigation into determining whether the phenotype of exhausted and ABCs correlated with our CD19+CD24-CD38- and CD19+CD24-CD38int liver enriched B cell population. Our results showed that B cells isolated from chronic liver disease patients contained the ABC phenotype across three antigen stain panels combination, which all mostly mapped onto the CD24-CD38int B cell population (Fig. 32B). This was assessed further quantitatively, where the percentage of ABCs across B cell subsets was analysed in diseased liver and healthy blood samples (Fig 34). B cells with the markers CD21-CD11c+Tbet+ were enriched in hepatic CD24- CD38int and CD24-CD38- B cells compared to transitional B cells, and hepatic and CD8+Tbet+ markers were enriched significantly on CD24-CD38int B cells compared to transitional and memory B cells. This data implied that ABCs were enriched in the CD24-CD38int subset. Conversely, it seemed that ABCs in blood were enriched in the CD24-CD38- populations, where the percentage of CD21- CD11c+Tbet+ and CD23-Tbet+ B cells were significantly enriched in CD24-CD38-
207 populations compared to both naïve and transitional subsets (Fig. 34). This further highlights the differences in the B cell compartment between blood and liver. Besides previous studies showing that exhausted human B cells and ABCs share many antigen markers, the two can be differentiated as exhausted human B cells are CD23+ and ABCs contain positive to high T-bet expression (483). Figure 33 shows that B cells with exhausted B cell markers also appear to be present in the CD24- CD38int B cell compartment, suggesting that this subset contains a mixed population of B cells which represents both exhausted and age associated B cells. Quantitatively speaking, the main markers for B cell exhaustion (CD21lowCD11c+IgD-) replicate the findings of ABC enrichment within the CD24- CD38int compartment. This was further confirmed by the significantly higher percentage of CD8hi B cells, another B cell exhaustion marker enriched within the CD24-CD38int hepatic B cell subset compared to naïve and transitional B cells (Fig. 35). In healthy blood, the confinement of exhausted B cells to a particular B cell subset is unclear, with exhaustion markers showing significant enrichment in CD24- CD38-, CD24-CD38int and plasmablast/plasma cell subsets. Figure 36 assisted in mapping exhausted B cells and ABCs to a particular subset within blood and liver, whilst also highlighting any possible associations of these populations with disease pathogenesis. A large proportion of ABCs were contained in the CD24- B cell compartment and this distribution differed between blood and liver. Differences in the ABC profile were also apparent between the four chronic immune-mediated damage livers (PBC/ALD, ALD/HCC and 2 PSC s) and two noninflamed livers (seronegative hepatitis and non-cirrhotic portal hypertension), where
208 those patients with more inflammation demonstrated a high ABC marker profile within the CD24-CD38int B cell population. In 2/3 patients suffering from nonimmune-mediated disease, ABC markers were enriched in the CD24-CD38- B cell population. In the case of exhausted CD21low B cells, the profile of these cells varied across B cell subsets in healthy donor blood. However, in PSC patients specifically, an enrichment of CD21low B cells was found within the hepatic CD24- CD38int subset, suggesting again that B cell exhaustion of CD24-CD38int B cells may be contributing to disease. Whether this contribution is protective or related to pathogenesis still remains to be elucidated, as previous studies have shown B cells to have both a pathogenic and inflammation dampening role in liver disease (399, 45, 498). Although our data shows that the quality of the exhausted B cell and ABC compartment differs between blood and liver, as well as between disease status, additional time would have allowed me to correlate both exhausted B cells and ABCs with disease severity. The collection of further patient numbers would help to address this. In order to investigate how CD24 was lost on hepatic B cells, and whether CD24 was lost due to the hepatic environment, co-culture assays were performed using PBMCs with liver stromal cells and cytokines. Results showed no downmodulation of CD24 on blood B cells following co-culture with stroma cells in vitro (Fig. 37 & 38). It is possible that functional differences exist between blood and liver CD24- B cells, thereby making it harder to induce CD24 loss from blood B cells. Future work could involve repeating these experiments with hepatic B cells. Furthermore, as the liver microenvironment is extremely complex, it is possible that another factor other than liver stromal cells and cytokines are inducing this downmodulation. Results from a
209 further experiment showed that CD24 is not internalized on hepatic B cells when its expression is downmodulated, as similar percentages of B cells expressed CD24 on the surface and intracellularly in total compared to the surface expressed antigen alone (Fig. 39). Since a known ligand for CD24 is P-selectin, it also is possible that CD24 is lost through ligand binding with P-selectin on platelets or liver vascular endothelium. Preliminary data from our lab shows CD24+CD79α B cells within blood vessels, with CD79αCD24- B cells surrounding the vessels on the other side (Data not shown). Going forward, future experiments could involve investigating loss of CD24 from B cells through platelet / primary liver endothelial cell transwell assays. Overall two CD24- B cell populations have been identified, which were enriched in human liver compared to blood. These CD19+CD24-CD38- and CD19+CD24-CD38- populations were heterogeneous and differed phenotypically from blood. Furthermore, these populations were found to differ phenotypically between end stage liver diseases. CD24-CD38- B cells were the only subset significantly increased in patients with PBC, both in absolute numbers and in proportions within the B cell compartment. Conversely, CD24-CD38int B cells were not increased in end stage disease compared to donor livers. Although not enriched in the livers of elderly patients, hepatic CD24-CD38int B cells were enriched with ABC and exhausted B cell markers. The role of both these CD24- B cell populations in liver inflammation remains to be defined.
210
211 5.1. INTRODUCTION In Chapter 4, a greater proportion of CD24-CD38- and CD24-CD38int B cells were detected in livers compared to peripheral blood (Fig. 26A&B). Phenotyping of CD24- B cells has shown that liver CD24- B cell populations contained different frequencies of naïve and memory markers compared to matched blood and lymph nodes (Fig. 27B & 28). The localization of CD24- B cells in the liver remains to be elucidated, and would provide insights into the potential role of CD24-B cells in liver inflammation. Little is known about the functional role of CD24- B cells in liver, however past studies have shown that CD24-CD38- B cells were enriched in the blood of aged patients and were pro-inflammatory, as they produced high levels of TNF-α but not IL-6 or IL-1 (477). I found that CD24- B cells in the liver may be representative of a disease-relevant population, as their numbers were significantly enriched in endstage PBC explants compared to liver samples from other disease aetiologies and healthy donors (Fig. 29A). Previous studies in mice have shown that B cells were able to regulate inflammation in the inflamed gut via the release of IL-1 (72), and that TNF-α and IL-6-producing B cells could exacerbate inflammatory conditions and autoimmune pathologies, including rheumatoid arthritis and inflammatory bowel disease (499-51). Furthermore, it has recently been shown in mice that activated B cell-mediated inflammatory responses had pathogenic consequences for the liver, through the induction of inflammatory cytokines such as IFN-γ and TNF-α (394). However, it has not been reported if liver CD24- B cells specifically secrete TNF-α and IL-6 and it is
212 unknown if CD24- B cells are important in promoting or alleviating chronic liver injury. I therefore wanted to assess the cytokine production of CD24-CD38- and CD24- CD38int B cells in end stage liver diseases, by measuring the production of immunomodulatory cytokines TNF-α, IFN-γ and IL-6 and IL-1 following stimulation. Cytokine production from stimulated B cells was compared to unstimulated CD24- B cells isolated directly ex-vivo from the liver, CD24+ hepatic B cell subsets (transitional, naïve and memory B cells), as well as CD24- B cells in the blood. This line of investigation aimed to establish whether our CD24- hepatic B cells also contribute to the regulation of inflammation in the liver. I wanted to address the above points to understand B cell activation and function in the liver, by defining how liver B cell subsets respond to stimulation. Cytokine production is a valid readout for B cell stimulation and would provide information on the ability of liver B cells to regulate the immune response. Studies indicate that B cells produce immunomodulatory cytokines depending on their environment and method of stimulation (See 1.3.) (8, 52-54). For example, the presence of cytokines such as IL-2, IL-4, IL-1, IL-21, are critical in different types of human B cell activation and differentiation (54-57). In addition to cytokines, engagement of CD4 and the BCR on B cells by CD4L and the TCR expressed by activated CD4 + T cells is essential for B cell stimulation, resulting in TNF-α and IL-6 production from memory B cells, and IL-1 production from naïve B cells (58). As well as being activated through the conventional methods of CD4/BCR ligation, B cells can also be activated via TLRs (54, 63, 75, 86, 284). Both methods are known to induce B
213 cell cytokine production. However, B cell cytokine secretion differs according to the type of TLR stimulation. For example, TLR9 stimulation can specifically activate naïve B cells to produce IL-1 (54, 92), and engagement of TLR4 on B cells can cause decreased IL-1 production in inflammatory disease patients coupled with increases in pro-inflammatory cytokine production (67, 59). The study on CD21-/lo ABCs in human blood highlighted that CD24-/lo cells within this population couldn t be stimulated by just BCR/CD4, but also required IL-2 and TLR7/8 to proliferate and differentiate into plasma calls in vitro, although cytokine production was not detected in this study (485). Little is known regarding the role of B cells in the modulation of liver inflammation. I decided to characterize the effects of TLR4, TLR7, TLR9, RP15 and CD4/BCR stimulations on cytokine production from hepatic B cell subsets in vitro, with a focus on CD24- B cells. Detailed information of hepatic B cell activation via TLRs may lead to a better understanding of B cell involvement in chronic liver disease. Furthermore, understanding the effects of TLR stimulation on hepatic B cells would further highlight if they differ functionally to blood, and whether they contribute to a proinflammatory hepatic environment. This would also help to address our knowledge on whether B cell responses are dampened in the liver. Chapter objectives. To understand the function and role of CD24- B cells in liver disease pathobiology, I designed experiments: 1. To map the localization of CD24- B cells in human end stage diseases using immunohistochemistry
214 2. To isolate CD24- B cells from blood and liver and establish their cytokine production profiles ex vivo by intracellular flow cytometry 3. To investigate the cytokine expression profiles of CD24- B cells from blood and liver following in vitro stimulations with BCR+CD4L, TLR4, TLR7 and TLR9 (with and without BCR stimulation) RESULTS I wanted to assess where CD24- B cells localised within the architecture of inflamed livers using immunohistochemical staining, as this could be indicative of a possible pathogenic role in end stage hepatic disease. In particular, this would indicate if CD24- B cells plays a role in liver damage in PBC, where bile ducts are damaged. Double IHC staining was used against the pan B cell marker (CD79α) and CD24 (as described in ), on sections of human liver tissue obtained from patients suffering from end stage liver diseases. Results in Fig. 4 demonstrated that CD24- B cells were located throughout the liver architecture in end stage chronic liver disease patient tissue. CD24- B cells were found within the fibrotic scar tissue and surrounding bile ducts in PBC patients in the examples shown, suggesting that CD24- B cells may play a role in disease pathogenesis of PBC.

 and surrounding (C) bile ducts (PBC) and (D) portal veins (PBC).")
.")

215 A B C D Figure 4 CD24- B cells were located throughout the liver architecture. IHC images from patients suffering from end stage liver diseases. CD24- B cells were located amongst (A) hepatocytes (PSC), in the (B) fibrotic septa (PBC) and surrounding (C) bile ducts (PBC) and (D) portal veins (PBC). B cells were stained with pan B cell marker CD79α (red/brown) and with CD24 (black). Full tissue slides were then scanned using the ZEISS Axio scanner using a X2 objective. B cells with CD79α brown stain alone represents the CD24- B cell population highlighted by white arrowheads CD24+ B cells are highlighted by the black arrowheads.
216 In order to assess whether the distribution and proportion of CD24- B cells correlated with disease specificity, the frequency of CD79α+CD24- B cells was scored semiquantitatively throughout the liver architecture (Fig. 41). All liver sections were stained using anti-cd24 and anti-cd79α mab, (as described in ), following which all sections were scanned using the ZEISS Axio slide scanner using a x2 objective. CD79α+CD24- B cells were scored using semi-quantitative analysis ranging from not found (NF) to (5+), with higher scoring values indicating that a more enriched population of CD79α+CD24- B cells were located within that region of the liver section. Results from Fig. 41 demonstrated that all liver disease cohorts contained patients with CD79α+CD24- B cell populations within portal areas and around vessels. It was also apparent that in inflammatory liver diseases (excluding donor livers), CD79α+CD24- B cells were frequently identified along the fibrotic septa. In support of our flow cytometry findings (Fig. 29 & 3), PBC patients scored the highest for the presence of CD24- B cells, which were relatively equal in distribution across portal, fibrotic, lobular and vesicular areas within the liver. HCV, and ALD patients additionally contained a large but homogenous distribution of CD79α+CD24- B cells compared to other liver diseases. Conversely, it was the donor and HBV livers that demonstrated a more heterogeneous distribution of the CD24- B cell population, as most of these patients had a single location in the liver where CD79α+CD24- B cells were enriched (5% or more). For example, 5% of donor livers displayed positive expression of CD79α+CD24- B cells located around portal areas. PBC, HCV and ALD patient cohorts were consistently the most plentiful
217 in CD24- B cells throughout their livers, whereas few NASH patients showed incidence of CD24- B cells. These data indicate that the distribution of CD24- B cells may vary with liver disease aetiology. Figure 41 Patient variation exists in the distribution of CD79α + CD24 - B cells across various liver diseases. Cumulative percentages (%) of patients positive CD79α+CD24- B cells found in the fibrotic septa (blue), B cell aggregates (red), portal areas (green), near vessels (purple) or within liver lobules (teal) in the liver diseases indicated. n=1 patients per disease, apart from PBC n=9 and AIH and HBV where n=8. All liver sections were stained using anti-cd24 and anti- CD79α, using the optimised double IHC protocol (2.5.2.). All 3uM thick sections were scanned using the ZEISS Axio slide scanner using a x2 objective. CD79α+CD24- B cells were scored using semi-quantitative analysis from not found (NF) to (5+), with a higher scoring value indicative of a higher population of CD79α+CD24 - B cells located within that region of the liver section.
218 Fig. 41 demonstrated that CD24- B cells were located in various anatomical sites in end stage liver disease. However, in order to establish the specific localization of CD24-CD38- or CD24-CD38int, a triple stain was performed with the assistance of experienced immunohistochemist Dr. Gary Reynolds (Fig. 42). CD24-CD38- B cells localized preferentially in B cell aggregates, sometimes in the region of hepatic bile ducts. Literature has previously described GC B cells as CD24- CD38int (488, 51). However, here we show that the hepatic CD24-CD38+ B cell populations are not GC B cells as they are excluded from the CD24-CD38- B cell aggregates. Instead, CD24-CD38+ B cells were tightly associated with the biliary epithelia, and within the fibrotic tracts of end stage liver diseases, and were excluded from these aggregates. The close association of CD24- B cell subsets with damaged bile ducts and B cell aggregates may indicate a role in liver disease pathogenesis.

 in end stage liver disease (PBC).")
 in the region of bile ducts (x5) (B) around bile")
219 Figure 42 CD24-CD38+ B cells were located around liver bile ducts and along the fibrotic tracts, however CD24-CD38- B cells were found within aggregates in PBC. Triple IHC staining to locate CD24-CD38- (white arrows brown cells) and CD24-CD38+ B cells (black arrows brown and green cells) in end stage liver disease (PBC). Anti-CD2+ B cells (red/brown), CD24 (black), CD38 (green). Location of CD24-CD38+ and CD24-CD38- B cells (A) in the region of bile ducts (x5) (B) around bile ducts and within aggregates and (x1) (C) in aggregates and fibrotic tracts (x5) in end stage hepatic disease livers.
220 CD24 downmodulation is known to occur on activated B cells, such as those undergoing the GC reaction marker (488). I wanted to establish whether CD24- B cells located within the liver were similar to activated CD24- GC blast B cells. In order to investigate the aggregate distribution of these cells, I performed a double IHC stain (as described previously in ) in human tonsil tissue and human chronic liver diseased tissue. Fig. 43 shows that CD24- B cell aggregate in chronic liver disease were surrounded by CD24+ B cells. The CD24- B cell aggregates in liver is similar in appearance to those found in the GCs of human tonsil, where CD24- B cells, representative GC B cells, were surrounded by CD24+ B cells.


 and")


221 Figure 43 Diseased liver contains CD24- B cell aggregates surrounded by CD24+ B cells, which appear to look similar to those aggregates located in human tonsil. B cells in human tonsil and diseased (PSC) liver were double stained with pan B cell marker CD79α (brown) and with CD24 (black). CD24- B cells are highlighted by white arrowheads, whereas CD24+ B cells are highlighted by black arrowheads. Populations of B cells within the dotted gate represents where the majority of CD24- B cells aggregate. Full tissue slides were then scanned using the ZEISS Axio scanner using a X2 objective. Cells with the CD79α brown stain alone represents the CD24- B cell population.
222 Next, I wanted to assess whether CD24-CD38- and CD24-CD38int B cells proliferated more or less than other B cell subsets upon activation. To do this I stimulated hepatic B cells for 5h with CpG, PMA and ionomycin, and stained for the nuclear protein Ki67, which is a known cell proliferation marker (511) (as described in 2.4.6). To confirm whether CD24- B cells proliferated in the liver, an IHC triple stain was also performed on human chronic diseased liver tissue sections for CD79α (red), Ki67 (green) and CD24 (black) as described in Results from Fig. 44A demonstrated that stimulation with CpG/PMA/Ionomycin did not increase proliferation in B cell subsets beyond in vivo levels. In both stimulated and unstimulated treatment groups, plasmablast/plasma cells (stimulated: 48.8±28.8% unstimulated: 3.9±22.9%) demonstrated the highest proliferation, which was significantly higher than memory B cells (stimulated: 3.5±2.3% unstimulated: 1.1±1.5%, where p=.7 and p=.5 respectively). Furthermore, stimulated plasmablast/plasma cells were also found to proliferate at a significantly higher level than naïve B cells (naive: 1.9±1.5% where p=.2). CD24-CD38int B cells demonstrated the next highest percentage of proliferation, presenting significantly higher percentages of Ki67 compared to memory B cells in both unstimulated and stimulated groups, (CD24-CD38int stimulated: 27.3±12.1% and CD24-CD38int unstimulated: 16.6±11.7% where p=.4 and p=.2 respectively). These data were corroborated by IHC staining for Ki67. Fig. 44B, demonstrates that CD24- B cells in chronic liver disease showed evidence of Ki67+ proliferating cells. The frequencies of Ki67+ cells were not as high as described for GC centroblasts (Figure 24 with ALD GC B cells).
 Percentage (%) Ki67 expression in unstimulated and stimulated (5h, CpG/PMA/Ionomycin) hepatic B cell subsets.")
223 %Ki67 expression * ** * * *** Transitional Naive Memory PB/PC CD24-CD38- B cells CD24-CD38int B cells d G Figure 44 Hepatic CD24-CD38int B cells proliferate significantly more than memory B cells before and following stimulation. (A) Percentage (%) Ki67 expression in unstimulated and stimulated (5h, CpG/PMA/Ionomycin) hepatic B cell subsets. Error bars represent the mean and standard deviation, where n=6. Statistical differences were calculated with a Kruskal-Wallis test, corrected for multiple comparisons (Dunn s), where p<.5*, p<.5**, p<.1***. (B) Triple IHC stain performed on chronic diseased liver to demonstrate the proliferation of CD24-B cells. Cells were stained with CD79α (red), Ki67 (green) and CD24 (black) as described in White arrowheads demonstrate proliferating CD24+ B cells (CD79α +CD24+Ki67+ - red, black & green) and black arrowheads demonstrate the proliferating CD24- B cells (CD79α +CD24-Ki67+ - Red & green)
224 I wanted to investigate whether CD24- B cells could be generated in vitro, and if so, whether blood B cells generated would resemble liver CD24-B cells. Blood B cells from healthy donors were stimulated for 5 days with CD4L and anti-bcr and stained at Day and Day 5 post-stimulation for CD19, CD24, CD38, CD27, IgD and IgM as described in Figure 45A shows that when blood B cells were stimulated for 5 days through CD4 and the BCR, they became activated blasts and therefore lost expression of CD24. Fig. 45B further demonstrates that even following stimulation, these activated blood CD24- B cells contained both memory and naive populations, of which the naïve population was significantly larger (CD24-CD38- naive: 44.7±1.3 CD24-CD38- memory: 1.4±3. where p=.7 and CD24-CD38int naive: 66.7±24.3 CD24- CD38int memory: 6.9±6.3 where p=.3). These CD24- B cells do not change profile upon stimulation, and on day 5, the percentage of memory and naïve B cells remain similar to unstimulated CD24-CD38- and CD24-CD38int B cells on day. Conversely, Fig. 45C demonstrates that hepatic CD24- B cells (from PBC) differed from both naïve and memory B cells, where CD24-CD38- B cells contained fewer IgM+IgD+ B cells than naive and more than memory, and CD24-CD38int B cells generally contain more IgM+IgD+ B cells than both naïve and memory B cells from the same patient. This indicates that activated CD24- blood B cells generated in vitro differ from hepatic CD24- B cells isolated directly ex vivo.
225 A 1. CD24- CD38- B cells 2. CD24- CD38int B cells CD CD B % CD24-CD38- B cells * Untreated (D) * CD4L+αBCR (D5) % CD24-CD38int B cells * * Naive (IgM+IgD+) Memory (CD27+IgD-) Untreated (D) CD4L+αBCR (D5) C 8 1 % IgD+IgM+ cells % IgD+IgM+ cells e s y e s y Figure 45 CD24- B cells can be generated in vitro, however they did not resemble hepatic CD24- B cells regarding CD27 and IgD expression. (A) Flow plots demonstrating increased downmodulation of CD24 on blood B cells following 5- day stimulation with anti-cd4 and anti-bcr (IgM/IgD) in culture. (B) Bar graph demonstrating the phenotypic profile (naïve or memory) of CD24- B cells before and after 5 day stimulations in culture (n=4). One t test per row was performed to assess significant differences between the proportion of naïve and memory subsets in CD24- B cells within each treatment group, where p<.5*. (C) The phenotypic profile of hepatic CD24-CD38- and CD24-CD38int B cells compared to naïve and memory subsets in the same livers. All donors were PBC suffers (n=8).
226 Understanding the cytokine production of CD24- B cells will give us a further indication as to whether this B cell subset may contribute to chronic disease and damage in the liver. To investigate this, I measured cytokine production of hepatic B cell subsets following stimulation with CpG, PMA and Ionomycin for 5 hours (See methods 2.4.5). This method has been used by several previous studies to activate B cells, in particular by Buffa et al. to stimulate CD24-CD38- B cells to induce cytokine production (72, 477). I hypothesized that CD24- B cells are proinflammatory and that activated B cells such as memory and plasma cells would also produce high levels of inflammatory cytokines compared to naïve subsets. Cytokine production of stimulated hepatic B cell subsets from LIMCs were compared to unstimulated hepatic B cell subsets post isolation. These experiments were also compared to stimulated and unstimulated peripheral blood B cells, to assess whether the functional characteristics of CD24- B cells differed between the liver and blood. Results in Fig. 46B indicate that both stimulated and unstimulated healthy blood B cell subsets did not produce large amounts of cytokines. In matched blood from chronic liver disease patients however, (Fig. 46C), peripheral blood B cells could be stimulated to produce higher levels of TNF-α across most B cell subsets. Hepatic CD24-CD38int B cells were found to demonstrate an inflammatory phenotype following stimulation (Fig. 46A&B). Although TNF-α percentages in
227 unstimulated and stimulated CD24-CD38int B cells were not significantly increased compared to other subsets, CD24-CD38int B cells produced significantly higher levels of IFN-γ compared to transitional, naïve and memory subsets, in stimulated and unstimulated samples respectively (CD24-CD38int: 35.6±28.6%, transitional:.8±.9%, naïve: 2.9±3.7% and memory: 2.8±5.8%, where p=3,.3 and.2 respectively) (CD24-CD38int: 16.±13.9%, transitional:.8±1.%, naïve: 1.8±2.5% and memory:.7±1.2%, where p=2,.5 and.4 respectively). Production of IL-1 also significantly increased following stimulation from CD24- CD38int B cells compared to naïve and memory B cells, (CD24-CD38int B cells: 11.7±9.2%, naïve: 2.6±3.6% and memory: 1.8±2.2% where p=.1 and.1 respectively), indicating that these cells may be also be involved in immune regulation. Of note, IL-1 producing cells co-expressed IL-6 and IFN-gamma, however they did not co-express TNF-alpha (data not shown). Fig. 46B also demonstrates that CD24-CD38- B cells in blood and liver produce very little TNF-α following stimulation by CpG, PMA and ionomycin compared to other B cell subsets, however in both liver and blood, TNF-α production is increased compared to unstimulated B cells. Fig. 46C demonstrates that CD24-CD38- B cells in matched blood and liver samples produced similar proportions of IL-6, IL-1, IFN-γ and TNF-α when stimulated and unstimulated. This pattern was replicated in the case of CD24-CD38int B cells in liver and blood, except for in the case of IFN-γ, where unstimulated and stimulated
228 hepatic CD24-CD38int B cells produced more IFN-γ compared to CD24-CD38int B cells in matched disease patient blood.
229 A Unstimulated Stimulated 6K 6K 4K 4K 2K 2K TNF-α 6K 6K 4K 4K 2K 2K SS FL 6 L Vi l t 1.5 IL FL 6 L Vi l t K 6K 4K 4K 2K 2K IFN-γ 6K 6K 4K 4K 2K 2K IL-6
230 IFNγ TNFα IL-6 IL-1 Healthy Blood Unstimulated Stimulated % Cytokine production Diseased Liver Unstimulated Stimulated 8 t l y C t l y C * t C t C t l y C t l C t l y C ** * ** ** * *** *** ** * ** * t l y C ** t l y C * *** ** * *** *** t l y C * * t l y C * * B
231 C Matched chronic liver disease patient blood & liver Unstimulated CpG + PMA 1 1 % Cytokine production CD24-CD38- CD24-CD38int Memory Naive Transitional PB/PC


 Example of cytokine production (IL-1, TNF-α, IFN-γ and")

 stimulated (CpG (TLR9), PMA and ionomycin) and")

232 D CD24-CD38- CD24-CD38int CD24-CD38- CD24-CD38int CD24-CD38- CD24-CD38int CD24-CD38- CD24-CD38int IFN-γ Liver Stimulated Unstimulated Stimulated Blood Unstimulated IFN-γ IFN-γ IL-6 IL-1 TNF-α IL-1 TNF-α Figure 46 The hepatic CD24-CD38int B cell compartment secretes more immunomodulatory cytokines compared to other B cell subsets and B cells in blood. (A) Example of cytokine production (IL-1, TNF-α, IFN-γ and IL-6) from unstimulated and stimulated liver CD24-CD38int B cells from a liver with PBC. Percentage (%) of IL-1, TNF-α, IFN-γ and IL- 6production from (B) stimulated (CpG (TLR9), PMA and ionomycin) and unstimulated hepatic B cell subsets including CD24- CD38- and CD24-CD38int B cells. Statistics could not be calculated as n=2. (D) IL-6 & IFN-γ, IL-1 & IFN-γ, TNF-α & IFN-γ, and TNF-α & Il-1 double cytokine production from unstimulated and stimulated B cell subsets from a matched liver and blood sample.
233 Fig. 46B demonstrated that CpG (TLR9), PMA and ionomycin was effective at stimulating CD24-CD38- B cells to produce significantly higher percentages of TNFα from liver and blood (where unstimulated CD24-CD38- B cells in liver: 2.4±4.5% and stimulated CD24-CD38- B cells in liver: 22.7±14.9%, p=.7) (unstimulated CD24-CD38- B cells in blood: 2.4±4.5% and stimulated CD24-CD38- B cells in blood: 22.7±14.9%, p=.3). The nature of TLR-activating stimuli on B cells dramatically influences B cell cytokine production (77, 92, 93). Understanding which methods of stimulation induce cytokine secretion from CD24- B cells and other major B cell subsets would assist in further establishing the significance, function and activation of B cells within the hepatic environment. Consequently, I wanted to investigate the effects of TLR stimulation on cytokine production of human hepatic B cell subsets, with particular focus on defining which stimuli were pivotal in the activation of CD24-CD38- B cells in blood and liver. Fig. 46D demonstrated that hepatic CD24-CD38int B cells contain a population, which secrete IFN-γ and IL-6 pro-inflammatory cytokines simulataneously. This effect is observed both directly exvivo and following stimulation (unstimulated: 55%, stimulated: 42%). This population is almost absent from CD24-CD38int B cells in matched patient blood (unstimulated: 1%, stimulated: 3%). Both stimulated and unstimulated B cells from matched patient liver and blood also contained a small percentage of cells which were able to simultaneously produce both pro- and anti-inflammatory cytokines IFN-γ and IL-1 (stimulated blood CD24-CD38-: 1%, stimulated blood CD24-CD38int: 3%, stimulated liver CD24-CD38-: 1%, stimulated liver CD24-CD38int: 3%) (Fig. 42D).
234 Fig. 47 demonstrated that cytokine production between blood and liver B cell subsets were different following stimulation with the same TLRs. For example, Fig. 47A demonstrated that TLR9 stimulation of hepatic naïve and memory B cells induced significantly higher TNF-α production compared to unstimulated naïve and memory B cells (stimulated naive 52.7±17.3% unstimulated naive: 9.8±6.3% where p=.1 and stimulated memory: 68.4±6.1% unstimulated memory: 1.±7.8% where p=.1). Furthermore, TLR9 stimulation of CD24-CD38- and CD24-CD38int B cells also induced significantly higher TNF-α production compared to unstimulated B cells belonging to the same subsets (stimulated CD24-CD38-: 57.7±16.7% unstimulated CD24-CD38-: 7.6±4.1% where p=.1 and stimulated CD24-CD38int: 37.7±18.3% unstimulated CD24-CD38int: 9.9±3.9% where p=.4). In blood, although TLR7 and TLR9 induced slightly higher TNF-α production as a trend across B cell subsets, no significant differences were found. Fig. 47 demonstrated that hepatic CD24-CD38- B cells were most responsive to TLR7 and TLR9 stimulation in regards to TNF-α production. TLR9 stimulation of memory and CD24-CD38- B cells in blood, induced a significantly higher production of IL-6 compared to unstimulated memory and CD24- CD38- peripheral blood B cells (Fig. 47C), further highlighting that hepatic and blood B cells may require different stimuli to induce cytokine production. IFN-γ and IL-1 (Fig. 47B & D) production does not differ significantly within B cell subsets following different TLR stimulations in comparison to unstimulated B cells, except for in the case of TLR9, which induced significantly higher IL-1 production from memory hepatic B cells compared to unstimulated (stimulated memory: 2.2±1.9% unstimulated memory:.25±.32% where p=.4), and TLR4 which also induced
235 significantly higher IL-1 production from naïve hepatic B cells subsets compared to unstimulated (stimulated naive: 6.4±7.9% unstimulated naive: 1.±.6% where p=.2).
236 d ) ) ) d ) ) ) d ) ) ) ) ) ) d ) ) ) d ) ) ) * ** * d ) ) ) * * A
237 ) ) d ) ) ) d ) ) ) d ) ) ) d ) ) ) ) ) ) d ) ) ) B
238 * * d ) ) ) ) ) ) d ) ) ) p d ) ) ) ) ) ) C
239 D d ) ) ) 5 d ) ) ) * ) * ) ) d ) ) ) Figure 47 TLR9 stimulates significantly higher TNF-α production compared to unstimulated B cells across naïve, memory, CD24-CD38- and CD24-CD38int hepatic B cell subsets. Percentage (%) of (A) TNF-α, (B) IFN-γ, (C) IL-6 and (D) IL- 1 production from peripheral blood and hepatic B cell naïve, memory, plasmablast/plasma cell, CD24-CD38- and CD24-CD38int B cell subsets stimulated with BCR + CD4L, LPS, R848 (TLR7 ligand), CpG (TLR9 ligand) and RP15 (TLR homologue). Untreated samples contained brefeldin alone, and all treated cells were stimulated for 5h with PMA, ionomycin and brefeldin. Error bars represent the mean and standard deviation, where n=5 for liver and n=4 for healthy blood. Statistical differences were calculated with a non-parametric one-way ANOVA (Kruskal-Wallis test), corrected for multiple comparisons (Dunn s)
240 Fig. 47 demonstrated the effects of TLR stimulations on individual B cell subsets in the liver. However, the data was replotted so that direct comparisons between hepatic and peripheral B cell subsets could be made (Fig. 48). Presenting the data this way would specifically allow us to compare cytokine secretion of blood and liver CD24- B cells following TLR stimulation compared to other activated and naïve B cells. Certainly, most hepatic and peripheral B cells contained populations capable of producing TNF-α following stimulation (Fig. 48A), providing a valuable internal control that B cell stimulations are effective and capable of inducing higher levels of cytokine production from B cell subsets compared to unstimulated subsets. In peripheral blood, TNF-α production increased following stimulation and was higher across B cell subsets stimulated with TLR9. TNF-α production did not vary significantly between hepatic B cell subsets following stimulation, and appeared to be relatively comparable to that from blood B cells stimulated in the same manner. Unstimulated CD24-CD38int and plasmablast/plasma cells produced significantly higher IFN-γ levels compared to memory B cells (CD24CD38int: 19.7±12.1%, plasmablast/plasma cells: 31.7±31.6% and memory:.7±.7% where p=.3 &.4 respectively). Following all stimulations except TLR9, IFN-γ production from hepatic plasmablast/plasma cells increased significantly compared to hepatic memory cells (plasmablast/plasma cells: 54.3±33.2%, 58.9±31.%, 55.5±28.3%, and 54.5±28.6, memory: 4.9±5.4%, 6.1±6.8%, 4.6±4.5%, and 3.2±4.8% where p=.3, p=.3, p=.2, and p=.3 for BCR/CD4, TLR4, TL7, TLR9 and RP15 respectively) (Fig. 48B). This was not the case for peripheral blood B cells, where IFN-γ
241 production was not significantly enriched in any subsets with or without BCR/TLR stimulation, highlighting that pro-inflammatory plasma cells / plasmablasts were present in the liver but absent from the blood. Both CD24-CD38- and CD24-CD38int hepatic B cells produced significantly higher levels of IL-6 compared to transitional B cells prior to stimulation (CD24-CD38-: 7.±4.6%, CD24-CD38int: 5.3±3. and transitional:.3±.6%, where p=.4 and p=.1 respectively) (Fig. 48C). Following stimulation via TLR4, TLR7 and TLR9, CD24-CD38int hepatic B cells alone produced a significantly higher percentage of IL-6 compared to transitional B cells (CD24-CD38int: 63.±33.9%, 6.8±32.8%, 63.±31.% transitional: 2.5±2.2%, 3.6±6.1%, 3.8±4.4% and p=.2 for TLR4, TLR7 and TLR9 respectively), highlighting that CD24-CD38int hepatic B cells may possess an inflammatory phenotype, which is another trend absent from blood CD24-CD38int B cells (Fig. 48C). As well as demonstrating pro-inflammatory qualities compared to some other hepatic B cell subsets, CD24-CD38int B cells were also found to produce significantly higher percentages of IL-1 following anti-bcr+cd4l, TLR7, TLR9 and RP15 stimulation compared to memory populations, (CD24-CD38int: 23.9±14.2%, 24.7±13.%, 21.4±1.% and 23.1±12.3% memory: 1.3±.5%, 2.3±3.2%, 2.2±1.9% and.9±.5% where p=.8,.2,.1 and.2 for anti-bcr+cd4l, TLR7, TLR9 and RP15 respectively). This was also the case for activated plasmablast/plasma cell hepatic B cells, (plasmablast/plasma cells: 2.9±1.4%, 3.±16.8%, 29.±24.5% and 24.±13.3%, where p=.7,.2,.3 and.1 for anti-bcr+cd4l, TLR7, TLR9 and RP15 respectively). In blood, CD24-CD38int B
242 cells did not produce significantly higher levels of IL-1 following stimulation compared to other B cell subsets. Hepatic CD24-CD38int B cells therefore may be more responsive to stimulation compared to blood CD24-CD38int B cells (Fig. 48D).
243 l C t p C t l e y C t C t p l C t C t C t l C t A
244 l C t C t l C t γ * * l e y C t * * * C t * ** * * l C t ** * B
245 l C t *** * l C t l C t * ( ) * l C t % IL 6 expression * l e y C t p * * C t l e y C t p l C t C t C
246 D l y C t p ** ** C t l e y C C t t p l * * C t * * l C t l C t p ** ** 2 2 Figure 48 Hepatic CD24-CD38int B cells produced significantly higher levels of IL-6 compared to transitional B cells following TLR stimulation. Percentage (%) of (A) TNF-α, (B) IFN-γ, (C) IL-6 and (D) IL-1 production from peripheral blood and hepatic B cell subsets stimulated with BCR + CD4L, LPS, R848 (TLR7 ligand), CpG (TLR9 ligand) and RP15 (TLR homologue). Untreated samples contained brefeldin, and treated cells were stimulated for 5h (contained PMA, ionomycin and brefeldin). Error bars represent the mean and standard deviation, where n=5 for liver and n=4 for healthy blood. Statistical differences were calculated with a nonparametric one-way ANOVA (Kruskal-Wallis test), corrected for multiple comparisons (Dunn s).
247 Fig. 32 & 34 indicated that CD24-CD38int B cells may contain ABC type B cells. In line with the possibility that CD24- hepatic B cells could contain a majority ageassociated B cell population, I decided to stimulate hepatic B cells with TLR7 stimulation ±IL-21, IFN-γ and ±anti-cd4/bcr. These are the proposed methods of ABC generation according to the literature (479, 512). To assess activation of these B cell subsets, particularly CD24-CD38int B cells, I measured the percentage of IL- 1, IL-6, TNF-α and IFN-γ cytokine produced (Fig. 49). Fig. 49 showed that none of the hepatic B cell subsets demonstrated significantly different cytokine production with TLR7, TLR7+IL-21 or TLR7+IFN-γ stimulation in the presence or absence of CD4/BCR stimulation. Additionally, in terms of IL-6, IL- 1 and IFN-γ (Fig. 49 B D) cytokine production, blood plasmablasts/plasma cells were more unresponsive to TLR7, TLR7+IL-21 and TLR7+IFN-γ compared to hepatic B cells. Similarly, hepatic CD24-CD38int B cells showed higher IL-6 production (Fig. 49C) in the presence and absence of TLR7, TLR7+IL-21 and TLR7+IFN-γ stimulation compared to blood CD24-CD38int B cells, as well as other liver B cell subsets. Although this increased IL-6 production was not found to be stimulation specific, these data highlighted the pro-inflammatory capacity of this subset in the liver, which was absent from blood.
248 d ) d ) 1 γ d ) αbcr/cd4 +αbcr/cd4 d ) d ) d ) d ) 1 γ A
249 d ) d ) d ) 1 γ γ p d ) 1 γ d ) 1 γ αbcr/cd4 +αbcr/cd ) ) d ) d ) B
250 d ) 1 γ d ) 1 γ d ) d ) p αbcr/cd4 +αbcr/cd C
251 D -αbcr/cd4 +αbcr/cd p d ) 1 γ d ) 1 γ p d ) 1 γ ) d d ) ) p p d d ) ) 1 γ p d ) 1 γ Figure 49 TLR7 did not induce increased cytokine production from hepatic CD24- B cells ±IL-21, IFN-γ or ±BCR/CD4 stimulation compared to unstimulated B cells. Percentage (%) of (A) TNF-α, (B) IFN-γ, (C) IL-6 and (D) IL- 1 production from peripheral blood and hepatic B cell subsets stimulated with TLR7, TLR7+IL-21 and TLR7+IFN-γ in the presence and absence of CD4/BCR stimulation. Untreated samples contained brefeldin alone. All treated cells were stimulated for 5h and also contained PMA, ionomycin and brefeldin. Error bars represent the mean and standard deviation, where n=5 for liver and n=4 for healthy blood. Statistical differences were calculated with multiple t tests.
252 5.3. DISCUSSION CD24-CD38- and CD24-CD38int B cell subsets were identified in the liver during phenotypic characterization of hepatic B cells. The next step was to functionally elucidate these populations to identify the potential role of these subsets in chronic liver disease. Mouse studies have shown that T cell responses are dampened in the liver (273, 274), which I hypothesise may also be the case for hepatic B cells. To address these points, I set out to characterize the localization and cytokine production of major B cell subsets in the liver, including the CD24- B cell population. To investigate the significance of CD24- B cells in liver disease pathogenesis, I stained for CD24- B cells (CD79α+CD24-) to establish where they localized within the liver architecture (Fig. 4). CD24- B cells were found throughout the liver, surrounding bile ducts and portal veins, and within the fibrotic scar tissue of chronically diseased livers, including PBC. It is possible that the aggregation of CD24- B cells around bile ducts and within fibrotic septa was an indication of their role in PBC, especially since the main hallmark of PBC is bile duct damage caused by inflammation (345, 513). Given that CD24-CD38- B cells were significantly elevated in PBC livers (Fig. 29), it was important to establish the specific localization of CD24-CD38- and CD24-CD38int B cells in the liver, to further elucidate their functional role. A preliminary triple stain was performed with the help of Gary Reynolds (Fig. 42), which showed that CD24-CD38- B cells aggregated in the region of bile ducts and fibrotic tracts (Fig 42B & C), excluding the CD24-CD38+ B cell population. Literature states that ABCs lack CXCR5, the chemokine receptor involved in B cell aggregation (479). The lack of aggregation found within the hepatic
253 CD24-CD38+ B cell population, further adds to the possibility that CD24-CD38int population could be an ABC-like population. The localization of CD24-CD38- B cells in the region of bile ducts and fibrotic tracts implies that this population may be representative of a more activated population in inflamed livers. Figure 29B in Chapter 4 supports this by highlighting that CD24- CD38- B cells contain a significantly higher proportion of IgG class switched cells in PSC livers compared to viral livers. The triple stain also revealed that CD24-CD38+ B cells aggregated around bile ducts and within the fibrotic tracts in PBC livers. AMAs are known to be involved in bile duct damage in PBC (345, 349); therefore it is possible that this CD24-CD38int B cell subset in the liver may be involved in PBC disease pathogenesis. To further investigate whether distribution of CD24- B cells in the liver correlated with disease specificity, the frequency of CD24- B cells throughout the liver architecture were semi-quantitatively scored (Fig. 41). Results corroborated previous flow data in Chapter 4, demonstrating that PBC patients contained a higher frequency of CD24- B cells compared to other hepatic diseases, and that this B cell population was distributed relatively equally in PBC across fibrotic septa, portal areas, vessels and within lymphoid aggregates. Lymphoid aggregates have previously been found to be enriched in PBC (514), which was also supported by our aggregate data in Fig. 23, where their role remains uncertain. It is speculated that similar to tertiary lymphoid follicles in rheumatoid arthritis, lymphoid aggregates might provide an environment in which self-antigens can be presented and antigen-specific T cells can be activated, enabling the propagation of autoimmunity (223). Given that CD24- B cells are
254 present in lymphoid aggregates in PBC (Fig. 41), it is possible that they may somehow contribute to this proposed function. How the composition of lymphoid aggregates in the context of PBC differs from ectopic lymphoid structures found in chronic HCV infection where CD24- B cells are also found to be present, and how this affects the lymphoid structure function is not clear. It is also possible that CD24- CD38+ B cells are involved in PBC disease pathogenesis directly via cytokine/ab production or indirectly by attracting other immune cells to cause damage. PBC patients harbored over twice as many CD24- B cells in the liver compared to the other autoimmune disease cohort of AIH patients, which had similar CD24- B cell percentages to donor livers (Fig. 41). It is possible that the addition of more patient numbers to this study may highlight further differences between these disease cohorts, giving further indication to the role of CD24- B cells within the liver in the presence of chronic disease. Studies have shown that early ontogeny B cells express high levels of CD24, a marker whose expression precedes that of the pan B cell marker CD19 (462, 515). As these B cells leave the bone marrow as transitional B cells, their development into naïve B cells and consequent antigen-induced activation into GC blasts, correlates with downregulation of surface CD24 expression (455, 488, 516). In order to investigate whether CD24- hepatic B cells resembled activated GC B cells, human tonsil and liver sections were stained and compared for pan B cell markers CD79α and CD24. Results from Fig. 41 demonstrated that in both liver and tonsil, CD24- B cells aggregated, and in both cases were surrounded by what appeared to be a halo of CD24+ B cells, indicating a possible GC in both the liver and tonsil. For
255 confirmation that CD24- B cells were an actively proliferating population, I stained for the proliferation marker Ki67 following 5 hour stimulation of B cells with anti- BCR/CD4L (Fig. 44A). Our experiments showed that both before and following stimulation, CD24-CD38int B cells, proliferated significantly more that memory B cells, but less than plasmablast/plasma cell populations, and that proliferation increased slightly across all B cell subsets following activation into blasts. These data was again indicative that this particular CD24- population might be a GC subset. CD24-CD38- B cells showed little if any proliferation following B activation at 5 hours, further implying that this subset is different to the CD24-CD38int B cell population, is harder to stimulate and most likely is not comparable to the CD24- B cells that were observed in human tonsil. I was able to corroborate my CD24- CD38int B cell data using IHC (Fig. 44B), which showed that some CD24- B cells also co-expressed the proliferation marker Ki67. In order to understand whether CD24- B cells could be generated in vitro, and whether CD24- B cells generated in vitro are comparable to liver CD24- B cells, blood B cells were assessed for CD24- B cell expression at day, then activated into B cell blasts as described in Fig. 45 demonstrated that although CD24 downmodulation of blood B cells could be induced following stimulation, the phenotypic profile of both CD24-CD38- and CD24-CD38int blood B cells did not shift to show a more activated memory phenotype prior to or following stimulation, and instead remained mainly naive. This result differed to what is reflected in the hepatic environment, where CD24-CD38- liver B cells ex vivo had an intermediate phenotype between naïve and memory cells, and CD24-CD38int B cells presented with a higher proportion of IgM+IgD+ B cells compared to memory cells. This did not
256 only contradict recent literature describing blood CD24- B cells in general as a type of memory B cell population (477), but also confirmed that CD24- B cells could not be generated from blood to represent hepatic CD24- B cells in our experiments, as these differ in IgD/CD27 expression. B cells have previously been found to contribute to hepatic diseases such as PSC and PBC (3, 417) (225, 517) (355, 378), where B cells have been found to have an autoimmune function and secrete autoantibodies. B cells have also been implicated in viral infections such as HBV and HCV (292, 4), where B cell markers have been associated with levels of fibrosis and B cells have served as a reservoir for persistent hepatitis C virus infection. In such cases, treatments such as rituximab have been used, resulting in a knock out of total B cells using anti-cd2 monoclonal antibodies (41). By characterizing the contribution of B cell subsets to end stage hepatic disease, I will be able to effectively target the knock out of specific B cell subsets, which contribute to immune inflammation and disease pathogenesis within the liver. I decided to investigate the function of major B cell subsets in the liver, by identifying their cytokine secretion profiles. This will indicate how B cells may exacerbate or dampen hepatic immune responses. The Buffa study (213) identified a population of CD24-CD38- B cells expanded in chronic stimulation states and enriched in the blood of elderly patients. This population was labeled as a new memory B cell population (477), which secreted significantly higher TNF-α compared to unstimulated B cells following stimulation with CpG/PMA. This study suggested that CD24-CD38- B cells played an inflammatory role in aged patient blood. However this study did not go on to define
257 TNF-α, IFN-γ, IL-6 and IL-1 production from major B cell subsets or demonstrate any comparative data. I found that memory B cells in the blood differ to hepatic memory B cells (Fig. 19), and reports show that specific B cell subsets are susceptible to variable forms of stimulation (8, 81, 394). Studies have also shown that T cell responses are dampened in the liver (273, 274), which may also be the case for hepatic B cells, given that that the liver is a tolerogenic organ. More recently, the frequencies of CD19+CD24-CD38- B cells were found to be significantly enriched in atopic dermatitis patients compared to psoriasis patients and healthy individuals, suggesting that these B cells may play an important role in promoting inflammation, although these frequencies did not correlate with disease severity (478). I wanted to assess whether the hepatic CD24-CD38- and CD24-CD38int B cell populations, which I identified, were similar to the CD24- B cells described in the Buffa paper. Furthermore, I wanted to compare cytokine production of B cell subsets across hepatic diseases following B cell stimulation via BCR/CD4 and TLRs. Several TLRs have been reported to be present in B cells (518) which trigger cytokine stimulation upon ligation (519). Cognasse et al. previously reported secretion of IL-6 by TLR9 expressing memory B cells (52). Additionally, Buffa et al. stimulated B cells using CpG/PMA to induce TNF-α production from CD24-CD38- B cells (477). I decided to use the same method to investigate hepatic B cell activation and cytokine production of IL-6, TNF-α, IL-1 and IFN-γ via flow cytometry. Fig. 46B demonstrates that stimulation with CpG/PMA was effective at stimulating hepatic B cell subsets, as TNF-α production was higher from B cells post-stimulation. Supportive of the Buffa findings, directly ex-vivo, CD24-CD38int hepatic B cells
258 demonstrated an inflammatory phenotype which was increased upon stimulation, where this population produced significantly higher levels of IFN-γ compared to most other B cell subsets and significantly higher levels of IL-6 compared to naïve and memory subsets. Considering I showed that CD24-CD38+ B cells cluster around bile ducts in PBC, it is possible that this B cell population causes immune damage by contributing to elevated inflammatory responses in PBC patients, or by propagating direct or indirect inflammatory-mediated destruction of bile ducts by attracting other immune cells, further driving the characteristic bile duct damage seen in PBC. CD24- CD38int B cells from the liver also demonstrated anti-inflammatory properties, by producing significantly higher levels of IL-1 compared to transitional and memory B cells directly ex vivo when unstimulated. This increase in IFN-γ, IL-6 and IL-1 cytokine production from hepatic CD24-CD38int B cells following stimulation was not observed in healthy blood, where all B cell subsets maintained low cytokine production both prior to and following stimulation. This contradicts previous studies, where peripheral blood B cells stimulated by CpG produced IL-1 levels between 12 2% (69, 93). This is with the exception of TNF-α, which increased across peripheral B cell subsets following stimulation. Previous studies showed that MZ B cells secreted IL-1 in response to LPS (TLR4) and CpG (TLR9) (77). Since the hepatic CD24-CD38int B cell population contains a human MZ population (Fig. 27), it is possible that this B cell subset was activated in the same way to modulate immune responses in the liver. Duddy et al., using the BCR and CD4 signaling system, showed that memory B cells produce TNF-α and lymphotoxin (TNF-β) (58), so it is also possible that hepatic CD24- B cells are activated by T cell-dependent mechanisms. Fig. 46D demonstrated dual pro-inflammatory cytokine production from stimulated (CpG/PMA/Iono) and unstimulated CD24- B cells in a matched liver
259 and blood sample from an ALD patient. Results demonstrated the hepatic CD24- CD38int hepatic B cells contained a population which secreted both IFN-γ and IL-6 cytokine, directly ex-vivo (55%) and following CpG stimulation (42%). This population was not enriched in CD24-CD38 B cells. One study has shown that subsets of CD24hiCD38hi transitional B cells, CD24hiCD27+ memory B cells, and naïve B cells from human peripheral blood, expressed IL-1 and the proinflammatory cytokine TNF-α simultaneously (521). Furthermore, this study highlighted that neutralization of IL-1 significantly inhibited transitional B cell-mediated suppression of autologous Th1 cytokine expression, and that blocking TNF-α increased the suppressive capacity of both memory and naïve B-cell subsets. The study thereby concludes that the ratio of IL-1/TNF-α expression may be a better indicator of regulatory function than IL-1 expression alone (521). Although neither liver nor blood CD24- B cells expressed IL-1/TNF-α simultaneously, it appears from Fig. 46D that a small percentage of the CD24- B cell population in matched blood and liver are capable of expressing IL-1 and IFN-γ simultaneously. However, this percentage is extremely low, and no differences are observed in this dual cytokine production between CD24- B cells directly ex-vivo compared to following stimulation. Nonetheless, our data has shown that CD24-CD38int B cells are rich in ABC markers, and ABCs are known to co-express IL-1 and IFN-γ simultaneously (483, 484). It would be interesting to investigate the ratio of pro-inflammatory and antiinflammatory cytokine co-expression within this population further, as well as from a number of matched liver and blood samples going forward, in order to more accurately assess the regulatory capacity of B cell subsets in the liver.
260 It was clear from Fig. 46B that although CD24-CD38int B cells could be stimulated by CpG, the CD24-CD38- hepatic B cell population was mainly unresponsive to this form of activation. Unlike the Buffa study suggested, the CD24-CD38- population did not produce significantly higher levels of TNF-α cytokine following 5h stimulation with CpG compared to other B cell subsets. Since hepatic CD24-CD38- B cells produced low amounts of cytokines in response to CpG stimulation, I decided to investigate the roles of range of TLR stimulations on hepatic B cells within a new cohort of explanted patient livers. Studies have shown that different B cell subsets are susceptible to variable forms of TLR stimulation. One study in particular investigated cytokine production of murine B cell subsets, examining the role of TLRs in secretion of IL-6, IL-1, IL-12 and IFN-γ by B cells, and found that activation of B cells by different TLR stimuli increased cytokine production (16, 77). In order to investigate the effects of TLR stimulations on CD24- CD38- B cells, hepatic and blood B cells were co-cultured with a range of TLR stimuli and anti-bcr/cd4l to assess B cell subset cytokine profiles compared to unstimulated B cells (Fig. 47). CD24-CD38int B cells produced innate cytokines exvivo (IL-1, IFN, IL-6) in the first patient cohort (Fig. 46B), and increased TNF-α following TLR9 stimulation in a second cohort of patients (Fig. 47A). One explanation for this is that the donors were different i.e. different hepatic diseases. It is possible that B cells in certain chronic liver diseases produce different types and quantities of cytokines upon same stimulations. Further investigations into cytokine production from B cell subsets across hepatic diseases could be further investigated in the future to determine whether this is the case.
261 CD24-CD38- hepatic B cells appeared to be unresponsive to TLR4, TLR7, RP15 and anti-bcr/cd4l stimulations when it came to IL-1, IFN-γ and IL-6 production. However, hepatic CD24-CD38- and CD24-CD38int B cells were both sensitive to CpG (TLR9) stimulation, where both CD24- B cell subsets produced a significantly higher percentage of TNF-α compared to unstimulated CD24- B cells following treatment (Fig. 47A). With regard to TLR9 stimulation of blood CD24-CD38- B cells, this increase in TNF-α production was absent. The liver encounters a constant influx of bacterial antigens through the portal vein from the gut (48). Previous studies have already shown that TLR9 signals directly activate human peripheral blood naive and memory B cell subsets to produce IL-1α, IL-1β, IL-6, TNF-α, IL-13, and IL- 1 cytokines (519). It is possible that bacterial antigens, which enter the liver, are internalized and processed by B cells into CpG-containing oligodeoxyribonucleotides. Binding of CpG peptides to TLR9 could elicit these TNFα cytokine responses from hepatic CD24- B cells through TLR9 stimulation. Studies have highlighted that ABCs can be stimulated to produce TNF-α via TL7/9 stimulation (483, 484). As the CD24-CD38int B cell compartment has been shown to be enriched in ABC markers, it is possible that TNF-α production from this particular population is further indicative of CD24-CD38int B cells being representative of an ABC population. Fig. 48B, C, and D demonstrated that liver B cells contain populations that make innate type-cytokines without any stimulus. When attempting to induce this cytokine production from blood B cells, the CD24-CD38int compartment showed that it can be induced to make innate-type cytokines but not to levels similar to liver. Furthermore, stimulation of the hepatic CD24-CD38int subpopulation with TLR4, TLR7, TLR9 but
262 not BCR/CD4L or RP15 induced significantly higher IL-6 production (Fig. 48C) compared to transitional liver B cells, a profile which was absent in the blood. This reinforces that CD24-CD38int B cells were more susceptible to TLR stimulation compared to blood CD24-CD38int B cells, and indicates that this population may be sensitive to stimulation by bacterial antigens from the gut. Previous studies have shown that stimulation of human B cells via TLR7 and TLR9 induced significantly higher IL-6 secretion compared to unstimulated B cells (519, 52, 522). More interestingly, I showed that the CD24-CD38int B cell subset contains a large proportion of non-switched memory, marginal zone B cells (Fig. 27B). Supportive of our results, one mouse study showed that MZ B cells produced pro-inflammatory cytokines, such as interleukin-6 (IL-6), and exacerbates systemic inflammatory responses to lipopolysaccharide (LPS) via TLR4 ligation (523). Overall, the CD24-CD38int hepatic B cells express an immunomodulatory phenotype, due to being able to produce significantly high levels of IL-1, as well as IL-6 and IFN-γ with specific treatment types. Again, this response was not replicated by blood CD24-CD38int B cells. Although contradictory to the Buffa study on aging blood B cells, hepatic CD24- B cells did not secrete significantly higher levels of TNF-α compared to other B cell subsets in blood or liver. Previous studies have termed CD19+CD24-CD38- B cells new memory B cells (477). However, our functional data demonstrates that the cytokine profiles of both CD24-CD38- and CD24-CD38int B cells differ (in some cases significantly) to that of memory B cells, implying this subset in the liver may not be representative of a memory subset. Differences in cytokine profiles between memory and CD24- B cells also exist, implying that the hepatic CD24-CD38- and CD24-CD38int B cells I identified in the
263 liver may be different to those described as a new inflammatory memory CD19+CD24-CD38- B cell subset in the Buffa study (477). Studies have shown that in mice, ABCs were refractory to CD4 and BCR stimulation and instead were activated by TLR7 and TLR9 stimulation resulting in increased IL-1 and IL-4 production (479, 512). ABC phenotypes are induced with TLR stimulation in the presence of IFN-γ, IL-4 and IL-21. Figure 32 & 34 demonstrated that CD24-CD38int B cells were rich in ABC markers T-bet and CD11c. In line with our theory that CD24- B cells may include a population of ageassociated B cells, I decided to stimulate hepatic B cell populations with TLR7 in combination with IL-21 and IFN-γ with and without BCR/CD4 stimulation, which the literature has reported to specifically expand and activate ABC populations (479, 512). Results from Fig. 49 indicated that cytokine production from CD24-CD38- and CD24-CD38int hepatic B cell populations did not increase significantly following any of the combinations of stimuli compared to unstimulated CD24- B cells. This also proved to be true for CD24- B cells in the blood, indicating that it is possible that these populations are exhausted rather than ABCs, or that hepatic ABCs require different stimuli to induce activation and cytokine secretion. The recent study by Thorarinsdottir et al. investigating human CD21-/lo ABC-like cells in human blood, found that CD24lo B cells within this population were more difficult to stimulate ex vivo unless performed with BCR, R848 and IL-2 (485). It is possible that the ABClike cells we find in the liver are a similar population, which can only be stimulated in the same way.
264 Literature states describes CD24-CD38int B cells as being a type of GC B cells (488, 51). Although CD24- B cells look like they could be present in lymphoid follicles in the liver which resemble similar structures to those found in SLOs, our previous findings have shown that CD24-CD38int B cells are significantly enriched in donor liver compared to SLOs such as perihepatic lymph nodes and spleen. Furthermore, given that the cytokine profiles of hepatic CD24- B cells differ from hepatic memory and plasma cell populations, as well as blood CD24-CD38int B cells, it is more likely that these cells are representative of an inflammatory B cell population. In this chapter, I have characterised the localization and cytokine production of the novel CD24-CD38- and CD24-CD38int B cells in the liver. I show that CD24-CD38int B cells expressed immunomodulatory cytokines compared to other major B cell subsets, and produced significantly higher TNF-α levels following TLR9 stimulation compared to unstimulated B cells. Furthermore, CD24-CD38int B cells localized around bile ducts and fibrotic tracts in PBC patients, implying that these cells may play a contributing role in chronic hepatic disease. The function of CD24-CD38- B cells was less clear. Although numbers were enriched in PBC livers, this population produced low percentages of cytokines following BCR and TLR stimulations compared to other B cell subsets. Consequently, it is possible that these B cells were representative of a more unresponsive B cell population, much like the dampened T cell responses which have been previously demonstrated in the liver (273, 274). Nevertheless, like the CD24-CD38int hepatic B cell population, CD24- CD38- liver B cells produced significantly higher TNF-α percentages following TLR9 stimulation compared to unstimulated B cells, indicating that this population may exert some pro-inflammatory effects. Overall, I have shown that cytokine secretion
265 differs between hepatic and peripheral blood B cells, and that blood B cells are difficult to stimulate in vitro. Furthermore, cytokine secretion from hepatic B cell subsets are dependent on the type of stimulation, which could highlight the role of B cell subsets, and particularly CD24- B cells in the liver.
266
267 6.1. GENERAL DISCUSSION Research over the recent years has confirmed that B cells are a diverse multifaceted immune cell population (93, 116, 138, 139, 524). Much like CD4+ and CD8+ T cells which are comprised of effector and regulatory T cells, B cell subsets can be protective or pro-inflammatory (525, 526). Despite massive biological differences between mouse and man, classification of B cell subsets have been based on murine models, where the phenotypic characterization of B cell subsets has been well established. Phenotypic profiles have also been established to identify stages of B cell maturation in human lymph node and bone marrow. Due to their phenotypic complexity, peripheral blood circulating B cell subsets have been poorly defined until recently. Consequently, over the last few years many different approaches have been proposed to characterize mature B cell populations in human peripheral blood, including newer B cell populations such as B1-type cells (386), double negative memory B cells (155), marginal zone B cells (134, 195) and Bregs (93). Despite the lack of consensus over methods of human B cell characterization (138, 144, 188, 189, 527, 528), it has been proven that disturbed B cell homeostasis and impaired B cell development play a role in several immunological diseases (58, 296, 349, 529, 53). For example, B cell dysfunction has been associated with fibrosis in human skin and lung, where B cell gene signatures have been found to characterize skin biopsies from systemic sclerosis patients (531). Moreover, a B cell line established from the lung tissue of a patient with scleroderma has been shown to augment proliferation and inflammatory responses likely to lead to fibrotic changes (532). B cells have also been implicated in autoimmune diseases such as multiple sclerosis, where an increased frequency of (GM-CSF)-expressing human memory B
268 cell subsets and IL-1-expressing B cells, are found to be enriched in multiple sclerosis patients compared to healthy controls (525). In rheumatoid arthritis, a distinct population of FcRL4+ B cells in the synovial tissue and fluid expressed high levels of TNF-α and RANKL mrna, indicating that these cells play a role in bone destruction and inflammation (529). The liver is an organ rich in immune cells. In addition to the presence of large numbers of resident macrophages known as Kupffer cells, the liver also contains monocytes, T cells, NK cells, and NKT cells (249). Interestingly, there have been few studies investigating the role of B cells in the adult liver, which constitute 5 1% of the human hepatic lymphocyte population (5). Research on hepatic B cells in mice is also scarce, which is surprising considering that the murine embryonic liver is a wellstudied site of origin for B cells (533). This may be because the liver is often seen as a conduit for blood cells; however recent studies have identified liver resident CD8+ T cells (534, 535), and NK cells ( ). The Cuff et al. study capitalized on the HLA mismatch of donors and recipients for liver transplants, and demonstrated that there was a long lived Eomes hi NK cell population that originated from the donor and did not recirculate (536). It is therefore likely that liver resident B cell populations also exist. There have been many studies which support B cells playing a contributing role in chronic hepatic disease, where patients suffering from ALD, HCV, and PBC exhibit immune-mediated liver damage, including persistent inflammation, cellular damage, regeneration, and fibrosis (539). One recent study used IHC to investigate the proportion of CD2+ B cells across hepatic diseases, and discovered that B cells
269 significantly accumulated in the liver tissues of CLD patients. These B cells mainly clustered in the portal areas of liver tissues and correlated with inflammatory grades (287). Other studies have found that ectopic lymphoid structures containing B and T cells are enriched in the livers of patients with chronic HCV, and that these structures function as microniches for tumor progenitor cells in hepatocellular carcinoma (421). This implies that the etiology of the chronic hepatic inflammatory environment is very likely to specify the type of intrahepatic inflammation present and its consequences (223, 422). Murine studies have shown that hepatic fibrosis is attenuated in the liver in the absence of B cells in a T cell and antibody-independent manner (282), and that B cell depletion in AIH mouse models reduced liver inflammation and improved liver function following treatment with a single dose of anti-cd2 (58). However, conflicting studies demonstrate that B cell depletion exacerbated PBC-like diseases in murine models (45), highlighting a novel disease-protective role, and suggesting that B cell depletion therapy in humans with PBC should be approached with caution. As well as contributing to hepatic autoimmune diseases, B cells have also been found to have a protective role in viral diseases, where clinical studies have shown that rituximab mediated B cell depletion in HBV patients resulted in latent HBV reactivation (398), and that rituximab treatment in HCV patients resulted in increased viral loads in the blood (54). Conversely, in peripheral blood naïve B cell frequencies were higher in HCV patients with more severe hepatic fibrosis (541). Collectively, these studies further support both protective and contributing roles for B cells in end stage hepatic disease pathogenesis.
270 Given that the majority of chronic liver conditions are either immune mediated or facilitate immune damage, and given that little is known about the role of B cells in the adult liver, I decided to thoroughly investigate the role of hepatic B cells in human end-stage chronic liver disease. By establishing which B cell subpopulations exist in the human liver in health and in end stage disease, an insight would be gained into B cell contribution to disease pathogenesis. Ultimately, B cells may provide novel therapeutic targets for treating chronic liver disease in the future. For example, rituximab is a drug already investigated in the treatment of patients suffering from autoimmune liver diseases PBC and AIH by depleting total CD2+ B cells (3, 31). Understanding which B cell subsets may be responsible for pathogenesis would allow the targeting of subset specific depletion, which may ameliorate liver inflammation. As B cell subsets may have protective and pathogenic roles, targeting B cell subsets would provide an important toggle switch for inflammation. Furthermore, one may not wish to deplete the entire B cell compartment and expose the patient to infection, which is one of the complications of rituximab therapy (542). All B cell subsets detected using our extensive custom 18 antigen marker flow cytometry panels, were present in the blood as well as in matched liver samples. When quantified, it appeared that diseased liver harboured more activated B cells (centroblasts, double negative memory (CD27-IgD-) (Fig. 27) compared to matched blood which contained more naïve B cells. This is justifiable given that antigen rich blood enters the liver via the portal vein from the gut (48), and may result in constant uptake of antigen via APCs such as B cells, leading to their activation. Furthermore, as most of these livers were chronically inflamed, an influx of activated
271 immune cells into the organ contributing to local inflammation and damage would be expected. I characterised the total number of CD19+ B cells across hepatic diseases such as autoimmune (PBC, PSC), dietary mediated (NASH, ALD), viral (HCV, HBV) and donor livers. PBC livers appeared to contain the highest proportion of CD19+ B cells. However, the total number of CD19+ B cells did not vary significantly between any hepatic diseases (Fig. 21). This was also true for the number of B cell subsets per gram of liver tissue between liver diseases; with the exception of naïve mature B cells, which were enriched in PBC livers compared to donors. This flow cytometry data was in agreement with our IHC data, which demonstrated CD2+ B cells were significantly enriched in PBC patients compared to PSC patients (Fig. 22). A similar study corroborated our data, using IHC staining to show that CD2+ B cells were increased more significantly in the liver tissues of PBC patients compared with HBV, AIH and ALD patients (287). It is likely that some B cells are lost during the mechanical digestion process of the liver tissue due to being trapped within the fibrotic areas in the liver, making it difficult to isolate and quantify larger aggregates of B cells. Liver slices were washed vigorously to remove blood cells. Consequently, it is likely that the absolute B cell numbers from liver homogenates are being underestimated. Hence, IHC data are more accurate for absolute B cell number calculations compared to flow cytometry. Whilst characterizing B cell subsets in the liver, I noticed that CD24- B cells were highly enriched in the liver (Fig. 26B), and that this population could be further separated into CD24-CD38- and CD24-CD38int subsets (Fig. 26A). CD24 downregulation has been associated with decreased cell proliferation; decreased
272 motility, immunomodulation and both increased and decreased susceptibility to apoptosis (445, 543). I found that both CD24-CD38- and CD24-CD38int B cells were enriched in diseased livers, compared to matched blood, and that CD24-CD38int B cells were also enriched in donor livers compared to secondary lymphoid organs. Collectively, these data suggests that CD24- B cells may be preferentially recruited to the liver, or are representative of a liver-resident population. This is important in deducing whether CD24- B cells have an immunosurveillance/homeostatic role in the liver or whether they are recruited to the liver in the presence of inflammation and disease. It is also possible that these cells are generated in the liver, and are derived from another B cell subset such as transitional, memory, naïve or even progenitor B cells. Sorting these subsets and performing BCR sequence analyses would address clonal relationships between B cell subsets (544). CD24- B cells are a heterogeneous population, but while CD24-CD38- B cells contained more IgD+ naïve cells in diseased and donor liver, they represented more of a non-switched memory population in the blood (Fig. 27). Similarly, CD24- CD38int B cells contained a majority naïve and non-switched memory phenotype in diseased livers (which was not the case in donor livers) and non-switched memory majority in blood (Fig. 27). In order to accurately assess the role and significance of CD24-CD38int B cells in hepatic disease, future work could involve targeted depletion of CD24-CD38int B cells in mice, or expansion via adoptive transfer of this specific subpopulation in mouse models of hepatic inflammation. To begin this investigation, I would need to identify whether these CD24- (HSA-) B cell populations exist in mice. Although CD24 can be used in mouse and human tissue to identify distinct B cell subsets (113), we still know very little regarding the functional
273 differences between mouse and human CD24 antigen. Furthermore, the B cell compartment differs hugely between human and mice (113). Given that murine CD38 is down-regulated on GC B cells and mature plasma cells (545), and is expressed highly on human plasma cells (546), it is possible that equivalent CD24- CD38- and CD24-CD38int hepatic B cell populations in mice may have a different functional phenotype, making these CD24- B cells difficult to locate in mice. After establishing that B cells were enriched in PBC, I showed that CD24-CD38- B cells were significantly increased in PBC compared to donor livers, implying that this B cell subset may be involved in the pathogenesis of PBC. Of note, this was the only B cell subset that was increased in PBC compared to other end stage diseases. I therefore attribute the increase of B cells in PBC to the increased CD24-CD38- subset. IHC staining helped us to further establish that within PBC patients, CD24- CD38- B cells clustered in aggregates in the vicinity of bile ducts and fibrotic tracts, and CD24-CD38+ B cells were mainly located around the bile ducts and within fibrotic scar tissue, which again hinted towards the role of CD24- B cells in hepatic disease pathogenesis. Previous findings demonstrate that cirrhotic livers harbor large numbers of NKT cells and that activated NKT cells drive fibrogenesis in NASH livers (547). However, I found that CD1d expression on CD24- populations was significantly increased in donor livers compared to some other chronic diseased livers, especially those from dietary injury (Fig. 29 & 3). Hepatic NKT cells, which patrol the liver, enhance inflammatory responses in the presence of liver injury via pro-inflammatory cytokines and by activating HSCs (548). As CD1d expression is highest on APCs, this may
274 hint that CD24- B cells may be responsible for mediating NKT cell activation (549), and that NKT activation may be impaired in the presence of certain chronic liver diseases. CD24-CD38- B cells have been previously described by Buffa et al. 213, where this population was enriched in the blood of aged patients (477). There have since have been numerous reports on age-associated B cells (ABCs), a population which responds poorly to BCR/CD4 ligation and are instead stimulated by TLRs to preferentially secrete antibodies, IL-1 and IL-4 (479, 483). One recent study, described a B cell subset with an ABC-like phenotype, CD21- B cells, to exist in human blood. This subset contained a CD38-CD24lo B cell population (485). I therefore wanted to investigate whether hepatic CD24-CD38- and CD24-CD38int B cell populations contained age-related populations. Although neither CD24- hepatic B cell population correlated with end-stage liver disease patient age (Fig. 31), ABC markers were enriched in the CD24-CD38- B cell compartment in healthy donor blood, and within the CD24-CD38int compartment in end-stage disease livers (Fig. 34). This further highlighted possible functional differences between blood and liver B cells, and implied that hepatic CD24-CD38int B cells may be activated in the absence of T cells via TLRs. ABCs have been reported to be activated with TLR7 and IL-21 or TLR7 and IFN-γ (83, 84, 479, 512). Using a combination of these stimuli, our data showed that stimulation did not induce greater cytokine productions from either hepatic CD24- B cell population following stimulation compared to unstimulated. This implies that hepatic ABCs may require different stimuli, as described in the Thorarinsdottir et al. study, where CD21-CD38-CD24lo B cells could only be stimulated in vitro with BCR, R848 and IL-2 (485). Alternatively, it is also
275 possible that these hepatic CD24- B cell populations are unresponsive to stimulation in vitro. Upon stimulation, B cells can secret pro-inflammatory cytokines such as IL-6 and TNF-α, thereby perpetuating inflammatory responses (55). In the AIH animal model for example, CD45+CD19+ B cells in the liver secreted significantly higher percentages of both IFN-γ and TNF-α compared to C57BL/6 littermates, contributing to a pro-inflammatory hepatic microenvironment (58). On the other hand, Bregs have been associated with inhibiting inflammation through IL-1, IL-35 and TGF-β production, which prevents pathogenic T cell expansion and limits damage (14, ). In this way, B cells may play both positive and negative regulatory roles in chronic liver disease pathogenesis. The Buffa study described the age-associated CD24-CD38- B cell subset as a proinflammatory TNF-α secreting population, following stimulation with CpG (TLR9 stimulation) for 5 hours (477). With the same stimuli CD24-CD38int B cells expressed both pro-inflammatory (IL-6 & IFN-γ) and anti-inflammatory (IL-1) cytokines in the liver compared to some other B cell subsets. This was not the case for blood CD24-CD38int B cells, which did not respond to this form of stimulation and produced low levels of cytokine following stimulation (Fig. 46B). The hepatic CD24- CD38- B cell population also initially demonstrated very little cytokine secretion following stimulation compared to other B cell subsets (Fig. 46B). When tested with different TLR stimulations, CD24-CD38int B cells were again found to be pro-inflammatory directly ex-vivo, producing IFN-γ and IL-6 prior to simulation. 12% of CD24-CD38int B cells also produced anti-inflammatory cytokine IL-1
276 following BCR+CD4, TLR7, TLR9 and RP15 stimulation, which is over that which has been previously reported for Breg IL-1 production (93). As these proinflammatory CD24-CD38int B cells were previously shown surrounding bile ducts in PBC IHC stains, it is possible that this population is involved in direct or indirect targeted destruction of bile ducts in PBC. However, where CD24-CD38int B cells demonstrate significantly higher IL-1 production compared to memory B cells following stimulation, it is possible that they also have a protective role in end stage liver disease. The importance of IL-1 has been highlighted in mice where Crohn slike colitis developed in IL-1-deficient mice generated by gene targeting (554, 555). IL-1 has also proven to regulate hepatic injury in vivo. IL-1 exerted antifibrogenic effects during CCl 4 -induced hepatic fibrogenesis (556) and administration of recombinant IL-1 in mice challenged with Con A dramatically reduced proinflammatory cytokine secretion, apoptosis of hepatocytes, hepatic neutrophil infiltrate and delayed hepatic necrosis (557, 558). Given that IL-1 has played a role in protecting against hepatic injury, it is possible that in the presence of hepatic disease, CD24-CD38int hepatic B cells respond by producing IL-1 to control liver inflammation by inhibiting antigen presentation to T cells, T cell cytokine production (559) and neutrophil chemokine production (56, 561). Alternatively, it is possible that IL-1 production exacerbates hepatic conditions such as PBC by enhancing proliferation and differentiation of plasma cells and IgM synthesis (57, 562). This can be assessed further in future work by comparing the cytokine production of CD24- B cells between end stage liver diseases and donor livers. By comparison, hepatic CD24-CD38- B cells were unresponsive to most TLR stimulations, with the exception of TLR9 stimulation, which triggered significantly
277 higher percentages of TNF-α secretion compared to unstimulated CD24-CD38- B cells. This was also true for the CD24-CD38int B cells (Fig. 47). This contradicted findings from the previous patient cohort (Fig. 46), where I was unable to stimulate CD24-CD38- hepatic cells with TLR9, highlighting possible differences in B cell susceptibility to stimulation in patients suffering from different hepatic diseases. Considering CD24-CD38- B cells are enriched in the liver of PBC patients and produce TNF-α, and that CD24-CD38int B cells surround bile ducts and secrete TNF-α, IFN-γ and IL-6, the presence of pro-inflammatory cytokine secretion in the liver is intriguing as these cells may contribute to PBC disease pathogenesis. Zhao et al. 211 has shown that TNF-α and IL-6 were elevated in PBC patient blood, and another study demonstrated that mrna encoding TNF-α, IFN-γ, IL-6, IL-12 and IL- 23 were elevated in the livers of PBC mouse models (autoimmune cholangitis mice) II (563, 564). It is possible that TNF-α produced by hepatic CD24-CD38- and CD24- CD38int B cells and IFN-γ produced by CD24-CD38int B cells can be destructive for BEC in PBC by increasing BEC expression of ICAM-1, HLA class I, and HLA class (564, 565), which has been previously shown. This in turn could increase antigen presentation to T helper cells, where T cells have been found to infiltrate near bile ducts in PBC patients (566), causing T cell activation and cytotoxic immune mediated bile duct damage. It is also possible that TNF-α secreted by CD24- B cells in the liver stimulate BEC to produce IL-8 and monocyte chemotactic protein-1, as this has been previously shown to promote recruitment of neutrophils and lymphocytes, which could contribute to pathological inflammation of bile ducts (567). To continue elucidating the possible function of hepatic CD24- B cells in liver damage, further investigation to assess the effects of CD24- B cell cytokine
278 secretion on other hepatic cells such as BEC within specific hepatic diseases is required. One possibility is that both CD24-CD38- and CD24-CD38int B cells are related. It is true that CD38 expression is gained as CD24- GC B cells differentiate into plasma blasts and plasma cells. Therefore it is possible that CD24-CD38- and CD24- CD38int B cells represent an earlier stage of B cell differentiation. However, given that these populations localize to different areas within the liver, produce different cytokines and differ in terms of proportions of naïve and non-switched memory cells, it is unlikely that these populations are related. Further investigations involving sorting these subsets and performing BCR sequence analyses would address clonal relationships between these B cell subsets, therefore confirming whether these subsets are related. All findings from this PhD project, with regard to B cell subsets in human liver and blood, are summarized in Figure 5 below.


279 Figure 5 A diagram summarizing the main findings of this project with regard to human B cells in blood and liver. Both general B cells and B cell subsets are described, with a particular focus on CD24-CD38- and CD24-CD38int B cells.
Adaptive Immunity: Humoral Immune Responses
 MICR2209 Adaptive Immunity: Humoral Immune Responses Dr Allison Imrie 1 Synopsis: In this lecture we will review the different mechanisms which constitute the humoral immune response, and examine the antibody
Ig light chain rearrangement: Rescue pathway
 B Cell Development Ig light chain rearrangement: Rescue pathway There is only a 1:3 chance of the join between the V and J region being in frame Vk Jk Ck Non-productive Rearrangement Light chain has a
The Adaptive Immune Response. B-cells
 The Adaptive Immune Response B-cells The innate immune system provides immediate protection. The adaptive response takes time to develop and is antigen specific. Activation of B and T lymphocytes Naive
Immunology for the Rheumatologist
 Immunology for the Rheumatologist Rheumatologists frequently deal with the immune system gone awry, rarely studying normal immunology. This program is an overview and discussion of the function of the
Immunobiology 7. The Humoral Immune Response
 Janeway Murphy Travers Walport Immunobiology 7 Chapter 9 The Humoral Immune Response Copyright Garland Science 2008 Tim Worbs Institute of Immunology Hannover Medical School 1 The course of a typical antibody
Antigen-Independent B-Cell Development Bone Marrow
 Antigen-Independent B-Cell Development Bone Marrow 1. DNA rearrangements establish the primary repertoire, creating diversity 2. Allelic exclusion ensures that each clone expresses a single antibody on
CELL BIOLOGY - CLUTCH CH THE IMMUNE SYSTEM.
 !! www.clutchprep.com CONCEPT: OVERVIEW OF HOST DEFENSES The human body contains three lines of against infectious agents (pathogens) 1. Mechanical and chemical boundaries (part of the innate immune system)
B cell activation and antibody production. Abul K. Abbas UCSF
 1 B cell activation and antibody production Abul K. Abbas UCSF 2 Lecture outline B cell activation; the role of helper T cells in antibody production Therapeutic targeting of B cells 3 Principles of humoral
Innate immunity (rapid response) Dendritic cell. Macrophage. Natural killer cell. Complement protein. Neutrophil
 Dendritic cell. Macrophage. Natural killer cell. Complement protein. Neutrophil") 1 The immune system The immune response The immune system comprises two arms functioning cooperatively to provide a comprehensive protective response: the innate and the adaptive immune system. The innate
1 The immune system The immune response The immune system comprises two arms functioning cooperatively to provide a comprehensive protective response: the innate and the adaptive immune system. The innate
The Adaptive Immune Responses
 The Adaptive Immune Responses The two arms of the immune responses are; 1) the cell mediated, and 2) the humoral responses. In this chapter we will discuss the two responses in detail and we will start
General Overview of Immunology. Kimberly S. Schluns, Ph.D. Associate Professor Department of Immunology UT MD Anderson Cancer Center
 General Overview of Immunology Kimberly S. Schluns, Ph.D. Associate Professor Department of Immunology UT MD Anderson Cancer Center Objectives Describe differences between innate and adaptive immune responses
TCR, MHC and coreceptors
 Cooperation In Immune Responses Antigen processing how peptides get into MHC Antigen processing involves the intracellular proteolytic generation of MHC binding proteins Protein antigens may be processed
Adaptive Immune System
 Short Course on Immunology Adaptive Immune System Bhargavi Duvvuri Ph.D IIIrd Year (Immunology) bhargavi@yorku.ca Supervisor Dr.Gillian E Wu Professor, School of Kinesiology and Health Sciences York University,
The Development of Lymphocytes: B Cell Development in the Bone Marrow & Peripheral Lymphoid Tissue Deborah A. Lebman, Ph.D.
 The Development of Lymphocytes: B Cell Development in the Bone Marrow & Peripheral Lymphoid Tissue Deborah A. Lebman, Ph.D. OBJECTIVES 1. To understand how ordered Ig gene rearrangements lead to the development
Development of B and T lymphocytes
 Development of B and T lymphocytes What will we discuss today? B-cell development T-cell development B- cell development overview Stem cell In periphery Pro-B cell Pre-B cell Immature B cell Mature B cell
Adaptive immune responses: T cell-mediated immunity
 MICR2209 Adaptive immune responses: T cell-mediated immunity Dr Allison Imrie allison.imrie@uwa.edu.au 1 Synopsis: In this lecture we will discuss the T-cell mediated immune response, how it is activated,
Immune Regulation and Tolerance
 Immune Regulation and Tolerance Immunoregulation: A balance between activation and suppression of effector cells to achieve an efficient immune response without damaging the host. Activation (immunity)
Defensive mechanisms include :
 Acquired Immunity Defensive mechanisms include : 1) Innate immunity (Natural or Non specific) 2) Acquired immunity (Adaptive or Specific) Cell-mediated immunity Humoral immunity Two mechanisms 1) Humoral
COURSE: Medical Microbiology, MBIM 650/720 - Fall TOPIC: Antigen Processing, MHC Restriction, & Role of Thymus Lecture 12
 COURSE: Medical Microbiology, MBIM 650/720 - Fall 2008 TOPIC: Antigen Processing, MHC Restriction, & Role of Thymus Lecture 12 FACULTY: Dr. Mayer Office: Bldg. #1, Rm B32 Phone: 733-3281 Email: MAYER@MED.SC.EDU
T-cell activation T cells migrate to secondary lymphoid tissues where they interact with antigen, antigen-presenting cells, and other lymphocytes:
 Interactions between innate immunity & adaptive immunity What happens to T cells after they leave the thymus? Naïve T cells exit the thymus and enter the bloodstream. If they remain in the bloodstream,
LESSON 2: THE ADAPTIVE IMMUNITY
 Introduction to immunology. LESSON 2: THE ADAPTIVE IMMUNITY Today we will get to know: The adaptive immunity T- and B-cells Antigens and their recognition How T-cells work 1 The adaptive immunity Unlike
Effector T Cells and
 1 Effector T Cells and Cytokines Andrew Lichtman, MD PhD Brigham and Women's Hospital Harvard Medical School 2 Lecture outline Cytokines Subsets of CD4+ T cells: definitions, functions, development New
Principles of Adaptive Immunity
 Principles of Adaptive Immunity Chapter 3 Parham Hans de Haard 17 th of May 2010 Agenda Recognition molecules of adaptive immune system Features adaptive immune system Immunoglobulins and T-cell receptors
Follicular Lymphoma. ced3 APOPTOSIS. *In the nematode Caenorhabditis elegans 131 of the organism's 1031 cells die during development.
 Harvard-MIT Division of Health Sciences and Technology HST.176: Cellular and Molecular Immunology Course Director: Dr. Shiv Pillai Follicular Lymphoma 1. Characterized by t(14:18) translocation 2. Ig heavy
κ λ Antigen-Independent B-Cell Development Bone Marrow Ordered Rearrangement of Ig Genes During B-Cell Development in the Bone Marrow
 Antigen-Independent B-Cell Development Bone Marrow 1. DNA rearrangements establish the primary repertoire, creating diversity 2. Allelic exclusion ensures that each clone expresses a single antibody on
PLAN. Réponses B thymodépendantes et thymoindépendantes. B cell development and classification. B cell activation. Thymodependent B(2) cell response
 cell response") Réponses B thymodépendantes et thymoindépendantes PLAN B cell development and classification B cell activation Thymodependent B(2) cell response BMC 423 (IF) - 2007 Antonino Nicoletti Thymo-independent
Réponses B thymodépendantes et thymoindépendantes PLAN B cell development and classification B cell activation Thymodependent B(2) cell response BMC 423 (IF) - 2007 Antonino Nicoletti Thymo-independent
Introduction. Introduction. Lymphocyte development (maturation)
") Introduction Abbas Chapter 8: Lymphocyte Development and the Rearrangement and Expression of Antigen Receptor Genes Christina Ciaccio, MD Children s Mercy Hospital January 5, 2009 Lymphocyte development
Introduction Abbas Chapter 8: Lymphocyte Development and the Rearrangement and Expression of Antigen Receptor Genes Christina Ciaccio, MD Children s Mercy Hospital January 5, 2009 Lymphocyte development
The T cell receptor for MHC-associated peptide antigens
 1 The T cell receptor for MHC-associated peptide antigens T lymphocytes have a dual specificity: they recognize polymporphic residues of self MHC molecules, and they also recognize residues of peptide
B Lymphocyte Development and Activation
 Harvard-MIT Division of Health Sciences and Technology HST.176: Cellular and Molecular Immunology Course Director: Dr. Shiv Pillai 09/26/05; 9 AM Shiv Pillai B Lymphocyte Development and Activation Recommended
The Adaptive Immune Response. T-cells
 The Adaptive Immune Response T-cells T Lymphocytes T lymphocytes develop from precursors in the thymus. Mature T cells are found in the blood, where they constitute 60% to 70% of lymphocytes, and in T-cell
Introduction. Abbas Chapter 10: B Cell Activation and Antibody Production. General Features. General Features. General Features
 Introduction Abbas Chapter 10: B Cell Activation and Antibody Production January 25, 2010 Children s Mercy Hospitals and Clinics Humoral immunity is mediated by secreted antibodies (Ab) Ab function to
PBS Class #2 Introduction to the Immune System part II Suggested reading: Abbas, pgs , 27-30
 PBS 803 - Class #2 Introduction to the Immune System part II Suggested reading: Abbas, pgs. 15-25, 27-30 Learning Objectives Compare and contrast the maturation of B and T lymphocytes Compare and contrast
T Cell Effector Mechanisms I: B cell Help & DTH
 T Cell Effector Mechanisms I: B cell Help & DTH Ned Braunstein, MD The Major T Cell Subsets p56 lck + T cells γ δ ε ζ ζ p56 lck CD8+ T cells γ δ ε ζ ζ Cα Cβ Vα Vβ CD3 CD8 Cα Cβ Vα Vβ CD3 MHC II peptide
WHY IS THIS IMPORTANT?
 CHAPTER 16 THE ADAPTIVE IMMUNE RESPONSE WHY IS THIS IMPORTANT? The adaptive immune system protects us from many infections The adaptive immune system has memory so we are not infected by the same pathogen
Lymphoid Organs and Lymphocyte Trafficking. Dr. Issa Abu-Dayyeh
 Lymphoid Organs and Lymphocyte Trafficking Dr. Issa Abu-Dayyeh Invader recognition Where does invader recognition take place?? Secondary lymphoid organs: Lymph nodes Spleen Mucosal-associated lymphoid
Allergy and Immunology Review Corner: Chapter 1 of Immunology IV: Clinical Applications in Health and Disease, by Joseph A. Bellanti.
 Allergy and Immunology Review Corner: Chapter 1 of Immunology IV: Clinical Applications in Health and Disease, by Joseph A. Bellanti. Chapter 1: Overview of Immunology Prepared by David Scott, MD, Scripps
Immunological Tolerance
 Immunological Tolerance Introduction Definition: Unresponsiveness to an antigen that is induced by exposure to that antigen Tolerogen = tolerogenic antigen = antigen that induces tolerance Important for
all of the above the ability to impart long term memory adaptive immunity all of the above bone marrow none of the above
 1. (3 points) Immediately after a pathogen enters the body, it faces the cells and soluble proteins of the innate immune system. Which of the following are characteristics of innate immunity? a. inflammation
The development of T cells in the thymus
 T cells rearrange their receptors in the thymus whereas B cells do so in the bone marrow. The development of T cells in the thymus The lobular/cellular organization of the thymus Immature cells are called
Examples of questions for Cellular Immunology/Cellular Biology and Immunology
 Examples of questions for Cellular Immunology/Cellular Biology and Immunology Each student gets a set of 6 questions, so that each set contains different types of questions and that the set of questions
Question 1. Kupffer cells, microglial cells and osteoclasts are all examples of what type of immune system cell?
 Abbas Chapter 2: Sarah Spriet February 8, 2015 Question 1. Kupffer cells, microglial cells and osteoclasts are all examples of what type of immune system cell? a. Dendritic cells b. Macrophages c. Monocytes
Effector mechanisms of cell-mediated immunity: Properties of effector, memory and regulatory T cells
 ICI Basic Immunology course Effector mechanisms of cell-mediated immunity: Properties of effector, memory and regulatory T cells Abul K. Abbas, MD UCSF Stages in the development of T cell responses: induction
Chapter 11. B cell generation, Activation, and Differentiation. Pro-B cells. - B cells mature in the bone marrow.
 Chapter B cell generation, Activation, and Differentiation - B cells mature in the bone marrow. - B cells proceed through a number of distinct maturational stages: ) Pro-B cell ) Pre-B cell ) Immature
1. Overview of Adaptive Immunity
 Chapter 17A: Adaptive Immunity Part I 1. Overview of Adaptive Immunity 2. T and B Cell Production 3. Antigens & Antigen Presentation 4. Helper T cells 1. Overview of Adaptive Immunity The Nature of Adaptive
Andrea s SI Session PCB Practice Test Test 3
 Practice Test Test 3 READ BEFORE STARTING PRACTICE TEST: Remember to please use this practice test as a tool to measure your knowledge, and DO NOT use it as your only tool to study for the test, since
T Cell Receptor & T Cell Development
 T Cell Receptor & T Cell Development Questions for the next 2 lectures: How do you generate a diverse T cell population with functional TCR rearrangements? How do you generate a T cell population that
Immunology 2017: Lecture 12 handout. Secondary lymphoid organs. Dr H Awad
 Immunology 2017: Lecture 12 handout Secondary lymphoid organs Dr H Awad INTRODUCTION So far we discussed the cells of the immune system and how they recognize their antigens and get stimulated. The number
Helper-T-cell regulated B-cell differentiation. Phase I begins at the site of infection with acute inflammation that leads to the activation and
 1 2 Helper-T-cell regulated B-cell differentiation. Phase I begins at the site of infection with acute inflammation that leads to the activation and emigration of DCs to the T- cell zones of the lymph
Immunology Lesson plan for international medical students
 Immunology Lesson plan for international medical students Kermanshah University of medical sciences (KUMS) international affairs School of medicine Department of Immunology Lecturers: Dr. Ali Gorgin Karaji
Adaptive Immunity: Specific Defenses of the Host
 17 Adaptive Immunity: Specific Defenses of the Host SLOs Differentiate between innate and adaptive immunity, and humoral and cellular immunity. Define antigen, epitope, and hapten. Explain the function
The Immune System. These are classified as the Innate and Adaptive Immune Responses. Innate Immunity
 The Immune System Biological mechanisms that defend an organism must be 1. triggered by a stimulus upon injury or pathogen attack 2. able to counteract the injury or invasion 3. able to recognise foreign
Immunodermatology. Danielle Tartar, MD, PhD Assistant Clinical Professor Co-Director of Inpatient Dermatology University of California - Davis
 Immunodermatology Danielle Tartar, MD, PhD Assistant Clinical Professor Co-Director of Inpatient Dermatology University of California - Davis Outline Adaptive Immunity: T and B cell development, activation,
ACTIVATION OF T LYMPHOCYTES AND CELL MEDIATED IMMUNITY
 ACTIVATION OF T LYMPHOCYTES AND CELL MEDIATED IMMUNITY The recognition of specific antigen by naïve T cell induces its own activation and effector phases. T helper cells recognize peptide antigens through
T cell maturation. T-cell Maturation. What allows T cell maturation?
 T-cell Maturation What allows T cell maturation? Direct contact with thymic epithelial cells Influence of thymic hormones Growth factors (cytokines, CSF) T cell maturation T cell progenitor DN DP SP 2ry
Autoimmunity. Autoimmunity arises because of defects in central or peripheral tolerance of lymphocytes to selfantigens
 Autoimmunity Autoimmunity arises because of defects in central or peripheral tolerance of lymphocytes to selfantigens Autoimmune disease can be caused to primary defects in B cells, T cells and possibly
All animals have innate immunity, a defense active immediately upon infection Vertebrates also have adaptive immunity
 1 2 3 4 5 6 7 8 9 The Immune System All animals have innate immunity, a defense active immediately upon infection Vertebrates also have adaptive immunity Figure 43.2 In innate immunity, recognition and
Chapter 11. B cell generation, Activation, and Differentiation. Pro-B cells. - B cells mature in the bone marrow.
 Chapter B cell generation, Activation, and Differentiation - B cells mature in the bone marrow. - B cells proceed through a number of distinct maturational stages: ) Pro-B cell ) Pre-B cell ) Immature
Third line of Defense. Topic 8 Specific Immunity (adaptive) (18) 3 rd Line = Prophylaxis via Immunization!
 (18) 3 rd Line = Prophylaxis via Immunization!") Topic 8 Specific Immunity (adaptive) (18) Topics - 3 rd Line of Defense - B cells - T cells - Specific Immunities 1 3 rd Line = Prophylaxis via Immunization! (a) A painting of Edward Jenner depicts a cow
Topic 8 Specific Immunity (adaptive) (18) Topics - 3 rd Line of Defense - B cells - T cells - Specific Immunities 1 3 rd Line = Prophylaxis via Immunization! (a) A painting of Edward Jenner depicts a cow
5/1/13. The proportion of thymus that produces T cells decreases with age. The cellular organization of the thymus
 T cell precursors migrate from the bone marrow via the blood to the thymus to mature 1 2 The cellular organization of the thymus The proportion of thymus that produces T cells decreases with age 3 4 1
White Blood Cells (WBCs)
") YOUR ACTIVE IMMUNE DEFENSES 1 ADAPTIVE IMMUNE RESPONSE 2! Innate Immunity - invariant (generalized) - early, limited specificity - the first line of defense 1. Barriers - skin, tears 2. Phagocytes - neutrophils,
YOUR ACTIVE IMMUNE DEFENSES 1 ADAPTIVE IMMUNE RESPONSE 2! Innate Immunity - invariant (generalized) - early, limited specificity - the first line of defense 1. Barriers - skin, tears 2. Phagocytes - neutrophils,
Immune responses in autoimmune diseases
 Immune responses in autoimmune diseases Erika Jensen-Jarolim Dept. of Pathophysiology Medical University Vienna CCHD Lecture January 24, 2007 Primary immune organs: Bone marrow Thymus Secondary: Lymph
SINGLE CHOICE. 5. The gamma invariant chain binds to this molecule during its intracytoplasmic transport. A TCR B BCR C MHC II D MHC I E FcγR
 A Name: Group: SINGLE CHOICE 1. Which is the most important ligand of TLR5? A endospore B flagellin C polysaccharide capsule D DNA E pilus 2. The antibody-binding site is formed primarily by... A the constant
SEVENTH EDITION CHAPTER
 Judy Owen Jenni Punt Sharon Stranford Kuby Immunology SEVENTH EDITION CHAPTER 16 Tolerance, Autoimmunity, and Transplantation Copyright 2013 by W. H. Freeman and Company Immune tolerance: history * Some
Adaptive Immunity. PowerPoint Lecture Presentations prepared by Mindy Miller-Kittrell, North Carolina State University C H A P T E R
 CSLO7. Describe functions of host defenses and the immune system in combating infectious diseases and explain how immunizations protect against specific diseases. PowerPoint Lecture Presentations prepared
Adaptive Immunity. PowerPoint Lecture Presentations prepared by Mindy Miller-Kittrell, North Carolina State University C H A P T E R
 PowerPoint Lecture Presentations prepared by Mindy Miller-Kittrell, North Carolina State University C H A P T E R 16 Adaptive Immunity The Body s Third Line of Defense Adaptive Immunity Adaptive immunity
Advances in Cancer Immunotherapy
 Advances in Cancer Immunotherapy Immunology 101 for the Non-Immunologist Arnold H. Zea, PhD azea@lsuhsc.edu Disclosures No relevant financial relationships to disclose This presentation does not contain
Mon, Wed, Fri 11:00 AM-12:00 PM. Owen, Judy, Jenni Punt, and Sharon Stranford Kuby-Immunology, 7th. Edition. W.H. Freeman and Co., New York.
 Course Title: Course Number: Immunology Biol-341/541 Semester: Fall 2013 Location: HS 268 Time: Instructor: 8:00-9:30 AM Tue/Thur Dr. Colleen M. McDermott Office: Nursing Ed 101 (424-1217) E-mail*: mcdermot@uwosh.edu
Immunology - Lecture 2 Adaptive Immune System 1
 Immunology - Lecture 2 Adaptive Immune System 1 Book chapters: Molecules of the Adaptive Immunity 6 Adaptive Cells and Organs 7 Generation of Immune Diversity Lymphocyte Antigen Receptors - 8 CD markers
Third line of Defense
 Chapter 15 Specific Immunity and Immunization Topics -3 rd of Defense - B cells - T cells - Specific Immunities Third line of Defense Specific immunity is a complex interaction of immune cells (leukocytes)
ACTIVATION AND EFFECTOR FUNCTIONS OF CELL-MEDIATED IMMUNITY AND NK CELLS. Choompone Sakonwasun, MD (Hons), FRCPT
, FRCPT") ACTIVATION AND EFFECTOR FUNCTIONS OF CELL-MEDIATED IMMUNITY AND NK CELLS Choompone Sakonwasun, MD (Hons), FRCPT Types of Adaptive Immunity Types of T Cell-mediated Immune Reactions CTLs = cytotoxic T lymphocytes
ACTIVATION AND EFFECTOR FUNCTIONS OF CELL-MEDIATED IMMUNITY AND NK CELLS Choompone Sakonwasun, MD (Hons), FRCPT Types of Adaptive Immunity Types of T Cell-mediated Immune Reactions CTLs = cytotoxic T lymphocytes
General Biology. A summary of innate and acquired immunity. 11. The Immune System. Repetition. The Lymphatic System. Course No: BNG2003 Credits: 3.
 A summary of innate and acquired immunity General iology INNATE IMMUNITY Rapid responses to a broad range of microbes Course No: NG00 Credits:.00 External defenses Invading microbes (pathogens). The Immune
Tolerance, autoimmunity and the pathogenesis of immunemediated inflammatory diseases. Abul K. Abbas UCSF
 Tolerance, autoimmunity and the pathogenesis of immunemediated inflammatory diseases Abul K. Abbas UCSF Balancing lymphocyte activation and control Activation Effector T cells Tolerance Regulatory T cells
Chapter 1. Chapter 1 Concepts. MCMP422 Immunology and Biologics Immunology is important personally and professionally!
 MCMP422 Immunology and Biologics Immunology is important personally and professionally! Learn the language - use the glossary and index RNR - Reading, Note taking, Reviewing All materials in Chapters 1-3
Molecular Pathology of Lymphoma (Part 1) Rex K.H. Au-Yeung Department of Pathology, HKU
 Rex K.H. Au-Yeung Department of Pathology, HKU") Molecular Pathology of Lymphoma (Part 1) Rex K.H. Au-Yeung Department of Pathology, HKU Lecture outline Time 10:00 11:00 11:15 12:10 12:20 13:15 Content Introduction to lymphoma Review of lymphocyte biology
Molecular Pathology of Lymphoma (Part 1) Rex K.H. Au-Yeung Department of Pathology, HKU Lecture outline Time 10:00 11:00 11:15 12:10 12:20 13:15 Content Introduction to lymphoma Review of lymphocyte biology
Immunology. T-Lymphocytes. 16. Oktober 2014, Ruhr-Universität Bochum Karin Peters,
 Immunology T-Lymphocytes 16. Oktober 2014, Ruhr-Universität Bochum Karin Peters, karin.peters@rub.de The role of T-effector cells in the immune response against microbes cellular immunity humoral immunity
Chapter 2 (pages 22 33): Cells and Tissues of the Immune System. Prepared by Kristen Dazy, MD, Scripps Clinic Medical Group
: Cells and Tissues of the Immune System. Prepared by Kristen Dazy, MD, Scripps Clinic Medical Group") Allergy and Immunology Review Corner: Cellular and Molecular Immunology, 8th Edition By Abul K. Abbas, MBBS; Andrew H. H. Lichtman, MD, PhD; and Shiv Pillai, MBBS, PhD. Chapter 2 (pages 22 33): Cells and
Allergy and Immunology Review Corner: Cellular and Molecular Immunology, 8th Edition By Abul K. Abbas, MBBS; Andrew H. H. Lichtman, MD, PhD; and Shiv Pillai, MBBS, PhD. Chapter 2 (pages 22 33): Cells and
Adaptive (acquired) immunity. Professor Peter Delves University College London
 immunity. Professor Peter Delves University College London") Adaptive (acquired) immunity Professor Peter Delves University College London p.delves@ucl.ac.uk Haematopoiesis Haematopoiesis Lymphocytes = adaptive response Recognition of pathogens by adaptive cells,
Adaptive (acquired) immunity Professor Peter Delves University College London p.delves@ucl.ac.uk Haematopoiesis Haematopoiesis Lymphocytes = adaptive response Recognition of pathogens by adaptive cells,
Central tolerance. Mechanisms of Immune Tolerance. Regulation of the T cell response
 Immunoregulation: A balance between activation and suppression that achieves an efficient immune response without damaging the host. Mechanisms of Immune Tolerance ACTIVATION (immunity) SUPPRESSION (tolerance)
Mechanisms of Immune Tolerance
 Immunoregulation: A balance between activation and suppression that achieves an efficient immune response without damaging the host. ACTIVATION (immunity) SUPPRESSION (tolerance) Autoimmunity Immunodeficiency
Tolerance 2. Regulatory T cells; why tolerance fails. Abul K. Abbas UCSF. FOCiS
 1 Tolerance 2. Regulatory T cells; why tolerance fails Abul K. Abbas UCSF FOCiS 2 Lecture outline Regulatory T cells: functions and clinical relevance Pathogenesis of autoimmunity: why selftolerance fails
Medical Virology Immunology. Dr. Sameer Naji, MB, BCh, PhD (UK) Head of Basic Medical Sciences Dept. Faculty of Medicine The Hashemite University
 Head of Basic Medical Sciences Dept. Faculty of Medicine The Hashemite University") Medical Virology Immunology Dr. Sameer Naji, MB, BCh, PhD (UK) Head of Basic Medical Sciences Dept. Faculty of Medicine The Hashemite University Human blood cells Phases of immune responses Microbe Naïve
Medical Virology Immunology Dr. Sameer Naji, MB, BCh, PhD (UK) Head of Basic Medical Sciences Dept. Faculty of Medicine The Hashemite University Human blood cells Phases of immune responses Microbe Naïve
Allergy and Immunology Review Corner: Chapter 19 of Immunology IV: Clinical Applications in Health and Disease, by Joseph A. Bellanti, MD.
 Allergy and Immunology Review Corner: Chapter 19 of Immunology IV: Clinical Applications in Health and Disease, by Joseph A. Bellanti, MD. Chapter 19: Tolerance, Autoimmunity, and Autoinflammation Prepared
Structure and Function of Antigen Recognition Molecules
 MICR2209 Structure and Function of Antigen Recognition Molecules Dr Allison Imrie allison.imrie@uwa.edu.au 1 Synopsis: In this lecture we will examine the major receptors used by cells of the innate and
Adaptive immunity. Adaptive Immunity. Principles of immune defense. Adaptive immunity. against extracellular or intracellular pathogens
 Principles of immune defense Toxicology Course Vienna MODULE 12 Immunotoxicology, Allergy July 2, 2008 Prof. Erika Jensen-Jarolim, MD Dept. of Pathophysiology Medical University Vienna Gastrointestinaltrakt:
Antigen Presentation to Lymphocytes
 Antigen Presentation to Lymphocytes Jiyang O Wang, Chiba Cancer Center Research Institute, Chiba, Japan Takeshi Watanabe, Medical Institute of Bioregulation, Kyushu University, Fukuoka, Japan Antigen presentation
VMC-221: Veterinary Immunology and Serology (1+1) Question Bank
 Question Bank") VMC-221: Veterinary Immunology and Serology (1+1) Objective type Questions Question Bank Q. No. 1 - Fill up the blanks with correct words 1. The British physician, who developed the first vaccine against
VMC-221: Veterinary Immunology and Serology (1+1) Objective type Questions Question Bank Q. No. 1 - Fill up the blanks with correct words 1. The British physician, who developed the first vaccine against
T Cell Development. Xuefang Cao, MD, PhD. November 3, 2015
 T Cell Development Xuefang Cao, MD, PhD November 3, 2015 Thymocytes in the cortex of the thymus Early thymocytes development Positive and negative selection Lineage commitment Exit from the thymus and
Cytokines modulate the functional activities of individual cells and tissues both under normal and pathologic conditions Interleukins,
 Cytokines http://highered.mcgraw-hill.com/sites/0072507470/student_view0/chapter22/animation the_immune_response.html Cytokines modulate the functional activities of individual cells and tissues both under
Introduction to Immunology Part 2 September 30, Dan Stetson
 Introduction to Immunology Part 2 September 30, 2016 Dan Stetson stetson@uw.edu 441 Lecture #2 Slide 1 of 26 CLASS ANNOUNCEMENT PLEASE NO TREE NUTS IN CLASS!!! (Peanuts, walnuts, almonds, cashews, etc)
Supplemental Table I.
 Supplemental Table I Male / Mean ± SEM n Mean ± SEM n Body weight, g 29.2±0.4 17 29.7±0.5 17 Total cholesterol, mg/dl 534.0±30.8 17 561.6±26.1 17 HDL-cholesterol, mg/dl 9.6±0.8 17 10.1±0.7 17 Triglycerides,
Antigen Presentation and T Lymphocyte Activation. Abul K. Abbas UCSF. FOCiS
 1 Antigen Presentation and T Lymphocyte Activation Abul K. Abbas UCSF FOCiS 2 Lecture outline Dendritic cells and antigen presentation The role of the MHC T cell activation Costimulation, the B7:CD28 family
MACROPHAGE "MONOCYTES" SURFACE RECEPTORS
 LECTURE: 13 Title: MACROPHAGE "MONOCYTES" SURFACE RECEPTORS LEARNING OBJECTIVES: The student should be able to: Describe the blood monocytes (size, and shape of nucleus). Enumerate some of the monocytes
How the Innate Immune System Profiles Pathogens
 How the Innate Immune System Profiles Pathogens Receptors on macrophages, neutrophils, dendritic cells for bacteria and viruses Broad specificity - Two main groups of bacteria: gram positive, gram-negative
Cellular Pathology of immunological disorders
 Cellular Pathology of immunological disorders SCBM344 Cellular and Molecular Pathology Witchuda Payuhakrit, Ph.D (Pathobiology) witchuda.pay@mahidol.ac.th Objectives Describe the etiology of immunological
Chapter 17B: Adaptive Immunity Part II
 Chapter 17B: Adaptive Immunity Part II 1. Cell-Mediated Immune Response 2. Humoral Immune Response 3. Antibodies 1. The Cell-Mediated Immune Response Basic Steps of Cell-Mediated IR 1 2a CD4 + MHC cl.
SPECIFIC IMMUNITY = ACQUIRED IMMUNITY = ADAPTIVE IMMUNITY SPECIFIC IMMUNITY - BASIC CHARACTERISTIC
 SPECIFIC IMMUNITY - BASIC CHARACTERISTIC SPECIFIC IMMUNITY = ACQUIRED IMMUNITY = ADAPTIVE IMMUNITY BASIC TERMINOLOGY SPECIFIC IMMUNITY humoral mediated with antibodies cellular mediated with T lymphocytes
How plasma cells develop. Deutsches Rheuma Forschungs Zentrum, Berlin Institut der Leibniz Gemeinschaft
 How plasma cells develop Deutsches Rheuma Forschungs Zentrum, Berlin Institut der Leibniz Gemeinschaft 1 Plasma cells develop from activated B cells Toll Like Receptor B Cell Receptor B cell B cell microbia
Blood and Immune system Acquired Immunity
 Blood and Immune system Acquired Immunity Immunity Acquired (Adaptive) Immunity Defensive mechanisms include : 1) Innate immunity (Natural or Non specific) 2) Acquired immunity (Adaptive or Specific) Cell-mediated
Macrophage Activation & Cytokine Release. Dendritic Cells & Antigen Presentation. Neutrophils & Innate Defense
 Macrophage Activation & Cytokine Release Dendritic Cells & Antigen Presentation Neutrophils & Innate Defense Neutrophils Polymorphonuclear cells (PMNs) are recruited to the site of infection where they