Supplementary Material
|
|
|
- Rosamund Webb
- 5 years ago
- Views:
Transcription
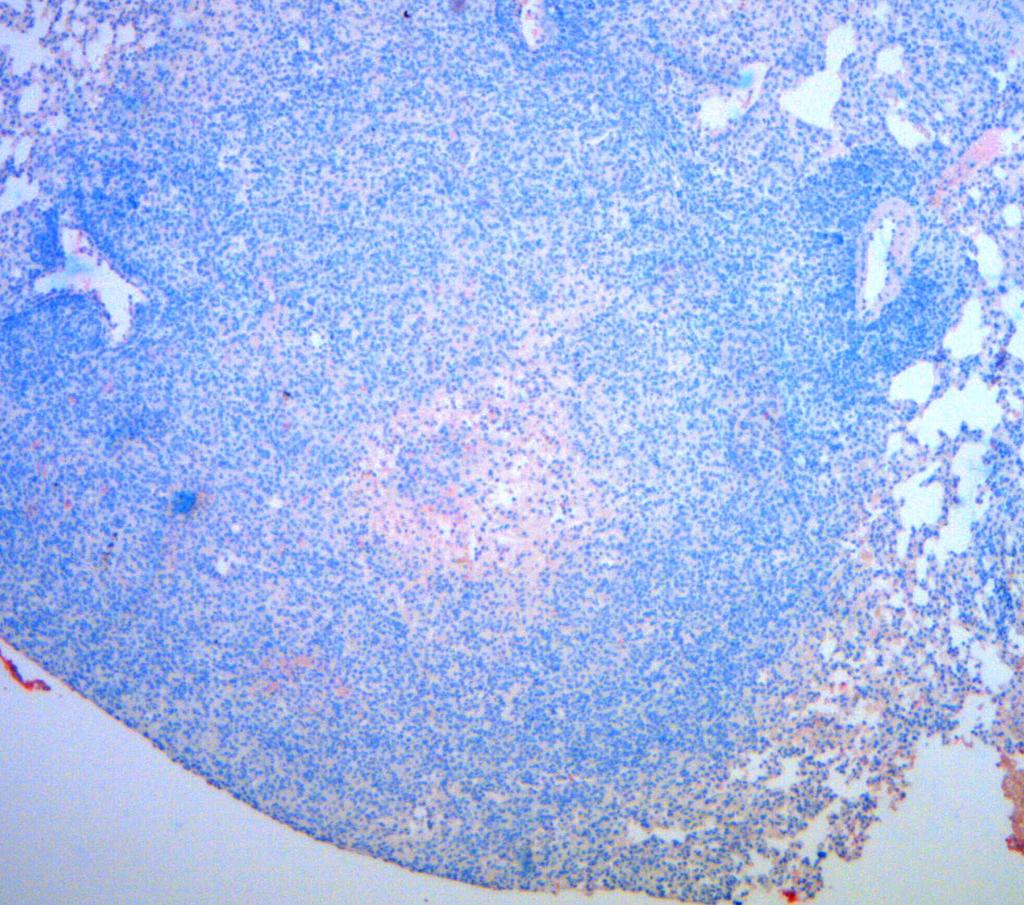
1 Supplementary Material Supplementary Figure 1. NOS2 -/- mice develop an analogous Ghon complex after infection in the ear dermis and show dissemination of Mtb to the lung. (A) WT and NOS2 -/- mice were infected in the ear dermis with 10 4 Mtb and colony-forming units (c.f.u.) from homogenates of ear dermis, dermis draining auricular lymph node (dln) and spleen were enumerated on days 1, 7, 14, 28 and 50 p.i. C.f.u. are shown at each time point as mean ± SEM (n=5). After day 14 p.i., NOS2 -/- mice showed diminished ability to control Mtb replication at both sites compared to WT. (B) Hematoxylin and eosin (HE) staining of dln at days 28 and 56 p.i. demonstrated necrosis in NOS2 -/-, but not WT mice (magnification x 25). (C) Higher magnification revealed non-ordered granulomatous necrosis with a predominantly neutrophilic infiltrate (x 200). Supplementary Figure 2. Dermal-infected NOS2 -/- but not WT mice demonstrate steady-stae Mtb infection of the lung. Lung c.f.u. from WT and NOS2 -/- mice at days 1, 7, 14, 28 and 56 p.i. after dermal Mtb infection are shown as mean ± SE (n=5). WT mice showed an absence of cultivatible c.f.u. in the lung after day 14 p.i. while NOS2 -/- mice showed stable c.f.u. in the lung after day 14 p.i. indicating establishment of a stable Mtb infection. Supplementary Figures 3 and 4. Dermal-infected (black bars) WT and NOS2 -/- mice develop robust Mtb-specific T-cell responses in the lung in the face of reduced bacterial load compared to aerosol-infected mice (white bars). Cells purified from the lungs of infected mice at days 14 and 28 p.i. were stimulated for 6 h with ESAT-6 peptide, PPD or medium only and stained for intracellular expression of IFN-γ and TNF-α and analyzed by FACS. Percentage CD4 + -gated T cells staining for IFN-γ or IFN-γ and TNF-α are shown as mean (n=3) ± SEM.
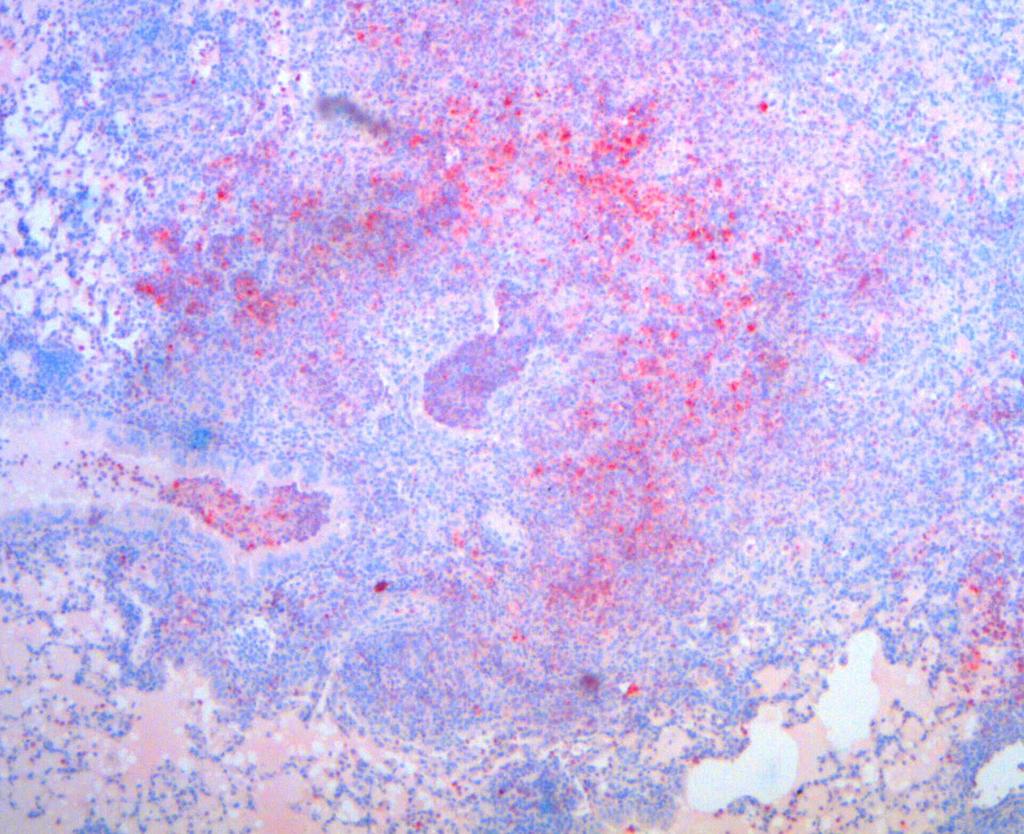
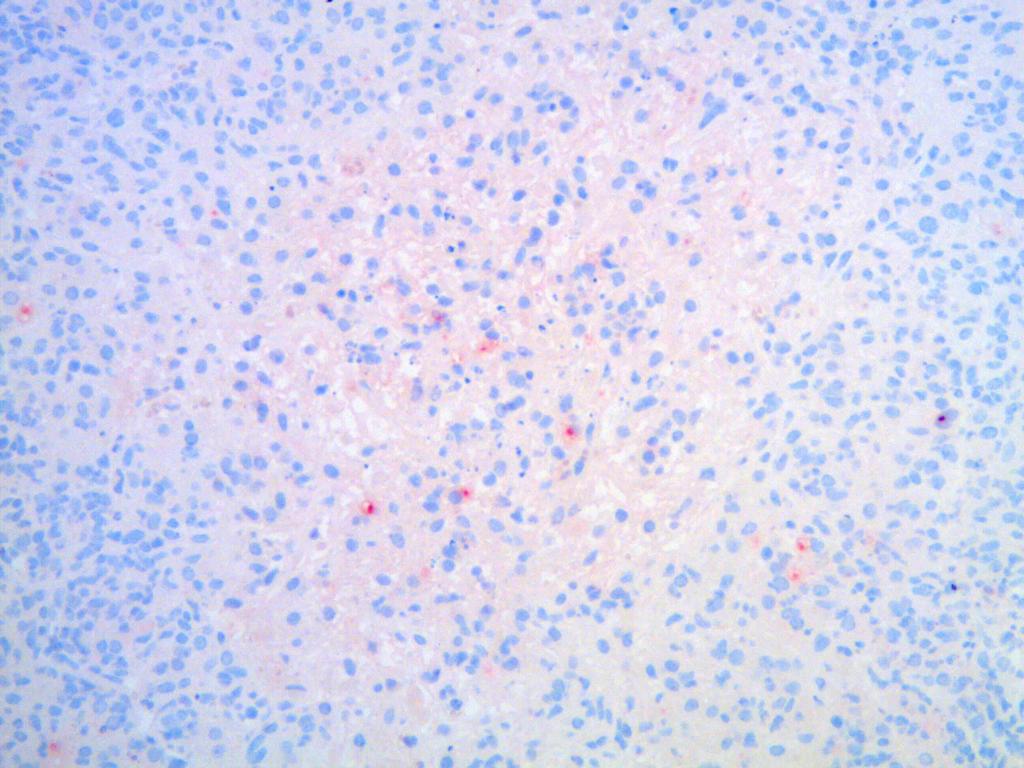
2 Supplementary Figure 5. Effects of cytokine blocking on development of lung Mtb-specific T- cell responses in dermal-infected NOS2 -/- mice. Cells purified from the lungs of dermal-infected TNF-α (red bars), IFN-γ-depleted (white bars) or control (non-blocked NOS2 -/- : black bars) mice at day 28 p.i. were stimulated for 6 h with ESAT-6 peptide, PPD or medium only and stained for intracellular expression of IFN-γ and TNF-α and analyzed by FACS. Percentage of CD4 + -gated T cells staining for IFN-γ or both IFN-γ and TNF-α shown as mean (n=3) ± SEM. Supplementary Figure 6. Caseous granulomas in NOS2 -/- mice (d56 p.i.) resemble caseating granulomas observed during human tuberculosis. (A) Staining with anti-cd3 and anti-f4/80 mabs revealed T cells and macrophages encircling the central necrotic core in granulomas of NOS2 -/- mice. Similar configurations of T cells and macrophages within human caseous granulomas during active tuberculosis were observed. (B) Competitive microarray analyses of cdna transcribed from pooled mrna purified from lungs of mice (n=3) day 28 p.i. Numbers are representative of fold change in ctsg, NE and Prtn3 expression of NOS2 -/- vs WT or IFN-γdepleted NOS2 -/- vs control NOS2 -/- mice. Fold changes >2 and p<1 are highlighted in blue. Supplementary Figure 7. Comparison of myeloperoxidase (MPO) staining in the lungs of NOS2 -/- mice after aerosol Mtb infection (d30 p.i.) or dermal infection with IFN-γ or TNF-α blocking (d56 p.i.) (n=5). Aerosol-infected mice demonstrated strong MPO staining due to marked neutrophillic infiltrates into the lung. In contrast, caseous granulomas in the lung after dermal infection with IFN-γ or TNF-α blocking contained fewer neutrophils with MPO staining markedly weaker. Top panels x 100 and lower panels x 400 magnification.
3 Supplementary Figure 8. Exogenous h-ctsg reduces intracellular growth of Mtb in vitro and AEBSF treatment does not affect bacterial burden in control dermal-infected NOS2 -/- mice. (A) Direct enumeration of c.f.u. from IFN-γ-activated macrophages infected with Mtb (MOI 2, 72 h p.i.) with and without exogenous addition of 10µg/ml h-ctsg (n=5). Data corroborates the reduction in intracellular bacterial growth on addition of h-ctsg observed by measurement of incorporation of [3H] Uracil into bacterial DNA. (B) Bacterial burden of tissue homogenates from dermal-infected NOS2 -/- mice in auricular lymph node (dln), spleen and lung after twice weekly treatment with AEBSF. C.f.u. at day 56 p.i. are shown as mean ± SEM (n=5). (C) Measurement of maximum velocity of h-ctsg activity (Vmax) by proteolysis of the chromogenic peptide N- succinyl-ala-ala-pro-phe-p-nitroanilide. Vmax of pure h-ctsg correlated linearly with enzyme concentration in the assay.


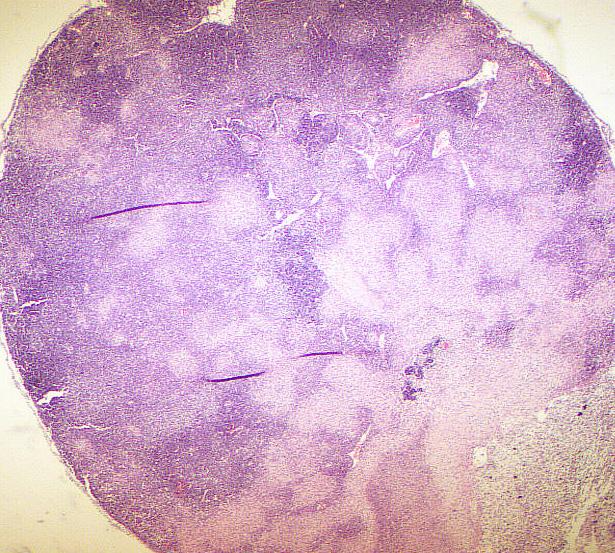
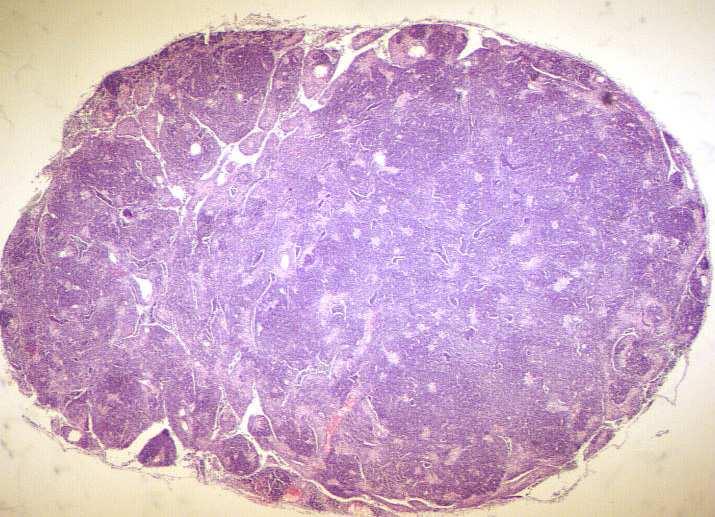
4 A) Dermis dln Log c.f.u. B) wt Spleen Day p.i. NOS2-/- c) d28 d28 d56 d56 Supplementary Figure. 1
5 Log cfu/lung Detection Limit =10 Day p.i. Supplementary Figure. 2
6 NOS2 -/- wt d14 p.i. % CD4 + IFN-γ d28 p.i Medium PPD Esat-6 Medium PPD Esat-6 Supplementary Figure. 3
7 NOS2 -/- wt % CD4 + IFN-γ + TNF-α d14 p.i d28 p.i Medium PPD Esat-6 Medium PPD Esat-6 Supplementary Figure. 4
8 Esat-6 PPD Medium % CD4 + IFN-γ + TNF-α + % CD4 + IFN-γ + Supplementary Figure. 5
 Protease Class NOS2")

")
 2.")


9 A) HE CD3 F4/80 Mouse Human CD68 B) Protease Class NOS2 -/- vs wt INF-γ-blocked NOS2 -/- vs NOS2 -/- Cathepsin G (ctsg) Serine Neurophil Elastase (ela2) Proteinase 3 (Prtn3) Cathepsin E (ctse) Aspartic Cathepsin K (ctsk) Cysteine 1,35-1,96 Calpain 3 (capn3) -1, >2 fold, p<1 Supplementary Figure. 6

10 Aerosol Anti-MPO Supplementary Figure. 7 Dermal

11 A) B) C) Supplementary Figure. 8
Serine protease activity contributes to control of Mycobacterium tuberculosis in hypoxic lung granulomas in mice
 Serine protease activity contributes to control of Mycobacterium tuberculosis in hypoxic lung granulomas in mice Stephen T. Reece,, Gary A. Silverman, Stefan H.E. Kaufmann J Clin Invest. 2010;120(9):3365-3376.
Spleen. mlns. E Spleen 4.1. mlns. Spleen. mlns. Mock 17. Mock CD8 HIV-1 CD38 HLA-DR. Ki67. Spleen. Spleen. mlns. Cheng et al. Fig.
 C D E F Mock 17 Mock 4.1 CD38 57 CD8 23.7 HLA-DR Ki67 G H I Cheng et al. Fig.S1 Supplementary Figure 1. persistent infection leads to human T cell depletion and hyper-immune activation. Humanized mice
SUPPLEMENTARY INFORMATION
 doi:1.138/nature1554 a TNF-α + in CD4 + cells [%] 1 GF SPF 6 b IL-1 + in CD4 + cells [%] 5 4 3 2 1 Supplementary Figure 1. Effect of microbiota on cytokine profiles of T cells in GALT. Frequencies of TNF-α
Supplementary Figure 1: TSLP receptor skin expression in dcssc. A: Healthy control (HC) skin with TSLP receptor expression in brown (10x
 skin with TSLP receptor expression in brown (10x") Supplementary Figure 1: TSLP receptor skin expression in dcssc. A: Healthy control (HC) skin with TSLP receptor expression in brown (10x magnification). B: Second HC skin stained for TSLP receptor in brown
Supplementary Figure 1: TSLP receptor skin expression in dcssc. A: Healthy control (HC) skin with TSLP receptor expression in brown (10x magnification). B: Second HC skin stained for TSLP receptor in brown
Exosomes function in antigen presentation during an in vivo Mycobacterium tuberculosis infection
 Exosomes function in antigen presentation during an in vivo Mycobacterium tuberculosis infection Victoria L. Smith, Yong Cheng, Barry R. Bryant and Jeffrey S. Schorey Supplementary Figure 1: Unprocessed
% of live splenocytes. STAT5 deletion. (open shapes) % ROSA + % floxed
 % ROSA + % floxed") Supp. Figure 1. a 14 1 1 8 6 spleen cells (x1 6 ) 16 % of live splenocytes 5 4 3 1 % of live splenocytes 8 6 4 b 1 1 c % of CD11c + splenocytes (closed shapes) 8 6 4 8 6 4 % ROSA + (open shapes) % floxed
Supp. Figure 1. a 14 1 1 8 6 spleen cells (x1 6 ) 16 % of live splenocytes 5 4 3 1 % of live splenocytes 8 6 4 b 1 1 c % of CD11c + splenocytes (closed shapes) 8 6 4 8 6 4 % ROSA + (open shapes) % floxed
Supplementary Figures
 Inhibition of Pulmonary Anti Bacterial Defense by IFN γ During Recovery from Influenza Infection By Keer Sun and Dennis W. Metzger Supplementary Figures d a Ly6G Percentage survival f 1 75 5 1 25 1 5 1
1 + denotes a higher variable value for the deletion or depletion than the control scenario; - denotes a lower value.
 Table S1. Significant changes in granuloma variables at 200 days post-infection for deletion and depletion of combinations of two individual TNF activities versus the baseline control scenario 1. Sample
Supplemental Figure 1
 Supplemental Figure 1 1a 1c PD-1 MFI fold change 6 5 4 3 2 1 IL-1α IL-2 IL-4 IL-6 IL-1 IL-12 IL-13 IL-15 IL-17 IL-18 IL-21 IL-23 IFN-α Mut Human PD-1 promoter SBE-D 5 -GTCTG- -1.2kb SBE-P -CAGAC- -1.kb
Supplementary Figure 1. Characterization of basophils after reconstitution of SCID mice
 Supplementary figure legends Supplementary Figure 1. Characterization of after reconstitution of SCID mice with CD4 + CD62L + T cells. (A-C) SCID mice (n = 6 / group) were reconstituted with 2 x 1 6 CD4
SUPPLEMENTARY FIGURE 1
 SUPPLEMENTARY FIGURE 1 A LN Cell count (1 ) 1 3 1 CD+ 1 1 CDL lo CD hi 1 CD+FoxP3+ 1 1 1 7 3 3 3 % of cells 9 7 7 % of cells CD+ 3 1 % of cells CDL lo CD hi 1 1 % of CD+ cells CD+FoxP3+ 3 1 % of CD+ T
Hua Tang, Weiping Cao, Sudhir Pai Kasturi, Rajesh Ravindran, Helder I Nakaya, Kousik
 SUPPLEMENTARY FIGURES 1-19 T H 2 response to cysteine-proteases requires dendritic cell-basophil cooperation via ROS mediated signaling Hua Tang, Weiping Cao, Sudhir Pai Kasturi, Rajesh Ravindran, Helder
Supplementary Figure 1.
 Supplementary Figure 1. Female Pro-ins2 -/- mice at 5-6 weeks of age were either inoculated i.p. with a single dose of CVB4 (1x10 5 PFU/mouse) or PBS and treated with αgalcer or control vehicle. On day
Serum cytokine levels in control and tumor-bearing male and female mice at day 15.
 Supplementary Table 1. Serum cytokine levels in control and tumor-bearing male and female mice at day 15. Male Female Cytokine Control C-26 Control C-26 IL-1β 2.0 ± 0.8 9.6 ± 1.5* 1.8 ± 0.2 6.8 ± 1.4*
Supplementary Table 1 Clinicopathological characteristics of 35 patients with CRCs
 Supplementary Table Clinicopathological characteristics of 35 patients with CRCs Characteristics Type-A CRC Type-B CRC P value Sex Male / Female 9 / / 8.5 Age (years) Median (range) 6. (9 86) 6.5 (9 76).95
Supplementary table I. Real-time primers used in the study. The fold change was obtained by
 Supplementary table I. Real-time primers used in the study. The fold change was obtained by normalizing the gene expression number to those of HPRT, then comparing the samples to untreated or naive mice.
SUPPLEMENTARY INFORMATION
 Supplemental Figure 1. Furin is efficiently deleted in CD4 + and CD8 + T cells. a, Western blot for furin and actin proteins in CD4cre-fur f/f and fur f/f Th1 cells. Wild-type and furin-deficient CD4 +
Supplementary Figure 1. mrna expression of chitinase and chitinase-like protein in splenic immune cells. Each splenic immune cell population was
 Supplementary Figure 1. mrna expression of chitinase and chitinase-like protein in splenic immune cells. Each splenic immune cell population was sorted by FACS. Surface markers for sorting were CD11c +
Supplementary Figure 1. ETBF activate Stat3 in B6 and Min mice colons
 Supplementary Figure 1 ETBF activate Stat3 in B6 and Min mice colons a pstat3 controls Pos Neg ETBF 1 2 3 4 b pstat1 pstat2 pstat3 pstat4 pstat5 pstat6 Actin Figure Legend: (a) ETBF induce predominantly
IL-34 is a tissue-restricted ligand of CSF1R required for the development of Langerhans cells and microglia
 Supplementary Figures IL-34 is a tissue-restricted ligand of CSF1R required for the development of Langerhans cells and microglia Yaming Wang, Kristy J. Szretter, William Vermi, Susan Gilfillan, Cristina
Supporting Information
 Supporting Information Valkenburg et al. 10.1073/pnas.1403684111 SI Materials and Methods ELISA and Microneutralization. Sera were treated with Receptor Destroying Enzyme II (RDE II, Accurate) before ELISA
Pair-fed % inkt cells 0.5. EtOH 0.0
 MATERIALS AND METHODS Histopathological analysis Liver tissue was collected 9 h post-gavage, and the tissue samples were fixed in 1% formalin and paraffin-embedded following a standard procedure. The embedded
Supplemental Figure 1. Signature gene expression in in vitro differentiated Th0, Th1, Th2, Th17 and Treg cells. (A) Naïve CD4 + T cells were cultured
 Naïve CD4 + T cells were cultured") Supplemental Figure 1. Signature gene expression in in vitro differentiated Th0, Th1, Th2, Th17 and Treg cells. (A) Naïve CD4 + T cells were cultured under Th0, Th1, Th2, Th17, and Treg conditions. mrna
Supplemental Figure 1. Signature gene expression in in vitro differentiated Th0, Th1, Th2, Th17 and Treg cells. (A) Naïve CD4 + T cells were cultured under Th0, Th1, Th2, Th17, and Treg conditions. mrna
Nature Immunology: doi: /ni eee Supplementary Figure 1
 eee Supplementary Figure 1 Hyphae induce NET release, but yeast do not. (a) NET release by human peripheral neutrophils stimulated with a hgc1 yeast-locked C. albicans mutant (yeast) or pre-formed WT C.
Supplementary Fig. 1 p38 MAPK negatively regulates DC differentiation. (a) Western blot analysis of p38 isoform expression in BM cells, immature DCs
 Western blot analysis of p38 isoform expression in BM cells, immature DCs") Supplementary Fig. 1 p38 MAPK negatively regulates DC differentiation. (a) Western blot analysis of p38 isoform expression in BM cells, immature DCs (idcs) and mature DCs (mdcs). A myeloma cell line expressing
Supplementary Fig. 1 p38 MAPK negatively regulates DC differentiation. (a) Western blot analysis of p38 isoform expression in BM cells, immature DCs (idcs) and mature DCs (mdcs). A myeloma cell line expressing
Nature Medicine doi: /nm.3957
 Supplementary Fig. 1. p38 alternative activation, IL-21 expression, and T helper cell transcription factors in PDAC tissue. (a) Tissue microarrays of pancreatic tissue from 192 patients with pancreatic
Supplementary Figures
 Supplementary Figures Supplementary Figure 1. NKT ligand-loaded tumour antigen-presenting B cell- and monocyte-based vaccine induces NKT, NK and CD8 T cell responses. (A) The cytokine profiles of liver
SUPPLEMENTARY MATERIAL
 SUPPLEMENTARY MATERIAL IL-1 signaling modulates activation of STAT transcription factors to antagonize retinoic acid signaling and control the T H 17 cell it reg cell balance Rajatava Basu 1,5, Sarah K.
ECM1 controls T H 2 cell egress from lymph nodes through re-expression of S1P 1
 ZH, Li et al, page 1 ECM1 controls T H 2 cell egress from lymph nodes through re-expression of S1P 1 Zhenhu Li 1,4,Yuan Zhang 1,4, Zhiduo Liu 1, Xiaodong Wu 1, Yuhan Zheng 1, Zhiyun Tao 1, Kairui Mao 1,
Aggregated neutrophil extracellular traps limit inflammation by degrading cytokines and chemokines
 CORRECTION NOTICE Nat. Med. doi:10.1038/nm.3547; corrected online 25 August 2014 Aggregated neutrophil extracellular traps limit inflammation by degrading cytokines and chemokines Christine Schauer, Christina
Soluble TNFRp75 regulates host protective immunity against Mycobacterium tuberculosis
 Soluble TNFRp75 regulates host protective immunity against Mycobacterium tuberculosis Roanne Keeton,, Bernhard Ryffel, Muazzam Jacobs J Clin Invest. 2014;124(4):1537-1551. https://doi.org/10.1172/jci45005.
Supplementary Figure 1 Protease allergens induce IgE and IgG1 production. (a-c)
") 1 Supplementary Figure 1 Protease allergens induce IgE and IgG1 production. (a-c) Serum IgG1 (a), IgM (b) and IgG2 (c) concentrations in response to papain immediately before primary immunization (day
1 Supplementary Figure 1 Protease allergens induce IgE and IgG1 production. (a-c) Serum IgG1 (a), IgM (b) and IgG2 (c) concentrations in response to papain immediately before primary immunization (day
The encephalitogenicity of TH17 cells is dependent on IL-1- and IL-23- induced production of the cytokine GM-CSF
 CORRECTION NOTICE Nat.Immunol. 12, 568 575 (2011) The encephalitogenicity of TH17 cells is dependent on IL-1- and IL-23- induced production of the cytokine GM-CSF Mohamed El-Behi, Bogoljub Ciric, Hong
Supplemental Materials
 Supplemental Materials Programmed death one homolog maintains the pool size of regulatory T cells by promoting their differentiation and stability Qi Wang 1, Jianwei He 1, Dallas B. Flies 2, Liqun Luo
pplementary Figur Supplementary Figure 1. a.
 pplementary Figur Supplementary Figure 1. a. Quantification by RT-qPCR of YFV-17D and YFV-17D pol- (+) RNA in the supernatant of cultured Huh7.5 cells following viral RNA electroporation of respective
Expanded View Figures
 Gregory T Ellis et al Lung damage by monocyte TRIL allows coinfection EMO reports Expanded View Figures % survival Clinical score Influenza Matrix /HPRT (log ) CFU/L (log ) 3 irway early.7.7 + h Survival
Supplemental Information. Gut Microbiota Promotes Hematopoiesis to Control Bacterial Infection. Cell Host & Microbe, Volume 15
 Cell Host & Microbe, Volume 15 Supplemental Information Gut Microbiota Promotes Hematopoiesis to Control Bacterial Infection Arya Khosravi, Alberto Yáñez, Jeremy G. Price, Andrew Chow, Miriam Merad, Helen
Supplementary Figure 1. Deletion of Smad3 prevents B16F10 melanoma invasion and metastasis in a mouse s.c. tumor model.
 A B16F1 s.c. Lung LN Distant lymph nodes Colon B B16F1 s.c. Supplementary Figure 1. Deletion of Smad3 prevents B16F1 melanoma invasion and metastasis in a mouse s.c. tumor model. Highly invasive growth
Pathology of pulmonary tuberculosis. Dr: Salah Ahmed
 Pathology of pulmonary tuberculosis Dr: Salah Ahmed Is a chronic granulomatous disease, caused by Mycobacterium tuberculosis (hominis) Usually it involves lungs but may affect any organ or tissue Transmission:
Supplementary Figure 1. Expression of EPO and EPOR during self-limited versus delayed
 Supplementary Figure 1. Expression of EPO and EPOR during self-limited versus delayed inflammation resolution. a: Flow cytometry analysis showing the electronic gating strategy used to identify peritoneal
Supplementary Figure 1. Example of gating strategy
 Supplementary Figure 1. Example of gating strategy Legend Supplementary Figure 1: First, gating is performed to include only single cells (singlets) (A) and CD3+ cells (B). After gating on the lymphocyte
Supplementary Figure 1 IMQ-Induced Mouse Model of Psoriasis. IMQ cream was
 Supplementary Figure 1 IMQ-Induced Mouse Model of Psoriasis. IMQ cream was painted on the shaved back skin of CBL/J and BALB/c mice for consecutive days. (a, b) Phenotypic presentation of mouse back skin
Supplementary Figure 1. Efficiency of Mll4 deletion and its effect on T cell populations in the periphery. Nature Immunology: doi: /ni.
 Supplementary Figure 1 Efficiency of Mll4 deletion and its effect on T cell populations in the periphery. Expression of Mll4 floxed alleles (16-19) in naive CD4 + T cells isolated from lymph nodes and
Supplementary Figure S1. PTPN2 levels are not altered in proliferating CD8+ T cells. Lymph node (LN) CD8+ T cells from C57BL/6 mice were stained with
 CD8+ T cells from C57BL/6 mice were stained with") Supplementary Figure S1. PTPN2 levels are not altered in proliferating CD8+ T cells. Lymph node (LN) CD8+ T cells from C57BL/6 mice were stained with CFSE and stimulated with plate-bound α-cd3ε (10µg/ml)
Supplementary Figure S1. PTPN2 levels are not altered in proliferating CD8+ T cells. Lymph node (LN) CD8+ T cells from C57BL/6 mice were stained with CFSE and stimulated with plate-bound α-cd3ε (10µg/ml)
MATERIALS AND METHODS. Neutralizing antibodies specific to mouse Dll1, Dll4, J1 and J2 were prepared as described. 1,2 All
 MATERIALS AND METHODS Antibodies (Abs), flow cytometry analysis and cell lines Neutralizing antibodies specific to mouse Dll1, Dll4, J1 and J2 were prepared as described. 1,2 All other antibodies used
Supplementary Figure 1. Ent inhibits LPO activity in a dose- and time-dependent fashion.
 Supplementary Information Supplementary Figure 1. Ent inhibits LPO activity in a dose- and time-dependent fashion. Various concentrations of Ent, DHBA or ABAH were pre-incubated for 10 min with LPO (50
Supplementary Materials for
 www.sciencesignaling.org/cgi/content/full/8/381/ra59/dc1 Supplementary Materials for Analysis of single-cell cytokine secretion reveals a role for paracrine signaling in coordinating macrophage responses
Supplemental Figure 1. Activated splenocytes upregulate Serpina3g and Serpina3f expression.
 Relative Serpin expression 25 2 15 1 5 Serpina3f 1 2 3 4 5 6 8 6 4 2 Serpina3g 1 2 3 4 5 6 C57BL/6 DBA/2 Supplemental Figure 1. Activated splenocytes upregulate Serpina3g and Serpina3f expression. Splenocytes
SUPPLEMENTARY INFORMATION
 doi:10.1038/nature10134 Supplementary Figure 1. Anti-inflammatory activity of sfc. a, Autoantibody immune complexes crosslink activating Fc receptors, promoting activation of macrophages, and WWW.NATURE.COM/NATURE
Experiment #1 TARGET Mouse Model Group. Report prepared by Paul Converse, Ph.D. and Eric Nuermberger, M.D. March 1, 2006
 Protocol for in vivo evaluation of growth rates and pathogenesis of M. tuberculosis strains found to have rapid or slow growth phenotypes in an in vitro model Experiment #1 TARGET Mouse Model Group Report
Supplementary information to: Mechanism of lipopolysaccharide-induced skin edema formation in the mouse
 Supplementary information to: Mechanism of lipopolysaccharide-induced skin edema formation in the mouse Ivan Zanoni*, Renato Ostuni*, Simona Barresi, Marco Di Gioia, Achille Broggi, Barbara Costa, Roberta
Supporting Information
 Supporting Information Desnues et al. 10.1073/pnas.1314121111 SI Materials and Methods Mice. Toll-like receptor (TLR)8 / and TLR9 / mice were generated as described previously (1, 2). TLR9 / mice were
Supplementary Materials for
 www.sciencetranslationalmedicine.org/cgi/content/full/8/352/352ra110/dc1 Supplementary Materials for Spatially selective depletion of tumor-associated regulatory T cells with near-infrared photoimmunotherapy
Supplemental Information. CD4 + CD25 + Foxp3 + Regulatory T Cells Promote. Th17 Cells In Vitro and Enhance Host Resistance
 Immunity, Volume 34 Supplemental Information D4 + D25 + + Regulatory T ells Promote Th17 ells In Vitro and Enhance Host Resistance in Mouse andida albicans Th17 ell Infection Model Pushpa Pandiyan, Heather
SUPPLEMENTARY INFORMATION
 DOI:.38/ncb3399 a b c d FSP DAPI 5mm mm 5mm 5mm e Correspond to melanoma in-situ Figure a DCT FSP- f MITF mm mm MlanaA melanoma in-situ DCT 5mm FSP- mm mm mm mm mm g melanoma in-situ MITF MlanaA mm mm
Generation of ST2-GFP reporter mice and characterization of ILC1 cells following infection
 Supplementary Figure 1 Generation of ST2-GFP reporter mice and characterization of ILC1 cells following infection with influenza virus. (a) ST2-GFP reporter mice were generated as described in Methods.
L1 on PyMT tumor cells but Py117 cells are more responsive to IFN-γ. (A) Flow
 Flow") A MHCI B PD-L1 Fold expression 8 6 4 2 Fold expression 3 2 1 No tx 1Gy 2Gy IFN Py117 Py117 Supplementary Figure 1. Radiation and IFN-γ enhance MHCI expression and PD- L1 on PyMT tumor cells but Py117 cells
A MHCI B PD-L1 Fold expression 8 6 4 2 Fold expression 3 2 1 No tx 1Gy 2Gy IFN Py117 Py117 Supplementary Figure 1. Radiation and IFN-γ enhance MHCI expression and PD- L1 on PyMT tumor cells but Py117 cells
Supplementary Information. Tissue-wide immunity against Leishmania. through collective production of nitric oxide
 Supplementary Information Tissue-wide immunity against Leishmania through collective production of nitric oxide Romain Olekhnovitch, Bernhard Ryffel, Andreas J. Müller and Philippe Bousso Supplementary
Supplementary Figure 1. Generation of knockin mice expressing L-selectinN138G. (a) Schematics of the Sellg allele (top), the targeting vector, the
 Schematics of the Sellg allele (top), the targeting vector, the") Supplementary Figure 1. Generation of knockin mice expressing L-selectinN138G. (a) Schematics of the Sellg allele (top), the targeting vector, the targeted allele in ES cells, and the mutant allele in
Supplementary Figure 1. Generation of knockin mice expressing L-selectinN138G. (a) Schematics of the Sellg allele (top), the targeting vector, the targeted allele in ES cells, and the mutant allele in
Peli1 negatively regulates T-cell activation and prevents autoimmunity
 Peli1 negatively regulates T-cell activation and prevents autoimmunity Mikyoung Chang 1,*, Wei Jin 1,5,*, Jae-Hoon Chang 1, Yi-chuan Xiao 1, George Brittain 1, Jiayi Yu 1, Xiaofei Zhou 1, Yi-Hong Wang
Nature Immunology: doi: /ni Supplementary Figure 1. Cytokine pattern in skin in response to urushiol.
 Supplementary Figure 1 Cytokine pattern in skin in response to urushiol. Wild-type (WT) and CD1a-tg mice (n = 3 per group) were sensitized and challenged with urushiol (uru) or vehicle (veh). Quantitative
Supplementary Figure 1. NAFL enhanced immunity of other vaccines (a) An over-the-counter, hand-held non-ablative fractional laser (NAFL).
 An over-the-counter, hand-held non-ablative fractional laser (NAFL).") Supplementary Figure 1. NAFL enhanced immunity of other vaccines (a) An over-the-counter, hand-held non-ablative fractional laser (NAFL). (b) Depiction of a MTZ array generated by NAFL. (c-e) IgG production
Supplementary Figure 1. NAFL enhanced immunity of other vaccines (a) An over-the-counter, hand-held non-ablative fractional laser (NAFL). (b) Depiction of a MTZ array generated by NAFL. (c-e) IgG production
Supplementary information. The proton-sensing G protein-coupled receptor T-cell death-associated gene 8
 1 Supplementary information 2 3 The proton-sensing G protein-coupled receptor T-cell death-associated gene 8 4 (TDAG8) shows cardioprotective effects against myocardial infarction 5 Akiomi Nagasaka 1+,
B220 CD4 CD8. Figure 1. Confocal Image of Sensitized HLN. Representative image of a sensitized HLN
 B220 CD4 CD8 Natarajan et al., unpublished data Figure 1. Confocal Image of Sensitized HLN. Representative image of a sensitized HLN showing B cell follicles and T cell areas. 20 µm thick. Image of magnification
Blocking antibodies and peptides. Rat anti-mouse PD-1 (29F.1A12, rat IgG2a, k), PD-
, PD-") Supplementary Methods Blocking antibodies and peptides. Rat anti-mouse PD-1 (29F.1A12, rat IgG2a, k), PD- L1 (10F.9G2, rat IgG2b, k), and PD-L2 (3.2, mouse IgG1) have been described (24). Anti-CTLA-4 (clone
Supplementary Methods Blocking antibodies and peptides. Rat anti-mouse PD-1 (29F.1A12, rat IgG2a, k), PD- L1 (10F.9G2, rat IgG2b, k), and PD-L2 (3.2, mouse IgG1) have been described (24). Anti-CTLA-4 (clone
SUPPLEMENTARY METHODS
 SUPPLEMENTARY METHODS Histological analysis. Colonic tissues were collected from 5 parts of the middle colon on day 7 after the start of DSS treatment, and then were cut into segments, fixed with 4% paraformaldehyde,
Supplemental Information. Checkpoint Blockade Immunotherapy. Induces Dynamic Changes. in PD-1 CD8 + Tumor-Infiltrating T Cells
 Immunity, Volume 50 Supplemental Information Checkpoint Blockade Immunotherapy Induces Dynamic Changes in PD-1 CD8 + Tumor-Infiltrating T Cells Sema Kurtulus, Asaf Madi, Giulia Escobar, Max Klapholz, Jackson
Online Data Supplement. Induction of Pulmonary Granuloma Formation by Propionibacterium acnes is regulated by. MyD88 and Nox2
 Online Data Supplement Induction of Pulmonary Granuloma Formation by Propionibacterium acnes is regulated by MyD88 and Nox2 Jessica L. Werner *, Sylvia G. Escolero *, Jeff T. Hewlett *, Tim N. Mak *3,
<10. IL-1β IL-6 TNF + _ TGF-β + IL-23
 3 ns 25 ns 2 IL-17 (pg/ml) 15 1 ns ns 5 IL-1β IL-6 TNF
Tbk1-TKO! DN cells (%)! 15! 10!
! 15! 10!") a! T Cells! TKO! B Cells! TKO! b! CD4! 8.9 85.2 3.4 2.88 CD8! Tbk1-TKO! 1.1 84.8 2.51 2.54 c! DN cells (%)! 4 3 2 1 DP cells (%)! 9 8 7 6 CD4 + SP cells (%)! 5 4 3 2 1 5 TKO! TKO! TKO! TKO! 15 1 5 CD8
a! T Cells! TKO! B Cells! TKO! b! CD4! 8.9 85.2 3.4 2.88 CD8! Tbk1-TKO! 1.1 84.8 2.51 2.54 c! DN cells (%)! 4 3 2 1 DP cells (%)! 9 8 7 6 CD4 + SP cells (%)! 5 4 3 2 1 5 TKO! TKO! TKO! TKO! 15 1 5 CD8
Final published version:
 Boosting BCG-primed responses with a subunit Apa vaccine during the waning phase improves immunity and imparts protection against Mycobacterium tuberculosis Subhadra Nandakumar, Centers for Disease Control
Supplemental materials
 Supplemental materials 1 Supplemental Fig. 1 Immunogram This immunogram summarizes patient clinical data and immune parameters at corresponding time points for Patient IMF-32. The top panel illustrates
IKK-dependent activation of NF-κB contributes to myeloid and lymphoid leukemogenesis by BCR-ABL1
 Supplemental Figures BLOOD/2014/547943 IKK-dependent activation of NF-κB contributes to myeloid and lymphoid leukemogenesis by BCR-ABL1 Hsieh M-Y and Van Etten RA Supplemental Figure S1. Titers of retroviral
Yolanda González, Claudia Carranza, Marco Iñiguez, Martha Torres, Raul Quintana, Alvaro Osornio, Carol Gardner, Srijata Sarkar, and Stephan Schwander
 Inhaled Air Pollution Particulate Matter in Alveolar Macrophages Alters local pro-inflammatory Cytokine and peripheral IFNγ Production in Response to Mycobacterium tuberculosis Yolanda González, Claudia
B6/COLODR/SPL/11C/83/LAP/#2.006 B6/COLODR/SPL/11C/86/LAP/#2.016 CD11C B6/COLODR/SPL/11C/80/LAP/#2.011 CD11C
 CD3-specific antibody-induced immune tolerance and suppression of autoimmune encephalomyelitis involves TGF-β production through phagocytes digesting apoptotic T cells Sylvain Perruche 1,3, Pin Zhang 1,
ACTIVATION OF T LYMPHOCYTES AND CELL MEDIATED IMMUNITY
 ACTIVATION OF T LYMPHOCYTES AND CELL MEDIATED IMMUNITY The recognition of specific antigen by naïve T cell induces its own activation and effector phases. T helper cells recognize peptide antigens through
Aquaporin-9-expressing neutrophils are required for the establishment of contact hypersensitivity
 Supplemental Material quaporin-9-expressing neutrophils are required for the establishment of contact hypersensitivity atharina Sagita Moniaga 1, Sachiko Watanabe 1, Tetsuya Honda 1, 2, Søren Nielsen 3,
TLR9 regulates the mycobacteria-elicited pulmonary granulomatous immune response in mice through DC-derived Notch ligand delta-like 4
 Research article TLR9 regulates the mycobacteria-elicited pulmonary granulomatous immune response in mice through DC-derived Notch ligand delta-like 4 Toshihiro Ito, 1,2 Matthew Schaller, 1 Cory M. Hogaboam,
Supplementary Figure 1 CD4 + T cells from PKC-θ null mice are defective in NF-κB activation during T cell receptor signaling. CD4 + T cells were
 Supplementary Figure 1 CD4 + T cells from PKC-θ null mice are defective in NF-κB activation during T cell receptor signaling. CD4 + T cells were isolated from wild type (PKC-θ- WT) or PKC-θ null (PKC-θ-KO)
SUPPLEMENTARY INFORMATION
 Complete but curtailed T-cell response to very-low-affinity antigen Dietmar Zehn, Sarah Y. Lee & Michael J. Bevan Supp. Fig. 1: TCR chain usage among endogenous K b /Ova reactive T cells. C57BL/6 mice
Supplementary Figure 1. Normal T lymphocyte populations in Dapk -/- mice. (a) Normal thymic development in Dapk -/- mice. Thymocytes from WT and Dapk
 Normal thymic development in Dapk -/- mice. Thymocytes from WT and Dapk") Supplementary Figure 1. Normal T lymphocyte populations in Dapk -/- mice. (a) Normal thymic development in Dapk -/- mice. Thymocytes from WT and Dapk -/- mice were stained for expression of CD4 and CD8.
Supplementary Figure 1. Normal T lymphocyte populations in Dapk -/- mice. (a) Normal thymic development in Dapk -/- mice. Thymocytes from WT and Dapk -/- mice were stained for expression of CD4 and CD8.
Nature Immunology: doi: /ni Supplementary Figure 1. Gene expression profile of CD4 + T cells and CTL responses in Bcl6-deficient mice.
 Supplementary Figure 1 Gene expression profile of CD4 + T cells and CTL responses in Bcl6-deficient mice. (a) Gene expression profile in the resting CD4 + T cells were analyzed by an Affymetrix microarray
IL-22 mediates mucosal host defense against gram negative bacterial pneumonia
 IL-22 mediates mucosal host defense against gram negative bacterial pneumonia Shean J. Aujla, Yvonne R. Chan, Mingquan Zheng, Mingjian Fei, David J. Askew, Derek A. Pociask,Todd A. Reinhart, Florencia
Louis Joslyn Dept of Bioinformatics With Dr. Denise Kirschner and Dr. Jennifer Linderman
 Immunology of TB: insights from in vivo models and implications for prevention Louis Joslyn Dept of Bioinformatics With Dr. Denise Kirschner and Dr. Jennifer Linderman Dendritic cell (DC) DC responds to
number Done by Corrected by Doctor Mousa Al-Abbadi
 number 11 Done by Husam Abu-Awad Corrected by Muhammad Tarabieh Doctor Mousa Al-Abbadi The possible outcomes of an acute inflammation are the following: 1- A complete resolution in which the tissue returns
Programmed necrosis, not apoptosis, is a key mediator of cell loss and DAMP-mediated inflammation in dsrna-induced retinal degeneration
 Programmed necrosis, not apoptosis, is a key mediator of cell loss and DAMP-mediated inflammation in dsrna-induced retinal degeneration The Harvard community has made this article openly available. Please
Nature Genetics: doi: /ng Supplementary Figure 1
 Supplementary Figure 1 MSI2 interactors are associated with the riboproteome and are functionally relevant. (a) Coomassie blue staining of FLAG-MSI2 immunoprecipitated complexes. (b) GO analysis of MSI2-interacting
number Done by Corrected by Doctor موسى العبادي
 number 12 Done by Corrected by Doctor موسى العبادي Morphology of Granulomatous Inflammations The first image (left) shows a lung alveolus in which necrosis is taking place. The image below it shows the
SUPPLEMENTARY INFORMATION
 In the format provided by the authors and unedited. SUPPLEMENTARY INFORMATION VOLUME: 2 ARTICLE NUMBER: 17084 Metabolic anticipation in Mycobacterium tuberculosis Hyungjin Eoh, Zhe Wang, Emilie Layre,
Perspective in novel TB vaccine development Mohamed Ridha BARBOUCHE M.D., Ph.D. Department of Immunology Institut Pasteur de Tunis
 Perspective in novel TB vaccine development Mohamed Ridha BARBOUCHE M.D., Ph.D. Department of Immunology Institut Pasteur de Tunis Existing TB Vaccine is not effective for global TB epidemic control BCG
COPD lungs show an attached stratified mucus layer that separate. bacteria from the epithelial cells resembling the protective colonic
 COPD lungs show an attached stratified mucus layer that separate bacteria from the epithelial cells resembling the protective colonic mucus SUPPLEMENTARY TABLES AND FIGURES Tables S1 S8, page 1 and separate
Bezzi et al., Supplementary Figure 1 *** Nature Medicine: doi: /nm Pten pc-/- ;Zbtb7a pc-/- Pten pc-/- ;Pml pc-/- Pten pc-/- ;Trp53 pc-/-
 Gr-1 Gr-1 Gr-1 Bezzi et al., Supplementary Figure 1 a Gr1-CD11b 3 months Spleen T cells 3 months Spleen B cells 3 months Spleen Macrophages 3 months Spleen 15 4 8 6 c CD11b+/Gr1+ cells [%] 1 5 b T cells
Supporting Information
 Supporting Information Aldridge et al. 10.1073/pnas.0900655106 Fig. S1. Flow diagram of sublethal (a) and lethal (b) influenza virus infections. (a) Infection of lung epithelial cells by influenza virus
4. Th1-related gene expression in infected versus mock-infected controls from Fig. 2 with gene annotation.
 List of supplemental information 1. Graph of mouse weight loss during course of infection- Line graphs showing mouse weight data during course of infection days 1 to 10 post-infections (p.i.). 2. Graph
Title of file for HTML: Supplementary Information Description: Supplementary Figures and Supplementary Table
 Title of file for HTML: Supplementary Information Description: Supplementary Figures and Supplementary Table Title of file for HTML: Peer Review File Description: Innate Scavenger Receptor-A regulates
Supplementary Table 1. Functional avidities of survivin-specific T-cell clones against LML-peptide
 Supplementary Table 1. Functional avidities of survivin-specific T-cell clones against LML-peptide pulsed T2 cells. clone avidity by 4-hour 51 Cr-release assay 50% lysis at E:T 10:1 [LML peptide, M] #24
Supplemental Figure 1. Gating strategies for flow cytometry and intracellular cytokinestaining
 Supplemental Figure 1. Gating strategies for flow cytometry and intracellular cytokinestaining of PBMCs. Forward scatter area (FSC-A) versus side scatter area (SSC-A) was used to select lymphocytes followed
SUPPLEMENTARY FIGURES
 SUPPLEMENTARY FIGURES Supplementary Figure 1: Chemokine receptor expression profiles of CCR6 + and CCR6 - CD4 + IL-17A +/ex and Treg cells. Quantitative PCR analysis of chemokine receptor transcript abundance
REGULATION OF GRANULOMA FORMATION IN MURINE MODELS OF TUBERCULOSIS. Holly Marie Scott. Bachelors of Science, Mount Union College, 1998
 REGULATION OF GRANULOMA FORMATION IN MURINE MODELS OF TUBERCULOSIS by Holly Marie Scott Bachelors of Science, Mount Union College, 1998 Submitted to the Graduate Faculty of School of Medicine in partial
Tuberculosis. By: Shefaa Q aqa
 Tuberculosis By: Shefaa Q aqa Tuberculosis is a communicable chronic granulomatous disease caused by Mycobacterium tuberculosis. It usually involves the lungs but may affect any organ or tissue in the