COPD lungs show an attached stratified mucus layer that separate. bacteria from the epithelial cells resembling the protective colonic
|
|
|
- Adam Daniel
- 5 years ago
- Views:
Transcription
1 COPD lungs show an attached stratified mucus layer that separate bacteria from the epithelial cells resembling the protective colonic mucus SUPPLEMENTARY TABLES AND FIGURES Tables S1 S8, page 1 and separate Excel files Figure Legends S1 S9, pages 2 5 Figures S1 S9, pages 6-13 Supplementary Tables are given as separate Excel files. Table S1. Patients from whom BALF samples were collected. Table S2. Mass spectrometry based proteomics of BALF obtained from human never smoker (n=5) asymptomatic smokers (n=12) and COPD (n=42). Table S3. Mass spectrometry based absolute quantification of MUC5AC, MUC5B, AGR2, CLCA1, DMBT1, FCGBP, MSLN, MUC1, MUC2, PSCA, TFF3, TGM2 and ZG16B in BALF obtained from human never smoker (n=5) asymptomatic smokers (n=12) and COPD (n=42). Table S4. Mass spectrometry based proteomics of whole BALF and BALF supernatants (SN) after centrifugation obtained from saline- and PPE-exposed mice. Table S5. Mass spectrometry based absolute quantification of Muc5ac and Muc5b in whole BALF, BALF supernatants after centrifugation (SN), mucus plugs, and isolated epithelial cells obtained from saline- and PPE-exposed mice. Table S6. Mass spectrometry based proteomics of isolated airway mucus plugs as stained by Alcian blue and obtained from PPE-exposed mice. Table S7. Mass spectrometry based proteomics of isolated airway epithelial cells obtained from saline- and PPE-exposed mice. Table S8. Isotopically labelled peptides used for absolute quantification of human and mouse proteins. 1
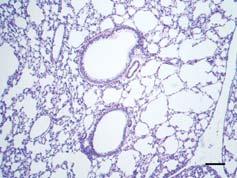
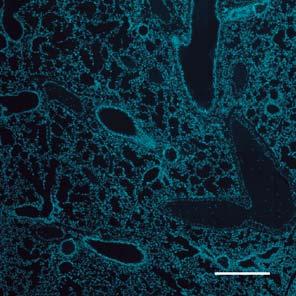
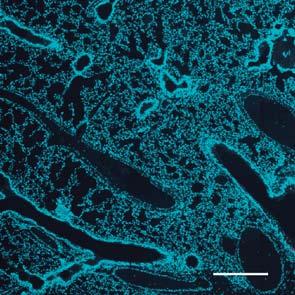
2 Figure S1. Heat map of the BALF proteome. The localization of some mucus proteins discussed is marked. Never smokers (n=5), asymptomatic smokers (n=12) and chronic obstructive pulmonary disease (COPD) patients (n=42). Figure S2. Heat map of proteins absolutely quantified with isotopically labelled peptides by mass spectrometry in BALF. Never smokers (n=5), asymptomatic smokers (n=12) and chronic obstructive pulmonary disease (COPD) patients (n=42). Figure S3. The enzymatic activity of PPE was inactivated by PMSF. (A) Graph showing fluorescence measured every 5 min for 1 h by cleavage of the BODIPY casein substrate as a measure of serine peptidase activity (EnzChek Protease Assay Kit; Invitrogen). Enzymatic activity of PPE was evaluated before and after incubation with 1 mm PMSF overnight at 4ºC. PMSF fully inhibited PPE peptidase activity, as the fluorescence signal was equivalent to that measured for a.9% saline solution, used as a blank. Results shown are representative of two experiments. Triplicate wells were used for each sample. Mean ± SEM. Two-way repeated measures ANOVA and Tukey s post-test. **** P<.1 vs. active PPE. (B and C) Low and high magnification images of lungs from mice exposed to inactivated PPE. Scale bar in C, 1 μm. Figure S4. The distribution of airway mucus obstruction induced by PPE in mice is related to the diameter of the airways. (A) Image showing a transverse section of an airway and the representation of its minimum Feret s diameter (XFmin), defined as the shortest distance between any two parallel tangents on the airway. 2
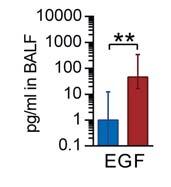
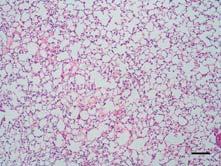
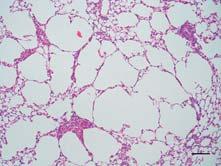
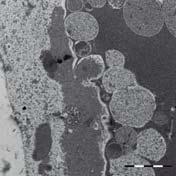
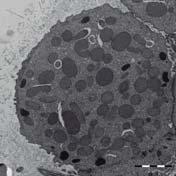
3 Scale bar, 5 µm. (B) The XFmin was assessed for each airway section classified depending on its level of obstruction in mice exposed to PPE. Individual data, medians and interquartile ranges. P <.5*, P <.1** and P <.1**** vs. the 1-3 % obstruction range, Kruskal-Wallis with Dunn s post hoc test. (C) The same data as in B, but the y-axis was cut at 5 µm to illustrate airways smaller than 5 µm in diameter. (D) The correlation between XFmin and obstruction levels was studied both including all airway sections [r (1) ] or only airway sections with a percentage of obstruction higher than 1 % [r (2) ]. Two-tailed Spearman s correlation. Each dot represents an airway section. n=591 airway sections from 9 animals. (E) The same data as in D but the y-axis was cut at 5 µm to illustrate airways smaller than 5 µm in diameter. Figure S5. Intranasal PPE induced lung inflammation and structural damage. (A) Transmission electron micrographs showing secretory cells, which in PPEexposed mice contained electron lucent vesicles and released their content to the airway lumen. Representative of 3 animals/group. Scale bars, 2 μm. (B) Fomaldehyde fixed paraffin sections stained with H&E revealed alveolar breakdown could be observed in mice challenged with PPE compared with controls instilled with saline. (A and B) Representative of 4-5 animals/group. Scale bars, 1 μm. (C) Comparison of cytokine and chemokine levels in BALF from vehicle and PPEexposed mice, n = 9-17 animals/group, data presented as median ± interquartile range, IL-1β P =.1**, IL-4 P <.1****, IL-5 P <.1****, IL-6 P =.2*, KC, TNFα, TARC and MDC P <.1****, EGF P =.1**, Mann-Whitney U test. KC: Keratinocyte-derived chemokine; TARC: Thymus and activation-regulated chemokine; MDC: Macrophage-derived chemokine. 3
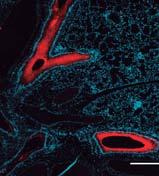
4 Figure S6. Characterization of isolated mouse airway epithelial cells. (A) Initial percentage of epithelial cells (EpCAM+), leukocytes (CD45+) and neutrophils (Ly- 6G+) in a pooled cellular suspension recovered from three mice induced by intranasal administration of LPS. (B and C) Percentage of CD45+ cells and Ly-6G+ cells recovered by magnetic beads and by this depleted from the initial cellular suspension. (D) Purity of the recovered epithelial cellular suspension after the two negative selections removal of CD45+ and Ly-6G+ cells by magnetic beads. Figure S7. Immunostainings confirm increased production of mucus-related proteins. (A D) Representative low magnification images of lung sections from vehicle (Saline)- and PPE- exposed mice stained with Muc5b (red; A), Muc5ac (red; B), Clca1 (red; C) and Fcgbp (red; D). Dot plots graphs quantifying the fluorescence intensity of proteins stain expressed as percentage of the mean intensity in salineexposed mice (taken as 1%). n = 9 animals/group, data presented as median ± interquartile range, (A) P =.2***, (B) P <.1****, (C) P <.1****, (D) P =.1**, Mann-Whitney U test. Scale bars, 5 µm. (E) Confocal microscope images showing the colocalization of Muc5ac and Muc5b in the airways after administration of saline (left) or PPE (right). Representative of 4 mice/group. Scale bars, 5 µm. Nuclei are stained blue. Figure S8. Mucus-related proteins overexpression induced by PPE in mice depends on the proteolytic activity of PPE. (A-F) Representative low magnification images of lung sections from mice exposed to PPE inactivated by 4
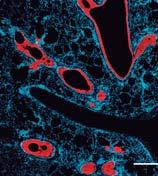
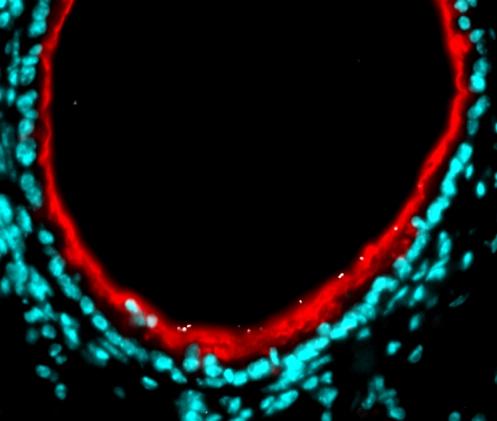
5 PMSF. Sections were stained for Muc5b (red; A), Muc5ac (red; B), Clca1 (red; C) and Fcgbp (red; D). Scale bars, 5 µm. Confocal microscope high magnification images showing the overproduction of Clca1 (E) and Fcgbp (F) by airway epithelial cells and their accumulation in mucus plugs after PPE intranasal instillation. Scale bars, 5 µm. (A-F) Representative of 4-9 animals/group. Nuclei are stained blue. Figure S9. Immunostaining by Muc5b of lungs of control mice and by Muc5ac on PPE-treated mice followed by treatment with saline or hypertonic saline and the instillation of Pseudomonas bacterial. A) Immunostaining of Muc5b mucin (green) in non-treated animals. Staining of goblet cells is shown, but no mucus layer. Nuclei stained blue. Representative of 3 mice, scale 3 µm. B) PPE-exposed lungs were instilled with P. aeruginosa, BAL was collected after 1 min by instilling,8 ml PBS and aspirating it back twice, then the lungs were isolated, fixed in Carnoy and immunostained for Muc5ac (red), P. aeruginosa (white), and nuclei (blue). Bacteria are trapped by the mucus and was not removed by washing with PBS. Representative of 3 mice, scale 3 µm C) PPE-exposed lungs were instilled with P. aeruginosa, BAL was collected after 1 min by instilling for two times,8 ml hypertonic saline (7%) and aspirating it back after 2 min. Then, the lungs were isolated, fixed in Carnoy and immunostained for Muc5ac (red), P. aeruginosa (white), and nuclei (blue). The bacteria are trapped in the stagnated adherent lung mucus that persisted after treatment with 7% hypertonic saline. Representative of 4 mice, scale 3 µm. 5

6 Figure S1 MUC5AC MUC5B AGR2 DMBT1 FCGBP TFF3 TGM2 ZG16B Never smoker 1_3 Never smoker 1_4 Never smoker 1_2 Never smoker 1_5 Never smoker 1_1 COPD 1_2 Asymptomatic smoker 1_7 COPD 1_11 COPD 5_35 Asymptomatic smoker 1_9 COPD 5_31 COPD 5_3 COPD 5_33 COPD 1_13 Asymptomatic smoker 1_6 Asymptomatic smoker 1_8 Asymptomatic smoker 5_38 Asymptomatic smoker 5_32 Asymptomatic smoker 5_22 Asymptomatic smoker 5_1 Asymptomatic smoker 5_2 Asymptomatic smoker 5_9 Asymptomatic smoker 5_1 COPD 5_7 COPD 5_14 COPD 1_12 COPD 5_29 Asymptomatic smoker 5_28 COPD 5_36 COPD 5_5 COPD 5_12 COPD 5_3 COPD 1_1 COPD 1_19 COPD 5_4 COPD 5_13 COPD 1_18 COPD 5_6 COPD 5_18 COPD 5_24 COPD 1_15 COPD 1_17 COPD 5_19 COPD 5_11 COPD 5_15 COPD 5_2 COPD 5_25 COPD 5_26 COPD 5_21 COPD 5_16 COPD 1_21 COPD 5_37 COPD 5_34 COPD 5_8 COPD 5_23 COPD 1_14 COPD 5_17 LFQ intensity, Log N/A

7 Figure S2 Fmo/uL, Log1 scale AGR2 MUC5AC DMBT1 MUC5B PSCA MUC1 ZG16B FCGBP MSLN TGM2 TFF3 COPD 5_34 COPD 5_16 COPD 5_21 COPD 5_19 COPD 5_8 COPD 5_23 COPD 1_21 COPD 5_3 COPD 1_14 COPD 5_2 COPD 5_15 COPD 5_31 COPD 5_17 COPD 5_5 COPD 5_37 COPD 5_18 COPD 5_12 COPD 5_25 COPD 5_11 COPD 5_26 COPD 5_3 COPD 1_13 COPD 5_13 COPD 5_4 COPD 1_2 COPD 1_18 COPD 5_35 COPD 1_19 Asymptomatic smoker 5_9 COPD 5_33 COPD 1_17 Asymptomatic smoker 5_32 Asymptomatic smoker 5_1 Asymptomatic smoker 5_22 Asymptomatic smoker 5_1 COPD 5_24 COPD 5_14 COPD 1_12 COPD 5_7 COPD 1_11 Asymptomatic smoker 5_28 COPD 1_1 Asymptomatic smoker 5_38 COPD 5_36 COPD 5_29 COPD 5_6 COPD 1_16 COPD 5_27 Asymptomatic smoker 1_6 Never smoker 1_4 Asymptomatic smoker 5_2 Asymptomatic smoker 1_9 COPD 1_15 Asymptomatic smoker 1_7 Never smoker 1_3 Never smoker 1_5 Never smoker 1_2 Asymptomatic smoker 1_8 Never smoker 1_1

8 Figure S3 A B C
 75 5 25-1 1-3 3-5 5-75")
 P <.")
9 Figure S4 A XFmin B 1 XFmin ( m) **** * ** C 5 D 1 XFmin ( m) Obstruction (%) r =.2173 (1) P <.1 (1) r =.3517 (2) P <.1 (2) E Obstruction (%)


10 Figure S5 A Saline PPE B Saline PPE C

 FSC 5K 4K")


11 Figure S6 A Airway cellular suspension before depletion of immune cells B Cellular fraction CD45 + FSC 5K 4K 3K 2K 1K FMO (EpCAM) FSC 5K 4K 3K 2K 1K CD EpCAM Ly-6G Ly-6G CD C Cellular fraction Ly-6G + D Recovered fraction Ly-6G - CD K CD Ly-6G CD Ly-6G FSC 4K 3K 2K 1K EpCAM


12 Figure S7 A B C D Saline Nuclei Muc5b Saline Nuclei Muc5ac Saline Nuclei Clca1 Saline Nuclei Fcgbp PPE PPE PPE PPE E E Saline PP Saline PPE Muc5ac Muc5b Overlapping Nuclei


13 Figure S8 A B C E Nuclei Muc5b Nuclei Clca1 Nuclei Clca1 D F Nuclei Muc5ac Nuclei Fcgbp Nuclei Fcgbp


14 Figure S9 A Muc5b Nuclei B C Muc5ac Nuclei Pseudomonas
Supplementary Figure 1. Characterization of basophils after reconstitution of SCID mice
 Supplementary figure legends Supplementary Figure 1. Characterization of after reconstitution of SCID mice with CD4 + CD62L + T cells. (A-C) SCID mice (n = 6 / group) were reconstituted with 2 x 1 6 CD4
Aggregated neutrophil extracellular traps limit inflammation by degrading cytokines and chemokines
 CORRECTION NOTICE Nat. Med. doi:10.1038/nm.3547; corrected online 25 August 2014 Aggregated neutrophil extracellular traps limit inflammation by degrading cytokines and chemokines Christine Schauer, Christina
FIG S1 Replication rates of S. suis strain 10, 10Δsly, and 10cpsΔEF on mono- and virus pre-infected porcine PCLS.
 A strain 10 10cps EF B strain 10 H1N1 + strain 10 10cps EF H1N1 + 10cps EF 10 8 10 sly 10 7 H3N2 + strain 10 H3N2 + 10cps EF CFU/ml media 10 7 10 6 10 5 10 4 CFU/ml media 10 6 10 5 10 4 10 3 0 2 4 8 12
Nature Neuroscience: doi: /nn Supplementary Figure 1
 Supplementary Figure 1 Quantification of myelin fragments in the aging brain (a) Electron microscopy on corpus callosum is shown for a 18-month-old wild type mice. Myelin fragments (arrows) were detected
Generation of ST2-GFP reporter mice and characterization of ILC1 cells following infection
 Supplementary Figure 1 Generation of ST2-GFP reporter mice and characterization of ILC1 cells following infection with influenza virus. (a) ST2-GFP reporter mice were generated as described in Methods.
Supplementary Information
 Supplementary Information TABLE S1. SUBJECT CHARACTERISTICS* Normal Control Subjects Subjects with Asthma p Value Number 23 48 Age (years) 35±10 35±10 0.75 Sex, M:F (% F) 9:12 (57) 17:26 (60) 0.76 FEV1
Supplementary Figure 1.
 Supplementary Figure 1. Female Pro-ins2 -/- mice at 5-6 weeks of age were either inoculated i.p. with a single dose of CVB4 (1x10 5 PFU/mouse) or PBS and treated with αgalcer or control vehicle. On day
Supplementary Figures
 Inhibition of Pulmonary Anti Bacterial Defense by IFN γ During Recovery from Influenza Infection By Keer Sun and Dennis W. Metzger Supplementary Figures d a Ly6G Percentage survival f 1 75 5 1 25 1 5 1
Supplementary Figures
 Supplementary Figures Supplementary Figure 1 Characterization of stable expression of GlucB and sshbira in the CT26 cell line (a) Live cell imaging of stable CT26 cells expressing green fluorescent protein
Nature Immunology: doi: /ni Supplementary Figure 1
 Supplementary Figure 1 NLRP12 is downregulated in biopsy samples from patients with active ulcerative colitis (UC). (a-g) NLRP12 expression in 7 UC mrna profiling studies deposited in NCBI GEO database.
Supplementary Figure 1: STAT3 suppresses Kras-induced lung tumorigenesis
 Supplementary Figure 1: STAT3 suppresses Kras-induced lung tumorigenesis (a) Immunohistochemical (IHC) analysis of tyrosine 705 phosphorylation status of STAT3 (P- STAT3) in tumors and stroma (all-time
Supplementary Figure 1. Antibiotic partially rescues mice from sepsis. (ab) BALB/c mice under CLP were treated with antibiotic or PBS.
 BALB/c mice under CLP were treated with antibiotic or PBS.") 1 Supplementary Figure 1. Antibiotic partially rescues mice from sepsis. (ab) BALB/c mice under CLP were treated with antibiotic or PBS. (a) Survival curves. WT Sham (n=5), WT CLP or WT CLP antibiotic
1 Supplementary Figure 1. Antibiotic partially rescues mice from sepsis. (ab) BALB/c mice under CLP were treated with antibiotic or PBS. (a) Survival curves. WT Sham (n=5), WT CLP or WT CLP antibiotic
Supplementary Figure 1.TRIM33 binds β-catenin in the nucleus. a & b, Co-IP of endogenous TRIM33 with β-catenin in HT-29 cells (a) and HEK 293T cells
 and HEK 293T cells") Supplementary Figure 1.TRIM33 binds β-catenin in the nucleus. a & b, Co-IP of endogenous TRIM33 with β-catenin in HT-29 cells (a) and HEK 293T cells (b). TRIM33 was immunoprecipitated, and the amount of
Supplementary Figure 1.TRIM33 binds β-catenin in the nucleus. a & b, Co-IP of endogenous TRIM33 with β-catenin in HT-29 cells (a) and HEK 293T cells (b). TRIM33 was immunoprecipitated, and the amount of
SUPPLEMENTARY INFORMATION. CXCR4 inhibitors could benefit to HER2 but not to Triple-Negative. breast cancer patients
 SUPPLEMENTARY INFORMATION CXCR4 inhibitors could benefit to HER2 but not to Triple-Negative breast cancer patients Lefort S. 1,2, Thuleau A. 3, Kieffer Y. 1,2, Sirven P. 1,2, Bieche I. 4, Marangoni E.
B220 CD4 CD8. Figure 1. Confocal Image of Sensitized HLN. Representative image of a sensitized HLN
 B220 CD4 CD8 Natarajan et al., unpublished data Figure 1. Confocal Image of Sensitized HLN. Representative image of a sensitized HLN showing B cell follicles and T cell areas. 20 µm thick. Image of magnification
Supplementary Figure 1
 Supplementary Figure 1 AAV-GFP injection in the MEC of the mouse brain C57Bl/6 mice at 4 months of age were injected with AAV-GFP into the MEC and sacrificed at 7 days post injection (dpi). (a) Brains
SHREE ET AL, SUPPLEMENTAL MATERIALS. (A) Workflow for tumor cell line derivation and orthotopic implantation.
 Workflow for tumor cell line derivation and orthotopic implantation.") SHREE ET AL, SUPPLEMENTAL MATERIALS SUPPLEMENTAL FIGURE AND TABLE LEGENDS Supplemental Figure 1. Derivation and characterization of TS1-TGL and TS2-TGL PyMT cell lines and development of an orthotopic
SHREE ET AL, SUPPLEMENTAL MATERIALS SUPPLEMENTAL FIGURE AND TABLE LEGENDS Supplemental Figure 1. Derivation and characterization of TS1-TGL and TS2-TGL PyMT cell lines and development of an orthotopic
Programmed necrosis, not apoptosis, is a key mediator of cell loss and DAMP-mediated inflammation in dsrna-induced retinal degeneration
 Programmed necrosis, not apoptosis, is a key mediator of cell loss and DAMP-mediated inflammation in dsrna-induced retinal degeneration The Harvard community has made this article openly available. Please
VEGFR2-Mediated Vascular Dilation as a Mechanism of VEGF-Induced Anemia and Bone Marrow Cell Mobilization
 Cell Reports, Volume 9 Supplemental Information VEGFR2-Mediated Vascular Dilation as a Mechanism of VEGF-Induced Anemia and Bone Marrow Cell Mobilization Sharon Lim, Yin Zhang, Danfang Zhang, Fang Chen,
Nature Immunology: doi: /ni eee Supplementary Figure 1
 eee Supplementary Figure 1 Hyphae induce NET release, but yeast do not. (a) NET release by human peripheral neutrophils stimulated with a hgc1 yeast-locked C. albicans mutant (yeast) or pre-formed WT C.
Santulli G. et al. A microrna-based strategy to suppress restenosis while preserving endothelial function
 ONLINE DATA SUPPLEMENTS Santulli G. et al. A microrna-based strategy to suppress restenosis while preserving endothelial function Supplementary Figures Figure S1 Effect of Ad-p27-126TS on the expression
Supplemental Table 1: Demographics and characteristics of study participants. Male, n (%) 3 (20%) 6 (50%) Age, years [mean ± SD] 33.3 ± ± 9.
![Supplemental Table 1: Demographics and characteristics of study participants. Male, n (%) 3 (20%) 6 (50%) Age, years [mean ± SD] 33.3 ± ± 9.](/thumbs/90/103696086.jpg "Supplemental Table 1: Demographics and characteristics of study participants. Male, n (%) 3 (20%) 6 (50%) Age, years [mean ± SD] 33.3 ± ± 9.") SUPPLEMENTAL DATA Supplemental Table 1: Demographics and characteristics of study participants Lean (n=15) Obese (n=12) Male, n (%) 3 (20%) 6 (50%) Age, years [mean ± SD] 33.3 ± 9.5 44.8 ± 9.1 White, n
SUPPLEMENTAL DATA Supplemental Table 1: Demographics and characteristics of study participants Lean (n=15) Obese (n=12) Male, n (%) 3 (20%) 6 (50%) Age, years [mean ± SD] 33.3 ± 9.5 44.8 ± 9.1 White, n
Supplementary Figure 1: Hsp60 / IEC mice are embryonically lethal (A) Light microscopic pictures show mouse embryos at developmental stage E12.
 Light microscopic pictures show mouse embryos at developmental stage E12.") Supplementary Figure 1: Hsp60 / IEC mice are embryonically lethal (A) Light microscopic pictures show mouse embryos at developmental stage E12.5 and E13.5 prepared from uteri of dams and subsequently genotyped.
Supplementary Figure 1: Hsp60 / IEC mice are embryonically lethal (A) Light microscopic pictures show mouse embryos at developmental stage E12.5 and E13.5 prepared from uteri of dams and subsequently genotyped.
Supplementary Table 1 Clinicopathological characteristics of 35 patients with CRCs
 Supplementary Table Clinicopathological characteristics of 35 patients with CRCs Characteristics Type-A CRC Type-B CRC P value Sex Male / Female 9 / / 8.5 Age (years) Median (range) 6. (9 86) 6.5 (9 76).95
Type of file: PDF Title of file for HTML: Supplementary Information Description: Supplementary Figures
 Type of file: PDF Title of file for HTML: Supplementary Information Description: Supplementary Figures Type of file: MOV Title of file for HTML: Supplementary Movie 1 Description: NLRP3 is moving along
Supplementary Figure 1. Ent inhibits LPO activity in a dose- and time-dependent fashion.
 Supplementary Information Supplementary Figure 1. Ent inhibits LPO activity in a dose- and time-dependent fashion. Various concentrations of Ent, DHBA or ABAH were pre-incubated for 10 min with LPO (50
Nature Methods: doi: /nmeth Supplementary Figure 1
 Supplementary Figure 1 Finite-element analysis of cell cluster dynamics in different cluster trap architectures. (a) Cluster-Chip (b) Filter (c) A structure identical to the Cluster-Chip except that one
a b c Esophageal eosinophilia
 TSLP-elicited basophil responses can mediate the pathogenesis of eosinophilic esophagitis. Mario Noti, Elia D. Tait Wojno, Brian S. Kim, Mark C. Siracusa, Paul R. Giacomin, Meera G. Nair, Alain J. Benitez,
well for 2 h at rt. Each dot represents an individual mouse and bar is the mean ±
 Supplementary data: Control DC Blimp-1 ko DC 8 6 4 2-2 IL-1β p=.5 medium 8 6 4 2 IL-2 Medium p=.16 8 6 4 2 IL-6 medium p=.3 5 4 3 2 1-1 medium IL-1 n.s. 25 2 15 1 5 IL-12(p7) p=.15 5 IFNγ p=.65 4 3 2 1
Supplementary material page 1/10
 Supplementary Figure 1. Metoprolol administration during ongoing AMI reduces MVO in STEMI patients (a, b) Complete representative CMR exams (short-axis covering the entire left ventricle (LV) from base
Supplementary Figure 1. Characterization of human carotid plaques. (a) Flash-frozen human plaques were separated into vulnerable (V) and stable (S),
 Flash-frozen human plaques were separated into vulnerable (V) and stable (S),") Supplementary Figure 1. Characterization of human carotid plaques. (a) Flash-frozen human plaques were separated into vulnerable (V) and stable (S), regions which were then quantified for mean fluorescence
Supplementary Figure 1. Characterization of human carotid plaques. (a) Flash-frozen human plaques were separated into vulnerable (V) and stable (S), regions which were then quantified for mean fluorescence
Role of Tyk-2 in Th9 and Th17 cells in allergic asthma
 Supplementary File Role of Tyk-2 in Th9 and Th17 cells in allergic asthma Caroline Übel 1*, Anna Graser 1*, Sonja Koch 1, Ralf J. Rieker 2, Hans A. Lehr 3, Mathias Müller 4 and Susetta Finotto 1** 1 Laboratory
Supplementary Figure 1 Information on transgenic mouse models and their recording and optogenetic equipment. (a) 108 (b-c) (d) (e) (f) (g)
 108 (b-c) (d) (e) (f) (g)") Supplementary Figure 1 Information on transgenic mouse models and their recording and optogenetic equipment. (a) In four mice, cre-dependent expression of the hyperpolarizing opsin Arch in pyramidal cells
Supplementary Figure 1 Information on transgenic mouse models and their recording and optogenetic equipment. (a) In four mice, cre-dependent expression of the hyperpolarizing opsin Arch in pyramidal cells
Soluble ADAM33 initiates airway remodeling to promote susceptibility for. Elizabeth R. Davies, Joanne F.C. Kelly, Peter H. Howarth, David I Wilson,
 Revised Suppl. Data: Soluble ADAM33 1 Soluble ADAM33 initiates airway remodeling to promote susceptibility for allergic asthma in early life Elizabeth R. Davies, Joanne F.C. Kelly, Peter H. Howarth, David
SUPPLEMENTAL INFORMATIONS
 1 SUPPLEMENTAL INFORMATIONS Figure S1 Cumulative ZIKV production by testis explants over a 9 day-culture period. Viral titer values presented in Figure 1B (viral release over a 3 day-culture period measured
Expanded View Figures
 Gregory T Ellis et al Lung damage by monocyte TRIL allows coinfection EMO reports Expanded View Figures % survival Clinical score Influenza Matrix /HPRT (log ) CFU/L (log ) 3 irway early.7.7 + h Survival
Figure S1. PMVs from THP-1 cells expose phosphatidylserine and carry actin. A) Flow
 Flow") SUPPLEMENTARY DATA Supplementary Figure Legends Figure S1. PMVs from THP-1 cells expose phosphatidylserine and carry actin. A) Flow cytometry analysis of PMVs labelled with annexin-v-pe (Guava technologies)
SUPPLEMENTARY DATA Supplementary Figure Legends Figure S1. PMVs from THP-1 cells expose phosphatidylserine and carry actin. A) Flow cytometry analysis of PMVs labelled with annexin-v-pe (Guava technologies)
Supplementary Figure 1 Expression of Crb3 in mouse sciatic nerve: biochemical analysis (a) Schematic of Crb3 isoforms, ERLI and CLPI, indicating the
 Schematic of Crb3 isoforms, ERLI and CLPI, indicating the") Supplementary Figure 1 Expression of Crb3 in mouse sciatic nerve: biochemical analysis (a) Schematic of Crb3 isoforms, ERLI and CLPI, indicating the location of the transmembrane (TM), FRM binding (FB)
Supplementary Figure 1 Expression of Crb3 in mouse sciatic nerve: biochemical analysis (a) Schematic of Crb3 isoforms, ERLI and CLPI, indicating the location of the transmembrane (TM), FRM binding (FB)
(a) Significant biological processes (upper panel) and disease biomarkers (lower panel)
 Significant biological processes (upper panel) and disease biomarkers (lower panel)") Supplementary Figure 1. Functional enrichment analyses of secretomic proteins. (a) Significant biological processes (upper panel) and disease biomarkers (lower panel) 2 involved by hrab37-mediated secretory
Supplementary Figure 1. Functional enrichment analyses of secretomic proteins. (a) Significant biological processes (upper panel) and disease biomarkers (lower panel) 2 involved by hrab37-mediated secretory
SUPPLEMENTARY INFORMATION
 doi:10.1038/nature10134 Supplementary Figure 1. Anti-inflammatory activity of sfc. a, Autoantibody immune complexes crosslink activating Fc receptors, promoting activation of macrophages, and WWW.NATURE.COM/NATURE
Spleen. mlns. E Spleen 4.1. mlns. Spleen. mlns. Mock 17. Mock CD8 HIV-1 CD38 HLA-DR. Ki67. Spleen. Spleen. mlns. Cheng et al. Fig.
 C D E F Mock 17 Mock 4.1 CD38 57 CD8 23.7 HLA-DR Ki67 G H I Cheng et al. Fig.S1 Supplementary Figure 1. persistent infection leads to human T cell depletion and hyper-immune activation. Humanized mice
Concentration Estimation from Flow Cytometry Exosome Data Protocol
 Concentration Estimation from Flow Cytometry Exosome Data Protocol 1. STANDARD CURVE Create a standard curve for the target exosome by plotting the mean fluorescence (y axis) against the protein concentration
genome edited transient transfection, CMV promoter
 Supplementary Figure 1. In the absence of new protein translation, overexpressed caveolin-1-gfp is degraded faster than caveolin-1-gfp expressed from the endogenous caveolin 1 locus % loss of total caveolin-1-gfp
Type of file: PDF Size of file: 0 KB Title of file for HTML: Supplementary Information Description: Supplementary Figures
 Type of file: PDF Size of file: 0 KB Title of file for HTML: Supplementary Information Description: Supplementary Figures Supplementary Figure 1 mir-128-3p is highly expressed in chemoresistant, metastatic
Fig. S1. Upregulation of K18 and K14 mrna levels during ectoderm specification of hescs. Quantitative real-time PCR analysis of mrna levels of OCT4
 Fig. S1. Upregulation of K18 and K14 mrna levels during ectoderm specification of hescs. Quantitative real-time PCR analysis of mrna levels of OCT4 (n=3 independent differentiation experiments for each
Supplementary fig. 1. Crystals induce necroptosis does not involve caspases, TNF receptor or NLRP3. A. Mouse tubular epithelial cells were pretreated
 Supplementary fig. 1. Crystals induce necroptosis does not involve caspases, TNF receptor or NLRP3. A. Mouse tubular epithelial cells were pretreated with zvad-fmk (10µM) and exposed to calcium oxalate
Supplementary Figure 1: Co-localization of reconstituted L-PTC and dendritic cells
 a CD11c Na + K + ATPase Na + K + ATPase CD11c x-y CD11c Na + K + ATPase Na + K + ATPase CD11c x-z c b x-y view BoNT NAPs CD11c BoNT CD11c NAPs BoNT NAPs CD11c 90 x-z view Apical Basolateral Supplementary
Supplementary Materials and Methods
 Supplementary Materials and Methods Immunoblotting Immunoblot analysis was performed as described previously (1). Due to high-molecular weight of MUC4 (~ 950 kda) and MUC1 (~ 250 kda) proteins, electrophoresis
Suppl Video: Tumor cells (green) and monocytes (white) are seeded on a confluent endothelial
 and monocytes (white) are seeded on a confluent endothelial") Supplementary Information Häuselmann et al. Monocyte induction of E-selectin-mediated endothelial activation releases VE-cadherin junctions to promote tumor cell extravasation in the metastasis cascade
Supplementary Information Häuselmann et al. Monocyte induction of E-selectin-mediated endothelial activation releases VE-cadherin junctions to promote tumor cell extravasation in the metastasis cascade
University of Ulsan College of Medicine, Seoul 05505, Republic of Korea.
 Nanoparticle-Assisted Transcutaneous Delivery of a Signal Transducer and Activator of Transcription 3-Inhibiting Peptide Ameliorates Psoriasis-like Skin Inflammation Jin Yong Kim 1,5, Jinhyo Ahn 3,4, Jinjoo
Supplementary Materials for
 www.sciencesignaling.org/cgi/content/full/8/358/ra2/dc1 Supplementary Materials for Localized TRPA1 channel Ca 2+ signals stimulated by reactive oxygen species promote cerebral artery dilation Michelle
Supplemental Information. CD4 + CD25 + Foxp3 + Regulatory T Cells Promote. Th17 Cells In Vitro and Enhance Host Resistance
 Immunity, Volume 34 Supplemental Information D4 + D25 + + Regulatory T ells Promote Th17 ells In Vitro and Enhance Host Resistance in Mouse andida albicans Th17 ell Infection Model Pushpa Pandiyan, Heather
Endogenous TNFα orchestrates the trafficking of neutrophils into and within lymphatic vessels during acute inflammation
 SUPPLEMENTARY INFORMATION Endogenous TNFα orchestrates the trafficking of neutrophils into and within lymphatic vessels during acute inflammation Samantha Arokiasamy 1,2, Christian Zakian 1, Jessica Dilliway
Supplementary Materials for
 www.sciencemag.org/content/348/6241/aaa825/suppl/dc1 Supplementary Materials for A mucosal vaccine against Chlamydia trachomatis generates two waves of protective memory T cells Georg Stary,* Andrew Olive,
Supplementary Figure 1
 Supplementary Figure 1 Identification of IFN-γ-producing CD8 + and CD4 + T cells with naive phenotype by alternative gating and sample-processing strategies. a. Contour 5% probability plots show definition
Supplementary Table 1. The primers used for quantitative RT-PCR. Gene name Forward (5 > 3 ) Reverse (5 > 3 )
 Reverse (5 > 3 )") 770 771 Supplementary Table 1. The primers used for quantitative RT-PCR. Gene name Forward (5 > 3 ) Reverse (5 > 3 ) Human CXCL1 GCGCCCAAACCGAAGTCATA ATGGGGGATGCAGGATTGAG PF4 CCCCACTGCCCAACTGATAG TTCTTGTACAGCGGGGCTTG
770 771 Supplementary Table 1. The primers used for quantitative RT-PCR. Gene name Forward (5 > 3 ) Reverse (5 > 3 ) Human CXCL1 GCGCCCAAACCGAAGTCATA ATGGGGGATGCAGGATTGAG PF4 CCCCACTGCCCAACTGATAG TTCTTGTACAGCGGGGCTTG
SUPPLEMENTARY INFORMATION. Involvement of IL-21 in the epidermal hyperplasia of psoriasis
 SUPPLEMENTARY INFORMATION Involvement of IL-21 in the epidermal hyperplasia of psoriasis Roberta Caruso 1, Elisabetta Botti 2, Massimiliano Sarra 1, Maria Esposito 2, Carmine Stolfi 1, Laura Diluvio 2,
D CD8 T cell number (x10 6 )
") IFNγ Supplemental Figure 1. CD T cell number (x1 6 ) 18 15 1 9 6 3 CD CD T cells CD6L C CD5 CD T cells CD6L D CD8 T cell number (x1 6 ) 1 8 6 E CD CD8 T cells CD6L F Log(1)CFU/g Feces 1 8 6 p
IFNγ Supplemental Figure 1. CD T cell number (x1 6 ) 18 15 1 9 6 3 CD CD T cells CD6L C CD5 CD T cells CD6L D CD8 T cell number (x1 6 ) 1 8 6 E CD CD8 T cells CD6L F Log(1)CFU/g Feces 1 8 6 p
Pathologic Stage. Lymph node Stage
 ASC ASC a c Patient ID BMI Age Gleason score Non-obese PBMC 1 22.1 81 6 (3+3) PBMC 2 21.9 6 6 (3+3) PBMC 3 22 84 8 (4+4) PBMC 4 24.6 68 7 (3+4) PBMC 24. 6 (3+3) PBMC 6 24.7 73 7 (3+4) PBMC 7 23. 67 7 (3+4)
Supplemental Table 1. Primer sequences for transcript analysis
 Supplemental Table 1. Primer sequences for transcript analysis Primer Sequence (5 3 ) Primer Sequence (5 3 ) Mmp2 Forward CCCGTGTGGCCCTC Mmp15 Forward CGGGGCTGGCT Reverse GCTCTCCCGGTTTC Reverse CCTGGTGTGCCTGCTC
A. Generation and characterization of Ras-expressing autophagycompetent
 Supplemental Material Supplemental Figure Legends Fig. S1 A. Generation and characterization of Ras-expressing autophagycompetent and -deficient cell lines. HA-tagged H-ras V12 was stably expressed in
ILC1 and ILC3 isolation and culture Following cell sorting, we confirmed that the recovered cells belonged to the ILC1, ILC2 and
 Supplementary Methods and isolation and culture Following cell sorting, we confirmed that the recovered cells belonged to the, ILC2 and subsets. For this purpose we performed intracellular flow cytometry
Trim29 gene-targeting strategy. (a) Genotyping of wildtype mice (+/+), Trim29 heterozygous mice (+/ ) and homozygous mice ( / ).
 Genotyping of wildtype mice (+/+), Trim29 heterozygous mice (+/ ) and homozygous mice ( / ).") Supplementary Figure 1 Trim29 gene-targeting strategy. (a) Genotyping of wildtype mice (+/+), Trim29 heterozygous mice (+/ ) and homozygous mice ( / ). (b) Immunoblot analysis of TRIM29 in lung primary
Supplementary Figure 1 Trim29 gene-targeting strategy. (a) Genotyping of wildtype mice (+/+), Trim29 heterozygous mice (+/ ) and homozygous mice ( / ). (b) Immunoblot analysis of TRIM29 in lung primary
10.00 PBS OVA OVA+isotype antibody 8.00 OVA+anti-HMGB1. PBS Methatroline (mg/ml)
") RESEARCH ARTICLE Penh (100% of PBS) 1 PBS 8.00 +anti-hmgb1 6.00 4.00 p=0.054 Cellular & Molecular Immunology advance online publication, PBS 3.12 6.25 Methatroline (mg/ml) Neutrophil isolation and culture
RESEARCH ARTICLE Penh (100% of PBS) 1 PBS 8.00 +anti-hmgb1 6.00 4.00 p=0.054 Cellular & Molecular Immunology advance online publication, PBS 3.12 6.25 Methatroline (mg/ml) Neutrophil isolation and culture
activation with anti-cd3/cd28 beads and 3d following transduction. Supplemental Figure 2 shows
 Supplemental Data Supplemental Figure 1 compares CXCR4 expression in untreated CD8 + T cells, following activation with anti-cd3/cd28 beads and 3d following transduction. Supplemental Figure 2 shows the
Blocking antibodies and peptides. Rat anti-mouse PD-1 (29F.1A12, rat IgG2a, k), PD-
, PD-") Supplementary Methods Blocking antibodies and peptides. Rat anti-mouse PD-1 (29F.1A12, rat IgG2a, k), PD- L1 (10F.9G2, rat IgG2b, k), and PD-L2 (3.2, mouse IgG1) have been described (24). Anti-CTLA-4 (clone
Supplementary Methods Blocking antibodies and peptides. Rat anti-mouse PD-1 (29F.1A12, rat IgG2a, k), PD- L1 (10F.9G2, rat IgG2b, k), and PD-L2 (3.2, mouse IgG1) have been described (24). Anti-CTLA-4 (clone
TGF-β Signaling Regulates Neuronal C1q Expression and Developmental Synaptic Refinement
 Supplementary Information Title: TGF-β Signaling Regulates Neuronal C1q Expression and Developmental Synaptic Refinement Authors: Allison R. Bialas and Beth Stevens Supplemental Figure 1. In vitro characterization
Supplementary Materials for
 www.sciencetranslationalmedicine.org/cgi/content/full/8/352/352ra110/dc1 Supplementary Materials for Spatially selective depletion of tumor-associated regulatory T cells with near-infrared photoimmunotherapy
SUPPLEMENTARY MATERIAL
 SUPPLEMENTARY MATERIAL IL-1 signaling modulates activation of STAT transcription factors to antagonize retinoic acid signaling and control the T H 17 cell it reg cell balance Rajatava Basu 1,5, Sarah K.
Figure S1. Sorting nexin 9 (SNX9) specifically binds psmad3 and not psmad 1/5/8. Lysates from AKR-2B cells untreated (-) or stimulated (+) for 45 min
 specifically binds psmad3 and not psmad 1/5/8. Lysates from AKR-2B cells untreated (-) or stimulated (+) for 45 min") Figure S1. Sorting nexin 9 (SNX9) specifically binds psmad3 and not psmad 1/5/8. Lysates from AKR2B cells untreated () or stimulated () for 45 min with 5 ng/ml TGFβ or 10 ng/ml BMP4 were incubated with
Figure S1. Sorting nexin 9 (SNX9) specifically binds psmad3 and not psmad 1/5/8. Lysates from AKR2B cells untreated () or stimulated () for 45 min with 5 ng/ml TGFβ or 10 ng/ml BMP4 were incubated with
Online Appendix Material and Methods: Pancreatic RNA isolation and quantitative real-time (q)rt-pcr. Mice were fasted overnight and killed 1 hour (h)
rt-pcr. Mice were fasted overnight and killed 1 hour (h)") Online Appendix Material and Methods: Pancreatic RNA isolation and quantitative real-time (q)rt-pcr. Mice were fasted overnight and killed 1 hour (h) after feeding. A small slice (~5-1 mm 3 ) was taken
Online Appendix Material and Methods: Pancreatic RNA isolation and quantitative real-time (q)rt-pcr. Mice were fasted overnight and killed 1 hour (h) after feeding. A small slice (~5-1 mm 3 ) was taken
Supplementary Figure 1. Double-staining immunofluorescence analysis of invasive colon and breast cancers. Specimens from invasive ductal breast
 Supplementary Figure 1. Double-staining immunofluorescence analysis of invasive colon and breast cancers. Specimens from invasive ductal breast carcinoma (a) and colon adenocarcinoma (b) were staining
LPS LPS P6 - + Supplementary Fig. 1.
 P6 LPS - - - + + + - LPS + + - - P6 + Supplementary Fig. 1. Pharmacological inhibition of the JAK/STAT blocks LPS-induced HMGB1 nuclear translocation. RAW 267.4 cells were stimulated with LPS in the absence
Supplementary Data 1. Alanine substitutions and position variants of APNCYGNIPL. Applied in
 Supplementary Data 1. Alanine substitutions and position variants of APNCYGNIPL. Applied in Supplementary Fig. 2 Substitution Sequence Position variant Sequence original APNCYGNIPL original APNCYGNIPL
Supplementary Figure 1. mrna expression of chitinase and chitinase-like protein in splenic immune cells. Each splenic immune cell population was
 Supplementary Figure 1. mrna expression of chitinase and chitinase-like protein in splenic immune cells. Each splenic immune cell population was sorted by FACS. Surface markers for sorting were CD11c +
Expression of acid base transporters in the kidney collecting duct in Slc2a7 -/-
 Supplemental Material Results. Expression of acid base transporters in the kidney collecting duct in Slc2a7 -/- and Slc2a7 -/- mice. The expression of AE1 in the kidney was examined in Slc26a7 KO mice.
SUPPLEMENTARY INFORMATION
 DOI:.38/ncb3399 a b c d FSP DAPI 5mm mm 5mm 5mm e Correspond to melanoma in-situ Figure a DCT FSP- f MITF mm mm MlanaA melanoma in-situ DCT 5mm FSP- mm mm mm mm mm g melanoma in-situ MITF MlanaA mm mm
Supplemental Data. Epithelial-Macrophage Interactions Determine Pulmonary Fibrosis Susceptibility in. Hermansky-Pudlak Syndrome
 Page 1 Supplemental Data Epithelial-Macrophage Interactions Determine Pulmonary Fibrosis Susceptibility in Hermansky-Pudlak Syndrome Lisa R. Young, Peter M. Gulleman, Chelsi W. Short, Harikrishna Tanjore,
Chemical Chaperones Mitigate Experimental Asthma By Attenuating Endoplasmic
 Chemical Chaperones Mitigate Experimental Asthma By Attenuating Endoplasmic Reticulum Stress Lokesh Makhija, BE, Veda Krishnan, MSc, Rakhshinda Rehman, MTech, Samarpana Chakraborty, MSc, Shuvadeep Maity,
Hua Tang, Weiping Cao, Sudhir Pai Kasturi, Rajesh Ravindran, Helder I Nakaya, Kousik
 SUPPLEMENTARY FIGURES 1-19 T H 2 response to cysteine-proteases requires dendritic cell-basophil cooperation via ROS mediated signaling Hua Tang, Weiping Cao, Sudhir Pai Kasturi, Rajesh Ravindran, Helder
Supplementary Table; Supplementary Figures and legends S1-S21; Supplementary Materials and Methods
 Silva et al. PTEN posttranslational inactivation and hyperactivation of the PI3K/Akt pathway sustain primary T cell leukemia viability Supplementary Table; Supplementary Figures and legends S1-S21; Supplementary
Supplementary Figure 1. Tamoxifen does not promote chemotaxis or chemokinesis in the absence of additional stimulation. Transwell chemotaxis assays
 Supplementary Figure 1. Tamoxifen does not promote chemotaxis or chemokinesis in the absence of additional stimulation. Transwell chemotaxis assays revealed that tamoxifen treatment alone did not stimulate
Supplementary Materials for
 www.sciencetranslationalmedicine.org/cgi/content/full/4/117/117ra8/dc1 Supplementary Materials for Notch4 Normalization Reduces Blood Vessel Size in Arteriovenous Malformations Patrick A. Murphy, Tyson
SensoLyte 520 Cathepsin K Assay Kit *Fluorimetric*
 SensoLyte 520 Cathepsin K Assay Kit *Fluorimetric* Catalog # 72171 Kit Size 100 Assays (96-well plate) Optimized Performance: This kit is optimized to detect Cathepsin K activity. Enhanced Value: Ample
PHENOTYPIC DYNAMICS OF MICROGLIAL AND MONOCYTE-DERIVED CELLS IN GLIOBLASTOMA-BEARING MICE.
 SUPPLEMENTARY FIGURES, TABLES AND VIDEOS PHENOTYPIC DYNAMICS OF MICROGLIAL AND MONOCYTE-DERIVED CELLS IN GLIOBLASTOMA-BEARING MICE. Clément Ricard 1,2,3,4, Aurélie Tchoghandjian 2,4, Hervé Luche 5, Pierre
Nature Immunology: doi: /ni Supplementary Figure 1. Production of cytokines and chemokines after vaginal HSV-2 infection.
 Supplementary Figure 1 Production of cytokines and chemokines after vaginal HSV-2 infection. C57BL/6 mice were (a) treated intravaginally with 20 µl of PBS or infected with 6.7x10 4 pfu of HSV-2 in the
DC were seeded into tissue culture dishes in IMDM 2% FCS, and added with PMN. (1:1; PMN: DC) for 16h also in the presence of DNAse (100 U/ml); DC were
 for 16h also in the presence of DNAse (100 U/ml); DC were") Supplementary methods Flow cytometric analysis of DCs. DC were seeded into tissue culture dishes in IMDM 2% FCS, and added with PMN (1:1; PMN: DC) for 16h also in the presence of DNAse (100 U/ml); DC were
Supplementary methods Flow cytometric analysis of DCs. DC were seeded into tissue culture dishes in IMDM 2% FCS, and added with PMN (1:1; PMN: DC) for 16h also in the presence of DNAse (100 U/ml); DC were
Introduction. Acute sodium overload produces renal tubulointerstitial inflammation in normal rats
 Acute sodium overload produces renal tubulointerstitial inflammation in normal rats MI Roson, et al. Kidney International (2006) Introduction Present by Kanya Bunnan and Wiraporn paebua Tubular sodium
Supplemental Figures: Supplemental Figure 1
 Supplemental Figures: Supplemental Figure 1 Suppl. Figure 1. BM-DC infection with H. pylori does not induce cytotoxicity and treatment of BM-DCs with H. pylori sonicate, but not heat-inactivated bacteria,
SUPPLEMENTARY FIGURES
 SUPPLEMENTARY FIGURES 1 2 3 4 SUPPLEMENTARY TABLES Supplementary Table S1. Brain Tumors used in the study Code Tumor Classification Age Gender HuTuP51 Glioblastoma 57 Male HuTuP52 Glioblastoma 53 Male
Supplementary Figure 1. Immune profiles of untreated and PD-1 blockade resistant EGFR and Kras mouse lung tumors (a) Total lung weight of untreated
 Total lung weight of untreated") 1 Supplementary Figure 1. Immune profiles of untreated and PD-1 blockade resistant EGFR and Kras mouse lung tumors (a) Total lung weight of untreated (U) EGFR TL mice (n=7), Kras mice (n=7), PD-1 blockade
1 Supplementary Figure 1. Immune profiles of untreated and PD-1 blockade resistant EGFR and Kras mouse lung tumors (a) Total lung weight of untreated (U) EGFR TL mice (n=7), Kras mice (n=7), PD-1 blockade
Supplementary Material
 Supplementary Material Supplementary Figure 1. NOS2 -/- mice develop an analogous Ghon complex after infection in the ear dermis and show dissemination of Mtb to the lung. (A) WT and NOS2 -/- mice were
Nature Neuroscience: doi: /nn Supplementary Figure 1
 Supplementary Figure 1 Atlas representations of the midcingulate (MCC) region targeted in this study compared against the anterior cingulate (ACC) region commonly reported. Coronal sections are shown on
Supplementary Information
 Supplementary Information Memory-type ST2 + CD + T cells participate in the steroid-resistant pathology of eosinophilic pneumonia Naoko Mato 1, 2, Kiyoshi Hirahara 2, Tomomi Ichikawa 2, Jin Kumagai 2,
Page 39 of 44. 8h LTA & AT h PepG & AT h LTA
 Page 39 of 44 Fig. S1 A: B: C: D: 8h LTA 8h LTA & AT7519 E: F: 8h PepG G: 8h PepG & AT7519 Fig. S1. AT7519 overrides the survival effects of lipoteichoic acid (LTA) and peptidoglycan (PepG). (A) Human
Combined Rho-kinase inhibition and immunogenic cell death triggers and propagates immunity against cancer
 Supplementary Information Combined Rho-kinase inhibition and immunogenic cell death triggers and propagates immunity against cancer Gi-Hoon Nam, Eun-Jung Lee, Yoon Kyoung Kim, Yeonsun Hong, Yoonjeong Choi,
Supplementary Fig. 1: Ex vivo tetramer enrichment with anti-c-myc beads
 Supplementary Fig. 1: Ex vivo tetramer enrichment with anti-c-myc beads Representative example of comparative ex vivo tetramer enrichment performed in three independent experiments with either conventional
Supplementary Figure 1. Using DNA barcode-labeled MHC multimers to generate TCR fingerprints
 Supplementary Figure 1 Using DNA barcode-labeled MHC multimers to generate TCR fingerprints (a) Schematic overview of the workflow behind a TCR fingerprint. Each peptide position of the original peptide
Supporting Information
 Supporting Information Aldridge et al. 10.1073/pnas.0900655106 Fig. S1. Flow diagram of sublethal (a) and lethal (b) influenza virus infections. (a) Infection of lung epithelial cells by influenza virus
Supplementary Figure 1 Protease allergens induce IgE and IgG1 production. (a-c)
") 1 Supplementary Figure 1 Protease allergens induce IgE and IgG1 production. (a-c) Serum IgG1 (a), IgM (b) and IgG2 (c) concentrations in response to papain immediately before primary immunization (day
1 Supplementary Figure 1 Protease allergens induce IgE and IgG1 production. (a-c) Serum IgG1 (a), IgM (b) and IgG2 (c) concentrations in response to papain immediately before primary immunization (day