Acknowledgements. Primary Authors Minnesota Pollution Control Agency David Bael Minnesota Department of Health Jeannette Sample
|
|
|
- Samson Cameron
- 6 years ago
- Views:
Transcription
1
2 Acknowledgements Primary Authors Minnesota Pollution Control Agency David Bael Minnesota Department of Health Jeannette Sample Contributors Minnesota Pollution Control Agency Dorian Kvale Greg Pratt Mary Williams Minnesota Department of Health Jean Johnson Paula Lindgren Naomi Shinoda Acknowledgements We are grateful to the following people who served as technical consultants, reviewers and advisors to the authors as well as technical review by external representatives of other organizations. Minnesota Pollution Control Agency Ned Brooks Mary Dymond Kristie Ellickson MaryJean Fenske Lisa Herschberger Frank Kohlasch Margaret McCourtney Cassie McMahon Kari Palmer Minnesota Department of Health Wendy Brunner Jim Kelly Kathy Norlien Kristin Raab Chuck Stroebel Dan Symonik Linden Weiswerda New York City Department of Health and Mental Hygiene Iyad Kheirbek U.S. Environmental Protection Agency, Region 5 George Bollweg U.S. Environmental Protection Agency, Office of Air Quality Planning and Standards Neal Fann Editing and graphic design Minnesota Pollution Control Agency Risikat Adesaogun Ralph Pribble Minnesota Department of Health Kitty Hurley Sara Maaske Doug Schultz aq1-61 1
3 Table of Contents Executive Summary... 4 What s the issue?... 4 Twin Cities-area annual* health impacts attributable to PM Who is affected?... 5 Twin Cities-area annual* health impacts attributable to ground-level ozone... 5 What are the health benefits of improving air quality?... 5 How do we improve health for people vulnerable to air pollution?... 5 More about the study... 6 Introduction... 7 Background... 8 Air pollution sources... 8 Air pollution and health Methods Change in air quality Health and death data Health effect of pollution estimates Population data Results Metro-wide pollution-attributable health impacts Geographic analysis of Twin Cities metro-area pollution-attributable health impacts Fine particles (PM 2.5) Ozone Air pollution exposure among population subgroups Demographic analysis of Twin Cities metro-area pollution-attributable health impacts Age Poverty and Race Limitations Air quality data Health and death data Health effect of pollution estimates Population data Conclusion
4 Appendix A Health impact estimation Fine particle studies Ozone studies Appendix B Updated air pollution-attributable death results using 2012 data Bibliography
5 Executive Summary It s only fair that all Minnesotans live in conditions that support a healthy and fulfilling life. One important part of this is living in an environment with clean air. The goal of this report by the Minnesota Pollution Control Agency (MPCA) and Minnesota Department of Health (MDH) is to inform decisions on how to improve health for all residents of the state of Minnesota by reducing air pollution that contributes to the development of various diseases. What s the issue? Breathing polluted air can cause a variety of health problems. While air quality in Minnesota currently meets federal standards, even low and moderate levels of air pollution can contribute to serious illnesses and early death. This report estimates that in 2008 in the Twin Cities: About 6 to13 percent of all residents who died, and about 2 to 5 percent of all residents who visited the hospital or emergency room for heart and lung problems, did so partly because of fine particles in the air or ground-level ozone. This roughly translates to about 2,000 deaths, 400 hospitalizations, and 600 emergency room visits. Twin Cities-area annual* health impacts attributable to PM2.5 (adapted from Table 4) Health Effect Age Group Number ** Percent of Total Events Attributable rate per 100,000 people All-cause deaths 25 and older 2,152 (1,108 3,123) 12.6% (6.5% %) ( ) Asthma hospitalizations Under (0 86) 2.1% (0% %) 2.3 (0 11.5) Asthma and COPD hospitalizations 18 to (16 77) 2.3% (0.8% - 3.8%) 2.4 ( ) All respiratory hospitalizations 65 and older 166 (96 235) 2.1% (1.2% - 3.0%) 53.0 ( ) Asthma emergency department visits All ages 402 ( ) 2.9% (0.8% - 4.9%) 13.6 ( ) Cardiovascular hospitalizations 65 and older 91 (35 146) 0.7% (0.3% - 1.1%) 28.9 ( ) * 2008 annual average PM2.5 levels minus natural background levels **95% confidence intervals. These reflect the range within which one can be 95% confident that the true value lies. 4
6 Who is affected? Everyone can be affected by breathing polluted air, but the sick, the elderly, and children with uncontrolled asthma are affected more than others. There is little difference in average air pollution levels between ZIP codes in the Twin Cities; however ZIP codes with larger populations of people of color and American Indians and residents living in poverty are more vulnerable to air pollution. Because these populations already have higher rates of heart and lung conditions, they experience more hospitalizations, asthma emergency department visits, and death related to air pollution. The impacts of air pollution fall disproportionately on the elderly (65 and older), who have higher rates of heart and lung conditions, and children under 18, who have higher rates of asthma. The elderly experience much higher rates of hospitalization for heart and lung problems and death due to air pollution. Children experience much higher rates of emergency department visits for asthma due to air pollution than adults. Twin Cities-area annual* health impacts attributable to ground-level ozone (adapted from Table 5) Health Effect Age Group Number ** Percent of Total Events Attributable rate per 100,000 people Cardiopulmonary deaths All Ages 23 (9 38) 1.1% (0.4% - 1.8%) 0.8 ( ) Asthma hospitalizations All Ages 47 (29 64) 4.9% (3.0% - 6.7%) 1.6 ( ) Asthma emergency department visits All ages 185 (0 402) 3.2% (0% - 7.0%) 6.3 (0 13.7) * 2008 May-September annual average ozone levels minus natural background levels. **95% confidence intervals. These reflect the range within which one can be 95% confident that the true value lies. What are the health benefits of improving air quality? Improving air quality can provide significant public health benefits. If we reduce fine particles and ground-level ozone by 10 percent from 2008 levels, we can prevent hundreds of deaths, hospitalizations, and emergency department visits due to heart and lung conditions every year that are attributed to these pollutants. Everyone can help reduce air pollution by paying more attention to its causes and reducing our individual contributions. Actions such as driving less, walking and biking more, and minimizing recreational fires help reduce air pollution in Minnesota communities. How do we improve health for people vulnerable to air pollution? Addressing the high underlying rates of heart and lung disease, particularly among people of color and American Indians and those in poverty, can reduce the impact of air pollution on health. If we can better prevent chronic obstructive pulmonary disease (COPD) and heart disease, and help children control their asthma, we can help these groups avoid hospitalizations, emergency department visits, and live longer, healthier lives. 5
7 More about the study This report is the result of work done jointly by the Minnesota Pollution Control Agency and Minnesota Department of Health as part of the Urban Air Quality and Respiratory Health Initiative. When the project was started, 2008 was the most current year of air quality data available for every ZIP code in the Twin Cities metro area. Therefore, 2008 is the baseline for tracking future progress in reducing air pollution and its impacts. Because the report provides a general population-level snapshot of the impacts of air pollution for the Twin Cities area in 2008, it does not address individual exposure and health impacts related to higher or lower exposures within ZIP codes or changes that occur in air pollution over time. To estimate health impacts related to air pollution, the agencies used mathematical modeling software that estimates what portion of disease is due to pollution. The software was developed by the United States Environmental Protection Agency and is used for estimating the health impacts and economic value of changes in air quality. It uses published estimates of the relationship between air pollution and health from peer-reviewed scientific studies. The estimates used in this report carry many uncertainties and should not be taken as exact measures of impacts. However, they are useful for demonstrating the general size and scope of the problem and confirm that air pollution poses a serious health threat. 6

8 Introduction Minnesota state legislators and urban communities have expressed concern over the role air quality plays in respiratory health in the Twin Cities region. Breathing polluted air can cause a variety of illnesses and even death (US Environmental Protection Agency, 2012). Although Minnesota and the U.S. have made great strides in reducing air pollution, health experts are finding adverse health impacts at everlower pollutant levels. While air quality in Minnesota meets health-based federal standards, differences exist in environmental exposures and health outcomes. Compared to rural areas of the state, levels of fine particles and other pollutants are elevated in the Twin Cities metro area and other Minnesota cities. Baseline rates of asthma emergency department visits and hospitalizations are also greater in the Twin Cities metro area compared to the rest of the state. To address concerns about air pollution and health effects, the Minnesota Pollution Control Agency and Minnesota Department of Health created the Urban Air Quality and Respiratory Health Initiative. The goals of the initiative include using data to inform communities about air quality issues in the Twin Cities urban area, promoting coordination between state government agencies, and demonstrating the use of a Health Impact Assessment (HIA) as a tool to inform public health decisions. The initiative will work to understand health and environmental disparities that affect Minnesotans. The Minnesota Pollution Control Agency (MPCA) and Minnesota Department of Health (MDH) are collaborating on this initiative. As one part of the Urban Air Quality and Respiratory Health Initiative, this report assesses ZIP code-level data from MPCA and MDH on air quality and health outcomes in the Twin Cities seven-county metro area (Anoka, Carver, Dakota, Hennepin, Ramsey, Scott, and Washington Counties; Figure 1). Figure 1: Map of Minnesota with the Twin Cities seven-county metro area 7
9 This report provides estimates of the toll of fine particle pollution (also known as particulate matter less than 2.5 micrometers in diameter, or PM 2.5) and ground-level ozone in terms of the health outcomes of asthma emergency department visits and hospitalizations, other respiratory and cardiovascular disease hospitalizations, and death. Fine particles and ozone were included because they are common air pollutants and well-known causes of adverse health events (EPA, Integrated Science Assessment for Particulate Matter [Final Report], 2009) (EPA, Integrated Science Assessment for Ozone and Related Photochemical Oxidants, 2013). In addition, data on their concentration levels and health effects are available at the ZIP code level in the Twin Cities metro area. The specific health outcomes were chosen because they are associated with fine particles and ozone exposure and data on these outcomes are available at the ZIP code level. At the time the project started, 2008 was the most current year of air quality data available for every ZIP code in the Twin Cities metro area. From 2008 to 2014, direct monitoring data from Twin Cities metro-area air monitors has shown that annual average PM 2.5 improved by about 10 percent while seasonal average ozone concentrations remained relatively unchanged over this period. This report also estimates the number of select health events that could be prevented by reaching air quality improvement goals recommended by Clean Air Minnesota. This consortium of leaders from Minnesota s business, government, and nonprofit sectors has recommended air quality improvements of about 10 percent from 2008 levels in order to meet expected changes to federal air quality standards and to reduce risks to human health from air pollution (Environmental Initiative, 2013). This report also identifies populations more impacted by the health effects of air pollution. Air quality in Minnesota has improved in the past several years, and our residents have likely experienced some of the health benefits from cleaner air. As more recent air quality and health data become available, the MPCA and MDH can use the methods presented in this report to track the public health benefits of reductions in air pollution using 2008 as a baseline. The goal of this report is to inform local communities, the Minnesota Legislature, MPCA, and MDH of air quality issues related to public health in the Twin Cities metro area. Information provided in this report can be used to guide decisions on reducing air pollution for all residents of the Twin Cities metro area and the state of Minnesota. Background Air pollution sources Fine particles (PM 2.5) are a complex mixture of extremely small solid and liquid particles suspended in air. These particles can be made up of a number of components including acids, organic chemicals, metals, and soil or dust. Fine particles can be emitted directly into the environment when coal, gasoline, diesel, wood and other fuels are burned, or indirectly when they are created in the air by chemical reactions among other pollutants (Figure 2). Gasoline and diesel combustion in cars, trucks, buses, tractor trailers and construction equipment, known as mobile sources, contribute up to half of all PM 2.5 concentrations in highly populated urban areas. Much of the remaining fine particles in urban air form from ammonium sulfate and ammonium nitrate, compounds created when sulfur dioxide (SO 2) and nitrogen oxides (NO X) react with ammonia in the atmosphere. Coal burning, primarily at power plants, is the major source of SO 2. Facilities burning coal, natural gas and other fuels as well as mobile sources are the major sources of NO X. Fertilizers and livestock are important sources of ammonia. Changes in weather can transport PM 2.5 thousands of miles from where it was formed. Local sources of fine particles account for most of the differences in PM 2.5 concentrations within the metro area. 8

10 Figure 2: Sources of fine particle pollution Ozone is a colorless gas composed of three atoms of oxygen. In the upper atmosphere it helps protect the earth from the sun s ultraviolet radiation, but at ground level it can be a harmful pollutant, also known as smog. Ground-level ozone is not emitted directly, but is created in the air through a reaction of NOX and volatile organic compounds (VOCs) mixing in the presence of sunlight (Figure 3). VOCs come from cars, factories and many other sources. NOX is a group of highly reactive gases emitted to the air mostly from burning fuel. Levels of ozone are dependent on the amount and ratios of VOCs and NOX in the air as well as weather conditions including sunlight, temperature, and wind speed and direction. Ozone concentrations typically peak in the afternoon and are highest in the summer, when daylight hours are long and temperatures are high. In Minnesota, ozone concentrations are highest from May through September. High ozone concentrations are found in suburban and rural locations downwind from city centers rather than the city itself because of ozone scavenging. In urban areas with an abundance of NOx from vehicle emissions, the NOX reacts quickly with, and removes, ozone. The NOX that does not scavenge ozone will drift downwind, combine with VOCs, and react in the sunlight to produce ground-level ozone in the downwind location. Ozone can also be transported long distances by wind. As a result, the highest ozone concentrations in the Twin Cities metro are outside the urban core areas of Minneapolis and St. Paul. 9

11 Figure 3: Sources of ground-level ozone Air pollution and health Air pollution is associated with a variety of harmful respiratory and cardiovascular effects. Illnesses caused or worsened by air pollution can also be caused by other risk factors. As a result, most health events triggered by air pollution cannot be identified directly as having air pollution causes. Research has shown that increases in the risks of certain health impacts are related to higher air pollutant concentrations, and these increased risks can be quantified. This relationship between an air pollutant concentration and the risk of a health impact is called a concentration-response function (referred to in this report as an effect estimate ). High levels of fine particles and ground-level ozone are the two primary causes of poor air quality in much of the US, including Minnesota; these pollutants are also of concern because of their likely health impacts (EPA, Integrated Science Assessment for Particulate Matter [Final Report], 2009) (EPA, Integrated Science Assessment for Ozone and Related Photochemical Oxidants, 2013). Due to their small size, fine particles can be inhaled deep into the lungs and some of the smallest particles can reach the bloodstream. The particles can accumulate in the respiratory system and cause serious health effects. Short-term exposure (hours, days) can result in asthma attacks, heart attacks, and death. Long-term exposure (months, years) can result in heart and lung diseases, cancers, and death. The elderly and people with heart or lung diseases are more susceptible than others to the effects of PM 2.5. Children are also vulnerable to PM 2.5 exposure because their lungs are still developing and they spend more time outdoors compared to adults. (EPA, Integrated Science Assessment for Particulate Matter [Final Report], 2009) 10
12 Ground-level ozone is a lung irritant. Ozone affects the lungs by causing inflammation of the airways and by reducing lung function so that breathing becomes difficult. Breathing ozone can trigger a variety of health problems including chest pain, coughing, throat irritation, and congestion. It can worsen bronchitis, emphysema and asthma, and may play a role in the development of asthma (US Environmental Protection Agency, Integrated Science Assessment for Ozone and Related Photochemical Oxidants, 2013). Exposure to ozone is also linked to death from respiratory and cardiovascular causes (US Environmental Protection Agency, 2014a). People with lung disease, children, older adults, and people who are active outdoors may be particularly sensitive to the effects of ozone. (EPA, Integrated Science Assessment for Ozone and Related Photochemical Oxidants, 2013). 11
13 Methods The methods used in this report are modeled on methods used in a report examining the relationship between urban air quality and population health by the New York City Department of Health and Mental Hygiene (New York City Department of Health and Mental Hygiene, 2011). Fine particle- and ozonerelated health impacts were estimated for each of the 165 ZIP codes that lie entirely or partly within the seven-county Twin Cities metro area. The seven-county Twin Cities metro area includes Anoka, Carver, Dakota, Hennepin, Ramsey, Scott, and Washington counties (Figure 1). ZIP code-level impacts were summed to provide metro-area estimates. The analyses in this report are conducted using EPA s Environmental Benefits Mapping and Analysis Program (BenMAP), a tool for estimating the health impacts associated with changes in ambient air pollution over a given geographic area (US Environmental Protection Agency, 2014b). Inputs into the BenMAP tool typically include a real or potential change in the amount of air pollution, an effect estimate for the health endpoint (from a published scientific study), the baseline rate of the health endpoint, and the number of people exposed to air pollution and at risk for the health endpoint (Figure 4). Figure 4: Flow chart illustrating the air pollution health impact analysis approach Air Quality Monitors Air Quality Models Baseline Air Quality Comparison Air Quality Change in Air Quality Health Effect of Air Quality Concentrations Air Quality- Related Health Impacts Health Incidence and Mortality Data Population Data The BenMAP tool was used to estimate the health impacts of air pollution with 95 percent confidence intervals for each of the 165 ZIP codes in the Twin Cities metro area using ZIP-code level air and health data and the corresponding health effect estimate. Health impact estimates and 95 percent confidence levels for each ZIP code were summed together to estimate the health impacts of air pollution for the entire metro area. The health impact equation is presented and explained in Appendix A of this report. Change in air quality Baseline air quality data are 2008 annual average concentrations for daily PM 2.5 and ozone data provided by the EPA using a downscaler model (see below). The year 2008 is a fairly representative year for Twin Cities metro-area air quality, but, as noted earlier, air quality in the Twin Cities has improved (particularly PM 2.5 concentrations) since 2008 and was improving before then. Both PM 2.5 and ozone 12
14 concentrations were slightly lower in 2008 compared to the previous few years. The downscaler model combines air quality data from air monitors (daily fine particle [24-hour average] and ozone [8-hour maximum] concentrations) with modeled air quality data (US Environmental Protection Agency, 2014c). Monitored and modeled data were used because these can provide air quality estimates for the entire seven-county Twin Cities metro area, including areas that do not have monitoring stations nearby. Although more recent monitoring data are available, modeling relies on emission estimates for which 2008 data are the most recent available. Using geographic information system techniques, census tract-level data provided by EPA were aggregated to the 165 Twin Cities ZIP codes. Aggregating air quality results to ZIP codes smooths out more localized variation (for example, higher pollutant concentrations along major roadways). ZIP codes were chosen as the geographical units of analysis because the health data were only available by ZIP code. Figure 5 shows 2008 baseline levels of fine particles (PM 2.5) by ZIP code, calculated by taking the average of the 365 daily values for each ZIP code, and mapped using natural breaks. Although averaging smooths out daily and seasonal changes in air quality, it was necessary in order to match with health data (which due to small counts can only be shown as an annual average). The highest concentrations of PM 2.5 are found in the urban core of the Minneapolis/St. Paul area. This is due in large part to the urban core s greater traffic density. PM 2.5 concentrations are generally lower further outward from the core cities. Also, due to wind patterns, PM 2.5 concentrations tend to be slightly higher to the south and east of the core cities than they are in the north and west. PM 2.5 concentrations are relatively uniform throughout the metro area, with a range of 9.7 to 11.6 micrograms per cubic meter. These levels are below most similarly sized cities in the US. 13

15 Figure 5: Baseline levels of PM 2.5 in the Twin Cities metro area by ZIP code, 2008 annual average Based on ZIP code-level downscaler model data, 2008 PM 2.5 concentrations were higher in the central cities of Minneapolis and St. Paul than in the outer fringes of the Twin Cities metro area, but variations across the entire metro area were relatively small. 14
 for each ZIP code, and mapped using natural breaks.")
16 Figure 6 shows 2008 baseline levels of ozone by ZIP code, calculated by taking the average of the daily values from May 1 to September 30 (warm season, when ozone pollution and its health impacts are higher) for each ZIP code, and mapped using natural breaks. Although averaging smooths out daily changes in air quality, it was necessary in order to match with health data (which due to small counts can only be shown as an annual average). In contrast with PM 2.5, the highest ozone concentrations are not in the urban core, but occur in the outlying suburban parts of the metro area. This is due to how ozone forms and travels. Ozone concentrations are relatively uniform throughout the metro area, with a range of 40.3 to 43.9 parts per billion. These levels are below most similarly sized cities in the US. Figure 6: Baseline levels of ozone (average daily 8-hour maximums) for the Twin Cities metro area by ZIP code, 2008 warm season average (May September) Based on ZIP code-level downscaler model data, 2008 ozone concentrations were higher in the outer fringes of the Twin Cities metro area (particularly in the southeast portion of the region) compared to the central cities of Minneapolis and St. Paul, but, as with PM 2.5, variations across the entire metro area were relatively small. Health impact analyses in this report were calculated by comparing baseline air quality data to two comparison air quality scenarios: 1) Baseline, excluding natural background levels. Natural background levels are estimates, based on air pollution models, of the PM 2.5 and ozone concentrations that would exist without sources of air pollution from human activity. These levels cannot be affected by emission-control efforts. This scenario is used to estimate the overall health burden from exposure to human-generated fine particles. o The natural PM 2.5 background level for the Twin Cities metro area is 0.84 micrograms per cubic meter (US Environmental Protection Agency, 2012), which is on average 7.7 percent of the 2008 baseline average PM 2.5 concentrations in the metro area. 15
17 o The natural ozone background level for the Twin Cities metro area is 27.7 parts per billion (Fann, Lamson, Anenberg, Wesson, Risley, & Hubbell, 2012), which is on average 66 percent of the 2008 baseline average ozone concentrations in the metro area, and a smaller proportion of the concentration on days with poor air quality. 2) 10 percent reduction from baseline. A 10 percent reduction in air pollution, relative to 2008 levels, corresponds to air quality improvement targets recommended by Clean Air Minnesota (Environmental Initiative, 2013). This scenario is used to estimate the health benefits that would result if PM 2.5 and ozone concentrations were 10 percent lower throughout the Twin Cities metro area, relative to 2008 baseline concentrations. Health and death data Baseline health and death data are annual average counts of each outcome for each of the 165 ZIP codes included in this study. The period was selected so that air quality data from 2008 would lie at the midpoint of the period. Health and death data were averaged over a five-year time period due to small counts that can occur at small geographic levels. Annual average health and death counts were summarized by full year (for PM 2.5 impacts) or by warm season May-September (for ozone impacts). Outcomes included are asthma emergency department visits and hospitalizations, other respiratory and cardiovascular disease hospitalizations, and deaths. Hospitalization and emergency department visit data are from hospital discharge data that MDH obtains from the Minnesota Hospital Association. Hospital discharge data includes billing information from all Minnesota hospitals reporting hospital discharge data to the Minnesota Hospital Association. It does not include data from federal and sovereign hospitals, such as Veterans Administration and Indian Health Service facilities. MDH receives hospital discharge data that are de-identified and only contain billing ZIP code, date of birth, and gender. Death data are from death certificates from the Minnesota Department of Health s Center for Health Statistics. Billing ZIP code (health outcomes) or residential ZIP code (death data) were used to select cases from any of the 165 ZIP codes that lie entirely or partly within the seven-county Twin Cities Metro Area. Hospitalization and emergency department records were selected based on primary diagnosis as follows: total respiratory hospitalizations (International Classification of Diseases, Ninth Revision, Clinical Modification [ICD-9-CM] codes ; only cases admitted to the hospital from the emergency department), chronic obstructive pulmonary disease (COPD) hospitalizations (ICD-9-CM codes ), asthma hospitalizations (children: ICD-9-CM code 493, all ages: ICD-9-CM codes 493, ; only cases admitted to the hospital from the emergency department), asthma or wheeze ED visits (ICD-9-CM codes 493, ; cases treated and released from ED plus cases seen in ED and admitted to the hospital), and total cardiovascular hospitalizations (ICD-9-CM codes , 428, , , 429, ; cases admitted to the hospital from the emergency department plus cases transferred from an emergency department to another hospital). Death certificates were selected based on all-cause death (International Classification of Diseases, Tenth Revision [ICD-10] all codes) and cardiopulmonary death (ICD-10 codes I00-I79, J10-J18, J40-J47, J69). Table 1 defines all health effects that were evaluated. For each health effect, age and either diagnostic codes or underlying cause of death codes were matched to case definitions from the epidemiology studies used as the source of the effect estimates. To protect patient privacy, hospitals and emergency departments which reported under 6 visits over the 5-year period were not included in the analysis. For outcomes where a sizable number of ZIP codes could not be reported due to small numbers, the Geographic Aggregation Tool (New York State Department of Health, 2009) was used to join neighboring geographic areas together until counts of 6 or more over the 5-year period were reached to avoid health data suppression. 16
18 Unlike air pollution levels, the range in the underlying rates of disease varied widely by ZIP code across the Twin Cities metro area. For example, in 2008 ZIP codes with the highest rates of annual average asthma emergency department visits among all ages were 33 times higher than the ZIP codes with the lowest rates. Because the other inputs to the BenMAP model are constant or have little variation, differences in the underlying rates of death and health outcomes drive most of the differences in air pollution-attributable rates. Table 1: Health effect and outcome definitions Health Effect Outcome Definition Age Group All-cause Death All causes 25 and above Heart attack, ischemic heart diseases, hypertensive Cardiopulmonary diseases, heart failure, stroke, atherosclerosis, Death pneumonia and influenza, chronic obstructive All ages pulmonary disease (COPD), asthma and pneumonitis Hospital admissions for respiratory conditions Hospital admissions for cardiovascular conditions Hospitalizations of children for asthma Hospitalizations for asthma Emergency department visits for asthma Asthma, COPD 18 to 64 Respiratory infections, pneumonia and influenza, asthma, COPD, and pneumonitis Heart attack, ischemic heart disease, heart failure, stroke and atherosclerosis 65 and above 65 and above Asthma 0 to 17 Asthma or wheeze Asthma or wheeze All ages All ages Health effect of pollution estimates Recent epidemiological studies of the relationship of fine particles and ground-level ozone to death, hospital admissions, and emergency department visits were reviewed. There were many published studies for each health impact of fine particles and ground-level ozone considered in this report, each with a different effect estimate (also known as concentration-response function). Effect estimates from large multi-city studies were chosen as well as studies deemed most applicable to the pollution and demographic characteristics of the Upper Midwest. The studies chosen, and the corresponding effect estimates used for this report, are summarized in Tables 2 and 3. Descriptions of the studies chosen can be found in Appendix A. Alternative effect estimates are considered in a sensitivity analysis in the Limitations section in this report. 17
19 Table 2: Effect estimates used for fine particles Health Effect Death Hospital admissions for respiratory conditions Age Group 25 and above 18 to and above Acute or Chronic Exposure/Metric Average Chronic/Annual average Acute/Daily 24- hour mean Acute/Daily 24- hour mean Effect Estimate 14% increase in allcause death associated with 10 µg/m 3 increase in PM % increase in daily chronic respiratory disease hospitalizations per 10 µg/m 3 increase in PM %-4.3% increase in daily chronic respiratory disease hospitalizations per 10 µg/m 3 increase Study Location Six Eastern and Midwestern U.S. cities Los Angeles, CA 26 U.S. communities Source of Effect Estimate Lepeule et al., 2012 Moolgavkar, 2000 Zanobetti et al., 2009 Hospital admissions for cardiovascular conditions 65 and above Acute/Daily 24- hour mean in PM % increase in daily cardiovascular disease hospitalizations per 10 µg/m 3 increase 119 U.S. communities Peng et al., 2009 Hospitalizations of children for asthma 0 to 17 Acute/Daily 24- hour mean in PM % increase in daily pediatric asthma-related hospitalizations per 10 µg/m 3 increase Washington, DC Babin et al., 2007 Emergency department (ED) visits for asthma All ages Acute/Daily 24- hour mean in PM % increase in asthma ED visits per 10 µg/m 3 increase in PM 2.5 St. Louis, MO Winquist et al.,
20 Table 3: Effect estimates used for ozone Health Effect Death Hospital admissions for asthma Emergency department visits for asthma Age Group All ages All ages All ages Acute Exposure/Metric Average Acute, 24-hour daily mean Acute, daily 8- hour maximum Acute, daily 8- hour maximum Effect Estimate 1.3% increase in cardiovascular and respiratory death per 10 ppb increase in ozone over the previous week 3.7% increase in asthma hospitalizations per 10 ppb increase in ozone 2.4% increase in asthma ED visits per 10 ppb increase in ozone Study Location 19 U.S. cities St. Louis, MO St. Louis, MO Source of Effect Estimate Huang et al., 2005 Winquist et al., 2012 Winquist et al., 2012 Population data Baseline health and death rates by geography and age group were calculated using five-year population estimates by ZIP Code Tabulation Area from the American Community Survey (ACS). Population estimates were from , the first time period ACS began providing data by ZIP code. Population estimates are period estimates and are interpreted as the average values over the five-year period. ACS data were used to assign percent of population in poverty and percent residents of color for each Twin Cities metro area ZIP code. Poverty percentages assigned to ZIP codes were 0-19 percent, percent, and 40 percent or more residents in a ZIP code with incomes less than or equal to 185 percent of the federal poverty line 1. Percentages of residents of color assigned to ZIP codes were 0-24 percent, percent, and 50 percent or more residents in a ZIP code that do not identify as White non- Hispanic. Poverty and populations of color definitions were based on those used by the Metropolitan Council s Choice, Place and Opportunity: An Equity Assessment of the Twin Cities to create Racially Concentrated Areas of Poverty, defined as areas where more than 50 percent of the residents are people of color and more than 40 percent of the residents have incomes less than or equal to 185 percent of the federal poverty line (Metropolitan Council, 2014). Population-weighted average exposure levels were calculated for ZIP code-level populations of poverty and populations of color. The methodology used for this analysis can be found in a recent study on national patterns of exposure to air pollution for different racial groups (Clark, Millet, & Marshall, 2014). 1 The federal poverty threshold varies by family size. In 2015 the federal poverty guideline for a family of four is a household income of $24,250; 185 percent of poverty was about $44,863. ( Many federal assistance programs, such as the Free and Reduced Price Lunch program and the Women, Infants and Children program, consider residents with family incomes less than 185 percent of the federal poverty threshold eligible for financial assistance. 19

21 Figure 7 shows the poverty classifications of all 165 ZIP codes in the Twin Cities metro area in Each ZIP code was categorized based on the percentage of its residents in poverty: less than 20% in poverty, 20% to 39% in poverty, and 40% or more in poverty. Figure 7: Percent of residents in poverty by ZIP code 20

22 Figure 8 shows the percent of residents of color for all 165 ZIP codes in the Twin Cities metro area in Each ZIP code was categorized based on the percentage of residents of color: less than 25% residents of color, 25% to 49% residents of color, and 50% or more residents of color. Figure 8: Percent of residents of color by ZIP code The following analyses were conducted to estimate the annual health impacts of each pollutant-health endpoint combination in the Twin Cities metro area: 1. Metro-wide analysis: The total Twin Cities metro-area health impact from baseline pollution levels (2008 levels minus the natural background levels) and the total Twin Cities metro-area benefit of a 10 percent reduction from baseline levels of pollution. All maps were classified using four natural breaks. 2. Geographic analysis: Mapped rates (natural break classification) of baseline air pollutionattributable health events for all 165 Twin Cities metro-area ZIP codes. 3. Demographic exposure levels: Population-weighted average exposure levels for ZIP code-level populations of poverty and populations of color. 4. Demographic analysis: Rates of baseline air pollution-attributable health events for different age groups, and ZIP code-level populations of poverty and populations of color and American Indians. 21
23 Results 1. Metro-wide pollution-attributable health impacts Each year in the Twin Cities, fine particle pollution (2008 baseline minus natural background) is estimated to cause more than 2,100 deaths, more than 200 respiratory hospitalizations, 91 cardiovascular hospitalizations, and about 400 emergency department (ED) visits for asthma (Table 4). The biggest estimated impact from PM 2.5 pollution is death, of which over 12 percent is attributable to PM 2.5 pollution. About 2-3 percent of all respiratory hospitalizations and emergency visits are due to PM 2.5 pollution, while less than one percent of cardiovascular hospitalizations are due to PM 2.5 pollution. A 10 percent reduction in PM 2.5 concentrations from 2008 baseline levels could prevent more than 200 deaths, more than 30 hospital admissions, and more than 40 ED visits every year. Table 4. Twin Cities metro-area annual health impacts attributable to PM 2.5 air pollution in 2008 and estimated avoided health impacts from air quality improvements Health Effect Mortality Age Group Annual estimated Health Impacts Attributable to PM 2.5* Number (95% confidence interval***) Percent of Total Events Attributable rate per 100,000 people Annual estimated Health Impacts Avoided from 10% Reduction in PM 2.5** Number All-cause 25 and older 2,152 (1,108 3,123) 12.6% (6.5% %) ( ) 247 ( ) Respiratory Effects Asthma hospitalizations Under (0 86) 2.1% (0% %) 2.3 (0 11.5) 2 (0-10) Asthma and COPD hospitalizations 18 to (16 77) 2.3% (0.8% - 3.8%) 2.4 ( ) 5 (2 8) All respiratory hospitalizations 65 and older 166 (96 235) 2.1% (1.2% - 3.0%) 53.0 ( ) 18 (10 26) Asthma emergency department visits Cardiovascular Effects Cardiovascular hospitalizations All ages 65 and older 402 ( ) 91 (35 146) 2.9% (0.8% - 4.9%) 0.7% (0.3% - 1.1%) 13.6 ( ) 28.9 ( ) 44 (12 76) 10 (4 16) * 2008 annual average PM2.5 levels minus natural background levels **From 2008 annual average PM2.5 levels ***95% confidence intervals reflect the range within which one can be 95% confident that the true value lies 22
24 Each year in the Twin Cities, baseline ground-level ozone pollution (2008 May-September levels minus natural background) is estimated to cause about 20 deaths, 47 hospitalizations for asthma, and 185 ED visits for asthma (Table 5). Ozone pollution has a large impact on asthma, causing an estimated five percent of all asthma hospitalizations and three percent of all asthma ED visits. Ozone pollution causes about one percent of all deaths due to cardiopulmonary causes. A 10 percent reduction in ozone concentrations could prevent an estimated seven deaths, 14 hospital admissions, and 57 ED visits. Table 5. Twin Cities metro-area annual health impacts attributable to ozone air pollution in 2008 and estimated avoided health impacts from air quality improvements Health Effect Death Age Group Annual Health Impacts Attributable to Ozone* Number (95% confidence interval***) Percent of Total Events Attributable rate per 100,000 people Annual Health Impacts Avoided from 10% Reduction in Ozone** Number Cardiopulmonary causes All Ages 23 (9 38) 1.1% (0.4% - 1.8%) 0.8 ( ) 7 (3 12) Respiratory Effects Asthma hospitalizations All Ages 47 (29 64) 4.9% (3.0% - 6.7%) 1.6 ( ) 14 (9 20) Asthma emergency department visits All ages 185 (0 402) 3.2% (0% - 7.0%) 6.3 (0 13.7) 57 (0 126) * 2008 May-September annual average ozone levels minus natural background levels **From 2008 May-September annual average ozone levels ***95% confidence intervals reflect the range within which one can be 95% confident that the true value lies 23
 All-cause death An estimated 110 deaths from all causes per 100,000 people ages 25 years of age and older are attributable to PM 2.")
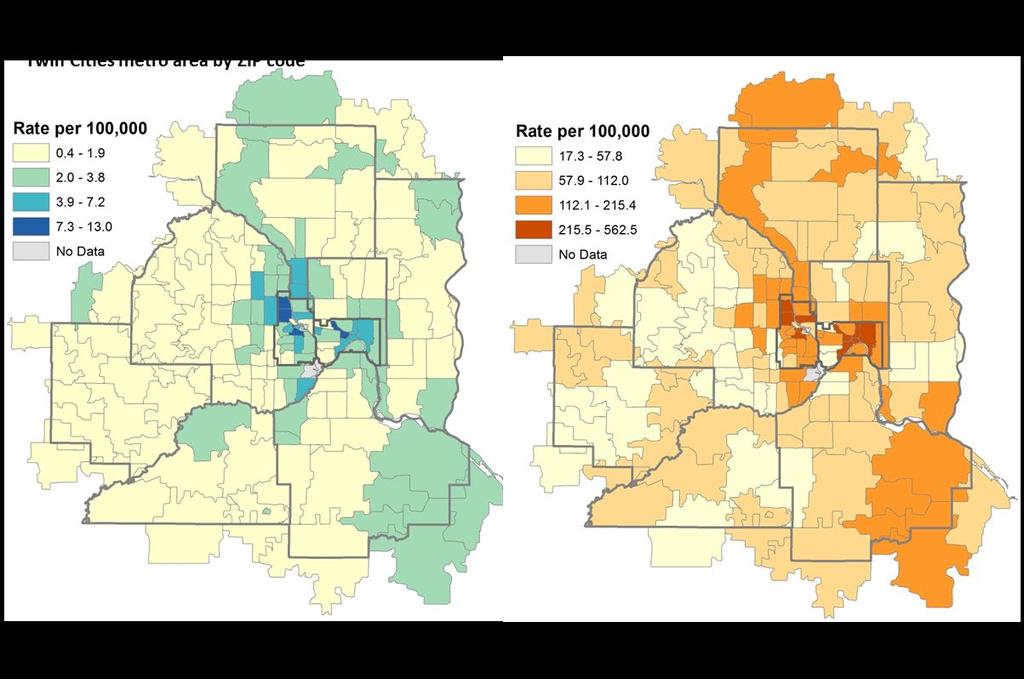
25 2. Geographic analysis of Twin Cities metro-area pollution-attributable health impacts Fine particles (PM 2.5) All-cause death An estimated 110 deaths from all causes per 100,000 people ages 25 years of age and older are attributable to PM 2.5 (2008 baseline minus natural background levels) in the Twin Cities metro area every year (Table 4). The PM 2.5-attributable death rate varies considerably across ZIP codes, with a range of 26 to over 630 per 100,000 people (Figure 9, left), with higher rates in and around Minneapolis and St. Paul. PM 2.5-attributable death rates follow the same geographic pattern as the underlying death rate (Figure 9, right). 24
 in the Twin Cities metro area every year (Table 4). Rates of PM 2.5-attributable asthma hospitalizations for children range across ZIP codes from 0.")
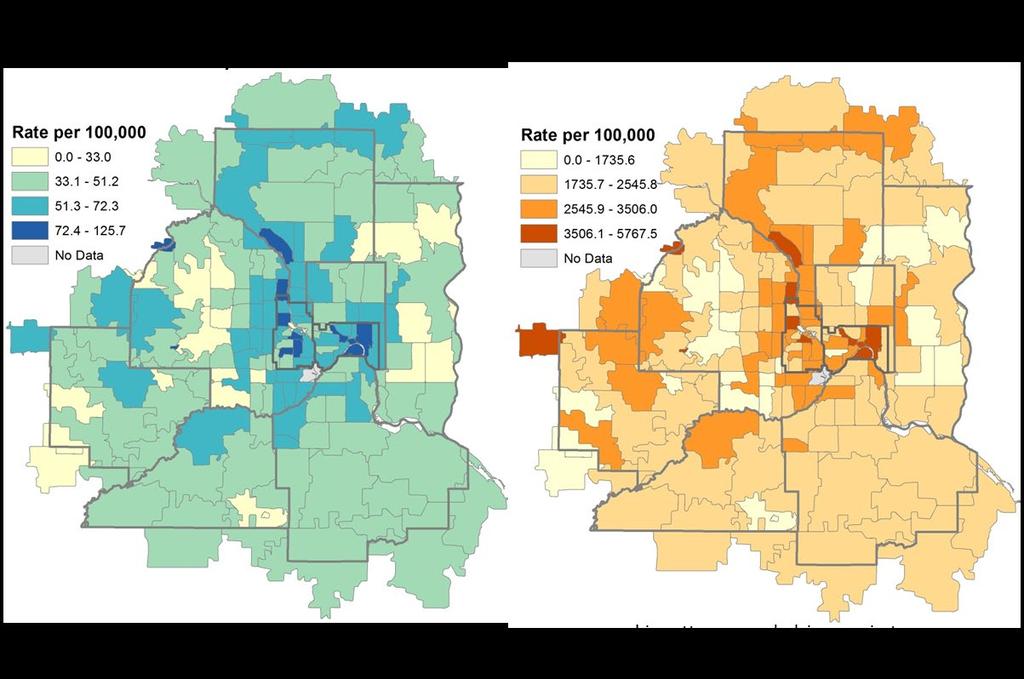
26 Asthma hospitalizations for children An estimated 2.3 asthma hospitalizations per 100,000 children under age 18 are attributable to PM 2.5 (2008 baseline minus natural background levels) in the Twin Cities metro area every year (Table 4). Rates of PM 2.5-attributable asthma hospitalizations for children range across ZIP codes from 0.5 to 27.5 per 100,000 individuals (Figure 10, left). The two ZIP codes with the highest attributable rates are in downtown Minneapolis and downtown St. Paul. Many of the highest attributable rates are in Minneapolis. PM 2.5-attributable asthma hospitalization rates among children follow the same geographic pattern as the underlying rate of childhood asthma hospitalizations (Figure 10, right). Respiratory hospitalizations An estimated 2.4 asthma and COPD hospitalizations per 100,000 adults age 18 to 64 are attributable to PM 2.5 (2008 baseline minus natural background levels) in the Twin Cities metro area every year (Table 4). Adults 65 and older are far more vulnerable to PM 2.5-attributable respiratory hospitalizations, with rates more than 20 times higher than for the younger adult population. An estimated 53 hospitalizations due to respiratory conditions per 100,000 adults ages 65 and older are attributed to PM 2.5 (2008 baseline minus natural background levels) in the Twin Cities metro area every year. The ZIP codes with the highest attributable rates for both age groups are in Minneapolis and St. Paul (Figures 11, left and 12, left). Respiratory hospitalizations for adults 65 and older are more widely distributed throughout the metro area. PM 2.5-attributable respiratory hospitalization rates among adults follow the same geographic pattern as the underlying rate of respiratory hospitalizations in this age group (Figure 11). Underlying respiratory hospitalization rates among adults 65 and older are higher in the western and northern parts of the metro area compared to the PM 2.5-attributable rate of respiratory hospitalization, although many of the highest underlying rates are still in Minneapolis and St. Paul (Figure 12). 25
27 26
 in the Twin Cities metro area every year (Table 4).")
28 Cardiovascular hospitalizations An estimated 28.9 cardiovascular hospitalizations per 100,000 adults age 65 and older are attributable to PM 2.5 (2008 baseline minus natural background levels) in the Twin Cities metro area every year (Table 4). Across metro-area ZIP codes, the attributable rate of cardiovascular hospitalizations among adults 65 and older ranges from about nine to 53 hospitalizations per 100,000 individuals (Figure 13, left). The highest attributable rates are in St. Paul, Minneapolis, suburbs of Minneapolis, and western Carver County.
 in the Twin Cities metro area every year (Table 4).")
29 Asthma emergency department visits An estimated 13.6 asthma emergency department visits per 100,000 people (all ages) are attributable to PM 2.5 (2008 baseline minus natural background levels) in the Twin Cities metro area every year (Table 4). Attributable rates vary by ZIP code from two to 85 per 100,000 individuals, with the highest rates in Minneapolis and St. Paul (Figure 14, left). PM 2.5-attributable asthma emergency department rates follow the same geographic pattern as the underlying rate of asthma emergency department visits (Figure 14, right). 28
 are attributable to ozone (May- September 2008 baseline minus natural background levels) in the Twin Cities metro area every year (Table 5).")
30 Ozone Cardiopulmonary disease (CPD) death An estimated 0.8 cardiovascular deaths per 100,000 people (all ages) are attributable to ozone (May- September 2008 baseline minus natural background levels) in the Twin Cities metro area every year (Table 5). Ozone-attributable death rates range by ZIP code from 0.1 to seven per 100,000 individuals (Figure 15, left). Unlike the general pattern seen with PM 2.5-attributable health impact rates, the areas with the highest burden are generally not in the central cities (see page 12). High ozone-attributable death rates are found around the borders of Minneapolis and St. Paul as well as the westernmost ZIP codes of Scott and Carver Counties. Ozone-attributable death rates follow the same geographic pattern as the underlying death rate by ZIP code (Figure 15, right). 29
 are attributable to ozone (May- September 2008 baseline minus natural background levels) in the Twin Cities metro area every year (Table 5).")
31 Asthma hospitalizations An estimated 1.6 asthma hospitalizations per 100,000 people (all ages) are attributable to ozone (May- September 2008 baseline minus natural background levels) in the Twin Cities metro area every year (Table 5). Attributable rates vary by ZIP code, from 0.4 hospitalizations to nearly nine per 100,000 individuals (Figure 16, left). The highest attributable rates are seen in North Minneapolis, with other high attributable rates in other parts of Minneapolis, St. Paul, and areas to the north of Minneapolis. The geographic distribution of ozone-attributable asthma hospitalizations follows the same geographic pattern as the underlying rate of asthma hospitalizations, with higher rates in the central cities relative to outlying suburban areas (Figure 16, right). 30
 are attributable to ozone (May- September 2008 baseline minus natural background levels) in the Twin Cities metro area every year (Table 5).")
32 Asthma emergency department visits An estimated 6.3 asthma ED visits per 100,000 people (all ages) are attributable to ozone (May- September 2008 baseline minus natural background levels) in the Twin Cities metro area every year (Table 5). Attributable rates vary by ZIP code, from 1.4 to nearly 40 ED visits per 100,000 individuals (Figure 17, left). The geographic pattern for ozone-attributable asthma ED visits is similar to the pattern for ozone-attributable asthma hospitalizations, with the highest rates found in the central cities. Ozoneattributable asthma ED rates follow the same geographic pattern as the underlying rate of asthma ED visits (Figure 17, right). 31
33 3. Air pollution exposure among population subgroups Population-weighted annual average exposure levels were calculated for ZIP code-level populations of poverty and populations of color (Table 6). ZIP codes with higher percentages of the population in poverty or higher percentages of residents of color have slightly higher average levels of PM 2.5 pollution. For ozone pollution the pattern is reversed: ZIP codes with higher percentages of the population in poverty or higher percentages of residents of color have lower average levels of ozone pollution. The differences in average pollutant concentrations among categories are small, and reflect the relatively low variation in air quality concentrations across the Twin Cities metro area (Figures 5 and 6). Table 6: Population-weighted average air quality concentrations by poverty and racial concentrations Group of ZIP codes Average PM 2.5 concentration Average ozone concentration (micrograms per cubic meter) (parts per billion) All ZIP codes ZIP codes with: 0-19 percent residents in poverty percent percent or more ZIP codes with: 0-24 percent residents of color percent percent or more
34 4. Demographic analysis of Twin Cities metro-area pollution-attributable health impacts Age All outcomes by age follow the same patterns as the underlying rates for all causes (Table 7). With the exception of PM 2.5-attributable respiratory hospitalizations, which use different effect estimates by age, there are no differences in the fraction of disease attributable to air pollution by age. For each outcome, PM 2.5 pollution has a much bigger impact than ozone pollution. PM 2.5-attributable death rates (Figure 18) and PM 2.5-attributable respiratory hospitalization rates (Figure 19) are higher among the elderly (ages 65 and older), while PM 2.5-attributable asthma ED visit rates are higher among children (under age 18; Figure 20). Both the elderly and children experience high ozone-attributable respiratory hospitalization rates (Figure 19). Like PM 2.5, ozone-attributable ED visit rates are highest among children (Figure 20). Table 7. Health impacts in the Twin Cities metro area by age group PM 2.5 Ozone Attributable Attributable Age Group Rate per Rate per Rate per Attributable Rate per Attributable 100, , ,000 Fraction 100,000 Fraction people people people people Death All-cause (ages 25 and older) Cardiopulmonary causes (all ages) 0-17 years % or years % % years % % 65 years and older 4, % % Respiratory Hospitalizations Asthma, Asthma plus COPD, all respiratory Asthma 0-17 years % % years % % years % % 65 years and older 2, % % Asthma Emergency Department Visits 0-17 years 1, % % years % % years % % 65 years and older % % 33
Air Quality Index A Guide to Air Quality and Your Health
 1EPA United States Environmental Protection Agency Air Quality Index A Guide to Air Quality and Your Health 2 Recycled/Recyclable. Printed with vegetable oil-based inks on 100% postconsumer process, chlorine-free
Asthma and air pollution: health effects and prevention
 Asthma and air pollution: health effects and prevention FuyuenYip PhD, MPH Air Pollution and Respiratory Health Branch Division of Environmental Hazards and Health Effects National Center for Environmental
Particle Pollution: It s s a Serious Concern. Template Presentation for Regions
 Particle Pollution: It s s a Serious Concern Template Presentation for Regions What is particle pollution? The particles in particle pollution are so small, you can t see just one of them... An average
Every day, the average adult breathes about 15,000 to 20,000 litres of air. 1
 Every day, the average adult breathes about 15,000 to 20,000 litres of air. 1 Children are uniquely vulnerable to environmental contaminants because, relative to their body size, they breathe in more air
New York State Department of Health Center for Environmental Health
 New York State Department of Health Center for Environmental Health March 2002 Evaluation of Asthma and Other Respiratory Hospital Admissions among Residents of ZIP Codes 14043 and 14227, Cheektowaga,
Green Week Planetary boundaries in the context of air quality: empowering actors to act, urgently
 Green Week 2013 Planetary boundaries in the context of air quality: empowering actors to act, urgently Empowering the most vulnerable groups - How can you fight against air pollution? Air pollution and
Contact Links. This page provides general information on the effects of air pollution on human health.
 Page 1 of 10 Contact Links.c Home CalEEMod Documents CAPCOA GHG Rx About Us Districts Board Members Maps Moyer Rural Assistance Ag Clearinghouse NOA Health Effects Employment Climate Change Health Effects
Exercise and Air Pollution
 Exercise and Air Pollution Two Major Groups of Air Pollutants Primary From a single source of pollution CO, sulfur oxides, nitrogen oxides, hydrocarbons, particulants Secondary Result from an interaction
LEARNING MODULE #17: ENVIRONMENTAL HEALTH: ISSUES AND IMPACT
 LEARNING MODULE #17: ENVIRONMENTAL HEALTH: ISSUES AND IMPACT Environmental Health: Issues and Impact Carol Ann Gross-Davis, PhD, MS Adjunct Assistant Professor Drexel University, School of Public Health
Group Against Smog and Pollution, Inc. We work to improve air quality to ensure human, environmental, and economic health.
 Group Against Smog and Pollution, Inc. We work to improve air quality to ensure human, environmental, and economic health. Pittsburgh has made progress to improve air quality but More than 60% of days
What are the Human Health Effects of Air Pollution?
 What are the Human Health Effects of Air Pollution? Dr. Judy Guernsey Department of Community Health and Epidemiology Dalhousie University Nova Scotia Department of Environment and Labour Outdoor Air Quality
Air Quality: What an internist needs to know
 Air Quality: What an internist needs to know Robert Paine, M.D. Pulmonary and Critical Care Medicine University of Utah School of Medicine Program for Air Quality, Health and Society February, 2017 October
Outdoor Air Quality: What Child Care Providers Should Know
 Outdoor Air Quality: What Child Care Providers Should Know Name: First and Last Position: Child Care Name and Location: STARS Number: (required for STARS credit) Email: print clearly Phone number: Pause
GUIDANCE ON METHODOLOGY FOR ASSESSMENT OF FOREST FIRE INDUCED HEALTH EFFECTS
 GUIDANCE ON METHODOLOGY FOR ASSESSMENT OF FOREST FIRE INDUCED HEALTH EFFECTS David M. Mannino Air Pollution and Respiratory Health Branch Division of Environmental Hazards and Health Effects National Center
Fire Smoke and Human Health: How we share what we know
 Fire Smoke and Human Health: How we share what we know Dona Upson, MD Associate Professor, UNM, NMVAHCS Pulmonary, Critical Care & Sleep Medicine American Lung Association & American Thoracic Society Slides
UNIVERSITY OF CAMBRIDGE INTERNATIONAL EXAMINATIONS International General Certificate of Secondary Education
 www.xtremepapers.com UNIVERSITY OF CAMBRIDGE INTERNATIONAL EXAMINATIONS International General Certificate of Secondary Education *8369008797* TWENTY FIRST CENTURY SCIENCE 0608/05 Paper 5 October/November
US power plant carbon standards and clean air and health co-benefits
 US power plant carbon standards and clean air and health co-benefits Emissions Modeling For each scenario, we used emissions output from ICF International s Integrated Planning Model (IPM) conducted by
An Overview of Asthma - Diagnosis and Treatment
 An Overview of Asthma - Diagnosis and Treatment Definition of Asthma: Asthma is a common chronic disease of children and adults. Nationally, more than 1 in 14 Americans report having asthma and as many
Smoke gets in your lungs. Assoc Prof Peter Franklin University of Western Australia Environmental Health Directorate, EHD
 Smoke gets in your lungs Assoc Prof Peter Franklin University of Western Australia Environmental Health Directorate, EHD Conflict of Interest Conflict of Interest I have an open fireplace Wood smoke is
The Toll of. Coal. Health Impacts of Coal Export in the Northwest. Steven G. Gilbert, PhD, DABT
 The Toll of Coal Health Impacts of Coal Export in the Northwest Steven G. Gilbert, PhD, DABT sgilbert@innd.org Bureau of Land Management The United States is the Saudi Arabia of coal. Coal Life Cycle Mountaintop
Avg PM10. Avg Low Temp
 Geography 532 Geography of Environmental Health Dr. Paul Marr Name: Ex 16- Seasonality, Time Delay, and Disease (10 pts) Below are asthma cases per month for the years 1992-1994. The table also includes
Population Percent C.I. All Hennepin County adults aged 18 and older 12.1% ± 1.2
 Overview ` Why Is This Indicator Important? Tobacco use remains the single most preventable cause of disease, disability and death in the United States. How Are We Doing? In the past decade, smoking rate
Question 1: What is your diagnosis?
 Case study title: Target group: Linked to modules: Outdoor air pollution (Clinical case) Paediatricians, General practitioners, Public health professionals Indoor air pollution, Outdoor air pollution,
Struggling to Breathe:
 NEW YORK STATE SENATOR Marisol Alcántara Struggling to Breathe: Manhattan s Asthma Epidemic May 2017 Introduction According to a report by the New York State Department of Health, [o]ne in every 10 adults
3.0 Asthma and Respiratory Disease
 3. Asthma and Respiratory Disease The air children breathe is an important source of exposure to substances that may potentially harm their health (US EPA 23).Exposures in early childhood when the lungs
INSTITUTE OF PHYSICS
 FEDERAL UNIVERSITY OF SOUTH MATO GROSSO INSTITUTE OF PHYSICS IMPACTS OF CLIMATE VARIABILITY ON RESPIRATORY MORBIDITY. AUTOR: AMAURY DE SOUZA, FLAVIO ARISTONE, ANA PAULA BERTOSSI OHIO 2014 PROBLEM SITUATION
Wildfire Smoke and Your Health
 Wildfire Smoke and Your Health Frequently Asked Questions about Wildfire Smoke and Public Health Q: Why is wildfire smoke bad for my health? A: Wildfire smoke is a mixture of gases and fine particles from
Air pollution and health
 Air pollution and health Dr. Amir Elahi Johri, MBBS, MPH, ACIEH, FRSPH Consultant Air Pollution It is the introduction of chemicals, particulate matter or biological materials that cause harm or discomfort
Air Pollution and Heart Health
 Air Pollution and Heart Health Wayne E. Cascio, MD, FACC, FAHA Director, Environmental Public Health Division National Health and Environmental Effects Research Laboratory Disclosure of Conflicts of Interest
The burden of asthma on the US Healthcare system and for the State of Texas is enormous. The causes of asthma are multifactorial and well known.
 The burden of asthma on the US Healthcare system and for the State of Texas is enormous. The causes of asthma are multifactorial and well known. There are also indications that rural counties have a higher
STATE ENVIRONMENTAL HEALTH INDICATORS COLLABORATIVE (SEHIC) CLIMATE AND HEALTH INDICATORS
 CLIMATE AND HEALTH INDICATORS") STATE ENVIRONMENTAL HEALTH INDICATORS COLLABORATIVE (SEHIC) CLIMATE AND HEALTH INDICATORS Category: Indicator: Health Outcome Indicators Allergic Disease MEASURE DESCRIPTION Measure: Time scale: Measurement
STATE ENVIRONMENTAL HEALTH INDICATORS COLLABORATIVE (SEHIC) CLIMATE AND HEALTH INDICATORS Category: Indicator: Health Outcome Indicators Allergic Disease MEASURE DESCRIPTION Measure: Time scale: Measurement
Air Pollution & Quality of Life in East Flatbush, Brooklyn.
 Air Pollution & Quality of Life in East Flatbush, Brooklyn. A National Science Foundation Graduate K-12 (NSF-GK12) Program, in partnership with It Takes A Village Academy and Brooklyn College. Air Quality
2012 PENNSYLVANIA ASTHMA BURDEN REPORT
 2012 PENNSYLVANIA ASTHMA BURDEN REPORT Table Of Contents Introduction ----------------------------------------------------------------------------------------------------1 Methodology---------------------------------------------------------------------------------------------------2
DATA SNAPSHOT THURSTON THRIVES ENVIRONMENT ACTION TEAM
 DATA SNAPSHOT THURSTON THRIVES ENVIRONMENT ACTION TEAM Thurston County Public Health & Social Services Department May 2014 TABLE OF CONTENTS Introduction 3 Health Concerns 4-9 Asthma Secondhand Smoke Cancer
Asthma in Minnesota. Figure 1. Percentage of Minnesota Adults with Current Asthma,
 Epidemiology Asthma in Minnesota As part of the CDC grant, the MDH has been collecting and analyzing available asthma data for the past seven years. Although the picture of asthma remains incomplete, much
Considerations About Exposure and Health Effects of Traffic Pollution
 Considerations About Exposure and Health Effects of Traffic Pollution Northern Transportation and Air Quality Summit 2010 August 24, 2010 Maria Costantini Health Effects Institute What Is HEI HEI is a
Even Moderate Air Pollution Can Raise Stroke Risks
 Beth Israel Deaconess Medical Center - A Teaching Hospital of Harvard Medical School Home > News > In Medicine > Even Moderate Air Pollution Can Raise Stroke Risks Even Moderate Air Pollution Can Raise
Broomhill, Broomhall, Crookes, Crookesmoor & Crosspool 2008
 ,,, moor & 28 Air Quality Health Effects of Air Pollution Some Health Trends Neighbourhoods Information System (SNIS) 28BBCCCHealthAir 1 Prepared by Barbara Rimmington East End Quality of Life Initiative
Health Effects of Ambient Air Pollution
 Health Effects of Ambient Air Pollution Jennifer L. Peel, PhD, MPH jennifer.peel@colostate.edu Department of Environmental and Radiological Health Sciences Colorado State University Fort Collins, CO 5/18/2010
HIV/AIDS Perinatal Surveillance Minnesota Department of Health HIV/AIDS Surveillance System
 HIV/AIDS Perinatal Surveillance 2012 Minnesota Department of Health HIV/AIDS Surveillance System Background This slide set describes births to HIV-infected women in Minnesota by person, place, and time.
III. Health Status and Disparities
 Mid-America Regional Council and REACH Healthcare Foundation Regional Health Assessment March 2015 www.marc.org/healthassessment III. Health Status and Disparities Community health outcomes are often a
Key Facts About. ASTHMA
 Key Facts About. ASTHMA Asthma is a serious lung disease that can be frightening and disabling. The public is becoming increasingly aware that more people, especially children, are suffering and dying
Appendix E. BenMAP Health Benefit Analysis PM2.5 Plan SJVUAPCD
 Appendix E BenMAP Health Benefit Analysis SJVUAPCD 0 This page intentionally blank. Appendix E: BenMAP Health Benefit Analysis Appendix E: BenMAP Analysis This section of the report presents the empirical
Our Climate Our Health
 Our Climate Our Health JUST THE FACTS CONGRESSIONAL FORUM ARLINGTON VIRGINIA CAMPUS, GEORGE MASON UNIVERSITY MONA SARFATY, MD MPH FAAFP DIRECTOR, PROGRAM ON CLIMATE AND HEALTH NOVEMBER 2015 The Health
Frequently asked questions about wildfire smoke and public health
 PUBLIC HEALTH DIVISION http://public.health.oregon.gov Frequently asked questions about wildfire smoke and public health Wildfire smoke Q: Why is wildfire smoke bad for my health? A: Wildfire smoke is
Environmental Triggers of Asthma. Gaynor Govias BSc BEd CAI
 Environmental Triggers of Asthma Gaynor Govias BSc BEd CAI Environmental Triggers of Asthma Third Edition Gaynor Govias, B. Sc., B. Ed., CAI Gaynor D. Govias Environmental Triggers of Asthma Third edition
Presenter. Mona Sarfaty, MD, MPH, FAAFP Director, Program on Climate and Health Center for Climate Change Communication George Mason University
 Presenter Mona Sarfaty, MD, MPH, FAAFP Director, Program on Climate and Health Center for Climate Change Communication George Mason University Making the Connection: Climate Changes Allergies and Asthma
Comparison of fine particulate matter and ozone levels in zip code areas of New York City with different child asthma burdens
 Environmental Exposure and Health 23 Comparison of fine particulate matter and ozone levels in zip code areas of New York City with different child asthma burdens M. Solorzano 1, J. Stingone 2, A. R. Rentas
The Health Effects of Air Pollution. Haim Bibi Carmel Medical Center
 The Health Effects of Air Pollution on Children Haim Bibi Carmel Medical Center Haifa Why are children at special risk? Physically, children are more vulnerable to air pollution than adults. Their respiratory
Rule 421 Mandatory Episodic Curtailment of Wood and Other Solid Fuel Burning
 Rule 421 Mandatory Episodic Curtailment of Wood and Other Solid Fuel Burning Introduction Fine particle pollution exceeds health standards Particle pollution can cause premature death, strokes, heart attacks,
SCOPE OF HIV/AIDS IN MINNESOTA
 SCOPE OF HIV/AIDS IN MINNESOTA National Perspective Compared to the rest of the nation, Minnesota is considered to be a low- to-moderate HIV/AIDS incidence state. In 2013 (the most recent year for which
Minnesota Influenza Geographic Spread
 Weekly Influenza & Respiratory Illness Activity Report A summary of influenza surveillance indicators prepared by the Division of Infectious Disease Epidemiology Prevention & Control Week Ending October
Connecting the Dots of Climate Change and Health: An Interactive Computer Lab
 Teacher s Guide Connecting the Dots of Climate Change and Health: An Interactive Computer Lab Incorporated Minnesota Standards: 7.1.3.4.1 8.1.1.2.1 8.1.3.4.1 8.3.4.1.2 Description: This lab incorporates
The Health Effects of Combustion
 The Health Effects of Combustion David Christiani, MD, MPH, MS Department of Environmental Health Harvard School of Public Health Energy: The Fuel of Life 1 Sources of Energy Renewable Non renewable (US
Air Pollution in Fairbanks. The inside and outside story
 Air Pollution in Fairbanks The inside and outside story Pol-lu-tion (definition) The presence or introduction into the environment of a substance or thing that has harmful or poisonous effects. History
HIV/AIDS Perinatal Surveillance, HIV/AIDS Surveillance System STD/HIV/TB Section, Epidemiology and Surveillance Unit
 HIV/AIDS Perinatal Surveillance, 2016 HIV/AIDS Surveillance System STD/HIV/TB Section, Epidemiology and Surveillance Unit Background (1/2) This slide set describes births to HIV-positive women in Minnesota
Diesel Exhaust: Health Effects. Research Needs
 Diesel Exhaust: Health Effects and Research Needs Eric Garshick, MD, MOH Assistant Professor of Medicine VA Boston Healthcare System Channing Laboratory, Brigham and Womens Hospital Harvard Medical School
Asthma-Related Hospitalization and Emergency Room Visits in Oakland
 McNair Research Journal SJSU Volume 13 Spring 2017 Article 12 2017 Asthma-Related Hospitalization and Emergency Room Visits in Oakland Alondra Varela San Jose State University Follow this and additional
Contents. Background Sources Types Respiratory health effects Assessment methods In Kuwait Conclusion
 Air Pollution Saleh Alshehabi Occupational Health Physician MBBS Faculty of Medicine, Kuwait University MSc Occupational Health & Safety Uni of Surrey, United Kingdom PhD Occupational & Environmental Health
asthma Asthma in Minnesota 2005 Epidemiology Report
 Asthma in Minnesota 2005 Epidemiology Report ACCOMPLISHING STRATEGIES asthma HEALTHIER MINNESOTANS WITH ASTHMA Asthma Program Chronic Disease and Environmental Epidemiology Health Promotion and Chronic
Bad Things and the Heart
 Bad Things and the Heart K A T H L E E N M H E I N T Z, D. O., F A C C A S S I S T A N T P R O F E S S O R O F M E D I C I N E D I V I S I O N O F C A R D I O L O G Y C O O P E R M E D I C A L S C H O
Haze and Health Effects
 29 August 2016 Haze and Health Effects Singapore can experience haze from time to time. This is more likely in the months of May to October as a result of very dry weather conditions in the region intensifying
Minnesota Influenza Geographic Spread
 Weekly Influenza & Respiratory Illness Activity Report A summary of influenza surveillance indicators prepared by the Division of Infectious Disease Epidemiology Prevention & Control Week Ending April
Minnesota Influenza Geographic Spread
 Weekly Influenza & Respiratory Illness Activity Report A summary of influenza surveillance indicators prepared by the Division of Infectious Disease Epidemiology Prevention & Control Week Ending December
Weekly Influenza & Respiratory Illness Activity Report
 Weekly Influenza & Respiratory Illness Activity Report A summary of influenza surveillance indicators prepared by the Division of Infectious Disease Epidemiology Prevention & Control Week Ending March
Asthma: A Growing Epidemic By Glen Andersen
 National Conference of State Legislatures ENVIRONMENTAL H EALTH SERIES May 2000 No. 4 Asthma: A Growing Epidemic By Glen Andersen OVERVIEW Rates for asthma have steadily increased over the past 20 years
TALKING POINTS. Ten Reasons Why the Ozone Air Quality Standard Must Be Strengthened
 October 22, 2014 TALKING POINTS Ten Reasons Why the Ozone Air Quality Standard Must Be Strengthened 1. The current standard is not protective of public health. The Clean Air Act requires EPA to set National
Minnesota Influenza Geographic Spread
 Weekly Influenza & Respiratory Illness Activity Report A summary of influenza surveillance indicators prepared by the Division of Infectious Disease Epidemiology Prevention & Control Week Ending March
Health Effects of Fine Particles. Bart Ostro, Ph.D., OEHHA Cal EPA
 Health Effects of Fine Particles Bart Ostro, Ph.D., OEHHA Cal EPA PM10 and PM2.5: Size and Composition Fine Coarse Ultra Fine Sulfates Nitrates Ammonia Carbon Lead (HM) Organics Soil Dust Silica Salts
The Burden of Asthma in Mississippi:
 The Burden of Asthma in Mississippi: 2009 Asthma Surveillance Summary Report April 2009 The Burden of Asthma in Mississippi: 2009 Asthma Surveillance Summary Report Haley Barbour Governor F.E. Thompson,
baby power PROTECT LITTLE LUNGS What makes baby lungs so incredible, and how can we help keep the air safe for our children?
 baby power PROTECT LITTLE LUNGS What makes baby lungs so incredible, and how can we help keep the air safe for our children? BABY S FIRST BREATH Consider a baby s lungs: They are miracles of biological
12/3/2008. Photo Credit to W. Zamore
 Traffic-Related Pollution and Health Policy Issues Andrea Hricko Associate Professor of Preventive Medicine Keck School of Medicine, USC Congressional Staff Briefing December 3, 2008 Faculty member My
Asthma Action. Contra Costa Asthma Coalition
 Blueprint Asthma Action for A Report for Awareness and Advocacy in Contra Costa County Contra Costa Asthma Coalition Mission of the Contra Costa Asthma Coalition The Contra Costa Asthma Coalition is an
Weekly Influenza & Respiratory Illness Activity Report
 Weekly Influenza & Respiratory Illness Activity Report A summary of influenza surveillance indicators prepared by the Division of Infectious Disease Epidemiology Prevention & Control Week Ending February
Racial disparities in health outcomes and factors that affect health: Findings from the 2011 County Health Rankings
 Racial disparities in health outcomes and factors that affect health: Findings from the 2011 County Health Rankings Author: Nathan R. Jones, PhD University of Wisconsin Carbone Cancer Center Introduction
Minnesota Influenza Geographic Spread
 Weekly Influenza & Respiratory Illness Activity Report A summary of influenza surveillance indicators prepared by the Division of Infectious Disease Epidemiology Prevention & Control Week Ending January
Institute of the Environment
 Institute of the Environment Everything we do now matters Southern California Environmental Report Card - Fall 2008 INTRODUCTION Beate Ritz, MD, Ph.D. Michelle Wilhelm, Ph.D. As noted in previous Report
NEAR-ROADWAY AIR POLLUTION AND CHILDHOOD ASTHMA Challenges for Policy Makers
 NEAR-ROADWAY AIR POLLUTION AND CHILDHOOD ASTHMA Challenges for Policy Makers Rob McConnell Director, Southern California Children s Environmental Health Center Children s Health Study Communities CHILDREN
Environmental Health Information
 Environmental Health Information Offsite Soils:CMC Heartland Lite Yard Site September 2006 Where is the former CMC Heartland site? The former CMC Heartland site is located in the Hiawatha industrial corridor
Asthma and Air Pollution
 Asthma and Air Pollution Health Effects Workshop Nov. 6, 2008 Joann Held with thanks to: Dave Brown Asthma and Airways Asthma Physiology A chronic disease that affects airways. The inside walls of airways
Minnesota Influenza Geographic Spread
 Weekly Influenza & Respiratory Illness Activity Report A summary of influenza surveillance indicators prepared by the Division of Infectious Disease Epidemiology Prevention & Control Week Ending March
Minnesota Influenza Geographic Spread
 Weekly Influenza & Respiratory Illness Activity Report A summary of influenza surveillance indicators prepared by the Division of Infectious Disease Epidemiology Prevention & Control Week Ending February
Asthma and Chronic Obstructive Pulmonary Disease
 Asthma and Chronic Obstructive Pulmonary Disease Variables Adults have asthma Students who have asthma Asthma hospitalizations COPD hospitalizations What is it? Asthma and chronic obstructive pulmonary
Minnesota s Alcohol and Drug Counselor Workforce,
 OFFICE OF RURAL HEALTH AND PRIMARY CARE Minnesota s Alcohol and Drug Counselor Workforce, 2014-2016 HIGHLIGHTS FROM THE 2014 LADC WORKFORCE SURVEY i Overall According to the Board of Behavioral Health
Public Health Benefits of Reducing Ground-level Ozone and Fine Particle Matter in the Northeast U.S.
 Public Health Benefits of Reducing Ground-level Ozone and Fine Particle Matter in the Northeast U.S. A Benefits Mapping and Analysis Program (BenMAP) Study Prepared by NESCAUM For The Ozone Transport Commission
Minnesota Influenza Geographic Spread
 Weekly Influenza & Respiratory Illness Activity Report A summary of influenza surveillance indicators prepared by the Division of Infectious Disease Epidemiology Prevention & Control Week Ending February
Kansas City Data Collective Technical Report, June 2015
 Kansas City Data Collective Technical Report, June 2015 Top 10 leading causes of death, Kansas City Metro Area, 2007-2011 Background Kansas City Data Collective (KCDC) is a group of epidemiologists and
Beach Name City No. of Fire Rings LOS ANGELES COUNTY Total = 79. ORANGE COUNTY Total = 687
 Newport Beach June 13th El Segundo June 14th Background Newport Beach request to the Coastal Commission to remove fire rings Commission staff cited exemption in SCAQMD rules as justification to deny request
This slide set was produced by the Alameda County Public Health Department
 This slide set was produced by the Alameda County Public Health Department Community Assessment Planning an Evaluation (CAPE) Unit. One way that we work to achieve the ACPHD mission and vision is to monitor
Sexually Transmitted Disease (STD) Surveillance Report, 2017
 Surveillance Report, 2017") This document is made available electronically by the Minnesota Legislative Reference Library as part of an ongoing digital archiving project. http://www.leg.state.mn.us/lrl/lrl.asp Sexually Transmitted
This document is made available electronically by the Minnesota Legislative Reference Library as part of an ongoing digital archiving project. http://www.leg.state.mn.us/lrl/lrl.asp Sexually Transmitted
Air quality Indicator Notes Rice Standard** Year(s) Ozone, days above standard 70 ppb (ND) 2015 (ND) 9.97 (ND) 2015
 Ozone, days above standard 70 ppb (ND) 2015 (ND) 9.97 (ND) 2015") https://apps.health.state.mn.us/mndata/profiles Report date: 06/13/2017 RICE COUNTY PROFILE Minnesota Department of Health: Environmental Public Health Tracking Program Air quality Indicator Notes Rice
https://apps.health.state.mn.us/mndata/profiles Report date: 06/13/2017 RICE COUNTY PROFILE Minnesota Department of Health: Environmental Public Health Tracking Program Air quality Indicator Notes Rice
Urban Air Pollution in India is a matter of grave concern
 Air Pollution Related Cellular Changes in The Lung in and Delhi Urban Air Pollution in India is a matter of grave concern 28 million urban Indians are exposed to alarmingly high level of pollutants Health
Our Lungs, Our Air, Our Health
 UNIT 5 Our Lungs, Our Air, Our Health The Health Effects of Air Pollution ACTIVITY DESCRIPTION The first part of this activity introduces students to the human respiratory system. Using provided posters
Trends in COPD (Chronic Bronchitis and Emphysema): Morbidity and Mortality. Please note, this report is designed for double-sided printing
: Morbidity and Mortality. Please note, this report is designed for double-sided printing") Trends in COPD (Chronic Bronchitis and Emphysema): Morbidity and Mortality Please note, this report is designed for double-sided printing American Lung Association Epidemiology and Statistics Unit Research
Trends in COPD (Chronic Bronchitis and Emphysema): Morbidity and Mortality Please note, this report is designed for double-sided printing American Lung Association Epidemiology and Statistics Unit Research
Page County Virginia
 Page County Virginia Health Needs Assessment Part 2 Health Status Assessment October, 2001 Compiled and Printed by Blue Ridge Area Health Education Center James Madison University Page County, Virginia
Smoke and Human Health - Information for the Community
 Smoke and Human Health - Information for the Community Background - Hazelwood Mine Fire Inquiry Key recommendations relating to: air quality monitoring equipment revision of carbon monoxide protocols for
Oil & Gas Manuscript: Supplemental Materials
 Oil & Gas Manuscript: Supplemental Materials Overview of WRF Modeling Version.5 of the WRF model, Advanced Research WRF (ARW) core (Skamarock et al., 2008) was used for generating hourly 2011 meteorology.