Commissioning for Value Focus Pack. CCG: Heywood, Middleton & Rochdale Focus Area : Respiratory Programme Budget Category
|
|
|
- Imogene Greene
- 5 years ago
- Views:
Transcription
1 Commissioning for Value Focus Pack CCG: Heywood, Middleton & Rochdale Focus Area : Respiratory Programme Budget Category 1

2 What is a Deep Dive pack? CCGs have received a bespoke Commissioning for Value insights pack. These packs, sometimes referred to as Level 1 packs, analyse data on spend and outcomes at a Programme Budget level across a wide range of programmes. Those packs identified candidate programmes which offered the most value in return for improvement work they answered the question of - where to look. Deep Dive packs further examine areas chosen by the CCGs in order to gain a deeper understanding of issues within specific programmes of work or clinical pathways - What to change. The structure and content of Deep Dive packs has evolved through work done by Right Care and Yorkshire and Humber PHO (now PHE Knowledge and Intelligence Team) working with CCGs in Derbyshire and Yorkshire and Humber. The packs are produced by GEM CSU analysts working with consultants in public health medicine from Solutions for Public Health (an NHS enterprise hosted by GEM CSU). 2
3 Contents 1. Background and context Aims of the packs Packs as part of transformation process 2. Methodology Analysis methods CCG Benchmarking and Opportunities 3. CCG Analysis Respiratory the context for the deep dive analysis Summary messages for pathway stages: Prevalence Management in Primary Care Management in Secondary Care Mortality Opportunity table for indicators in the bottom quintile of benchmark group 4. Where to focus: Understanding practice variation All Practices: Indicators in the bottom quintile Top 3 Practices: Opportunities table 5. Bringing it all together, National Guidance Annexes Annex 1 Spine charts and opportunity tables Annex 2 CCG Cluster Classification Annex 3 Practice Cluster Classification Annex 4 Indicator List Glossary 3
4 1. Background and context Aims of the Packs The Commissioning for Value phase one packs, produced by NHSE, PHE and NHS Right Care, included an offer to work with CCGs to develop this Focus Pack, or deep dive. The deep dive looks at an agreed programme area to understand variation across the pathway, including GP practice benchmarking. Working with local intelligence teams, the deep dive will look to identify opportunities for improvement and support the CCG's discussion on methods of improving clinical pathways. Further support is available to use and explore the intelligence in this pack 4

5 1. Background and context How these Packs Support Service Improvement NHSE GEM 5
6 2. Methodology Analysis Methods Analysed wide range of indicators from across the pathway focussing on risk factors, spend, primary and secondary care usage and quality Analysed wide range of national benchmarked data to identify indicators where CCG is below the average for its CCG cluster group (see Annex 2) Identified indicators where CCG is in worst quintile within its cluster group Analysed practice based variation to identify practices which consistently compare poorly against their national clusters Identified opportunities for value improvement and quantified potential impact Listed all the indicators where CGG is below average for CCG cluster Quantified opportunity for indicators in bottom quintile moving to the CCG Cluster average Quantified additional opportunities for indicators moving to the top 20% for the CCG Cluster Quantification does not mean that the saving or improvement can actually be made, but may however answer the question Is it going to be worth focussing on this area? Reviewed national evidence base to identify potential interventions linked to opportunities Pulled together examples of what works against opportunity areas across the pathway 6
7 2. Methodology CCG Benchmarking and Opportunities CCGs are compared using a benchmark cluster group of most similar CCGs in terms of age, ethnicity, deprivation and population density The benchmark cluster group is based on YHPHO CCG classification methodology and differs to those used in the phase 1 packs. The definitions and constituent CCGs are in Annex 2 Indicators are ranked out of 100 within the CCG benchmark group. A rank of 1 is taken as comparatively worse e.g. higher spend/higher prevalence/ higher admission rate/lower screening uptake/lower urgent referrals Indicators where the CCG is in the bottom quintile of the benchmark group (ranked 1-20) are highlighted in the summary analysis slides and summary opportunity table 7
8 2. Methodology CCG Benchmarking and Opportunities An opportunity is calculated based on the CCG reaching the benchmark group average, and also reaching the 80 th percentile value, i.e. the best performing quintile, of the benchmark group Quantification does not mean that the saving or improvement can actually be made, but may however answer the question Is it going to be worth focussing on this area? Spine graphs and the full opportunity tables are in Annex 1 A list of all indicators used is in Annex 4 A Glossary is available 8
9 Deep Dive Pack Phase 1 9
10 10
11 11
12 12
13 13
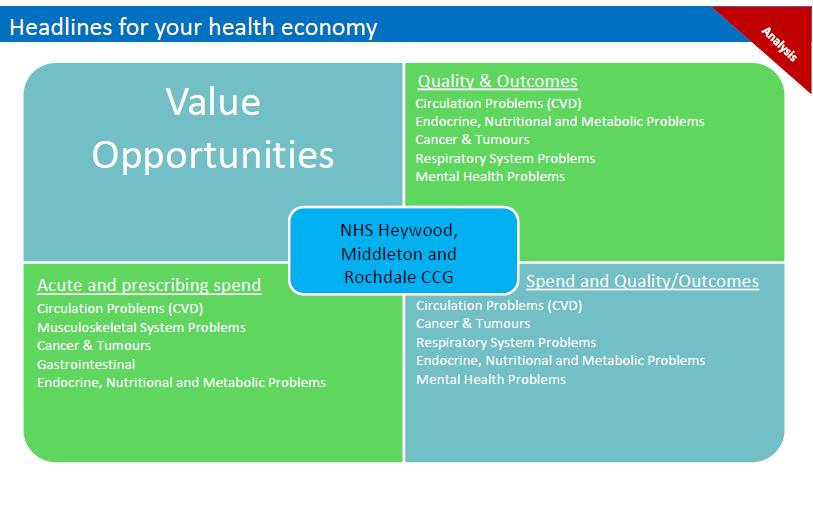
14 3. Respiratory Context for Deep Dive Analysis The Right Care Commissioning for Value phase 1 pack highlighted that, compared to their comparator CCGs, Heywood, Middleton & Rochdale CCG had: Significantly higher prevalence of asthma COPD prevalence in the highest quartile in England Significantly higher spend on prescribing Significantly higher respiratory admission rates across all secondary care, and non-elective care Significantly higher emergency admissions relative to patients on the register 14
15 DDP Phase 1 vs DDP Phase 2 analysis DDP Phase 2 Differs from DDP Phase 1 analysis Different clustering methods nearest 10 CCGs vs colour coded-cluster CCGs Phase 1, but not phase 2 method included population size as a clustering metric Different years of data 2011/12 vs 2012/13 for phase 2 Therefore analysis gives different results 15
16 DDP1 Analysis based on comparison with 10 most similar CCGs NHS Bolton CCG NHS Oldham CCG NHS Bradford Districts CCG NHS Stoke on Trent CCG NHS South Tees CCG NHS Bury CCG NHS Tameside and Glossop CCG NHS Newcastle West CCG NHS Leeds South and East CCG NHS Walsall CCG 16
17 DDP 2 Analysis based on comparison with all CCGs in yellow cluster group Heywood, Middleton & Rochdale CCG is in the Yellow Cluster Group: A younger population with a higher than average proportion of the population from Black and Asian ethnic groups and moderate levels of deprivation. Code CCG Name Code CCG Name 00G NHS Newcastle North and East CCG 06P NHS Luton CCG 00H NHS Newcastle West CCG 07L NHS Barking and Dagenham CCG 00Q NHS Blackburn with Darwen CCG 07M NHS Barnet CCG 00Y NHS Oldham CCG 07V NHS Croydon CCG 01D NHS Heywood, Middleton and Rochdale CCG 07W NHS Ealing CCG 01G NHS Salford CCG 07X NHS Enfield CCG 01M NHS North Manchester CCG 07Y NHS Hounslow CCG 01N NHS South Manchester CCG 08A NHS Greenwich CCG 02R NHS Bradford Districts CCG 08E NHS Harrow CCG 03C NHS Leeds West CCG 08G NHS Hillingdon CCG 03F NHS Hull CCG 08J NHS Kingston CCG 03G NHS Leeds South and East CCG 08N NHS Redbridge CCG 03J NHS North Kirklees CCG 08R NHS Merton CCG 03N NHS Sheffield CCG 09H NHS Crawley CCG 04C NHS Leicester City CCG 10R NHS Portsmouth CCG 04F NHS Milton Keynes CCG 10T NHS Slough CCG 04K NHS Nottingham City CCG 10W NHS South Reading CCG 04X NHS Birmingham South and Central CCG 10X NHS Southampton CCG 05A NHS Coventry and Rugby CCG 11H NHS Bristol CCG 05L NHS Sandwell and West Birmingham CCG 13P NHS Birmingham Crosscity CCG 05Y NHS Walsall CCG 99A NHS Liverpool CCG 06A NHS Wolverhampton CCG 17
18 Annex 2: CCG cluster classification The CCG Cluster groups are taken from YHPHO methodology, which groups together CCGs with similar populations. It is based on statistical cluster analysis (K-means analysis) including variables of age structure of the population, the population from Black and Asian ethnic groups, population density and deprivation. Cluster Classification Group Purple Blue Green Yellow Orange 0-19 years years years years 80+ years Population from Black ethnic groups Population from Asian ethnic groups Population density (persons per hectare) Average IMD 2010 score An older population living in rural areas and low deprivation levels 22.3% 22.0% 27.8% 21.9% 6.0% 0.5% 1.9% A very young population with a high proprtion of the population from Black and Asian ethnic groups and high levels of deprivation. A younger population with a high proportion of the population from Black and Asian ethnic groups and moderate levels of deprivation. A younger population with a higher than average proportion of the population from Black and Asian ethnic groups and moderate levels of deprivation. A population with an average age structure, average deprivation levels and a low population density. 26.4% 41.1% 21.3% 9.0% 2.1% 16.2% 31.6% % 42.0% 23.5% 10.4% 2.5% 16.7% 10.3% % 31.6% 24.5% 14.1% 3.7% 6.7% 17.7% % 25.3% 27.9% 18.2% 4.5% 1.5% 4.6%
19 Deep Dive Phase 2 19
20 3. ANALYSIS CCG Indicators and Opportunities in the bottom quintile of the benchmark cluster group Pathway step Prevalence Primary Care Indicator Gain if CCG had same 'rate' as benchmark cluster of CCGs Benchmark average Percentage of patients registered with a GP aged 15+ recorded as current smoker 24.50% 21.10% 6096 fewer smokers QOF COPD prevalence 2.30% 1.70% 1439 fewer COPD cases QOF Asthma prevalence 6.90% 5.70% 2518 fewer asthma cases Respiratory Cost prescribed per 1000 population 24,590 19, reduction Respiratory Items prescribed per 1000 population fewer items prescribed Inhaled Corticosteroids ADQ per STAR PU Cost reduction COPD Cost prescribed per 1000 population 7,382 5, reduction COPD Items prescribed per 1000 population fewer items prescribed % with COPD who have had a review including assessment of breathlessness in last 15 months (COPD13) 88.80% 90.90% 101 additional patients managed Asthma Cost prescribed per 1000 population 15,619 12, reduction Asthma Items prescribed per 1000 population fewer items prescribed Other Respiratory Cost prescribed per 1000 population 2,383 1, reduction Other Respiratory Items prescribed per 1000 population fewer items prescribed CCG Value Benchmark Value 20
21 3. ANALYSIS CCG Indicators and Opportunities in the bottom quintile of the benchmark cluster group Pathway step Secondary Care All Respiratory Secondary Care All Asthma Secondary Care Other Respiratory Indicator Gain if CCG had same 'rate' as benchmark cluster of CCGs Benchmark average Respiratory Inpatient spend per 1000 population 2,891 2, reduction Respiratory Secondary care admissions per 1000 population fewer admissions Respiratory Inpatient admissions per 1000 population fewer admissions Respiratory Emergency admissions per 1000 population fewer admissions Under 75 years Emergency Respiratory Admissions DSR per 100, fewer admissions Asthma Secondary care spend per 1000 population 2,005 1, reduction Asthma Emergency spend per 1000 population 1,775 1, reduction Asthma Secondary care admissions per 1000 population fewer admissions Asthma Emergency admissions per 1000 population fewer admissions Asthma Secondary care admissions per Asthma register fewer admissions Other Respiratory Inpatient spend per 1000 population 2,703 2, reduction Other Respiratory Secondary care admissions per 1000 population fewer admissions Other Respiratory Inpatient admissions per 1000 population fewer admissions Other Respiratory Emergency admissions per 1000 population fewer admissions Emergency admissions for children with lower respiratory disease fewer admissions Upper Respiratory Infection All Ages Emergency Admissions DSR per 100, fewer admissions Upper Respiratory Infection <75 Emergency Admissions DSR per 100, fewer admissions Lower Respiratory Infection All Ages Emergency Admissions DSR per 100, fewer admissions Lower Respiratory Infection <75 Emergency Admissions DSR per 100, fewer admissions CCG Value Benchmark Value 21
22 3. ANALYSIS Summary: Prevalence 3 / 6 indicators for prevalence are in the bottom quintile of the benchmark group: 1. Percentage of patients registered with a GP aged 15+ recorded as current smoker 2. QOF COPD prevalence 3. QOF Asthma prevalence 22
23 3. ANALYSIS Summary: Management in Primary Care 10 / 35 indicators are in the bottom quintile of the benchmark group Prescribing: 1. Respiratory Cost prescribed per 1000 population 2. Respiratory Items prescribed per 1000 population 3. Inhaled Corticosteroids ADQ per STAR PU Cost 4. COPD Cost prescribed per 1000 population 5. COPD Items prescribed per 1000 population 6. Asthma Cost prescribed per 1000 population 7. Asthma Items prescribed per 1000 population 8. Other Respiratory Cost prescribed per 1000 population 9. Other Respiratory Items prescribed per 1000 population 23
24 3. ANALYSIS Summary: Management in Primary Care 10 / 35 indicators are in the bottom quintile of the benchmark group QOF 10.% with COPD who have had a review including assessment of breathlessness in last 15 months (COPD13) 24
25 3. ANALYSIS Summary: Management in secondary care 19 / 50 indicators are in the bottom quintile of the benchmark group. Respiratory admissions (elective, non-elective) and inpatient spend 1. Respiratory Inpatient spend per 1000 population 2. Respiratory Secondary care admissions per 1000 population 3. Respiratory Inpatient admissions per 1000 population 4. Respiratory Emergency admissions per 1000 population 5. Under 75 years Emergency Respiratory Admissions DSR per 100,000 25
26 3. ANALYSIS Summary: Management in secondary care 19 / 50 indicators are in the bottom quintile of the benchmark group. Admissions (elective, non-elective) and spend for asthma 6. Asthma Secondary care spend per 1000 population 7. Asthma Emergency spend per 1000 population 8. Asthma Secondary care admissions per 1000 population 9. Asthma Emergency admissions per 1000 population 10.Asthma Secondary care admissions per Asthma register 26
27 3. ANALYSIS Summary: Management in secondary care 19 / 50 indicators are in the bottom quintile of the benchmark group. Other Respiratory admissions (elective, non-elective) and spend 11.Other Respiratory Inpatient spend per 1000 population 12.Other Respiratory Secondary care admissions per 1000 population 13.Other Respiratory Inpatient admissions per 1000 population 14.Other Respiratory Emergency admissions per 1000 population 27
28 3. ANALYSIS Summary: Management in secondary care 19 / 50 indicators are in the bottom quintile of the benchmark group. Emergency admissions for upper and lower RT infections and for children with lower respiratory disease 15.Emergency admissions for children with lower respiratory disease 16.Upper Respiratory Infection All Ages Emergency Admissions DSR per 100, Upper Respiratory Infection <75 Emergency Admissions DSR per 100, Lower Respiratory Infection All Ages Emergency Admissions DSR per 100, Lower Respiratory Infection <75 Emergency Admissions DSR per 100,000 28
29 3. ANALYSIS Summary: Mortality 0 / 3 indicators are in the bottom quintile of the benchmark group: 29
30 Respiratory Prevalence 30
31 Respiratory Prevalence The analysis showed HMR CCG in the bottom quintile of cluster CCGs for estimates of COPD and asthma prevalence in the registered population, as well as adult (>15 years of age) smoking prevalence 31
32 Respiratory Prevalence Hypothesis: smoking prevalence Recorded smoking status in the registered population provides an estimate of the adult population smoking prevalence Smoking prevalence can be reduced by tobacco control which includes smoking cessation services The effectiveness of tobacco control and smoking cessation services can be evaluated using indicators such as smoking prevalence in the registered population Higher estimates of smoking prevalence suggests comparatively higher unmet need and an opportunity to offer smoking cessation interventions to more smokers Primary and secondary care services offer opportunities to reduce smoking prevalence, maximise the number of people who quit smoking thereby reducing smoking related morbidity and mortality 32
33 Respiratory Prevalence Smoking prevalence: Explanations to consider The relatively higher smoking prevalence in the HMR CCG registered population may reflect relative under-provision and/or lower uptake of smoking cessation services Alternative explanations include: Better recording of smoking status Subgroup(s) of the population with significantly higher smoking rates than would be expected from the known sociodemographic characteristics of the population High provision and uptake of smoking cessation services but issues concerning the wider programme of tobacco control Higher prevalence rate may be due to chance/random variation/usual cause variation no CIs or statistical tests have been performed 33
34 Respiratory prevalence Hypothesis: asthma prevalence o o o o o Asthma prevalence in the lower quintile of CCGs reflects higher asthma prevalence in the population To be on the asthma register, patients need a diagnosis of asthma and a prescription for an asthma drug within the year Higher prevalence may reflect CCG population more at risk eg LBW babies, maternal smoking and secondary exposure of tobacco smoke in children, environmental and occupational exposure to allergens Investment in programmes aiming to decrease the at risk population eg high quality tobacco control programmes and high quality smoking cessation services, may reduce population exposure to triggers and thereby reduce the number of asthma episodes managed by respiratory services in both primary and secondary care Higher asthma prevalence may therefore reflect the need to target action to further reduce the at risk population 34
35 Respiratory prevalence Other explanations to be considered Asthma is not preventable therefore estimates of asthma prevalence cannot be used to evaluate effectiveness of primary prevention interventions. Interventions are aimed at improving control of asthma and prevention of asthma attacks. Asthma is under-diagnosed due to a combination of patients not presenting and clinicians not diagnosing /misdiagnosing?higher prevalence rate may reflect better case ascertainment - desirable?higher prevalence rate may reflect more misdiagnosis and/or poorer quality assessment with spirometry - undesirable?higher prevalence rate may be due to chance/random variation/usual cause variation no CIs or statistical tests have been performed 35
36 Respiratory prevalence Hypothesis: COPD Prevalence Chronic obstructive pulmonary disease (COPD) is the name for a collection of lung diseases including chronic bronchitis, emphysema and chronic obstructive airways disease The main cause of COPD is smoking Estimated COPD prevalence in the registered population is a marker of historic smoking patterns, as the development of COPD is related to the level of tobacco exposure over time, usually years Higher prevalence of COPD reflects higher need for Primary prevention (tobacco control) and smoking cessation (to prevent disease progression) High quality health care services (primary and secondary care, pulmonary rehab) as defined by QOF and NICE 36
37 Respiratory Prevalence COPD Prevalence: Explanations to consider COPD is under-diagnosed due to a combination of patients not presenting and clinicians not diagnosing /misdiagnosing?higher prevalence rate may reflect better case ascertainment - desirable?higher prevalence rate may reflect more misdiagnosis and/or poorer quality assessment with spirometry - undesirable?higher prevalence rate may be due to chance/random variation/usual cause variation no CIs or statistical tests have been performed 37
38 Respiratory primary care 38
39 Respiratory primary care Analysis showed HMR CCG to be in the lower quintile of cluster CCGs for: 9 Prescribing indicators 1 QOF indicator - % with COPD who have had a review including assessment of breathlessness in last 15 months (COPD13) 39
40 Respiratory prescribing Prescribing: Hypothesis o Examination of the variation in prescribing costs and items prescribed can be useful in identifying potentially inappropriate prescribing o High prescribing costs may point to the need for better medicines optimisation and better medicines management both of which support better and more cost-effective prescribing in primary care o Optimisation of prescribing reduces hospital admissions and associated costs helps patients better manage their care with consequent improvement in health outcomes may reduce prescribing costs 40
41 Respiratory prescribing 9 indicators are in the bottom quintile of the benchmark group: Respiratory Cost prescribed per 1000 population Respiratory Items prescribed per 1000 population Inhaled Corticosteroids ADQ per STAR PU Cost COPD Cost prescribed per 1000 population COPD Items prescribed per 1000 population Asthma Cost prescribed per 1000 population Asthma Items prescribed per 1000 population Other Respiratory Cost prescribed per 1000 population Other Respiratory Items prescribed per 1000 population If the CCG had the same rate of spend on respiratory drugs as the cluster average, potential savings could reach 1.5m reduction in respiratory prescribing spend 41
42 Respiratory prescribing The bulk of the prescribing data covers the following classes of drugs, most of which are prescribed in primary care rather than secondary care: Bronchodilators Corticosteroids Cromoglicate and related therapy and leukotriene receptor antagonists Antihistamines, hyposensitisation, and allergic emergencies Respiratory stimulants and pulmonary surfactant Oxygen Mucolytics Aromatic inhalations Cough preparations Systemic nasal decongestants 42
43 Respiratory prescribing Explanations to consider: Prescribing may be appropriate and commensurate with need ie. high prevalence of asthma and COPD Prescribing is suboptimal and requires investigation An audit of drugs used in the management of asthma and COPD could help in the initial investigation of potentially inappropriate prescribing Heads of medicines management could lead medicine optimisation initiatives to improve healthcare utilisation, outcomes and reduce spend 43
44 Respiratory: Management of Asthma and COPD 44
45 Respiratory primary care services The analysis shows the CCG to be in the bottom quintile for one of the COPD QOF indicators - suggesting that a lower proportion of patients with COPD are recorded as benefiting from clinical review with assessment of breathlessness (every 15 months) 45
46 Defining high quality primary care in respiratory disease QOF indicators for smoking, COPD and Asthma NICE guidance and quality standards for COPD and Asthma 46
47 Smoking QOF standards o o o o Patients with LTCs should have their smoking status assessed and recorded in their notes within the preceding 15 months Patients with LTCs who smoke should be offered smoking cessation advice or referral to a specialist service, where available, within the preceding 15 months Patients aged 15 years and over should have their smoking status assessed and recorded in their notes within the preceding 27 months Patients aged 15 years and over who are recorded as current smokers should be offered support and treatment within the preceding 27 months 47
48 High quality COPD care QOF o o o o o The practice produces a register of patients with COPD Patients with COPD have a review, undertaken by a healthcare professional, including an assessment of breathlessness using the MRC dyspnoea score in the preceding 15 months Patients with COPD are assessed with spirometry and their FEV1 is recorded within the preceding 15 months. Patients with COPD have their diagnosis confirmed by post bronchodilator spirometry Patients with COPD have influenza immunisation in the preceding 1 September to 31 March 48
49 High quality asthma care QOF o o o o The practice can produce a register of patients with asthma, excluding patients with asthma who have been prescribed no asthma-related drugs in the preceding 12 months Patients aged 8 years and over diagnosed as having asthma have measures of variability or reversibility recorded Patients with asthma who have an asthma review within the preceding 15 months that includes an assessment of asthma control using the 3 RCP questions Patients with asthma between the ages of 14 and 19 years have their smoking status assessed and recorded within the preceding 15 months 49
50 Asthma quality standards NICE The elements of good care are specified in NICE guidance and quality standards. High quality asthma care has the following features: 1. People with newly diagnosed asthma are diagnosed in accordance with BTS/SIGN guidance 2. Adults with new onset asthma are assessed for occupational causes. 3. People with asthma receive a written personalised action plan 4. People with asthma are given specific training and assessment in inhaler technique before starting any new inhaler treatment 5. People with asthma receive a structured review at least annually 6. People with asthma who present with respiratory symptoms receive an assessment of their asthma control. 50
51 Asthma quality standards NICE 7. People with asthma who present with an exacerbation of their symptoms receive an objective measurement of severity at the time of presentation 8. People aged 5 years or older presenting to a healthcare professional with a severe or life-threatening acute exacerbation of asthma receive oral or intravenous steroids within 1 hour of presentation 9. People admitted to hospital with an acute exacerbation of asthma have a structured review by a member of a specialist respiratory team before discharge 10. People who received treatment in hospital or through out-of-hours services for an acute exacerbation of asthma are followed up by their own GP practice within 2 working days of treatment 11. People with difficult asthma are offered an assessment by a multidisciplinary difficult asthma service 51
52 COPD quality standards NICE The elements of good care are specified in NICE guidance and quality standards. High quality COPD care has the following features: 1.People with COPD have one or more indicative symptoms recorded, and have the diagnosis confirmed by post-bronchodilator spirometry carried out on calibrated equipment by healthcare professionals competent in its performance and interpretation. 2.People with COPD have a current individualised comprehensive management plan, which includes high-quality information and educational material about the condition and its management, relevant to the stage of disease. 3.People with COPD are offered inhaled and oral therapies, in accordance with NICE guidance, as part of an individualised comprehensive management plan. 4.People with COPD have a comprehensive clinical and psychosocial assessment, at least once a year or more frequently if indicated, which includes degree of breathlessness, frequency of exacerbations, validated measures of health status and prognosis, presence of hypoxaemia and comorbidities. 52
53 COPD quality standards NICE 5.People with COPD who smoke are regularly encouraged to stop and are offered the full range of evidence-based smoking cessation support. 6.People with COPD meeting appropriate criteria are offered an effective, timely and accessible multidisciplinary pulmonary rehabilitation programme. 7.People who have had an exacerbation of COPD are provided with individualised written advice on early recognition of future exacerbations, management strategies (including appropriate provision of antibiotics and corticosteroids for self-treatment at home) and a named contact. 8.People with COPD potentially requiring long-term oxygen therapy are assessed in accordance with NICE guidance by a specialist oxygen service. 53
54 COPD quality standards NICE 9.People with COPD receiving long-term oxygen therapy are reviewed in accordance with NICE guidance, at least annually, by a specialist oxygen service as part of the integrated clinical management of their COPD. 10.People admitted to hospital with an exacerbation of COPD are cared for by a respiratory team, and have access to a specialist early supported-discharge scheme with appropriate community support. 11.People admitted to hospital with an exacerbation of COPD and with persistent acidotic ventilatory failure are promptly assessed for, and receive, non-invasive ventilation delivered by appropriately trained staff in a dedicated setting. 12.People admitted to hospital with an exacerbation of COPD are reviewed within 2 weeks of discharge. 13.People with advanced COPD, and their carers, are identified and offered palliative care that addresses physical, social and emotional needs. 54
55 Respiratory primary care Explanations to be considered: Is the annual assessment of COPD patients systematic in the assessment of breathlessness using the MRC dyspnoea score? 55
56 Respiratory Secondary Care 56
57 Respiratory secondary care Hypothesis: o o o Asthma and COPD are ambulatory care sensitive conditions Ambulatory care sensitive (ACS) conditions are chronic conditions for which it is possible to prevent acute exacerbations and reduce the need for hospital admission through active management, such as vaccination; better self-management, disease management or case management; or lifestyle interventions Most asthma and COPD is managed in primary care but effective control requires multidisciplinary teams working across both primary and secondary care 57
58 Respiratory secondary care Hypothesis o o o o Despite hospital admission for asthma and COPD being largely preventable, a significant proportion of all acute hospital activity is related to asthma and COPD. Variation in admission rates is likely to reflect variation in how effectively asthma and COPD are managed particularly in primary care Admissions for respiratory tract infections such as influenza and pneumonia are also preventable through effective vaccination in at risk subgroups of the population and high quality primary care management of RTIs These avoidable admissions are costly and offer the opportunity for significant financial savings 58
59 Respiratory secondary care Evidence based interventions for reducing spend and improving outcomes in ACS conditions: Purdy S (2010). Avoiding Hospital Admissions. What does the research evidence say? London: The King s Fund. NICE clinical guideline and Quality standards for COPD British Thoracic Society and Scottish Intercollegiate Guidelines Network clinical guideline 101 (2008, updated 2011) and NICE Quality standards for asthma 59
60 Respiratory secondary care Indicators are in the bottom quintile of the benchmark group include those for: Hospital admissions (all, emergency) for all respiratory conditions including ambulatory care sensitive conditions asthma and respiratory tract infections (including influenza and pneumonia) Respiratory spend (all, emergency) 60
61 Respiratory secondary care o o The analysis suggests that there is scope for improving the management of ambulatory care sensitive conditions thereby reducing avoidable admissions and spend If HMR CCG reduced its hospital admission rates (all, emergency) and spend for respiratory disease to that of the cluster average, then potential savings 564K reduction in respiratory spend across secondary care 159K reduction in asthma spend across secondary care 314k reduction in other respiratory emergency spend 1115 fewer emergency admissions for upper respiratory infections and 649 fewer emergency admissions for lower respiratory infections 61
62 3. ANALYSIS Summary: Mortality 0 / 3 indicators are in the bottom quintile of the benchmark group: 62
63 4. Where to focus: Understanding practice variation Practices are compared using a benchmark cluster group of the most similar practices in terms of age, ethnicity, deprivation and population density. The practice cluster group definitions and constituent practices are in Annex 3. Practices are compared for all the indicators where data is available at practice level This information is presented here to form the basis of a discussion between the CCG, the CSU and Public Health about how further analysis could support practices in reducing unexplained practice variation The number of indicators where the practice is in the bottom quintile for the practice cluster has been compared on the next slide and the opportunities for the practices with the highest number of indicators in the bottom quintile has been quantified on the subsequent slide Practices will have less influence on management in secondary care than they do on management in primary care and this should be taken into account in the way CCGs interpret the information on practice variation 63
64 4. Where to focus: Understanding practice variation Number of Respiratory indicators in the bottom quintile of the practice cluster The chart on the following slide shows the number of Respiratory indicators in the bottom quintile of the practice cluster. Each coloured bar represents a different set of indicators e.g. dark blue is prevalence. The specific indicators are then shown in the table on slides for the 3 practices with the highest total number of indicators in the bottom quintile Note, some of the data are based on small numbers. Statistical significance has not been tested and should not be inferred. The data are presented to identify potential areas of improvements rather than providing a definitive comparison of performance. 64
65 4. Where Dr HB Syed (P86609) to focus: Understanding 18 practice variation 9 Baillie Street Health Ctr (P86619) York House Surgery (P86605) Littleborough Group Practice Windermere Surgery (P86620) Trinity Medical Centre (P86624) Edenfield Road Surgery (P86003) Hopwood Medical Centre (P86023) Inspire Medical Centre (P86017) Wellfield Health Centre (P86007) Rochdale Road Medical Centre Stonefield Street Surgery (P86022) Vicars Drive Surgery (P86002) Mark Street Surgery (P86008) Family Practice (P86606) The Village Medical Ctr. (P86608) Woodside Medical Centre Durnford Medical Centre (P86019) Tweedale Street Surgery (P86614) Longford Street Medical Centre Ashworth Street Surgery (P86006) Castleton Health Centre (P86009) Argyle Street Medical Ctr (P86016) Pennine Surgery (P86021) Dr IK Babar (P86014) Peterloo Medical Centre (P86004) Healey Surgery (P86013) The Dawes Family Practice Drake Street Surgery (P86622) Yorkshire St Surgery (P86005) The Junction Surgery (P86010) Heady Hill Surgery (P86602) Milnrow Village Practice (P86001) Each coloured bar represents a different set of indicators e.g. dark blue is prevalence. The specific indicators are then shown in the table on slides for the 3 practices with the highest total number of indicators in the bottom quintile Prevalence (4 indicators) Management in Primary Care (33 indicators) Respiratory Spend and Admissions (16 indicators) COPD Spend and Admissions (8 indicators) Asthma Spend and Admissions (7 indicators) Other Respiratory Spend and Admissions (19 indicators) 65
66 4. Where to focus: Understanding practice variation The table shows the 3 GP practices with the highest total number of respiratory indicators in the bottom quintile of the practice cluster group, as depicted on the previous slide. Opportunities for the practice to reach the cluster group average are shown against all of the indicators where applicable, and those highlighted in red are in the bottom quintile. Quantification does not mean that the saving or improvement can actually be made, but may however answer the question Is it going to be worth focussing on this area? Pathway step Indicator Baillie Street Health Ctr (P86619) *40 indicators in bottom quintile of practice cluster Dr HB Syed (P86609) *39 indicators in bottom quintile of practice cluster York House Surgery (P86605) *36 indicators in bottom quintile of practice cluster Prevalence Percentage of patients registered with a GP aged 15+ recorded as current smoker no opportunities no opportunities 352 fewer smokers QOF COPD prevalence no opportunities 4 fewer COPD cases 7 fewer COPD cases Ratio of reported to expected COPD prevalence 6 extra patients to be diagnosed 3 extra patients to be diagnosed no opportunities QOF Asthma prevalence 47 fewer asthma cases no opportunities no opportunities 'Opportunities are shown as Fewer when, to reach the benchmark average, would represent X fewer smokers/admissions/deaths'. Opportunities are shown as Extra/More Managed when, to reach the benchmark average would represent X additional patients managed 66
67 4. Where to focus: Understanding practice variation Pathway step Indicator Baillie Street Health Ctr (P86619) *40 indicators in bottom quintile of practice cluster Dr HB Syed (P86609) *39 indicators in bottom quintile of practice cluster York House Surgery (P86605) *36 indicators in bottom quintile of practice cluster Management in Primary Care Respiratory Secondary care cost prescribed per 1000 population 12,376 reduction 515 reduction no opportunities Respiratory Secondary care items prescribed per 1000 population 5546 fewer items prescribed 486 fewer items prescribed 703 fewer items prescribed Inhaled Corticosteroids per STAR PU Cost no opportunities no opportunities 2,665 reduction Inhaled Corticosteroids per STAR PU Items Prescribed no opportunities no opportunities 2665 fewer items prescribed Inhaled Corticosteroids Average Cost per ADQ 6,025 reduction 792 reduction no opportunities COPD Secondary care cost prescribed per 1000 population 2,349 reduction no opportunities 270 reduction COPD Secondary care items prescribed per 1000 population no opportunities no opportunities 238 fewer items prescribed Asthma Secondary care cost prescribed per 1000 population no opportunities 842 reduction no opportunities Asthma Secondary care items prescribed per 1000 population 277 fewer items prescribed 9 fewer items prescribed 238 fewer items prescribed Other Respiratory Secondary care cost prescribed per 1000 population 10,814 reduction 1,390 reduction no opportunities Other Respiratory Secondary care items prescribed per 1000 population 5360 fewer items prescribed 486 fewer items prescribed 227 fewer items prescribed % with COPD who have had influenza immunisation in last year (COPD8) no opportunities 2 additional patients managed no opportunities % with COPD who have had influenza immunisation in last year plus exceptions (COPD8) 1 additional patient managed no opportunities no opportunities % with COPD with a record of FeV1 in the last 15 months (COPD10) no opportunities 3 additional patients managed 9 additional patients managed % with COPD with a record of FeV1 in the last 15 months plus exceptions (COPD10) no opportunities 1 additional patient managed 7 additional patients managed % with COPD who have had a review including assessment of breathlessness in last 15 months (COPD13) no opportunities 4 additional patients managed 5 additional patients managed % with COPD who have had a review including assessment of breathlessness in last 15 months plus exceptions (COPD13) no opportunities 2 additional patients managed 6 additional patients managed % with asthma aged with record of smoking status in last 15 months (Asthma10) 2 additional patients recorded no opportunities no opportunities % with asthma aged with record of smoking status in last 15 months plus exceptions (Asthma10) 2 additional patients recorded no opportunities no opportunities % with asthma with review in last 15 months (Asthma9) no opportunities 2 additional patients managed 9 additional patients managed % with asthma with review in last 15 months plus exceptions (Asthma9) no opportunities no opportunities 8 additional patients managed % aged 8+ with measures of variability or reversibility (Asthma8) no opportunities 12 additional patients managed 3 additional patients managed % aged 8+ with measures of variability or reversibility plus exceptions (Asthma8) 17 additional patients managed 11 additional patients managed 3 additional patients managed Patients with a LTC with record of smoking status (Smoke05) 13 additional patients recorded 19 additional patients recorded no opportunities Patients with a LTC with record of smoking status plus exceptions (Smoke05) 16 additional patients recorded 14 additional patients recorded no opportunities Patients with a LTC who smoke with a record of offer of support and treatment (Smoke06) no opportunities 7 additional patients managed 13 additional patients managed Patients with a LTC who smoke with a record of offer of support and treatment plus exceptions (Smoke06) no opportunities 7 additional patients managed 15 additional patients managed Patients aged 15+ with a record of smoking status in last 27 months (Smoke07) 50 additional patients recorded 564 additional patients recorded no opportunities Patients aged 15+ with a record of smoking status in last 27 months plus exceptions (Smoke07) 27 additional patients recorded 583 additional patients recorded no opportunities Patients aged 15+ recorded as a current smoker with offer of support and treatment in last 27 months (Smoke08) no opportunities 62 additional patients managed no opportunities Patients aged 15+ recorded as a current smoker with offer of support and treatment in last 27 months plus exceptions (Smok no opportunities 62 additional patients managed no opportunities Seasonal flu vaccine uptake, age 6 months to 64 years 201 more vaccinated 21 more vaccinated no opportunities Seasonal flu vaccine uptake, age 65+ years no opportunities 13 more vaccinated no opportunities 'Opportunities are shown as Fewer when, to reach the benchmark average, would represent X fewer cases/admissions/deaths'. Opportunities are shown as Extra/More Managed when, to reach the benchmark average would represent X additional patients managed 67
68 4. Where to focus: Understanding practice variation Pathway step Indicator Baillie Street Health Ctr (P86619) *40 indicators in bottom quintile of practice cluster Dr HB Syed (P86609) *39 indicators in bottom quintile of practice cluster York House Surgery (P86605) *36 indicators in bottom quintile of practice cluster Respiratory Spend and Admissions Respiratory Secondary care spend per 1000 population 108,762 reduction 25,607 reduction 60,025 reduction Respiratory Inpatient spend per 1000 population 31,906 reduction 14,142 reduction 293 reduction Respiratory Daycase spend per 1000 population 3,283 reduction 4,359 reduction 20,395 reduction Respiratory Emergency spend per 1000 population 76,510 reduction 8,369 reduction 41,811 reduction Respiratory Secondary care admissions per 1000 population 96 fewer admissions 17 fewer admissions 61 fewer admissions Respiratory Inpatient admissions per 1000 population 15 fewer admissions 3 fewer admissions 2 fewer admissions Respiratory Daycase admissions per 1000 population 5 fewer admissions 1 fewer admission 16 fewer admissions Respiratory Emergency admissions per 1000 population 76 fewer admissions 13 fewer admissions 43 fewer admissions Respiratory Secondary care spend per admission no opportunities no opportunities no opportunities Respiratory Inpatient spend per admission 452 reduction 1,434.1 reduction no opportunities Respiratory Emergency spend per admission no opportunities no opportunities no opportunities Respiratory Secondary care admissions Mean LOS no opportunities no opportunities no opportunities Respiratory Inpatient admissions Mean LOS 13 fewer bed days 8 fewer bed days no opportunities Respiratory Emergency admissions Mean LOS no opportunities no opportunities no opportunities Under 75 years Elective Respiratory Admissions DSR per 100, fewer admissions 8 fewer admissions 36 fewer admissions Under 75 years Emergency Respiratory Admissions DSR per 100, fewer admissions 17 fewer admissions 74 fewer admissions 68
69 4. Where to focus: Understanding practice variation Pathway step Indicator Clay Cross Medical Centre (C81056) *54 indicators in bottom quintile of practice cluster Blue Dykes Surgery (C81008) *50 indicators in bottom quintile of practice cluster St Lawrence Road Surgery (C81647) *39 indicators in bottom quintile of practice cluster COPD Spend and Admissions Asthma Spend and Admissions COPD Secondary care spend per 1000 population 12,113 reduction no opportunities 4,920 reduction COPD Emergency spend per 1000 population 3,535 reduction no opportunities 5,575 reduction COPD Secondary care admissions per 1000 population 8 fewer admissions no opportunities 10 fewer admissions COPD Emergency admissions per 1000 population 3 fewer admissions no opportunities 10 fewer admissions COPD Secondary care admissions per COPD register 13 fewer admissions 2 fewer admissions 19 fewer admissions COPD Secondary care admissions Mean LOS no opportunities no opportunities no opportunities COPD Emergency admissions Mean LOS no opportunities no opportunities no opportunities Under 75 years Emergency COPD Admissions DSR per 100, fewer admissions no opportunities 22 fewer admissions Asthma Secondary care spend per 1000 population 18,916 reduction 2,989 reduction 38,839 reduction Asthma Emergency spend per 1000 population 19,626 reduction 3,295 reduction 14,230 reduction Asthma Secondary care admissions per 1000 population 16 fewer admissions 4 fewer admissions 34 fewer admissions Asthma Emergency admissions per 1000 population 19 fewer admissions 4 fewer admissions 10 fewer admissions Asthma Emergency admissions per Asthma register 32 fewer admissions 10 fewer admissions 38 fewer admissions Asthma Secondary care admissions Mean LOS no opportunities no opportunities 13 fewer bed days Asthma Emergency admissions Mean LOS no opportunities no opportunities 19 fewer bed days 69
70 4. Where to focus: Understanding practice variation Pathway step Indicator Clay Cross Medical Centre (C81056) *54 indicators in bottom quintile of practice cluster Blue Dykes Surgery (C81008) *50 indicators in bottom quintile of practice cluster St Lawrence Road Surgery (C81647) *39 indicators in bottom quintile of practice cluster Other Respiratory Spend and Admissions Other Respiratory Secondary care spend per 1000 population 76,682 reduction 22,997 reduction 16,666 reduction Other Respiratory Inpatient spend per 1000 population 24,805 reduction 14,194 reduction no opportunities Other Respiratory Daycase spend per 1000 population 2,191 reduction 4,615 reduction no opportunities Other Respiratory Emergency spend per 1000 population 52,170 reduction 5,273 reduction 22,314 reduction Other Respiratory Secondary care admissions per 1000 population 69 fewer admissions 13 fewer admissions 20 fewer admissions Other Respiratory Inpatient admissions per 1000 population 14 fewer admissions 3 fewer admissions 1 fewer admission Other Respiratory Daycase admissions per 1000 population 2 fewer admissions 2 fewer admissions no opportunities Other Respiratory Emergency admissions per 1000 population 36 fewer admissions 2 fewer admissions 10 fewer admissions Other Respiratory Secondary care admissions Mean LOS no opportunities no opportunities no opportunities Other Respiratory Inpatient admissions Mean LOS 10 fewer bed days 9 fewer bed days no opportunities Other Respiratory Emergency admissions Mean LOS no opportunities no opportunities no opportunities Pneumonia All Ages Emergency Admissions DSR per 100,000 no opportunities no opportunities 13 fewer admissions Pneumonia <75 Emergency Admissions DSR per 100,000 2 fewer admissions no opportunities 11 fewer admissions Pneumonia 75+ Emergency Admissions DSR per 100,000 no opportunities no opportunities 2 fewer admissions Flu All Ages Emergency Admissions DSR per 100,000 no opportunities no opportunities no opportunities Upper Respiratory Infection All Ages Emergency Admissions DSR per 100, fewer admissions 4 fewer admissions 15 fewer admissions Upper Respiratory Infection <75 Emergency Admissions DSR per 100, fewer admissions 4 fewer admissions 15 fewer admissions Lower Respiratory Infection All Ages Emergency Admissions DSR per 100, fewer admissions 3 fewer admissions 13 fewer admissions Lower Respiratory Infection <75 Emergency Admissions DSR per 100, fewer admissions 5 fewer admissions 12 fewer admissions 70
71 5. Bringing it all together Where to focus, what could work, who should we speak to CCGs should consider what local intelligence is available to further triangulate with the intelligence in this pack. This may include: Practice variation analyses Reviewing referral protocols and guidelines Analysis from Acute Trust quality dashboard or other provider data Contract monitoring data Next step is to move from intelligence to action CCG needs to identify from the summary slides where to focus and what could work and which CCG may be an exemplar to follow There are also many resources available on to take forwards the improvement agenda. 71
72 5. National Guidance British Lung Foundation (2007) Invisible lives: chronic obstructive pulmonary disease (COPD) finding the missing millions. Department of Health (2010) Consultation on a strategy for services for chronic obstructive pulmonary disease (COPD) in England impact assessment. London: Department of Health Healthcare Commission (2006) Clearing the air: a national study of chronic obstructive pulmonary disease. London: Healthcare Commission. NICE (2010) Chronic obstructive pulmonary disease: management of chronic obstructive pulmonary disease in adults in primary and secondary care (partial update). NICE clinical guideline 101. London: National Institute for Health and Clinical Excellence. Available from 72
73 5. National Guidance The Kings fund 2010 : Avoiding Hospital Admissions Chronic obstructive pulmonary disease: management of chronic obstructive pulmonary disease in adults in primary and secondary care. NICE clinical guideline 12 (2004). [Replaced by NICE clinical guideline 101] British Guideline on the Management of Asthma: SIGN101, ISBN , May 2008, Revised May 2011, Section revised Sept 2011, Section 1 revised Jan
74 Annexes Annex 1 Spine charts and opportunity tables Annex 2 CCG Cluster Classification Annex 3 Practice Cluster Classification Annex 4 Indicator List Glossary 74
75 Annex 1: Spine Charts Prevalence / Diagnosis Percentage of patients registered with a GP aged 15+ recorded as current smoker QOF COPD prevalence Ratio of reported to expected COPD prevalence % COPD diagnosis confirmed by post bronchodilator spirometry % COPD diagnosis confirmed by post bronchodilator spirometry plus exceptions QOF Asthma prevalence Worse Outcome Better Outcome Opportunities Benchmark average Benchmark Top Quintile 6096 fewer smokers fewer smokers 1439 fewer COPD cases 2740 fewer COPD cases 249 extra patients to be diagnosed 14 additional patients managed 2518 fewer asthma cases 4230 fewer asthma cases 75
76 Annex 1: Spine Charts Primary Care Opportunities Worse outcome Better outcome Benchmark average Benchmark Top Quintile Respiratory Cost prescribed per 1000 population Respiratory Items prescribed per 1000 population Inhaled Corticosteroids ADQ per STAR PU Cost Inhaled Corticosteroids ADQ per STAR PU Items Prescribed COPD Cost prescribed per 1000 population COPD Items prescribed per 1000 population % with COPD who have had influenza immunisation % with COPD who have had influenza immunisation plus exceptions % with COPD with a record of FeV1 % with COPD with a record of FeV1 plus exceptions % with COPD who have had a review % with COPD who have had a review plus exceptions Total COPD Exceptions Asthma Cost prescribed per 1000 population Asthma Items prescribed per 1000 population % with asthma aged with record of smoking status % with asthma aged with record of smoking status plus exceptions % with asthma with review in last 15 months % with asthma with review in last 15 months plus exceptions % aged 8+ with measures of variability or reversibility % aged 8+ with measures of variability or reversibility plus exceptions Total Asthma Exceptions Other Respiratory Cost prescribed per 1000 population Other Respiratory Items prescribed per 1000 population reduction reduction fewer items prescribed fewer items prescribed reduction reduction fewer items prescribed fewer items prescribed reduction reduction fewer items prescribed fewer items prescribed 36 additional patients managed 86 additional patients managed 46 additional patients managed 147 additional patients managed 109 additional patients managed 101 additional patients managed 167 additional patients managed 86 additional patients managed reduction reduction fewer items prescribed fewer items prescribed 7 additional patients recorded 3 additional patients recorded 26 additional patients recorded 171 additional patients managed 247 additional patients managed 43 additional patients managed 92 additional patients managed 71 additional patients managed 140 additional patients managed 101 fewer exceptions 586 fewer exceptions reduction reduction fewer items prescribed fewer items prescribed
77 Annex 1: Spine Charts Primary Care Worse outcome Better outcome Benchmark average Opportunities Benchmark Top Quintile Patients with a LTC with record of smoking status Patients with a LTC with record of smoking status plus exceptions Patients with a LTC who smoke with a record of offer of support and treatment Patients with a LTC who smoke with a record of offer of support and treatment plus exceptions Patients aged 15+ with a record of smoking status Patients aged 15+ with a record of smoking status plus exceptions Patients aged 15+ recorded as a current smoker with offer of support and treatment Patients aged 15+ recorded as a current smoker with offer of support and treatment plus Total Smoking Exceptions Seasonal flu vaccine uptake, age 6 months to 64 years Seasonal flu vaccine uptake, age65+ years additional patients recorded 272 additional patients recorded 45 additional patients managed 98 additional patients managed 969 additional patients recorded 1020 additional patients recorded 439 additional patients managed 358 additional patients managed 100 fewer exceptions 77
78 Annex 1: Spine Charts Secondary Care Worse outcome / Higher spend Better outcome / Lower spend Benchmark average Opportunities Benchmark Top Quintile Respiratory Secondary care spend per 1000 population Respiratory Inpatient spend per 1000 population Respiratory Daycase spend per 1000 population Respiratory Emergency spend per 1000 population Respiratory Secondary care admissions per 1000 population Respiratory Inpatient admissions per 1000 population Respiratory Daycase admissions per 1000 population Respiratory Emergency admissions per 1000 population Respiratory Secondary care spend per admission Respiratory Inpatient spend per admission Respiratory Daycase spend per admission Respiratory Emergency spend per admission Respiratory Secondary admissions Mean LOS Respiratory Inpatient admissions Mean LOS Respiratory Emergency admissions Mean LOS Under 75 years Elective Respiratory Admissions DSR per 100,000 Under 75 years Emergency Respiratory Admissions DSR per 100, reduction reduction reduction reduction reduction reduction reduction 1410 fewer admissions 1958 fewer admissions 121 fewer admissions 227 fewer admissions 63 fewer admissions 1352 fewer admissions 1993 fewer admissions 111 reduction 130 fewer bed days 258 fewer bed days 140 fewer admissions 351 fewer admissions 2387 fewer admissions 3645 fewer admissions 78
79 Annex 1: Spine Charts Secondary Care Worse outcome / Higher spend Better outcome / Low er spend Benchmark average Opportunities Benchmark Top Quintile COPD Secondary care spend per 1000 population COPD Emergency spend per 1000 population COPD Secondary care admissions per 1000 population COPD Emergency admissions per 1000 population COPD Secondary care admissions per COPD register COPD Secondary care admissions Mean LOS COPD Emergency admissions Mean LOS Under 75 years Emergency COPD Admissions DSR per 100, reduction reduction reduction reduction 172 fewer admissions 335 fewer admissions 174 fewer admissions 333 fewer admissions 49 fewer admissions 149 fewer admissions 226 fewer admissions 430 fewer admissions Worse outcome / Higher spend Better outcome / Low er spend Benchmark average Opportunities Benchmark Top Quintile Asthma Secondary care spend per 1000 population Asthma Emergency spend per 1000 population Asthma Secondary care admissions per 1000 population Asthma Emergency admissions per 1000 population Asthma Secondary care admissions per Asthma register Asthma Secondary care admissions Mean LOS Asthma Emergency admissions Mean LOS reduction reduction reduction reduction 206 fewer admissions 295 fewer admissions 170 fewer admissions 258 fewer admissions 145 fewer admissions 222 fewer admissions 79
80 Annex 1: Spine Charts Secondary Care Worse outcome / Higher spend Better outcome / Lower spend Opportunities Benchmark average Benchmark Top Quintile Other Respiratory Secondary care spend per 1000 population Other Respiratory Inpatient spend per 1000 population Other Respiratory Emergency spend per 1000 population Other Respiratory Secondary care admissions per 1000 population Other Respiratory Inpatient admissions per 1000 population Other Respiratory Emergency admissions per 1000 population Other Respiratory Secondary care admissions Mean LOS Other Respiratory Inpatient admissions Mean LOS Other Respiratory Emergency admissions Mean LOS Emergency admissions for children with lower respiratory disease Pneumonia All Ages Emergency Admissions DSR per 100,000 Pneumonia <75 Emergency Admissions DSR per 100,000 Pneumonia 75+ Emergency Admissions DSR per 100,000 Flu All Ages Emergency Admissions DSR per 100,000 Upper Respiratory Infection All Ages Emergency Admissions DSR per 100,000 Upper Respiratory Infection <75 Emergency Admissions DSR per 100,000 Lower Respiratory Infection All Ages Emergency Admissions DSR per 100,000 Lower Respiratory Infection <75 Emergency Admissions DSR per 100, reduction reduction reduction reduction reduction reduction 1022 fewer admissions 1533 fewer admissions 112 fewer admissions 212 fewer admissions 1002 fewer admissions 1522 fewer admissions 118 fewer bed days 244 fewer bed days 144 fewer admissions 221 fewer admissions 46 fewer admissions 206 fewer admissions 45 fewer admissions 166 fewer admissions 86 fewer admissions 10 fewer admissions 1115 fewer admissions 1564 fewer admissions 1086 fewer admissions 1522 fewer admissions 649 fewer admissions 943 fewer admissions 612 fewer admissions 875 fewer admissions Mortality Worse outcome Better outcome Benchmark average Opportunities Benchmark Top Quintile Under 75 Respiratory Mortality DSR per 100,000 Mortality from asthma DSR per 100,000 Under 75 Mortality from bronchitis and emphysema and COPD DSR per 100, fewer deaths 30 fewer deaths 2 fewer deaths 4 fewer deaths 21 fewer deaths 49 fewer deaths 80
81 Annex 2: CCG cluster classification The CCG Cluster groups are taken from YHPHO methodology, which groups together CCGs with similar populations. It is based on statistical cluster analysis (K-means analysis) including variables of age structure of the population, the population from Black and Asian ethnic groups, population density and deprivation. Cluster Classification Group Purple Blue Green Yellow Orange 0-19 years years years years 80+ years Population from Black ethnic groups Population from Asian ethnic groups Population density (persons per hectare) Average IMD 2010 score An older population living in rural areas and low deprivation levels 22.3% 22.0% 27.8% 21.9% 6.0% 0.5% 1.9% A very young population with a high proprtion of the population from Black and Asian ethnic groups and high levels of deprivation. A younger population with a high proportion of the population from Black and Asian ethnic groups and moderate levels of deprivation. A younger population with a higher than average proportion of the population from Black and Asian ethnic groups and moderate levels of deprivation. A population with an average age structure, average deprivation levels and a low population density. 26.4% 41.1% 21.3% 9.0% 2.1% 16.2% 31.6% % 42.0% 23.5% 10.4% 2.5% 16.7% 10.3% % 31.6% 24.5% 14.1% 3.7% 6.7% 17.7% % 25.3% 27.9% 18.2% 4.5% 1.5% 4.6%
82 Annex 2: CCG cluster classification Heywood, Middleton & Rochdale CCG is in the Yellow Cluster Group. The constituent CCG s are listed below. Code CCG Name Code CCG Name 00G NHS Newcastle North and East CCG 06P NHS Luton CCG 00H NHS Newcastle West CCG 07L NHS Barking and Dagenham CCG 00Q NHS Blackburn with Darwen CCG 07M NHS Barnet CCG 00Y NHS Oldham CCG 07V NHS Croydon CCG 01D NHS Heywood, Middleton and Rochdale CCG 07W NHS Ealing CCG 01G NHS Salford CCG 07X NHS Enfield CCG 01M NHS North Manchester CCG 07Y NHS Hounslow CCG 01N NHS South Manchester CCG 08A NHS Greenwich CCG 02R NHS Bradford Districts CCG 08E NHS Harrow CCG 03C NHS Leeds West CCG 08G NHS Hillingdon CCG 03F NHS Hull CCG 08J NHS Kingston CCG 03G NHS Leeds South and East CCG 08N NHS Redbridge CCG 03J NHS North Kirklees CCG 08R NHS Merton CCG 03N NHS Sheffield CCG 09H NHS Crawley CCG 04C NHS Leicester City CCG 10R NHS Portsmouth CCG 04F NHS Milton Keynes CCG 10T NHS Slough CCG 04K NHS Nottingham City CCG 10W NHS South Reading CCG 04X NHS Birmingham South and Central CCG 10X NHS Southampton CCG 05A NHS Coventry and Rugby CCG 11H NHS Bristol CCG 05L NHS Sandwell and West Birmingham CCG 13P NHS Birmingham Crosscity CCG 05Y NHS Walsall CCG 99A NHS Liverpool CCG 06A NHS Wolverhampton CCG 82
 including variables of age structure of the population, the population from Black and Asian ethnic groups, rural classification and")
83 Annex 3: Practice cluster classification The practice cluster groups are taken from YHPHO methodology, which groups together practices with similar populations. It is based on statistical cluster analysis (K-means analysis) including variables of age structure of the population, the population from Black and Asian ethnic groups, rural classification and deprivation. A total of 8074 GP practices were grouped into ten classification groups. A small number of practices (354 covering 1.1% of the population) did not have sufficient data to allocate them to a classification group 83
Commissioning for Value Focus Pack. CCG: Heywood, Middleton & Rochdale Focus Area : Mental Health Programme Budget Category
 Commissioning for Value Focus Pack CCG: Heywood, Middleton & Rochdale Focus Area : Mental Health Programme Budget Category What is a Deep Dive pack? CCGs have received a bespoke Commissioning for Value
Commissioning for value focus pack
 Commissioning for value focus pack Clinical commissioning group: NHS MILTON KEYNES CCG Focus area: Cardiovascular disease (CVD) pathway Version 2 June 2014 Contents 1. Background and context About the
Commissioning for Better Outcomes in COPD
 Commissioning for Better Outcomes in COPD Dr Matt Kearney Primary Care & Public Health Advisor Respiratory Programme, Department of Health General Practitioner, Runcorn November 2011 What are the Commissioning
Yorkshire & Humber Respiratory Programme Report
 2013 NHS Harrogate & Rural District Clinical Commissioning Group Yorkshire & Humber Respiratory Programme Report This report has been produced by the Yorkshire & Humber Respiratory Team. It highlights
HEALTH NEEDS ASSESSMENT: DISEASES OF THE RESPIRATORY SYSTEM. A report assessing the respiratory health need of the population of Bolton
 EXECUTIVE SUMMARY HEALTH NEEDS ASSESSMENT: DISEASES OF THE RESPIRATORY SYSTEM January 2009 A report assessing the respiratory health need of the population of Bolton AUTHOR Mark Cook Public Health Intelligence
Yorkshire & Humber Respiratory Programme Report
 2013 NHS Doncaster Clinical Commissioning Group Yorkshire & Humber Respiratory Programme Report This report has been produced by the Yorkshire & Humber Respiratory Team. It highlights opportunities that
Yorkshire & Humber Respiratory Programme Report
 2013 NHS Bassetlaw Clinical Commissioning Group Yorkshire & Humber Respiratory Programme Report This report has been produced by the Yorkshire & Humber Respiratory Team. It highlights opportunities that
Hull and East Riding. Chronic Obstructive Pulmonary. Disease (COPD) Equity Audit
 Equity Audit") Hull and East Riding Chronic Obstructive Pulmonary Disease (COPD) Equity Audit December 2010 Robert Sheikh Iddenden, Andrew Taylor, Jenny Walker Hull and East Riding Chronic Obstructive Pulmonary Disease
Hull and East Riding Chronic Obstructive Pulmonary Disease (COPD) Equity Audit December 2010 Robert Sheikh Iddenden, Andrew Taylor, Jenny Walker Hull and East Riding Chronic Obstructive Pulmonary Disease
National COPD Audit Programme
 National COPD Audit Programme Planning for every breath National Chronic Obstructive Pulmonary Disease (COPD) Audit Programme: Primary care audit () 2015 17 Data analysis and methodology Section 4: Providing
Chronic obstructive pulmonary disease
 0 Chronic obstructive pulmonary disease Implementing NICE guidance June 2010 NICE clinical guideline 101 What this presentation covers Background Scope Key priorities for implementation Discussion Find
An Outcomes Strategy for COPD and Asthma: NHS Companion Document IMPACT REPORT
 An Outcomes Strategy for COPD and Asthma: NHS Companion Document IMPACT REPORT 1 DH INFORMATION READER BOX Policy Clinical Estates HR / Workforce Commissioner Development IM & T Management Provider Development
NATIONAL INSTITUTE FOR HEALTH AND CLINICAL EXCELLENCE SCOPE
 NATIONAL INSTITUTE FOR HEALTH AND CLINICAL EXCELLENCE 1 Guideline title SCOPE Chronic obstructive pulmonary disease: the management of adults with chronic obstructive pulmonary disease in primary and secondary
Yorkshire & Humber Respiratory Programme Report. NHS Hambleton, Richmondshire and Whitby Clinical Commissioning Group
 2013 NHS Hambleton, Richmondshire and Whitby Clinical Commissioning Group Yorkshire & Humber Respiratory Programme Report This report has been produced by the Yorkshire & Humber Respiratory Team. It highlights
Registered childcare providers and places in England, 30 September October 2004
 Registered childcare providers and places in England, 30 September 2004. 21 October 2004 Contents: Childcare statistics About this publication Registered childcare providers and places in England, by Ofsted
QOF indicator area: Chronic Obstructive Pulmonary disease (COPD)
") NATIONAL INSTITUTE FOR HEALTH AND CLINICAL EXCELLENCE QUALITY AND OUTCOMES FRAMEWORK (QOF) INDICATOR DEVELOPMENT PROGRAMME Cost impact statement: Chronic Obstructive Pulmonary Disease QOF indicator area:
NATIONAL INSTITUTE FOR HEALTH AND CLINICAL EXCELLENCE QUALITY AND OUTCOMES FRAMEWORK (QOF) INDICATOR DEVELOPMENT PROGRAMME Cost impact statement: Chronic Obstructive Pulmonary Disease QOF indicator area:
Chronic Obstructive Pulmonary Disease (COPD) Measures Document
 Measures Document") Chronic Obstructive Pulmonary Disease (COPD) Measures Document COPD Version: 3 - covering patients discharged between 01/10/2017 and present. Programme Lead: Jo Higgins Clinical Lead: Dr Paul Albert Number
Chronic Obstructive Pulmonary Disease (COPD) Measures Document COPD Version: 3 - covering patients discharged between 01/10/2017 and present. Programme Lead: Jo Higgins Clinical Lead: Dr Paul Albert Number
NATIONAL INSTITUTE FOR HEALTH AND CLINICAL EXCELLENCE SCOPE
 DRAFT NATIONAL INSTITUTE FOR HEALTH AND CLINICAL EXCELLENCE 1 Guideline title SCOPE Chronic obstructive pulmonary disease: the management of adults with chronic obstructive pulmonary disease in primary
North West ChiMatters Child and Maternal Health Intelligence Briefing
 North West ChiMatters Child and Maternal Health Intelligence Briefing Children with long-term conditions in the North West: Emergency hospital admissions for asthma, diabetes and epilepsy 28/9 March 211
PRIMARY CARE CO-COMMISSIONING COMMITTEE 8 SEPTEMBER 2015
 Part 1 Part 2 PRIMARY CARE CO-COMMISSIONING COMMITTEE 8 SEPTEMBER 2015 Title of Report Trafford Palliative care Quality Premium Scheme 2015/16 Purpose of the Report The purpose of the report is to detail
National COPD Audit Programme
 National COPD Audit Programme Planning for every breath Primary Care Audit (Wales) 2015-17 Findings and quality improvement The audit programme partnership Working in strategic partnership: Supported by:
A breath of fresh air
 Respiratory Clinical Pathway Team A breath of fresh air Working together to improve respiratory care in the North West Contents Breathing space 3 Respiratory disease - the basics 4 How to prevent admissions
Compare your care. How asthma care in England matches up to standards R E S P I R AT O R Y S O C I E T Y U K
 Compare your care How asthma care in England matches up to standards PRIMARY CARE R E S P I R AT O R Y S O C I E T Y U K Asthma matters Around 4.5 million people in England that s 1 in 11 are being treated
Pathway diagrams Annex F
 Pathway diagrams Annex F Fig 1 Asthma: The patient journey Asthma is diagnosed Making the diagnosis of asthma Confirming the diagnosis may depend on history, response to treatment, measurement of airflow
Other NCAS Providers. Locality Region Organisation responsible Helpline/Contact number. Barking and Dagenham London Pohwer ICAS
 Other NCAS Providers Locality Region Organisation responsible Helpline/Contact number Barking and Dagenham London Pohwer ICAS 0300 456 2370 Barnet London Pohwer ICAS 0300 456 2370 Barnsley Y&H Barnsley
Care Bundle. Adult patients with COPD
 Care Bundle Adult patients with COPD Version 2 July 2014 What is a care bundle? A care bundle is a set of interventions that, when used together, significantly improve patient outcomes. The measures chosen
Wales Primary Care COPD Audit
 Wales Primary Care COPD Audit 2014-15 Next steps for improvement National Chronic Obstructive Pulmonary Disease (COPD) Audit Programme 2016 The audit programme partnership Working in strategic partnership:
NATIONAL INSTITUTE FOR HEALTH AND CARE EXCELLENCE SCOPE
 NATIONAL INSTITUTE FOR HEALTH AND CARE EXCELLENCE 1 Guideline title SCOPE Bronchiolitis: diagnosis and management of bronchiolitis in children. 1.1 Short title Bronchiolitis in children 2 The remit The
Quality Care Innovation lead clinician for integrated respiratory service georges ng* man kwong
 Working in partnership Quality Care Innovation lead clinician for integrated respiratory service georges ng* man kwong chest physician pronounced ning qualified 1990 chief clinical information officer
Chronic Obstructive Pulmonary Disease (COPD) : The Epidemiology, Economics and Quality of care in the West Midlands
 : The Epidemiology, Economics and Quality of care in the West Midlands") Chronic Obstructive Pulmonary Disease (COPD) : The Epidemiology, Economics and Quality of care in the West Midlands September 2009 Dr Christopher Zishiri George Che Fowajuh D a t a K n o w l e d g e I
Chronic Obstructive Pulmonary Disease (COPD) : The Epidemiology, Economics and Quality of care in the West Midlands September 2009 Dr Christopher Zishiri George Che Fowajuh D a t a K n o w l e d g e I
Quality Improvement Tool Instruction Guide GRASP-COPD
 PRIMIS: Quality Improvement Tool Instructional Guide Quality Improvement Tool Instruction Guide GRASP-COPD The GRASP-COPD quality improvement tool has been developed by PRIMIS and delivered in partnership
The Blue Light project: The story. A report on progress to March 2016
 The Blue Light project: The story so far A report on progress to March 2016 The Blue Light project is an innovative and cost effective approach to tackling one of the most challenging groups in the community:
Surveillance report Published: 6 April 2016 nice.org.uk. NICE All rights reserved.
 Surveillance report 2016 Chronic obstructive pulmonary disease in over 16s: diagnosis and management (2010) NICE guideline CG101 Surveillance report Published: 6 April 2016 nice.org.uk NICE 2016. All rights
PRIMARY CARE CO-COMMISSIONING COMMITTEE. 9 June 2015
 Agenda Item No. 9 Part 1 X Part 2 PRIMARY CARE CO-COMMISSIONING COMMITTEE 9 June 2015 Title of Report National Flu Plan Winter 2015/16 Requirement Summary and Trafford CCG Option Appraisal Purpose of the
2/4/2019. GOLD Objectives. GOLD 2019 Report: Chapters
 GOLD Objectives To provide a non biased review of the current evidence for the assessment, diagnosis and treatment of patients with COPD. To highlight short term and long term treatment objectives organized
JOINT CHRONIC OBSTRUCTIVE PULMONARY DISEASE (COPD) MANAGEMENT GUIDELINES
 MANAGEMENT GUIDELINES") JOINT CHRONIC OBSTRUCTIVE PULMONARY DISEASE (COPD) MANAGEMENT GUIDELINES Authors Dr Ian Benton Respiratory Consultant COCH Penny Rideal Respiratory Nurse COCH Kirti Burgul Respiratory Pharmacist COCH Pam
JOINT CHRONIC OBSTRUCTIVE PULMONARY DISEASE (COPD) MANAGEMENT GUIDELINES Authors Dr Ian Benton Respiratory Consultant COCH Penny Rideal Respiratory Nurse COCH Kirti Burgul Respiratory Pharmacist COCH Pam
Preventing the uptake of smoking by children
 Action on Smoking and Health (ASH) ASLEF Association of Directors of Adult Social Services Association of Pschoanalytic Psychotherapy in the NHS Association of Public Health Observatories Asthma UK Bedfordshire
Leeds West CCG Paediatric asthma project. January 2015-January 2017
 Leeds West CCG Paediatric asthma project. January 2015-January 2017 Aims to raise asthma awareness improve care reduce emergency attendances and unplanned admissions to secondary care for children with
Commissioning Living with and Beyond Cancer in Yorkshire and Humber; an Overview.
 Commissioning Living with and Beyond Cancer in Yorkshire and Humber; an Overview. Document Title An Overview of Commissioning Living with and Beyond Cancer in Yorkshire and Humber Version number: 1 First
Design - Multicentre prospective cohort study. Setting UK Community Pharmacies within one CCG area within the UK
 Enabling Patient Health Improvements through COPD (EPIC) Medicines Optimisation within Community Pharmacy: a prospective cohort study Abstract Objectives To improve patients ability to manage their own
Chronic Obstructive Pulmonary Disease (COPD) Treatment Guidelines
 Treatment Guidelines") Chronic Obstructive Pulmonary Disease (COPD) Treatment Guidelines Where appropriate the following should be offered before commencing inhaled treatment: Offer treatment and support to stop smoking. Smoking
Chronic Obstructive Pulmonary Disease (COPD) Treatment Guidelines Where appropriate the following should be offered before commencing inhaled treatment: Offer treatment and support to stop smoking. Smoking
Item Number: 6 NHS VALE OF YORK CLINICAL COMMISSIONING GROUP GOVERNING BODY MEETING. Meeting Date: 7 November Report Author: Report Sponsor:
 Item Number: 6 NHS VALE OF YORK CLINICAL COMMISSIONING GROUP GOVERNING BODY MEETING Meeting Date: 7 November 2013 Report Sponsor: Dr Emma Broughton Clinical Lead for Primary Care Programme Report Author:
COPD in primary care: reminder and update
 COPD in primary care: reminder and update Managing COPD continues to be a major feature of primary care, particularly in practices with a high proportion of M ori and Pacific peoples. COPDX clinical practice
Healtheast CCG - developing an understanding of health and wellbeing needs. Public Health NHS Norfolk and Waveney Cluster and Norfolk County Council
 Healtheast CCG - developing an understanding of health and wellbeing needs Public Health NHS Norfolk and Waveney Cluster and Norfolk County Council Acknowledgements Norfolk County Council Children s Services
Policy position statement Chronic Obstructive Pulmonary Disease (COPD) May 2017 Introduction
 May 2017 Introduction") Policy position statement Chronic Obstructive Pulmonary Disease (COPD) May 2017 Introduction The British Lung Foundation recommends: Improvements to COPD diagnosis speed and accuracy through better symptom
Policy position statement Chronic Obstructive Pulmonary Disease (COPD) May 2017 Introduction The British Lung Foundation recommends: Improvements to COPD diagnosis speed and accuracy through better symptom
2. Quality and Outcomes Framework: new NICE recommendations
 Proposed Changes to the GMS Contract 2013/14 1. GP pay and expenses uplift It is proposed GP pay and expenses is uplifted by 1.5%. This increased investment will allow for an average pay increase of up
Rosemary Plum Prescriptive Solutions Ltd SIMPLE Respiratory 2015
 + A SERVICE FOR COMMUNITY PHARMACY Rosemary Plum Prescriptive Solutions Ltd + n Why Pharmacy? High patient footfall 450 diagnosed asthma patients Walk-in service Medicines skills and expertise Structured
INITIATING A COPD CLINIC: PROTOCOL & ASSESSMENT
 COPD Resource Pack Section 2A INITIATING A COPD CLINIC: PROTOCOL & ASSESSMENT In this section: 1. Initiating a COPD Clinic 2. Equipment for a COPD Clinic 3. Primary Care Chronic Obstructive Pulmonary Disease
Chronic Obstructive Pulmonary Disease
 Page 1 of 5 Chronic Obstructive Pulmonary Disease Chronic Obstructive Pulmonary Disease (COPD) is an 'umbrella' term for people with chronic bronchitis, emphysema, or both. With COPD the airflow to the
National Haemoglobinopathy Registry. Annual Report 2017/18
 National Haemoglobinopathy Registry Annual Report 2017/18 National Haemoglobinopathy Registry Annual Report (2017/18) Compiled by Mark Foster MDSAS 3 1 Introduction CHAPTER 1 The 2017/18 Annual Report
JSNA Data Refresh 2013/14 Diabetes Barnet
 JSNA Data Refresh 2013/14 Diabetes Barnet Diabetes is a common life-long health condition. There are 3 million people diagnosed with diabetes in the UK. Type 2 diabetes is a largely preventable disease
National Haemoglobinopathy Registry. Annual Report 2015/16. mdsas
 National Haemoglobinopathy Registry Annual Report 2015/16 mdsas National Haemoglobinopathy Registry Annual Report (2015/16) 3 1 Introduction CHAPTER 1 This 2015/16 data update follows the same format as
The links between physical health in mental health
 The links between physical health in mental health A holistic approach to managing mental and physical health is needed. Physical and mental health are inextricably linked 1 What is the problem? It is
RESPIRATORY CARE IN GENERAL PRACTICE
 RESPIRATORY CARE IN GENERAL PRACTICE Definitions of Asthma and COPD Asthma is due to inflammation of the air passages in the lungs and affects the sensitivity of the nerve endings in the airways so they
Commissioning for Value: Where to Look January 2016
 OFFICIAL Commissioning for Value: Where to Look January 2016 Gateway ref: 04599 Contents Foreword: Professor Sir Bruce Keogh The RightCare programme: Wave one Supporting the Five Year Forward View Supporting
NHS ENGLAND BOARD PAPER
 NHS ENGLAND BOARD PAPER Paper: PB.15.12.2016/04 Title: Taking the cancer strategy forward: programme update Lead Director: Professor Sir Bruce Keogh, National Medical Director Cally Palmer, National Cancer
Commissioning for Value: Where to Look January 2016
 OFFICIAL Commissioning for Value: Where to Look January 2016 Gateway ref: 04599 Contents Foreword: Professor Sir Bruce Keogh The RightCare programme: Wave one Supporting the Five Year Forward View Supporting
Map 6: Percentage of people in the National Diabetes Audit (NDA) with Type 1 diabetes receiving all nine key care processes by PCT
 with Type 1 diabetes receiving all nine key care processes by PCT") 78 NHS ATLAS OF VARIATION ENDOCRINE, NUTRITIONAL AND METABOLIC PROBLEMS Map 6: Percentage of people in the National Diabetes Audit (NDA) with Type 1 diabetes receiving all nine key care processes by PCT
78 NHS ATLAS OF VARIATION ENDOCRINE, NUTRITIONAL AND METABOLIC PROBLEMS Map 6: Percentage of people in the National Diabetes Audit (NDA) with Type 1 diabetes receiving all nine key care processes by PCT
Changing Healthcare Forever mycopd
 Changing Healthcare Forever mycopd Introducing mycopd, from my mhealth. mycopd is the most comprehensive, user friendly and intuitive COPD App available on any device. Built by COPD experts, and externally
Roflumilast (Daxas) for chronic obstructive pulmonary disease
 for chronic obstructive pulmonary disease") Roflumilast (Daxas) for chronic obstructive pulmonary disease August 2009 This technology summary is based on information available at the time of research and a limited literature search. It is not intended
Roflumilast (Daxas) for chronic obstructive pulmonary disease August 2009 This technology summary is based on information available at the time of research and a limited literature search. It is not intended
Hywel Dda University Health Board Respiratory Health Annual Report November 2015
 Hywel Dda University Health Board Respiratory Health Annual Report November 2015 Annual Report Respiratory CH v6 Page 1 CONTENTS PAGE Executive Summary 5 Introduction 6 Respiratory Incidence 10 Our Approach
Commissioning for Value: Where to Look January 2016
 OFFICIAL Commissioning for Value: Where to Look January 2016 Gateway ref: 04599 Contents Foreword: Professor Sir Bruce Keogh The RightCare programme: Wave one Supporting the Five Year Forward View Supporting
GOVERNING BODY REPORT
 GOVERNING BODY REPORT DATE OF MEETING: 20th September 2012 TITLE OF REPORT: KEY MESSAGES: NHS West Cheshire Clinical Commissioning Group has identified heart disease as one of its six strategic clinical
Bedfordshire, Luton and Milton Keynes (BLMK) Sustainability and Transformation Partnership (STP) Central Brief: October 2017
 Sustainability and Transformation Partnership (STP) Central Brief: October 2017") Bedfordshire, Luton and Milton Keynes (BLMK) Sustainability and Transformation Partnership (STP) Central Brief: October 2017 Issue date: 2 November 2017 News Work progresses on proposed merger of Bedfordshire
Bedfordshire, Luton and Milton Keynes (BLMK) Sustainability and Transformation Partnership (STP) Central Brief: October 2017 Issue date: 2 November 2017 News Work progresses on proposed merger of Bedfordshire
What s New in Acute COPD? Dr Nick Scriven Consultant AIM President SAM
 What s New in Acute COPD? Dr Nick Scriven Consultant AIM President SAM Covering: Basic Definition New assessment criteria Some newer treatments BiPAP Not Covering: Definitions: Chronic Obstructive Pulmonary
Your COPD action plan
 Your COPD action plan Patient name: Better Breathing 0161 206 3159 All Rights Reserved 2017. Document for issue as handout. Unique Identifier: MED24(17). Review date: July 2019 Your COPD Action Plan This
Taking the pulse. of NHS services. Stroke prevention and atrial fibrillation. Written by Bayer HealthCare Pharmaceuticals AF A
 Taking the pulse of NHS services Stroke prevention and atrial fibrillation Written by Bayer HealthCare Pharmaceuticals This report is supported by UK-GIA-12-44 December 2012 AF A www.afa.org.uk Contents
Self-management plan for COPD
 Sheffield Clinical Commissioning Group Sheffield Teaching Hospitals NHS Foundation Trust Self-management plan for COPD This is your personal management plan The aim of the plan is to help you have better
Bronchodilator Delivery and Nebuliser Trials in Adults
 Bronchodilator Delivery and Nebuliser Trials in Adults Acute Management Favour the use of MDI (+/- Spacer) If considering nebuliser Short term treatment Approx. < 3 weeks See optimisation of inhaled bronchodilators
Commissioning for Value: Where to Look January 2016
 OFFICIAL Commissioning for Value: Where to Look January 2016 Gateway ref: 04599 Contents Foreword: Professor Sir Bruce Keogh The RightCare programme: Wave one Supporting the Five Year Forward View Supporting
Diagnosis and Management of Asthma in Children based on the British Thoracic Society and Scottish Intercollegiate Guidelines Network September 2016
 Diagnosis and Management of Asthma in Children based on the British Thoracic Society and Scottish Intercollegiate Guidelines Network September 2016 Diagnosis: There is no lower limit to the age at which
Putting NICE guidance into practice. Resource impact report: Asthma: diagnosis, monitoring and chronic asthma management (NG80)
") Putting NICE guidance into practice Resource impact report: Asthma: diagnosis, monitoring and chronic asthma management (NG80) Published: November 2017 Summary This report focuses on the recommendations
Putting NICE guidance into practice Resource impact report: Asthma: diagnosis, monitoring and chronic asthma management (NG80) Published: November 2017 Summary This report focuses on the recommendations
Commissioning for Value: Where to Look January 2016
 OFFICIAL Commissioning for Value: Where to Look January 2016 Gateway ref: 04599 Contents Foreword: Professor Sir Bruce Keogh The RightCare programme: Wave one Supporting the Five Year Forward View Supporting
Royal Crescent Surgery
 NATIONAL GENERAL PRACTICE PROFILES PROFILE FOR Royal Crescent Surgery 25 Crescent Street, Weymouth, Dorset These profiles are designed to support clinical commissioning groups (s), GPs and local authorities
Number of records submitted: 14,750 Number of participants: Part 1 = 146 hospitals (120 trusts); Part 2 = 140 hospitals (119 trusts)
; Part 2 = 140 hospitals (119 trusts)") British Thoracic Society Smoking Cessation Audit Report Smoking cessation policy and practice in NHS hospitals National Audit Period: 1 April 31 May 2016 Dr Sanjay Agrawal and Dr Zaheer Mangera Number
British Thoracic Society Smoking Cessation Audit Report Smoking cessation policy and practice in NHS hospitals National Audit Period: 1 April 31 May 2016 Dr Sanjay Agrawal and Dr Zaheer Mangera Number
2012 Chronic Respiratory. Program Evaluation. Our mission is to improve the health and quality of life of our members
 2012 Chronic Respiratory Program Evaluation Our mission is to improve the health and quality of life of our members 2012 Chronic Respiratory Program Evaluation Program Title: Chronic Respiratory Program
Commissioning for Value: Where to Look January 2016
 OFFICIAL Commissioning for Value: Where to Look January 2016 Gateway ref: 04599 Contents Foreword: Professor Sir Bruce Keogh The RightCare programme: Wave one Supporting the Five Year Forward View Supporting
Bronchiectasis. What is bronchiectasis? What causes bronchiectasis?
 This factsheet explains what bronchiectasis is, what causes it, and how it is diagnosed and managed. More detailed information is available on the Bronchiectasis Patient Priorities website: www.europeanlunginfo.org/bronchiectasis
Enhanced CPD Programme Module 1. Introducing Starting Well
 Enhanced CPD Programme Module 1 Introducing Starting Well Contents Where did the need of the scheme come from? In summary, what is the scheme about? How will the scheme work? Preventive Practices Advanced
National Optimal Lung Cancer Pathways. Dr Sadia Anwar Nottingham University Hospitals NHS Trust Clinical Lead for Lung Cancer
 National Optimal Lung Cancer Pathways Dr Sadia Anwar ttingham University Hospitals NHS Trust Clinical Lead for Lung Cancer Overview How NOLCP evolved How it relates to national guidance Pathways Implementation
National Diabetes Foot Care Audit Third Annual Report
 National Diabetes Foot Care Audit Third Annual Report England and Wales 14 July 2014 to 31 March 2017 V1.0 14 March 2018 Introduction: Contents Key Introduction Key messages Care structures survey Participation
Commissioning for Value: Where to Look January 2016
 OFFICIAL Commissioning for Value: Where to Look January 2016 Gateway ref: 04599 Contents Foreword: Professor Sir Bruce Keogh The RightCare programme: Wave one Supporting the Five Year Forward View Supporting
Enhancing the Quality of Heart Failure Care
 Enhancing the Quality of Heart Failure Care 2 Enhancing the quality of Heart Failure care Kent Surrey Sussex Academic Health Science Network 3 Contents 2 Heart failure care in the UK: Case for change 3
PRELIMINARY DRAFT. Costs and benefits of interventions to improve the management of COPD: results of an implementation study
 Costs and benefits of interventions to improve the management of COPD: results of an implementation study Stephen Morris, University College London (steve.morris@ucl.ac.uk) Nishma Patel, University College
SCHEDULE 2 THE SERVICES
 04e SCHEDULE 2 THE SERVICES A. Service Specifications This is a non-mandatory model template for local population. Commissioners may retain the structure below, or may determine their own in accordance
South East Coast Operational Delivery Network. Critical Care Rehabilitation
 South East Coast Operational Delivery Networks Hosted by Medway Foundation Trust South East Coast Operational Delivery Network Background Critical Care Rehabilitation The optimisation of recovery from
People living well with Dementia in the East Midlands: Improving the Quality of Care in Acute Hospitals
 PROJECT INITIATION DOCUMENT We re in it together People living well with Dementia in the East Midlands: Improving the Quality of Care in Acute Hospitals Version: 1.1 Date: February 2011 Authors: Jillian
Promoting Drug Users Respiratory Health
 Promoting Drug Users Respiratory Health Lloyd Baron IAD Research Assistant, Centre for Public Health, Liverpool John Moores University L.R.Baron@ljmu.ac.uk Outline Background terminology and COPD explanation
Chronic Obstructive Pulmonary Disease (COPD).
.") Chronic Obstructive Pulmonary Disease (COPD). Linde: Living healthcare 02 03 Chronic Obstructive Pulmonary Disease (COPD). A pocket guide for healthcare professionals. COPD the facts Moderate to severe
Chronic Obstructive Pulmonary Disease (COPD). Linde: Living healthcare 02 03 Chronic Obstructive Pulmonary Disease (COPD). A pocket guide for healthcare professionals. COPD the facts Moderate to severe
Commissioning for Value: Where to Look January 2016
 OFFICIAL Commissioning for Value: Where to Look January 2016 Gateway ref: 04599 Contents Foreword: Professor Sir Bruce Keogh The RightCare programme: Wave one Supporting the Five Year Forward View Supporting
NEBULISERS AND NEBULISED MEDICATION. A Guide for the use of nebulisers and nebulised medication in the community setting
 NEBULISERS AND NEBULISED MEDICATION A Guide for the use of nebulisers and nebulised medication in the community setting Aim This guide has been developed from the generic guidance circulated in April 2014.
Chronic Obstructive Pulmonary Disease. Information about medication and an Action Plan to use if your condition gets worse due to an infection
 Chronic Obstructive Pulmonary Disease Information about medication and an Action Plan to use if your condition gets worse due to an infection Information about your medication Your usual treatment Inhalers
Primary Care Standards Managing Asthma in Children & Young People
 Primary Care Standards Managing Asthma in Children & Young People Improving Outcomes for Children & Young People (CYP) with Asthma Through the work of clinicians, commissioners and other stakeholders these
apability, pportunity and otivation
 apability, pportunity and otivation Coding tobacco dependence & interventions Noel Baxter GP & Commissioner Siân Williams Programme Manager On behalf of London Senate Helping Smokers Quit delivery team
Chronic Obstructive Pulmonary Disease, shortened to COPD, is an umbrella term for a group of conditions which cause long-term damage to the airways.
 10 Common QuESTIonS AbouT CoPD Chronic Obstructive Pulmonary Disease, shortened to COPD, is an umbrella term for a group of conditions which cause long-term damage to the airways. COPD includes: chronic
Resource impact report: Eating disorders: recognition and treatment (NG69)
") Resource impact report: Eating disorders: recognition and treatment (NG69) Published: May 2017 Summary This report looks at the resource impact of implementing NICE s guideline on eating disorders: recognition
Resource impact report: Eating disorders: recognition and treatment (NG69) Published: May 2017 Summary This report looks at the resource impact of implementing NICE s guideline on eating disorders: recognition
CLINICAL PATHWAY. Acute Medicine. Chronic Obstructive Pulmonary Disease
 CLINICAL PATHWAY Acute Medicine Chronic Obstructive Pulmonary Disease Chronic Obstructive Pulmonary Disease Table of Contents (tap to jump to page) INTRODUCTION 1 Scope of this Pathway 1 Pathway Contacts
Algorithm for the use of inhaled therapies in COPD
 Berkshire West Integrated Care System Representing Berkshire West Clinical Commisioning Group Royal Berkshire NHS Foundation Trust Berkshire Healthcare NHS Foundation Trust Berkshire West Primary Care
Asthma: diagnosis and monitoring
 Asthma: diagnosis and monitoring NICE guideline: short version Draft for second consultation, July 01 This guideline covers assessing, diagnosing and monitoring suspected or confirmed asthma in adults,
MUSCULOSKELETAL CALCULATOR 42,103. 1in6 SUMMARY. Second Local Authority Bulletin Prevalence of back pain in England and Wolverhampton
 MUSCULOSKELETAL CALCULATOR Second Local Authority Bulletin Prevalence of back pain in England and Wolverhampton 42,103 estimated people in Wolverhampton live with back pain SUMMARY Arthritis Research UK