12/30/2017. PSY 5102: Advanced Statistics for Psychological and Behavioral Research 2
|
|
|
- Brenda Austin
- 5 years ago
- Views:
Transcription
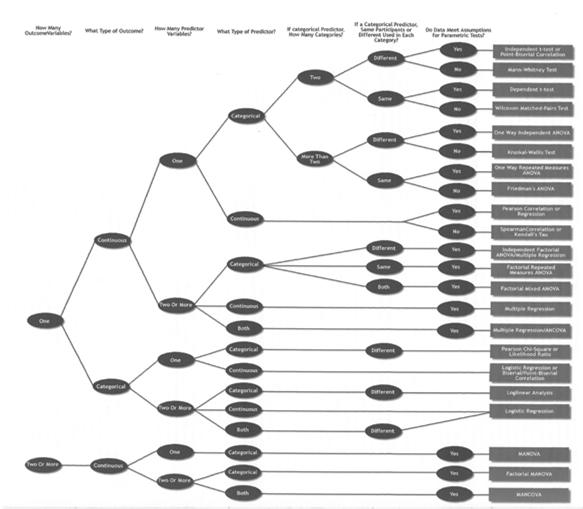
1 PSY 5102: Advanced Statistics for Psychological and Behavioral Research 2 Selecting a statistical test Relationships among major statistical methods General Linear Model and multiple regression Special cases of multiple regression Major research question? How many outcome variables? What type of outcome variables? How many predictor variables? What type of predictor variables? If a categorical predictor, how many categories? If a categorical predictor, same or different participants used in each category? Inclusion of covariates? Do the data meet assumptions of parametric tests? 1
2 2
3 About 90% of psychology articles focus on t-tests, ANOVAs, correlations, or regressions We have focused on the differences between these types of tests but they are actually very similar Their similarity is due to the fact that they are all derived from the same general formula which is known as the General Linear Model (GLM) The most general of these tests is multiple regression The other three tests are simply special cases of multiple regression Special case means that the formula for the more specific tests (e.g., ANOVA) can be derived from the formula for multiple regression You will get the same basic results if you use the more specialized or more general test If you could only use one statistical test for the rest of your career, then you would probably want to choose multiple regression because it is the most versatile 3
4 The GLM has two primary assumptions Linearity: Pairs of variables are assumed to have a linear relationship with each other (i.e., can be represented by a straight line) The GLM can also deal with curvilinear and multiplicative relationships (as well as other types of data such as categorical variables) Additivity: Additional predictor variables are assumed to add predictability to earlier predictor variables Multivariate models consist of weighted terms (predictor variables) that are added together The GLM is based on prediction (i.e., regression) A regression equation represents the value of a criterion variable (Y) as a combination of one or more predictor variables (Xs) plus error Simplest form is bivariate regression Y = BX + A + e B is slope (the change in Y associated with a one-unit change in X) A is the Y-intercept (a constant representing the value of Y when X is 0) e is a random variable representing error of prediction If X and Y are converted to z-scores, then the bivariate regression simplifies to the following z Y = βz X + e Y-intercept term drops out because the line crosses y- axis at 0 because of the standardization βis the standardized slope (or standardized regression coefficient) which represents the strength of the relationship between X and Y In bivariate regression, βis equal to the Pearson product-moment correlation coefficient (the closer βis to +1 or -1, then the better the prediction of Y from X [or X from Y]) 4
5 An important issue for the selection of statistical tests is whether the data are continuous or discrete Three forms of bivariate regression X continuous, Y continuous: Pearson productmoment correlation X dichotomous, Y continuous: Point biserial correlation X dichotomous, Y dichotomous: Phi coefficient (related to chi-square) If dichotomous variable is coded as 0 and 1, then these are all identical The first generalization of the simple bivariate GLM is to increase the number of predictor variables Additivityis important for understanding this extension of the GLM z Y = βiz Xi + e This formula is telling us to use the weighted sum of the Xs Example of three predictors: z Y = β 1 z X1 + β 2 z X2 + β 3 z X3 + e If Y is continuous and all of the Xsare continuous, then this is multiple regression If Y is continuous and all of the Xsare discrete, then this is the special case of ANOVA The values of X represent group membership and the emphasis is on finding mean differences in Y (rather than predicting Y) but the basic equation is the same because a significant difference among groups implies that information about X can be used to predict performance on Y All Xs continuous, Y continuous: Multiple regression All Xs discrete, Y continuous: ANOVA Some Xscontinuous and some discrete, Y continuous: ANCOVA All Xscontinuous, Y dichotomous: Two-group discriminant analysis All Xs discrete, Y is category frequency: Multiway frequency analysis Xscontinuous or discrete, Y dichotomous: Two-group logistic regression Xsat each level may be continuous or discrete, Ysat each level are continuous: Multilevel modeling Xscontinuous and/or dichotomous, Y continuous (time): Survival analysis Xscontinuous (time) and dichotomous, Y continuous: Time series analysis 5
6 GLM can also deal with situations where there are more than one criterion variable (multiple Ys) We will revisit this issue later in the semester when everyone is more familiar with regression All Xs continuous, Ys continuous: Canonical correlation All Xs discrete, Ys continuous: MANOVA Some Xscontinuous and some discrete, Yscontinuous: MANCOVA All Xsdiscrete, all Yscontinuous and commensurate (i.e., measured on the same scale): Profile analysis All Xscontinuous, all Ysare discrete: Discriminant analysis All Xslatent, all Yscontinuous: Factor analysis /principal components analysis Xscontinuous and/or latent, Yscontinuous and/or latent: Structural equations modeling All Xs discrete, Y is category frequency: Multiway frequency analysis Xscontinuous and/or discrete, Y discrete: Polychotomous logistic regression analysis 6
11/18/2013. Correlational Research. Correlational Designs. Why Use a Correlational Design? CORRELATIONAL RESEARCH STUDIES
 Correlational Research Correlational Designs Correlational research is used to describe the relationship between two or more naturally occurring variables. Is age related to political conservativism? Are
Class 7 Everything is Related
 Class 7 Everything is Related Correlational Designs l 1 Topics Types of Correlational Designs Understanding Correlation Reporting Correlational Statistics Quantitative Designs l 2 Types of Correlational
11/24/2017. Do not imply a cause-and-effect relationship
 Correlational research is used to describe the relationship between two or more naturally occurring variables. Is age related to political conservativism? Are highly extraverted people less afraid of rejection
isc ove ring i Statistics sing SPSS
 isc ove ring i Statistics sing SPSS S E C O N D! E D I T I O N (and sex, drugs and rock V roll) A N D Y F I E L D Publications London o Thousand Oaks New Delhi CONTENTS Preface How To Use This Book Acknowledgements
Chapter 14: More Powerful Statistical Methods
 Chapter 14: More Powerful Statistical Methods Most questions will be on correlation and regression analysis, but I would like you to know just basically what cluster analysis, factor analysis, and conjoint
CRITERIA FOR USE. A GRAPHICAL EXPLANATION OF BI-VARIATE (2 VARIABLE) REGRESSION ANALYSISSys
 REGRESSION ANALYSISSys") Multiple Regression Analysis 1 CRITERIA FOR USE Multiple regression analysis is used to test the effects of n independent (predictor) variables on a single dependent (criterion) variable. Regression tests
Multiple Regression Analysis 1 CRITERIA FOR USE Multiple regression analysis is used to test the effects of n independent (predictor) variables on a single dependent (criterion) variable. Regression tests
Business Statistics Probability
 Business Statistics The following was provided by Dr. Suzanne Delaney, and is a comprehensive review of Business Statistics. The workshop instructor will provide relevant examples during the Skills Assessment
NORTH SOUTH UNIVERSITY TUTORIAL 2
 NORTH SOUTH UNIVERSITY TUTORIAL 2 AHMED HOSSAIN,PhD Data Management and Analysis AHMED HOSSAIN,PhD - Data Management and Analysis 1 Correlation Analysis INTRODUCTION In correlation analysis, we estimate
Correlational Research. Correlational Research. Stephen E. Brock, Ph.D., NCSP EDS 250. Descriptive Research 1. Correlational Research: Scatter Plots
 Correlational Research Stephen E. Brock, Ph.D., NCSP California State University, Sacramento 1 Correlational Research A quantitative methodology used to determine whether, and to what degree, a relationship
Basic Features of Statistical Analysis and the General Linear Model
 01-Foster-3327(ch-01).qxd 9/5/2005 5:48 PM Page 1 1 Basic Features of Statistical Analysis and the General Linear Model INTRODUCTION The aim of this book is to describe some of the statistical techniques
Correlation and regression
 PG Dip in High Intensity Psychological Interventions Correlation and regression Martin Bland Professor of Health Statistics University of York http://martinbland.co.uk/ Correlation Example: Muscle strength
3 CONCEPTUAL FOUNDATIONS OF STATISTICS
 3 CONCEPTUAL FOUNDATIONS OF STATISTICS In this chapter, we examine the conceptual foundations of statistics. The goal is to give you an appreciation and conceptual understanding of some basic statistical
Introduction to Multilevel Models for Longitudinal and Repeated Measures Data
 Introduction to Multilevel Models for Longitudinal and Repeated Measures Data Today s Class: Features of longitudinal data Features of longitudinal models What can MLM do for you? What to expect in this
Ecological Statistics
 A Primer of Ecological Statistics Second Edition Nicholas J. Gotelli University of Vermont Aaron M. Ellison Harvard Forest Sinauer Associates, Inc. Publishers Sunderland, Massachusetts U.S.A. Brief Contents
Introduction to Multilevel Models for Longitudinal and Repeated Measures Data
 Introduction to Multilevel Models for Longitudinal and Repeated Measures Data Today s Class: Features of longitudinal data Features of longitudinal models What can MLM do for you? What to expect in this
Prepared by: Assoc. Prof. Dr Bahaman Abu Samah Department of Professional Development and Continuing Education Faculty of Educational Studies
 Prepared by: Assoc. Prof. Dr Bahaman Abu Samah Department of Professional Development and Continuing Education Faculty of Educational Studies Universiti Putra Malaysia Serdang At the end of this session,
IAPT: Regression. Regression analyses
 Regression analyses IAPT: Regression Regression is the rather strange name given to a set of methods for predicting one variable from another. The data shown in Table 1 and come from a student project
CHAPTER 3 RESEARCH METHODOLOGY
 CHAPTER 3 RESEARCH METHODOLOGY 3.1 Introduction 3.1 Methodology 3.1.1 Research Design 3.1. Research Framework Design 3.1.3 Research Instrument 3.1.4 Validity of Questionnaire 3.1.5 Statistical Measurement
On the purpose of testing:
 Why Evaluation & Assessment is Important Feedback to students Feedback to teachers Information to parents Information for selection and certification Information for accountability Incentives to increase
Multiple Regression. James H. Steiger. Department of Psychology and Human Development Vanderbilt University
 Multiple Regression James H. Steiger Department of Psychology and Human Development Vanderbilt University James H. Steiger (Vanderbilt University) Multiple Regression 1 / 19 Multiple Regression 1 The Multiple
Study Guide #2: MULTIPLE REGRESSION in education
 Study Guide #2: MULTIPLE REGRESSION in education What is Multiple Regression? When using Multiple Regression in education, researchers use the term independent variables to identify those variables that
investigate. educate. inform.
 investigate. educate. inform. Research Design What drives your research design? The battle between Qualitative and Quantitative is over Think before you leap What SHOULD drive your research design. Advanced
Statistics for Psychology
 Statistics for Psychology SIXTH EDITION CHAPTER 12 Prediction Prediction a major practical application of statistical methods: making predictions make informed (and precise) guesses about such things as
Regression CHAPTER SIXTEEN NOTE TO INSTRUCTORS OUTLINE OF RESOURCES
 CHAPTER SIXTEEN Regression NOTE TO INSTRUCTORS This chapter includes a number of complex concepts that may seem intimidating to students. Encourage students to focus on the big picture through some of
Statistics as a Tool. A set of tools for collecting, organizing, presenting and analyzing numerical facts or observations.
 Statistics as a Tool A set of tools for collecting, organizing, presenting and analyzing numerical facts or observations. Descriptive Statistics Numerical facts or observations that are organized describe
POL 242Y Final Test (Take Home) Name
 Name") POL 242Y Final Test (Take Home) Name_ Due August 6, 2008 The take-home final test should be returned in the classroom (FE 36) by the end of the class on August 6. Students who fail to submit the final
POL 242Y Final Test (Take Home) Name_ Due August 6, 2008 The take-home final test should be returned in the classroom (FE 36) by the end of the class on August 6. Students who fail to submit the final
Applications. DSC 410/510 Multivariate Statistical Methods. Discriminating Two Groups. What is Discriminant Analysis
 DSC 4/5 Multivariate Statistical Methods Applications DSC 4/5 Multivariate Statistical Methods Discriminant Analysis Identify the group to which an object or case (e.g. person, firm, product) belongs:
Chapter 3 CORRELATION AND REGRESSION
 CORRELATION AND REGRESSION TOPIC SLIDE Linear Regression Defined 2 Regression Equation 3 The Slope or b 4 The Y-Intercept or a 5 What Value of the Y-Variable Should be Predicted When r = 0? 7 The Regression
REPEATED MEASURES DESIGNS
 Repeated Measures Designs The SAGE Encyclopedia of Educational Research, Measurement and Evaluation Markus Brauer (University of Wisconsin-Madison) Target word count: 1000 - Actual word count: 1071 REPEATED
MODULE S1 DESCRIPTIVE STATISTICS
 MODULE S1 DESCRIPTIVE STATISTICS All educators are involved in research and statistics to a degree. For this reason all educators should have a practical understanding of research design. Even if an educator
CHAPTER TWO REGRESSION
 CHAPTER TWO REGRESSION 2.0 Introduction The second chapter, Regression analysis is an extension of correlation. The aim of the discussion of exercises is to enhance students capability to assess the effect
Summary & Conclusion. Lecture 10 Survey Research & Design in Psychology James Neill, 2016 Creative Commons Attribution 4.0
 Summary & Conclusion Lecture 10 Survey Research & Design in Psychology James Neill, 2016 Creative Commons Attribution 4.0 Overview 1. Survey research and design 1. Survey research 2. Survey design 2. Univariate
Describe what is meant by a placebo Contrast the double-blind procedure with the single-blind procedure Review the structure for organizing a memo
 Business Statistics The following was provided by Dr. Suzanne Delaney, and is a comprehensive review of Business Statistics. The workshop instructor will provide relevant examples during the Skills Assessment
Statistical questions for statistical methods
 Statistical questions for statistical methods Unpaired (two-sample) t-test DECIDE: Does the numerical outcome have a relationship with the categorical explanatory variable? Is the mean of the outcome the
From Biostatistics Using JMP: A Practical Guide. Full book available for purchase here. Chapter 1: Introduction... 1
 From Biostatistics Using JMP: A Practical Guide. Full book available for purchase here. Contents Dedication... iii Acknowledgments... xi About This Book... xiii About the Author... xvii Chapter 1: Introduction...
Chapter 1: Explaining Behavior
 Chapter 1: Explaining Behavior GOAL OF SCIENCE is to generate explanations for various puzzling natural phenomenon. - Generate general laws of behavior (psychology) RESEARCH: principle method for acquiring
Use of the Quantitative-Methods Approach in Scientific Inquiry. Du Feng, Ph.D. Professor School of Nursing University of Nevada, Las Vegas
 Use of the Quantitative-Methods Approach in Scientific Inquiry Du Feng, Ph.D. Professor School of Nursing University of Nevada, Las Vegas The Scientific Approach to Knowledge Two Criteria of the Scientific
12/31/2016. PSY 512: Advanced Statistics for Psychological and Behavioral Research 2
 PSY 512: Advanced Statistics for Psychological and Behavioral Research 2 Introduce moderated multiple regression Continuous predictor continuous predictor Continuous predictor categorical predictor Understand
Addendum: Multiple Regression Analysis (DRAFT 8/2/07)
") Addendum: Multiple Regression Analysis (DRAFT 8/2/07) When conducting a rapid ethnographic assessment, program staff may: Want to assess the relative degree to which a number of possible predictive variables
Addendum: Multiple Regression Analysis (DRAFT 8/2/07) When conducting a rapid ethnographic assessment, program staff may: Want to assess the relative degree to which a number of possible predictive variables
Biology 345: Biometry Fall 2005 SONOMA STATE UNIVERSITY Lab Exercise 5 Residuals and multiple regression Introduction
 Biology 345: Biometry Fall 2005 SONOMA STATE UNIVERSITY Lab Exercise 5 Residuals and multiple regression Introduction In this exercise, we will gain experience assessing scatterplots in regression and
Table of Contents. Plots. Essential Statistics for Nursing Research 1/12/2017
 Essential Statistics for Nursing Research Kristen Carlin, MPH Seattle Nursing Research Workshop January 30, 2017 Table of Contents Plots Descriptive statistics Sample size/power Correlations Hypothesis
Multiple Regression Analysis
 Multiple Regression Analysis 5A.1 General Considerations 5A CHAPTER Multiple regression analysis, a term first used by Karl Pearson (1908), is an extremely useful extension of simple linear regression
Simple Linear Regression the model, estimation and testing
 Simple Linear Regression the model, estimation and testing Lecture No. 05 Example 1 A production manager has compared the dexterity test scores of five assembly-line employees with their hourly productivity.
Survey research (Lecture 1) Summary & Conclusion. Lecture 10 Survey Research & Design in Psychology James Neill, 2015 Creative Commons Attribution 4.
 Summary & Conclusion. Lecture 10 Survey Research & Design in Psychology James Neill, 2015 Creative Commons Attribution 4.") Summary & Conclusion Lecture 10 Survey Research & Design in Psychology James Neill, 2015 Creative Commons Attribution 4.0 Overview 1. Survey research 2. Survey design 3. Descriptives & graphing 4. Correlation
Summary & Conclusion Lecture 10 Survey Research & Design in Psychology James Neill, 2015 Creative Commons Attribution 4.0 Overview 1. Survey research 2. Survey design 3. Descriptives & graphing 4. Correlation
Survey research (Lecture 1)
") Summary & Conclusion Lecture 10 Survey Research & Design in Psychology James Neill, 2015 Creative Commons Attribution 4.0 Overview 1. Survey research 2. Survey design 3. Descriptives & graphing 4. Correlation
Summary & Conclusion Lecture 10 Survey Research & Design in Psychology James Neill, 2015 Creative Commons Attribution 4.0 Overview 1. Survey research 2. Survey design 3. Descriptives & graphing 4. Correlation
Math 124: Module 2, Part II
 , Part II David Meredith Department of Mathematics San Francisco State University September 15, 2009 What we will do today 1 Explanatory and Response Variables When you study the relationship between two
MEASURES OF ASSOCIATION AND REGRESSION
 DEPARTMENT OF POLITICAL SCIENCE AND INTERNATIONAL RELATIONS Posc/Uapp 816 MEASURES OF ASSOCIATION AND REGRESSION I. AGENDA: A. Measures of association B. Two variable regression C. Reading: 1. Start Agresti
Daniel Boduszek University of Huddersfield
 Daniel Boduszek University of Huddersfield d.boduszek@hud.ac.uk Introduction to Multinominal Logistic Regression SPSS procedure of MLR Example based on prison data Interpretation of SPSS output Presenting
Longitudinal data monitoring for Child Health Indicators
 Longitudinal data monitoring for Child Health Indicators Vincent Were Statistician, Senior Data Manager and Health Economist Kenya Medical Research institute [KEMRI] Presentation at Kenya Paediatric Association
Daniel Boduszek University of Huddersfield
 Daniel Boduszek University of Huddersfield d.boduszek@hud.ac.uk Introduction to Logistic Regression SPSS procedure of LR Interpretation of SPSS output Presenting results from LR Logistic regression is
From Bivariate Through Multivariate Techniques
 A p p l i e d S T A T I S T I C S From Bivariate Through Multivariate Techniques R e b e c c a M. W a r n e r University of New Hampshire DAI HOC THAI NGUYEN TRUNG TAM HOC LIEU *)SAGE Publications '55'
How to analyze correlated and longitudinal data?
 How to analyze correlated and longitudinal data? Niloofar Ramezani, University of Northern Colorado, Greeley, Colorado ABSTRACT Longitudinal and correlated data are extensively used across disciplines
STATISTICS AND RESEARCH DESIGN
 Statistics 1 STATISTICS AND RESEARCH DESIGN These are subjects that are frequently confused. Both subjects often evoke student anxiety and avoidance. To further complicate matters, both areas appear have
Still important ideas
 Readings: OpenStax - Chapters 1 13 & Appendix D & E (online) Plous Chapters 17 & 18 - Chapter 17: Social Influences - Chapter 18: Group Judgments and Decisions Still important ideas Contrast the measurement
Analysis and Interpretation of Data Part 1
 Analysis and Interpretation of Data Part 1 DATA ANALYSIS: PRELIMINARY STEPS 1. Editing Field Edit Completeness Legibility Comprehensibility Consistency Uniformity Central Office Edit 2. Coding Specifying
Readings: Textbook readings: OpenStax - Chapters 1 13 (emphasis on Chapter 12) Online readings: Appendix D, E & F
 Online readings: Appendix D, E & F") Readings: Textbook readings: OpenStax - Chapters 1 13 (emphasis on Chapter 12) Online readings: Appendix D, E & F Plous Chapters 17 & 18 Chapter 17: Social Influences Chapter 18: Group Judgments and Decisions
Readings: Textbook readings: OpenStax - Chapters 1 13 (emphasis on Chapter 12) Online readings: Appendix D, E & F Plous Chapters 17 & 18 Chapter 17: Social Influences Chapter 18: Group Judgments and Decisions
Conditional Distributions and the Bivariate Normal Distribution. James H. Steiger
 Conditional Distributions and the Bivariate Normal Distribution James H. Steiger Overview In this module, we have several goals: Introduce several technical terms Bivariate frequency distribution Marginal
f WILEY ANOVA and ANCOVA A GLM Approach Second Edition ANDREW RUTHERFORD Staffordshire, United Kingdom Keele University School of Psychology
 ANOVA and ANCOVA A GLM Approach Second Edition ANDREW RUTHERFORD Keele University School of Psychology Staffordshire, United Kingdom f WILEY A JOHN WILEY & SONS, INC., PUBLICATION Contents Acknowledgments
The SAGE Encyclopedia of Educational Research, Measurement, and Evaluation Multivariate Analysis of Variance
 The SAGE Encyclopedia of Educational Research, Measurement, Multivariate Analysis of Variance Contributors: David W. Stockburger Edited by: Bruce B. Frey Book Title: Chapter Title: "Multivariate Analysis
The University of North Carolina at Chapel Hill School of Social Work
 The University of North Carolina at Chapel Hill School of Social Work SOWO 918: Applied Regression Analysis and Generalized Linear Models Spring Semester, 2014 Instructor Shenyang Guo, Ph.D., Room 524j,
Profile Analysis. Intro and Assumptions Psy 524 Andrew Ainsworth
 Profile Analysis Intro and Assumptions Psy 524 Andrew Ainsworth Profile Analysis Profile analysis is the repeated measures extension of MANOVA where a set of DVs are commensurate (on the same scale). Profile
Overview of Non-Parametric Statistics
 Overview of Non-Parametric Statistics LISA Short Course Series Mark Seiss, Dept. of Statistics April 7, 2009 Presentation Outline 1. Homework 2. Review of Parametric Statistics 3. Overview Non-Parametric
1. Below is the output of a 2 (gender) x 3(music type) completely between subjects factorial ANOVA on stress ratings
 x 3(music type) completely between subjects factorial ANOVA on stress ratings") SPSS 3 Practice Interpretation questions A researcher is interested in the effects of music on stress levels, and how stress levels might be related to anxiety and life satisfaction. 1. Below is the output
SPSS 3 Practice Interpretation questions A researcher is interested in the effects of music on stress levels, and how stress levels might be related to anxiety and life satisfaction. 1. Below is the output
Relationships. Between Measurements Variables. Chapter 10. Copyright 2005 Brooks/Cole, a division of Thomson Learning, Inc.
 Relationships Chapter 10 Between Measurements Variables Copyright 2005 Brooks/Cole, a division of Thomson Learning, Inc. Thought topics Price of diamonds against weight Male vs female age for dating Animals
Construct Validity of the MBTI in Management Development: A Test of Two Interpretations. Robert B. Kaiser & S. Bartholomew Craig
 Construct Validity of the MBTI in Management Development: A Test of Two Interpretations Robert B. Kaiser & S. Bartholomew Craig Myers-Briggs Type Indicator (MBTI) Derived from an explicit theory Scales
Index. E Eftekbar, B., 152, 164 Eigenvectors, 6, 171 Elastic net regression, 6 discretization, 28 regularization, 42, 44, 46 Exponential modeling, 135
 A Abrahamowicz, M., 100 Akaike information criterion (AIC), 141 Analysis of covariance (ANCOVA), 2 4. See also Canonical regression Analysis of variance (ANOVA) model, 2 4, 255 canonical regression (see
PTHP 7101 Research 1 Chapter Assignments
 PTHP 7101 Research 1 Chapter Assignments INSTRUCTIONS: Go over the questions/pointers pertaining to the chapters and turn in a hard copy of your answers at the beginning of class (on the day that it is
SCATTER PLOTS AND TREND LINES
 1 SCATTER PLOTS AND TREND LINES LEARNING MAP INFORMATION STANDARDS 8.SP.1 Construct and interpret scatter s for measurement to investigate patterns of between two quantities. Describe patterns such as
bivariate analysis: The statistical analysis of the relationship between two variables.
 bivariate analysis: The statistical analysis of the relationship between two variables. cell frequency: The number of cases in a cell of a cross-tabulation (contingency table). chi-square (χ 2 ) test for
Applied Medical. Statistics Using SAS. Geoff Der. Brian S. Everitt. CRC Press. Taylor Si Francis Croup. Taylor & Francis Croup, an informa business
 Applied Medical Statistics Using SAS Geoff Der Brian S. Everitt CRC Press Taylor Si Francis Croup Boca Raton London New York CRC Press is an imprint of the Taylor & Francis Croup, an informa business A
CHAPTER VI RESEARCH METHODOLOGY
 CHAPTER VI RESEARCH METHODOLOGY 6.1 Research Design Research is an organized, systematic, data based, critical, objective, scientific inquiry or investigation into a specific problem, undertaken with the
Quantitative Methods in Managment. An introduction to GLMs and measurement theory
 Quantitative Methods in Managment An Introduction to GLMs and measurement theory Graeme D. Hutcheson 1 Luiz Moutinho 2 1 School of Education Manchester university 2 Department of Management Glasgow University
10. LINEAR REGRESSION AND CORRELATION
 1 10. LINEAR REGRESSION AND CORRELATION The contingency table describes an association between two nominal (categorical) variables (e.g., use of supplemental oxygen and mountaineer survival ). We have
Research Approaches Quantitative Approach. Research Methods vs Research Design
 Research Approaches Quantitative Approach DCE3002 Research Methodology Research Methods vs Research Design Both research methods as well as research design are crucial for successful completion of any
Choosing the Correct Statistical Test
 Choosing the Correct Statistical Test T racie O. Afifi, PhD Departments of Community Health Sciences & Psychiatry University of Manitoba Department of Community Health Sciences COLLEGE OF MEDICINE, FACULTY
A review of statistical methods in the analysis of data arising from observer reliability studies (Part 11) *
 *") A review of statistical methods in the analysis of data arising from observer reliability studies (Part 11) * by J. RICHARD LANDIS** and GARY G. KOCH** 4 Methods proposed for nominal and ordinal data Many
A review of statistical methods in the analysis of data arising from observer reliability studies (Part 11) * by J. RICHARD LANDIS** and GARY G. KOCH** 4 Methods proposed for nominal and ordinal data Many
ANCOVA with Regression Homogeneity
 ANCOVA with Regression Homogeneity The purpose of the study was to compare the effectiveness of two different treatments in two populations. Both treatments have been repeatedly shown to work better than
(C) Jamalludin Ab Rahman
 Jamalludin Ab Rahman") SPSS Note The GLM Multivariate procedure is based on the General Linear Model procedure, in which factors and covariates are assumed to have a linear relationship to the dependent variable. Factors. Categorical
SPSS Note The GLM Multivariate procedure is based on the General Linear Model procedure, in which factors and covariates are assumed to have a linear relationship to the dependent variable. Factors. Categorical
Clincial Biostatistics. Regression
 Regression analyses Clincial Biostatistics Regression Regression is the rather strange name given to a set of methods for predicting one variable from another. The data shown in Table 1 and come from a
SUMMER 2011 RE-EXAM PSYF11STAT - STATISTIK
 SUMMER 011 RE-EXAM PSYF11STAT - STATISTIK Full Name: Årskortnummer: Date: This exam is made up of three parts: Part 1 includes 30 multiple choice questions; Part includes 10 matching questions; and Part
A-PDF Watermark DEMO: Purchase from to remove the watermark
 A-PDF Watermark DEMO: Purchase from www.a-pdf.com to remove the watermark APPLIED STATISTICS 2 EDITION To all my students, whose questions have guided me. APPLIED STATISTICS From Bivariate Through Multivariate
This module illustrates SEM via a contrast with multiple regression. The module on Mediation describes a study of post-fire vegetation recovery in
 This module illustrates SEM via a contrast with multiple regression. The module on Mediation describes a study of post-fire vegetation recovery in southern California woodlands. Here I borrow that study
2.75: 84% 2.5: 80% 2.25: 78% 2: 74% 1.75: 70% 1.5: 66% 1.25: 64% 1.0: 60% 0.5: 50% 0.25: 25% 0: 0%
 Capstone Test (will consist of FOUR quizzes and the FINAL test grade will be an average of the four quizzes). Capstone #1: Review of Chapters 1-3 Capstone #2: Review of Chapter 4 Capstone #3: Review of
Overview of Lecture. Survey Methods & Design in Psychology. Correlational statistics vs tests of differences between groups
 Survey Methods & Design in Psychology Lecture 10 ANOVA (2007) Lecturer: James Neill Overview of Lecture Testing mean differences ANOVA models Interactions Follow-up tests Effect sizes Parametric Tests
Simple Linear Regression
 Simple Linear Regression Assoc. Prof Dr Sarimah Abdullah Unit of Biostatistics & Research Methodology School of Medical Sciences, Health Campus Universiti Sains Malaysia Regression Regression analysis
Multiple Regression Models
 Multiple Regression Models Advantages of multiple regression Parts of a multiple regression model & interpretation Raw score vs. Standardized models Differences between r, b biv, b mult & β mult Steps
Multiple Regression Analysis
 Multiple Regression Analysis Basic Concept: Extend the simple regression model to include additional explanatory variables: Y = β 0 + β1x1 + β2x2 +... + βp-1xp + ε p = (number of independent variables
Experimental Studies. Statistical techniques for Experimental Data. Experimental Designs can be grouped. Experimental Designs can be grouped
 Experimental Studies Statistical techniques for Experimental Data Require appropriate manipulations and controls Many different designs Consider an overview of the designs Examples of some of the analyses
STATISTICS INFORMED DECISIONS USING DATA
 STATISTICS INFORMED DECISIONS USING DATA Fifth Edition Chapter 4 Describing the Relation between Two Variables 4.1 Scatter Diagrams and Correlation Learning Objectives 1. Draw and interpret scatter diagrams
Small Group Presentations
 Admin Assignment 1 due next Tuesday at 3pm in the Psychology course centre. Matrix Quiz during the first hour of next lecture. Assignment 2 due 13 May at 10am. I will upload and distribute these at the
Section 3.2 Least-Squares Regression
 Section 3.2 Least-Squares Regression Linear relationships between two quantitative variables are pretty common and easy to understand. Correlation measures the direction and strength of these relationships.
Regression Discontinuity Analysis
 Regression Discontinuity Analysis A researcher wants to determine whether tutoring underachieving middle school students improves their math grades. Another wonders whether providing financial aid to low-income
Section 6: Analysing Relationships Between Variables
 6. 1 Analysing Relationships Between Variables Section 6: Analysing Relationships Between Variables Choosing a Technique The Crosstabs Procedure The Chi Square Test The Means Procedure The Correlations
Simple Linear Regression One Categorical Independent Variable with Several Categories
 Simple Linear Regression One Categorical Independent Variable with Several Categories Does ethnicity influence total GCSE score? We ve learned that variables with just two categories are called binary
Daniel Boduszek University of Huddersfield
 Daniel Boduszek University of Huddersfield d.boduszek@hud.ac.uk Introduction to Multiple Regression (MR) Types of MR Assumptions of MR SPSS procedure of MR Example based on prison data Interpretation of
Chapter 3: Examining Relationships
 Name Date Per Key Vocabulary: response variable explanatory variable independent variable dependent variable scatterplot positive association negative association linear correlation r-value regression
THE STATSWHISPERER. Introduction to this Issue. Doing Your Data Analysis INSIDE THIS ISSUE
 Spring 20 11, Volume 1, Issue 1 THE STATSWHISPERER The StatsWhisperer Newsletter is published by staff at StatsWhisperer. Visit us at: www.statswhisperer.com Introduction to this Issue The current issue
MMI 409 Spring 2009 Final Examination Gordon Bleil. 1. Is there a difference in depression as a function of group and drug?
 MMI 409 Spring 2009 Final Examination Gordon Bleil Table of Contents Research Scenario and General Assumptions Questions for Dataset (Questions are hyperlinked to detailed answers) 1. Is there a difference
Media, Discussion and Attitudes Technical Appendix. 6 October 2015 BBC Media Action Andrea Scavo and Hana Rohan
 Media, Discussion and Attitudes Technical Appendix 6 October 2015 BBC Media Action Andrea Scavo and Hana Rohan 1 Contents 1 BBC Media Action Programming and Conflict-Related Attitudes (Part 5a: Media and