AP Statistics. Semester One Review Part 1 Chapters 1-5
|
|
|
- Bertram Townsend
- 6 years ago
- Views:
Transcription

1 AP Statistics Semester One Review Part 1 Chapters 1-5

2 AP Statistics Topics Describing Data Producing Data Probability Statistical Inference
3 Describing Data Ch 1: Describing Data: Graphically and Numerically Ch 2: The Normal Distributions Ch 3: Describing BiVariate Relationships Ch 4: More BiVariate Relationships


4 Chapter 1: Describing Data Our Introductory Chapter taught us how to describe a set of data graphically and numerically. Our focus in this chapter was describing the Shape, Outliers, Center, and Spread of a dataset.


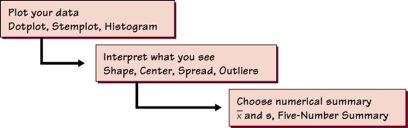
5 Describing Data When starting any data analysis, you should first PLOT your data and describe what you see... Dotplot Stemplot Box-n-Whisker Plot Histogram
6 Describe the SOCS After plotting the data, note the SOCS: Shape: Skewed, Mound, Uniform, Bimodal Outliers: Any extreme observations Center: Typical representative value Spread: Amount of variability

7 Numeric Descriptions While a plot provides a nice visual description of a dataset, we often want a more detailed numeric summary of the center and spread.
8 Measures of Center When describing the center of a set of data, we can use the mean or the median. Mean: Average value x = Median: Center value Q2! x n
9 Measures of Variability When describing the spread of a set of data, we can use: Range: Max-Min InterQuartile Range: IQR=Q3-Q1 Standard Deviation:! = (x " x) 2 # n " 1
10 Numeric Descriptions When describing the center and spread of a set of data, be sure to provide a numeric description of each: Mean and Standard Deviation 5-Number Summary: Min, Q1, Med, Q3, Max {Box-n-Whisker Plot}

11 Determining Outliers When an observation appears to be an outlier, we will want to provide numeric evidence that it is or isn t extreme We will consider observations outliers if: More than 3 standard deviations from the mean. Or More than 1.5 IQR s outside the box

12 Chapter 1 Summary


13 Chapter 2: Normal Distributions Many distributions in statistics can be described as approximately Normal. In this chapter, we learned how to identify and describe normal distributions and how to do Standard Normal Calculations.

14 Density Curves A Density Curve is a smooth, idealized mathematical model of a distribution. The area under every density curve is 1.

15 The Normal Distribution Many distributions of data and many statistical applications can be described by an approximately normal distribution. Symmetric, Bell-shaped Curve Centered at Mean µ Described as N(µ,! )
16 Empirical Rule One particularly useful fact about approximately Normal distributions is that 68% of observations fall within one standard deviation of µ 95% fall within 2 standard deviations of µ 99.7% fall within 3 standard deviations of µ

17 Standard Normal Calculations The empirical rule is useful when an observation falls exactly 1,2,or 3 standard deviations from µ. When it doesn t, we must standardize the value {zscore} and use a table to calculate percentiles, etc. z = x! µ "

18 Assessing Normality To assess the normality of a set of data, we can t rely on the naked eye alone - not all mound shaped distributions are normal. Instead, we should make a Normal Quantile Plot and look for linearity. Linearity Normality


19 Chapter 3 Describing BiVariate Relationships In this chapter, we learned how to describe bivariate relationships. We focused on quantitative data and learned how to perform least squares regression.

20 Bivariate Relationships Like describing univariate data, the first thing you should do with bivariate data is make a plot. Scatterplot Note Strength, Direction, Form

21 Correlation r We can describe the strength of a linear relationship with the Correlation Coefficient, r -1! r! 1 The closer r is to 1 or -1, the stronger the linear relationship between x and y.

22 Least Squares Regression When we observe a linear relationship between x and y, we often want to describe it with a line of best fit y=a+bx. We can find this line by performing least-squares regression. We can use the resulting equation to predict y-values for given x- values.

23 Assessing the Fit If we hope to make useful predictions of y we must assess whether or not the LSRL is indeed the best fit. If not, we may need to find a different model. Residual Plot
24 Making Predictions If you are satisfied that the LSRL provides an appropriate model for predictions, you can use it to predict a y-hat for x s within the observed range of x-values. ŷ = a + bx Predictions for observed x-values can be assessed by noting the residual. Residual = observed y - predicted y

25 Chapter 3 Summary


26 Chapter 4 More BiVariate Relationships In this chapter, we learned how to find models that fit some nonlinear relationships. We also explored how to describe categorical relationships.
27 NonLinear Relationships If data is not best described by a LSRL, we may be able to find a Power or Exponential model that can be used for more accurate predictions. Power Model: Exponential Model: ˆ y =10 a x b y ˆ =10 a 10 bx
28 Transforming Data If (x,y) is non-linear, we can transform it to try to achieve a linear relationship. If transformed data appears linear, we can find a LSRL and then transform back to the original terms of the data (x, log y) LSRL > Exponential Model (log x, log y) LSRL > Power Model
29 The Question of Causation Just because we observe a strong relationship or strong correlation between x and y, we can not assume it is a causal relationship.


30 Relations in Categorical Data When categorical data is presented in a two-way table, we can explore the marginal and conditional distributions to describe the relationship between the variables.


31 Chapter 5 Producing Data In this chapter, we learned methods for collecting data through sampling and experimental design.
32 Sampling Design Our goal in statistics is often to answer a question about a population using information from a sample. Observational Study vs. Experiment There are a number of ways to select a sample. We must be sure the sample is representative of the population in question.
33 Sampling If you are performing an observational study, your sample can be obtained in a number of ways: Convenience - Cluster Systematic Simple Random Sample Stratified Random Sample

34 Experimental Design In an experiment, we impose a treatment with the hopes of establishing a causal relationship. Experiments exhibit 3 Principles Randomization Control Replication
35 Experimental Designs Like Observational Studies, Experiments can take a number of different forms: Completely Controlled Randomized Comparative Experiment Blocked Matched Pairs


36 Chapters 6-9 Tomorrow
Unit 1 Exploring and Understanding Data
 Unit 1 Exploring and Understanding Data Area Principle Bar Chart Boxplot Conditional Distribution Dotplot Empirical Rule Five Number Summary Frequency Distribution Frequency Polygon Histogram Interquartile
Understandable Statistics
 Understandable Statistics correlated to the Advanced Placement Program Course Description for Statistics Prepared for Alabama CC2 6/2003 2003 Understandable Statistics 2003 correlated to the Advanced Placement
Chapter 1: Exploring Data
 Chapter 1: Exploring Data Key Vocabulary:! individual! variable! frequency table! relative frequency table! distribution! pie chart! bar graph! two-way table! marginal distributions! conditional distributions!
2.75: 84% 2.5: 80% 2.25: 78% 2: 74% 1.75: 70% 1.5: 66% 1.25: 64% 1.0: 60% 0.5: 50% 0.25: 25% 0: 0%
 Capstone Test (will consist of FOUR quizzes and the FINAL test grade will be an average of the four quizzes). Capstone #1: Review of Chapters 1-3 Capstone #2: Review of Chapter 4 Capstone #3: Review of
CHAPTER 3 Describing Relationships
 CHAPTER 3 Describing Relationships 3.1 Scatterplots and Correlation The Practice of Statistics, 5th Edition Starnes, Tabor, Yates, Moore Bedford Freeman Worth Publishers Reading Quiz 3.1 True/False 1.
M 140 Test 1 A Name SHOW YOUR WORK FOR FULL CREDIT! Problem Max. Points Your Points Total 60
 M 140 Test 1 A Name SHOW YOUR WORK FOR FULL CREDIT! Problem Max. Points Your Points 1-10 10 11 3 12 4 13 3 14 10 15 14 16 10 17 7 18 4 19 4 Total 60 Multiple choice questions (1 point each) For questions
M 140 Test 1 A Name (1 point) SHOW YOUR WORK FOR FULL CREDIT! Problem Max. Points Your Points Total 75
 SHOW YOUR WORK FOR FULL CREDIT! Problem Max. Points Your Points Total 75") M 140 est 1 A Name (1 point) SHOW YOUR WORK FOR FULL CREDI! Problem Max. Points Your Points 1-10 10 11 10 12 3 13 4 14 18 15 8 16 7 17 14 otal 75 Multiple choice questions (1 point each) For questions
M 140 est 1 A Name (1 point) SHOW YOUR WORK FOR FULL CREDI! Problem Max. Points Your Points 1-10 10 11 10 12 3 13 4 14 18 15 8 16 7 17 14 otal 75 Multiple choice questions (1 point each) For questions
STATISTICS & PROBABILITY
 STATISTICS & PROBABILITY LAWRENCE HIGH SCHOOL STATISTICS & PROBABILITY CURRICULUM MAP 2015-2016 Quarter 1 Unit 1 Collecting Data and Drawing Conclusions Unit 2 Summarizing Data Quarter 2 Unit 3 Randomness
Still important ideas
 Readings: OpenStax - Chapters 1 13 & Appendix D & E (online) Plous Chapters 17 & 18 - Chapter 17: Social Influences - Chapter 18: Group Judgments and Decisions Still important ideas Contrast the measurement
SPRING GROVE AREA SCHOOL DISTRICT. Course Description. Instructional Strategies, Learning Practices, Activities, and Experiences.
 SPRING GROVE AREA SCHOOL DISTRICT PLANNED COURSE OVERVIEW Course Title: Basic Introductory Statistics Grade Level(s): 11-12 Units of Credit: 1 Classification: Elective Length of Course: 30 cycles Periods
Chapter 1. Picturing Distributions with Graphs
 Chapter 1 Picturing Distributions with Graphs Statistics Statistics is a science that involves the extraction of information from numerical data obtained during an experiment or from a sample. It involves
WDHS Curriculum Map Probability and Statistics. What is Statistics and how does it relate to you?
 WDHS Curriculum Map Probability and Statistics Time Interval/ Unit 1: Introduction to Statistics 1.1-1.3 2 weeks S-IC-1: Understand statistics as a process for making inferences about population parameters
Business Statistics Probability
 Business Statistics The following was provided by Dr. Suzanne Delaney, and is a comprehensive review of Business Statistics. The workshop instructor will provide relevant examples during the Skills Assessment
Readings: Textbook readings: OpenStax - Chapters 1 13 (emphasis on Chapter 12) Online readings: Appendix D, E & F
 Online readings: Appendix D, E & F") Readings: Textbook readings: OpenStax - Chapters 1 13 (emphasis on Chapter 12) Online readings: Appendix D, E & F Plous Chapters 17 & 18 Chapter 17: Social Influences Chapter 18: Group Judgments and Decisions
Readings: Textbook readings: OpenStax - Chapters 1 13 (emphasis on Chapter 12) Online readings: Appendix D, E & F Plous Chapters 17 & 18 Chapter 17: Social Influences Chapter 18: Group Judgments and Decisions
12.1 Inference for Linear Regression. Introduction
 12.1 Inference for Linear Regression vocab examples Introduction Many people believe that students learn better if they sit closer to the front of the classroom. Does sitting closer cause higher achievement,
Population. Sample. AP Statistics Notes for Chapter 1 Section 1.0 Making Sense of Data. Statistics: Data Analysis:
 Section 1.0 Making Sense of Data Statistics: Data Analysis: Individuals objects described by a set of data Variable any characteristic of an individual Categorical Variable places an individual into one
Describe what is meant by a placebo Contrast the double-blind procedure with the single-blind procedure Review the structure for organizing a memo
 Business Statistics The following was provided by Dr. Suzanne Delaney, and is a comprehensive review of Business Statistics. The workshop instructor will provide relevant examples during the Skills Assessment
Examining Relationships Least-squares regression. Sections 2.3
 Examining Relationships Least-squares regression Sections 2.3 The regression line A regression line describes a one-way linear relationship between variables. An explanatory variable, x, explains variability
10/4/2007 MATH 171 Name: Dr. Lunsford Test Points Possible
 Pledge: 10/4/2007 MATH 171 Name: Dr. Lunsford Test 1 100 Points Possible I. Short Answer and Multiple Choice. (36 points total) 1. Circle all of the items below that are measures of center of a distribution:
CP Statistics Sem 1 Final Exam Review
 Name: _ Period: ID: A CP Statistics Sem 1 Final Exam Review Multiple Choice Identify the choice that best completes the statement or answers the question. 1. A particularly common question in the study
Statistics is the science of collecting, organizing, presenting, analyzing, and interpreting data to assist in making effective decisions
 Readings: OpenStax Textbook - Chapters 1 5 (online) Appendix D & E (online) Plous - Chapters 1, 5, 6, 13 (online) Introductory comments Describe how familiarity with statistical methods can - be associated
AP STATISTICS 2010 SCORING GUIDELINES (Form B)
") AP STATISTICS 2010 SCORING GUIDELINES (Form B) Question 1 Intent of Question The primary goals of this question were to assess students ability to (1) compare three distributions of a quantitative variable;
AP STATISTICS 2010 SCORING GUIDELINES (Form B) Question 1 Intent of Question The primary goals of this question were to assess students ability to (1) compare three distributions of a quantitative variable;
Still important ideas
 Readings: OpenStax - Chapters 1 11 + 13 & Appendix D & E (online) Plous - Chapters 2, 3, and 4 Chapter 2: Cognitive Dissonance, Chapter 3: Memory and Hindsight Bias, Chapter 4: Context Dependence Still
What you should know before you collect data. BAE 815 (Fall 2017) Dr. Zifei Liu
 Dr. Zifei Liu") What you should know before you collect data BAE 815 (Fall 2017) Dr. Zifei Liu Zifeiliu@ksu.edu Types and levels of study Descriptive statistics Inferential statistics How to choose a statistical test
What you should know before you collect data BAE 815 (Fall 2017) Dr. Zifei Liu Zifeiliu@ksu.edu Types and levels of study Descriptive statistics Inferential statistics How to choose a statistical test
UNIVERSITY OF TORONTO SCARBOROUGH Department of Computer and Mathematical Sciences Midterm Test February 2016
 UNIVERSITY OF TORONTO SCARBOROUGH Department of Computer and Mathematical Sciences Midterm Test February 2016 STAB22H3 Statistics I, LEC 01 and LEC 02 Duration: 1 hour and 45 minutes Last Name: First Name:
Describe what is meant by a placebo Contrast the double-blind procedure with the single-blind procedure Review the structure for organizing a memo
 Please note the page numbers listed for the Lind book may vary by a page or two depending on which version of the textbook you have. Readings: Lind 1 11 (with emphasis on chapters 10, 11) Please note chapter
Identify two variables. Classify them as explanatory or response and quantitative or explanatory.
 OLI Module 2 - Examining Relationships Objective Summarize and describe the distribution of a categorical variable in context. Generate and interpret several different graphical displays of the distribution
Statistics is the science of collecting, organizing, presenting, analyzing, and interpreting data to assist in making effective decisions
 Readings: OpenStax Textbook - Chapters 1 5 (online) Appendix D & E (online) Plous - Chapters 1, 5, 6, 13 (online) Introductory comments Describe how familiarity with statistical methods can - be associated
Outline. Practice. Confounding Variables. Discuss. Observational Studies vs Experiments. Observational Studies vs Experiments
 1 2 Outline Finish sampling slides from Tuesday. Study design what do you do with the subjects/units once you select them? (OI Sections 1.4-1.5) Observational studies vs. experiments Descriptive statistics
Statistics and Probability
 Statistics and a single count or measurement variable. S.ID.1: Represent data with plots on the real number line (dot plots, histograms, and box plots). S.ID.2: Use statistics appropriate to the shape
Readings: Textbook readings: OpenStax - Chapters 1 11 Online readings: Appendix D, E & F Plous Chapters 10, 11, 12 and 14
 Readings: Textbook readings: OpenStax - Chapters 1 11 Online readings: Appendix D, E & F Plous Chapters 10, 11, 12 and 14 Still important ideas Contrast the measurement of observable actions (and/or characteristics)
STT315 Chapter 2: Methods for Describing Sets of Data - Part 2
 Chapter 2.5 Interpreting Standard Deviation Chebyshev Theorem Empirical Rule Chebyshev Theorem says that for ANY shape of data distribution at least 3/4 of all data fall no farther from the mean than 2
AP Stats Review for Midterm
 AP Stats Review for Midterm NAME: Format: 10% of final grade. There will be 20 multiple-choice questions and 3 free response questions. The multiple-choice questions will be worth 2 points each and the
bivariate analysis: The statistical analysis of the relationship between two variables.
 bivariate analysis: The statistical analysis of the relationship between two variables. cell frequency: The number of cases in a cell of a cross-tabulation (contingency table). chi-square (χ 2 ) test for
Chapter 3: Examining Relationships
 Name Date Per Key Vocabulary: response variable explanatory variable independent variable dependent variable scatterplot positive association negative association linear correlation r-value regression
Normal Distribution. Many variables are nearly normal, but none are exactly normal Not perfect, but still useful for a variety of problems.
 Review Probability: likelihood of an event Each possible outcome can be assigned a probability If we plotted the probabilities they would follow some type a distribution Modeling the distribution is important
Lecture Outline. Biost 517 Applied Biostatistics I. Purpose of Descriptive Statistics. Purpose of Descriptive Statistics
 Biost 517 Applied Biostatistics I Scott S. Emerson, M.D., Ph.D. Professor of Biostatistics University of Washington Lecture 3: Overview of Descriptive Statistics October 3, 2005 Lecture Outline Purpose
Table of Contents. Plots. Essential Statistics for Nursing Research 1/12/2017
 Essential Statistics for Nursing Research Kristen Carlin, MPH Seattle Nursing Research Workshop January 30, 2017 Table of Contents Plots Descriptive statistics Sample size/power Correlations Hypothesis
STATISTICS 8 CHAPTERS 1 TO 6, SAMPLE MULTIPLE CHOICE QUESTIONS
 STATISTICS 8 CHAPTERS 1 TO 6, SAMPLE MULTIPLE CHOICE QUESTIONS Circle the best answer. This scenario applies to Questions 1 and 2: A study was done to compare the lung capacity of coal miners to the lung
UF#Stats#Club#STA#2023#Exam#1#Review#Packet# #Fall#2013#
 UF#Stats#Club#STA##Exam##Review#Packet# #Fall## The following data consists of the scores the Gators basketball team scored during the 8 games played in the - season. 84 74 66 58 79 8 7 64 8 6 78 79 77
Describe what is meant by a placebo Contrast the double-blind procedure with the single-blind procedure Review the structure for organizing a memo
 Please note the page numbers listed for the Lind book may vary by a page or two depending on which version of the textbook you have. Readings: Lind 1 11 (with emphasis on chapters 5, 6, 7, 8, 9 10 & 11)
Biostatistics. Donna Kritz-Silverstein, Ph.D. Professor Department of Family & Preventive Medicine University of California, San Diego
 Biostatistics Donna Kritz-Silverstein, Ph.D. Professor Department of Family & Preventive Medicine University of California, San Diego (858) 534-1818 dsilverstein@ucsd.edu Introduction Overview of statistical
14.1: Inference about the Model
 14.1: Inference about the Model! When a scatterplot shows a linear relationship between an explanatory x and a response y, we can use the LSRL fitted to the data to predict a y for a given x. However,
STT 200 Test 1 Green Give your answer in the scantron provided. Each question is worth 2 points.
 STT 200 Test 1 Green Give your answer in the scantron provided. Each question is worth 2 points. For Questions 1 & 2: It is known that the distribution of starting salaries for MSU Education majors has
Chapter 14. Inference for Regression Inference about the Model 14.1 Testing the Relationship Signi!cance Test Practice
 Chapter 14 Inference for Regression Our!nal topic of the year involves inference for the regression model. In Chapter 3 we learned how to!nd the Least Squares Regression Line for a set of bivariate data.
AP Statistics Practice Test Ch. 3 and Previous
 AP Statistics Practice Test Ch. 3 and Previous Name Date Use the following to answer questions 1 and 2: A researcher measures the height (in feet) and volume of usable lumber (in cubic feet) of 32 cherry
Chapter 3: Describing Relationships
 Chapter 3: Describing Relationships Objectives: Students will: Construct and interpret a scatterplot for a set of bivariate data. Compute and interpret the correlation, r, between two variables. Demonstrate
Standard Scores. Richard S. Balkin, Ph.D., LPC-S, NCC
 Standard Scores Richard S. Balkin, Ph.D., LPC-S, NCC 1 Normal Distributions While Best and Kahn (2003) indicated that the normal curve does not actually exist, measures of populations tend to demonstrate
Chapter 4. More On Bivariate Data. More on Bivariate Data: 4.1: Transforming Relationships 4.2: Cautions about Correlation
 Chapter 4 More On Bivariate Data Chapter 3 discussed methods for describing and summarizing bivariate data. However, the focus was on linear relationships. In this chapter, we are introduced to methods
Part 1. For each of the following questions fill-in the blanks. Each question is worth 2 points.
 Part 1. For each of the following questions fill-in the blanks. Each question is worth 2 points. 1. The bell-shaped frequency curve is so common that if a population has this shape, the measurements are
CRITERIA FOR USE. A GRAPHICAL EXPLANATION OF BI-VARIATE (2 VARIABLE) REGRESSION ANALYSISSys
 REGRESSION ANALYSISSys") Multiple Regression Analysis 1 CRITERIA FOR USE Multiple regression analysis is used to test the effects of n independent (predictor) variables on a single dependent (criterion) variable. Regression tests
Multiple Regression Analysis 1 CRITERIA FOR USE Multiple regression analysis is used to test the effects of n independent (predictor) variables on a single dependent (criterion) variable. Regression tests
MULTIPLE REGRESSION OF CPS DATA
 MULTIPLE REGRESSION OF CPS DATA A further inspection of the relationship between hourly wages and education level can show whether other factors, such as gender and work experience, influence wages. Linear
Announcement. Homework #2 due next Friday at 5pm. Midterm is in 2 weeks. It will cover everything through the end of next week (week 5).
.") Announcement Homework #2 due next Friday at 5pm. Midterm is in 2 weeks. It will cover everything through the end of next week (week 5). Political Science 15 Lecture 8: Descriptive Statistics (Part 1) Data
Announcement Homework #2 due next Friday at 5pm. Midterm is in 2 weeks. It will cover everything through the end of next week (week 5). Political Science 15 Lecture 8: Descriptive Statistics (Part 1) Data
Methodological skills
 Methodological skills rma linguistics, week 3 Tamás Biró ACLC University of Amsterdam t.s.biro@uva.nl Tamás Biró, UvA 1 Topics today Parameter of the population. Statistic of the sample. Re: descriptive
1.4 - Linear Regression and MS Excel
 1.4 - Linear Regression and MS Excel Regression is an analytic technique for determining the relationship between a dependent variable and an independent variable. When the two variables have a linear
Basic Statistics 01. Describing Data. Special Program: Pre-training 1
 Basic Statistics 01 Describing Data Special Program: Pre-training 1 Describing Data 1. Numerical Measures Measures of Location Measures of Dispersion Correlation Analysis 2. Frequency Distributions (Relative)
INTERPRET SCATTERPLOTS
 Chapter2 MODELING A BUSINESS 2.1: Interpret Scatterplots 2.2: Linear Regression 2.3: Supply and Demand 2.4: Fixed and Variable Expenses 2.5: Graphs of Expense and Revenue Functions 2.6: Breakeven Analysis
LAB ASSIGNMENT 4 INFERENCES FOR NUMERICAL DATA. Comparison of Cancer Survival*
 LAB ASSIGNMENT 4 1 INFERENCES FOR NUMERICAL DATA In this lab assignment, you will analyze the data from a study to compare survival times of patients of both genders with different primary cancers. First,
Survey research (Lecture 1) Summary & Conclusion. Lecture 10 Survey Research & Design in Psychology James Neill, 2015 Creative Commons Attribution 4.
 Summary & Conclusion. Lecture 10 Survey Research & Design in Psychology James Neill, 2015 Creative Commons Attribution 4.") Summary & Conclusion Lecture 10 Survey Research & Design in Psychology James Neill, 2015 Creative Commons Attribution 4.0 Overview 1. Survey research 2. Survey design 3. Descriptives & graphing 4. Correlation
Summary & Conclusion Lecture 10 Survey Research & Design in Psychology James Neill, 2015 Creative Commons Attribution 4.0 Overview 1. Survey research 2. Survey design 3. Descriptives & graphing 4. Correlation
Survey research (Lecture 1)
") Summary & Conclusion Lecture 10 Survey Research & Design in Psychology James Neill, 2015 Creative Commons Attribution 4.0 Overview 1. Survey research 2. Survey design 3. Descriptives & graphing 4. Correlation
Summary & Conclusion Lecture 10 Survey Research & Design in Psychology James Neill, 2015 Creative Commons Attribution 4.0 Overview 1. Survey research 2. Survey design 3. Descriptives & graphing 4. Correlation
3. For a $5 lunch with a 55 cent ($0.55) tip, what is the value of the residual?
 tip, what is the value of the residual?") STATISTICS 216, SPRING 2006 Name: EXAM 1; February 21, 2006; 100 points. Instructions: Closed book. Closed notes. Calculator allowed. Double-sided exam. NO CELL PHONES. Multiple Choice (3pts each). Circle
STATISTICS 216, SPRING 2006 Name: EXAM 1; February 21, 2006; 100 points. Instructions: Closed book. Closed notes. Calculator allowed. Double-sided exam. NO CELL PHONES. Multiple Choice (3pts each). Circle
On the purpose of testing:
 Why Evaluation & Assessment is Important Feedback to students Feedback to teachers Information to parents Information for selection and certification Information for accountability Incentives to increase
Readings: Textbook readings: OpenStax - Chapters 1 4 Online readings: Appendix D, E & F Online readings: Plous - Chapters 1, 5, 6, 13
 Readings: Textbook readings: OpenStax - Chapters 1 4 Online readings: Appendix D, E & F Online readings: Plous - Chapters 1, 5, 6, 13 Introductory comments Describe how familiarity with statistical methods
In This Section An Introductory Example Obesity in America
 In This Section An Introductory Example Obesity in America Example 5: Estimating the Density of the Earth A Classical Study The Investigatory Process at Level C Formulating Questions Example 6: Linear
Chapter 3 CORRELATION AND REGRESSION
 CORRELATION AND REGRESSION TOPIC SLIDE Linear Regression Defined 2 Regression Equation 3 The Slope or b 4 The Y-Intercept or a 5 What Value of the Y-Variable Should be Predicted When r = 0? 7 The Regression
3.2A Least-Squares Regression
 3.2A Least-Squares Regression Linear (straight-line) relationships between two quantitative variables are pretty common and easy to understand. Our instinct when looking at a scatterplot of data is to
Biostatistics for Med Students. Lecture 1
 Biostatistics for Med Students Lecture 1 John J. Chen, Ph.D. Professor & Director of Biostatistics Core UH JABSOM JABSOM MD7 February 14, 2018 Lecture note: http://biostat.jabsom.hawaii.edu/education/training.html
List of Figures. List of Tables. Preface to the Second Edition. Preface to the First Edition
 List of Figures List of Tables Preface to the Second Edition Preface to the First Edition xv xxv xxix xxxi 1 What Is R? 1 1.1 Introduction to R................................ 1 1.2 Downloading and Installing
Further Mathematics 2018 CORE: Data analysis Chapter 3 Investigating associations between two variables
 Chapter 3: Investigating associations between two variables Further Mathematics 2018 CORE: Data analysis Chapter 3 Investigating associations between two variables Extract from Study Design Key knowledge
SCATTER PLOTS AND TREND LINES
 1 SCATTER PLOTS AND TREND LINES LEARNING MAP INFORMATION STANDARDS 8.SP.1 Construct and interpret scatter s for measurement to investigate patterns of between two quantities. Describe patterns such as
9 research designs likely for PSYC 2100
 9 research designs likely for PSYC 2100 1) 1 factor, 2 levels, 1 group (one group gets both treatment levels) related samples t-test (compare means of 2 levels only) 2) 1 factor, 2 levels, 2 groups (one
Quantitative Methods in Computing Education Research (A brief overview tips and techniques)
") Quantitative Methods in Computing Education Research (A brief overview tips and techniques) Dr Judy Sheard Senior Lecturer Co-Director, Computing Education Research Group Monash University judy.sheard@monash.edu
Quantitative Methods in Computing Education Research (A brief overview tips and techniques) Dr Judy Sheard Senior Lecturer Co-Director, Computing Education Research Group Monash University judy.sheard@monash.edu
Stepwise method Modern Model Selection Methods Quantile-Quantile plot and tests for normality
 Week 9 Hour 3 Stepwise method Modern Model Selection Methods Quantile-Quantile plot and tests for normality Stat 302 Notes. Week 9, Hour 3, Page 1 / 39 Stepwise Now that we've introduced interactions,
V. Gathering and Exploring Data
 V. Gathering and Exploring Data With the language of probability in our vocabulary, we re now ready to talk about sampling and analyzing data. Data Analysis We can divide statistical methods into roughly
Example The median earnings of the 28 male students is the average of the 14th and 15th, or 3+3
 Lecture 3 Nancy Pfenning Stats 1000 We learned last time how to construct a stemplot to display a single quantitative variable. A back-to-back stemplot is a useful display tool when we are interested in
Multiple Bivariate Gaussian Plotting and Checking
 Multiple Bivariate Gaussian Plotting and Checking Jared L. Deutsch and Clayton V. Deutsch The geostatistical modeling of continuous variables relies heavily on the multivariate Gaussian distribution. It
Chapter 1: Explaining Behavior
 Chapter 1: Explaining Behavior GOAL OF SCIENCE is to generate explanations for various puzzling natural phenomenon. - Generate general laws of behavior (psychology) RESEARCH: principle method for acquiring
Statistics: Making Sense of the Numbers
 Statistics: Making Sense of the Numbers Chapter 9 This multimedia product and its contents are protected under copyright law. The following are prohibited by law: any public performance or display, including
Choosing a Significance Test. Student Resource Sheet
 Choosing a Significance Test Student Resource Sheet Choosing Your Test Choosing an appropriate type of significance test is a very important consideration in analyzing data. If an inappropriate test is
Lesson 1: Distributions and Their Shapes
 Lesson 1 Name Date Lesson 1: Distributions and Their Shapes 1. Sam said that a typical flight delay for the sixty BigAir flights was approximately one hour. Do you agree? Why or why not? 2. Sam said that
Chapter 23. Inference About Means. Copyright 2010 Pearson Education, Inc.
 Chapter 23 Inference About Means Copyright 2010 Pearson Education, Inc. Getting Started Now that we know how to create confidence intervals and test hypotheses about proportions, it d be nice to be able
Reminders/Comments. Thanks for the quick feedback I ll try to put HW up on Saturday and I ll you
 Reminders/Comments Thanks for the quick feedback I ll try to put HW up on Saturday and I ll email you Final project will be assigned in the last week of class You ll have that week to do it Participation
11/18/2013. Correlational Research. Correlational Designs. Why Use a Correlational Design? CORRELATIONAL RESEARCH STUDIES
 Correlational Research Correlational Designs Correlational research is used to describe the relationship between two or more naturally occurring variables. Is age related to political conservativism? Are
10. LINEAR REGRESSION AND CORRELATION
 1 10. LINEAR REGRESSION AND CORRELATION The contingency table describes an association between two nominal (categorical) variables (e.g., use of supplemental oxygen and mountaineer survival ). We have
Medical Statistics 1. Basic Concepts Farhad Pishgar. Defining the data. Alive after 6 months?
 Medical Statistics 1 Basic Concepts Farhad Pishgar Defining the data Population and samples Except when a full census is taken, we collect data on a sample from a much larger group called the population.
Previously, when making inferences about the population mean,, we were assuming the following simple conditions:
 Chapter 17 Inference about a Population Mean Conditions for inference Previously, when making inferences about the population mean,, we were assuming the following simple conditions: (1) Our data (observations)
Pitfalls in Linear Regression Analysis
 Pitfalls in Linear Regression Analysis Due to the widespread availability of spreadsheet and statistical software for disposal, many of us do not really have a good understanding of how to use regression
AP Stats Chap 27 Inferences for Regression
 AP Stats Chap 27 Inferences for Regression Finally, we re interested in examining how slopes of regression lines vary from sample to sample. Each sample will have it s own slope, b 1. These are all estimates
Introduction to Statistical Data Analysis I
 Introduction to Statistical Data Analysis I JULY 2011 Afsaneh Yazdani Preface What is Statistics? Preface What is Statistics? Science of: designing studies or experiments, collecting data Summarizing/modeling/analyzing
Section 1.2 Displaying Quantitative Data with Graphs. Dotplots
 Section 1.2 Displaying Quantitative Data with Graphs Dotplots One of the simplest graphs to construct and interpret is a dotplot. Each data value is shown as a dot above its location on a number line.
Conditional Distributions and the Bivariate Normal Distribution. James H. Steiger
 Conditional Distributions and the Bivariate Normal Distribution James H. Steiger Overview In this module, we have several goals: Introduce several technical terms Bivariate frequency distribution Marginal
Averages and Variation
 Chapter 3 Averages and Variation Name Section 3.1 Measures of Central Tendency: Mode, Median, and Mean Objective: In this lesson you learned how to compute, interpret, and explain mean, median, and mode.
Undertaking statistical analysis of
 Descriptive statistics: Simply telling a story Laura Delaney introduces the principles of descriptive statistical analysis and presents an overview of the various ways in which data can be presented by
AP Psych - Stat 1 Name Period Date. MULTIPLE CHOICE. Choose the one alternative that best completes the statement or answers the question.
 AP Psych - Stat 1 Name Period Date MULTIPLE CHOICE. Choose the one alternative that best completes the statement or answers the question. 1) In a set of incomes in which most people are in the $15,000
STATISTICS AND RESEARCH DESIGN
 Statistics 1 STATISTICS AND RESEARCH DESIGN These are subjects that are frequently confused. Both subjects often evoke student anxiety and avoidance. To further complicate matters, both areas appear have
Statistics: A Brief Overview Part I. Katherine Shaver, M.S. Biostatistician Carilion Clinic
 Statistics: A Brief Overview Part I Katherine Shaver, M.S. Biostatistician Carilion Clinic Statistics: A Brief Overview Course Objectives Upon completion of the course, you will be able to: Distinguish
Summary & Conclusion. Lecture 10 Survey Research & Design in Psychology James Neill, 2016 Creative Commons Attribution 4.0
 Summary & Conclusion Lecture 10 Survey Research & Design in Psychology James Neill, 2016 Creative Commons Attribution 4.0 Overview 1. Survey research and design 1. Survey research 2. Survey design 2. Univariate
Chapter 4: More about Relationships between Two-Variables Review Sheet
 Review Sheet 4. Which of the following is true? A) log(ab) = log A log B. D) log(a/b) = log A log B. B) log(a + B) = log A + log B. C) log A B = log A log B. 5. Suppose we measure a response variable Y
Section 3.2 Least-Squares Regression
 Section 3.2 Least-Squares Regression Linear relationships between two quantitative variables are pretty common and easy to understand. Correlation measures the direction and strength of these relationships.
AP Psych - Stat 2 Name Period Date. MULTIPLE CHOICE. Choose the one alternative that best completes the statement or answers the question.
 AP Psych - Stat 2 Name Period Date MULTIPLE CHOICE. Choose the one alternative that best completes the statement or answers the question. 1) In a set of incomes in which most people are in the $15,000