Getting started with Eviews 9 (Volume IV)
|
|
|
- Ashley Perry
- 6 years ago
- Views:
Transcription
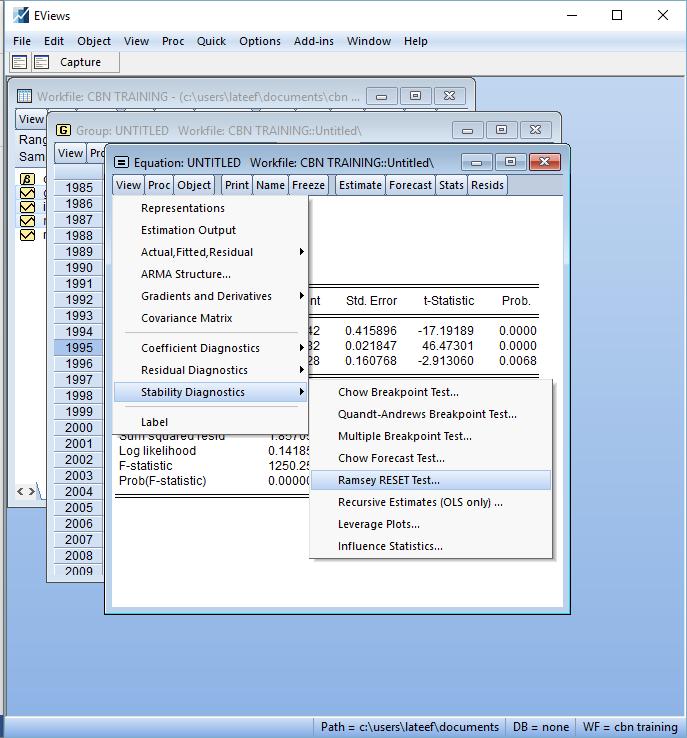
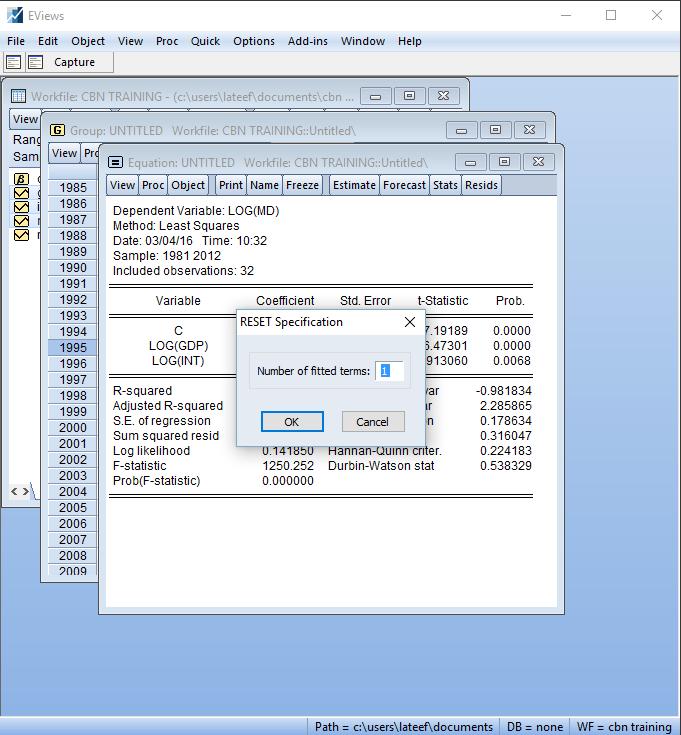
1 Getting started with Eviews 9 (Volume IV) Afees A. Salisu RESIDUAL DIAGNOSTICS Before drawing conclusions/policy inference from any of the above estimated regressions, it is important to perform relevant diagnostic tests to verify the validity of the classical linear regression models. The most critical of these assumptions are: Linearity: That there is a linear relationship between the dependent variable (MD) and the independent variables (GDP and INT).The violation of this assumption may imply that the model under consideration is non-linear or incorrectly specified. Homoscedasticity: Each disturbance term has the same finite variance. The violation of this assumption is an indication of the presence of heteroscedasticity in the model. Non-Autocorrelation: Each disturbance term is uncorrelated with other disturbance term. There is presence of autocorrelation if the assumption is violated. Normality: The disturbances are normally distributed. Its violation may imply non-normality of the error term. 5.1 Testing for Linearity in the Model The test is meant to ascertain whether the model is linear or it is correctly specified. To perform the test, select Views/Stability Diagnostic and then click OK on the RESET Specification. 1 Contacts: Department of Economics, Federal University of Agriculture, Abeokuta, Nigeria & Centre for Econometric & Allied Research, University of Ibadan, Ibadan, Nigeria. salisuaa@funaab.edu.ng; aa.salisu@cear.org.ng. Research assistance by Lateef Akanni and Kazeem Isah is acknowledged. 1
2 2

3 The result above shows that the model is not correctly specified. 5.2 Testing for the presence of Serial Correlation Is there evidence of autocorrelation problem in the estimated model? To answer this, EViews provides us with several methods of testing for the presence of serial correlation. The two common residual tests of serial correlation are Correlograms- Q-Statistics and the Breusch-Godfrey LM tests. To perform any of these tests, let us consider the following double log regression results; 3


4 A quick glance at the results reveals that the coefficients are statistically significant and the goodness of fit is very high. However, if the error term is serially correlated, the estimated OLS standard errors are inefficient which consequently renders the statistical inferences invalid Correlograms-Q-Statistics To ascertain the validity or otherwise of the estimates via Q-Statistics, from the regression results above, select View/Residual Diagnostics/Correlogram-Q-statistics and enter the maximum lag order of serial correlation to be tested (say 5) in the Lag Specification dialog then Click OK. 4


5 EViews will display (as shown below) an Autocorrelation and Partial autocorrelation functions of the residuals as well as Ljung- Box Q-statistics for high-order serial correlation. If there is no serial correlation, then, all the Q-statistics should be insignificant. In other words, there is no serial correlation, if the pvalues are greater than

6 The Q-statistics are significant at all lags, indicating significant serial correlation in the residuals. That is, there is presence of serial correlation Breusch-Godfrey Serial Correlation LM Test To ascertain the validity or otherwise of the estimates via LM Test Statistics, select View/Residual Diagnostics/Serial Correlation LM Test. Again, enter the highest order of serial correlation to be tested in the Lag Specification dialog (i.e. as previously demonstrated) then Click OK. The results would appear as below: 6

7 The null hypothesis of the test is that there is no serial correlation in the residuals up to the specified lag order. EViews reports a statistic labeled "F-statistic" and "Obs*R-squared" statistic. Consequently, both statistics for the LM test reject the hypothesis of no serial correlation up to lag order five. Note also that both the Q-statistic and the LM test indicate that the residuals are serially correlated. The implication of this finding is that the regression results cannot be interpreted in their present form because of invalid statistical inferences. How do we resolve this problem? This will be addressed later. 5.3 Testing for the presence of Heteroscedasticity Again, the homoscedasticity assumption must be satisfied for the regression results to be valid. Therefore, testing for the presence of heteroscedasticity in a linear regression model is inevitable. EViews allows you to employ a number of different heteroscedasticity tests namely, Harvey, Glejser, ARCH, White and Breusch-Pagan-Godfrey. Since they are post-estimation tests, they are performed on the regression results. Using Eviews, from the estimation output, select View/Residual Diagnostics/Heteroscedasticity Tests. The following dialog box comes up. 7


8 Choose the default option by clicking on Breusch-Pagan- Godfreyin the Test type box. Click OK and the following results would appear; To further validate the robustness of this result, we may explore any of the alternative heteroscedasticity tests (i.e. ARCH LM test) from the list of Test Types using similar procedure as follows: The result seems to suggest otherwise and since the ARCH LM test is more powerful; the result of the latter is more reliable and therefore, conclusion should be based on the ARCH-LM test. 8


9 5.4 Normality Test Similar to other residual based tests discussed thus far, the normality test is performed on the double log results. To perform the test, select View/Residual Diagnostic/Histogram Normality-Test as shown below: The result shows that the regression residual is normally distributed since the Pv is greater than
10 All along, we have continued to assume that all the series are stationary (that is, the order of integration of each of the series is zero, I(0)) 2. If we relax this assumption and consequently allow for unit roots in the variables, how do we deal with such a scenario? In general, this would require a different treatment from a conventional regression with stationary variables at I(0), which has been covered so far. Don t worry; we shall consider the estimation procedure for nonstationary series. 2 Note that the order of integration of each series in a regression model is determined by the unit root test. If the series is stationary at level after performing unit root test, then it is I(0); otherwise it is I(d) where d represents the number of times the series is differenced before it becomes stationary. 10
Example 7.2. Autocorrelation. Pilar González and Susan Orbe. Dpt. Applied Economics III (Econometrics and Statistics)
") Example 7.2 Autocorrelation Pilar González and Susan Orbe Dpt. Applied Economics III (Econometrics and Statistics) Pilar González and Susan Orbe OCW 2014 Example 7.2. Autocorrelation 1 / 17 Questions.
Example 7.2 Autocorrelation Pilar González and Susan Orbe Dpt. Applied Economics III (Econometrics and Statistics) Pilar González and Susan Orbe OCW 2014 Example 7.2. Autocorrelation 1 / 17 Questions.
INTRODUCTION TO ECONOMETRICS (EC212)
") INTRODUCTION TO ECONOMETRICS (EC212) Course duration: 54 hours lecture and class time (Over three weeks) LSE Teaching Department: Department of Economics Lead Faculty (session two): Dr Taisuke Otsu and
INTRODUCTION TO ECONOMETRICS (EC212) Course duration: 54 hours lecture and class time (Over three weeks) LSE Teaching Department: Department of Economics Lead Faculty (session two): Dr Taisuke Otsu and
MEA DISCUSSION PAPERS
 Inference Problems under a Special Form of Heteroskedasticity Helmut Farbmacher, Heinrich Kögel 03-2015 MEA DISCUSSION PAPERS mea Amalienstr. 33_D-80799 Munich_Phone+49 89 38602-355_Fax +49 89 38602-390_www.mea.mpisoc.mpg.de
One-Way Independent ANOVA
 One-Way Independent ANOVA Analysis of Variance (ANOVA) is a common and robust statistical test that you can use to compare the mean scores collected from different conditions or groups in an experiment.
NPTEL Project. Econometric Modelling. Module 14: Heteroscedasticity Problem. Module 16: Heteroscedasticity Problem. Vinod Gupta School of Management
 1 P age NPTEL Project Econometric Modelling Vinod Gupta School of Management Module 14: Heteroscedasticity Problem Module 16: Heteroscedasticity Problem Rudra P. Pradhan Vinod Gupta School of Management
IS BEER CONSUMPTION IN IRELAND ACYCLICAL?
 IS BEER CONSUMPTION IN IRELAND ACYCLICAL? GEARÓID GIBBS Senior Sophister In this econometric investigation, Gearóid Gibbs examines beer consumption in Ireland and its relation to the business cycle. Citing
EC352 Econometric Methods: Week 07
 EC352 Econometric Methods: Week 07 Gordon Kemp Department of Economics, University of Essex 1 / 25 Outline Panel Data (continued) Random Eects Estimation and Clustering Dynamic Models Validity & Threats
Problem set 2: understanding ordinary least squares regressions
 Problem set 2: understanding ordinary least squares regressions September 12, 2013 1 Introduction This problem set is meant to accompany the undergraduate econometrics video series on youtube; covering
Marno Verbeek Erasmus University, the Netherlands. Cons. Pros
 Marno Verbeek Erasmus University, the Netherlands Using linear regression to establish empirical relationships Linear regression is a powerful tool for estimating the relationship between one variable
Daniel Boduszek University of Huddersfield
 Daniel Boduszek University of Huddersfield d.boduszek@hud.ac.uk Introduction to Correlation SPSS procedure for Pearson r Interpretation of SPSS output Presenting results Partial Correlation Correlation
Dr. Kelly Bradley Final Exam Summer {2 points} Name
 {2 points} Name You MUST work alone no tutors; no help from classmates. Email me or see me with questions. You will receive a score of 0 if this rule is violated. This exam is being scored out of 00 points.
Problem Set 3 ECN Econometrics Professor Oscar Jorda. Name. ESSAY. Write your answer in the space provided.
 Problem Set 3 ECN 140 - Econometrics Professor Oscar Jorda Name ESSAY. Write your answer in the space provided. 1) Sir Francis Galton, a cousin of James Darwin, examined the relationship between the height
Citation for published version (APA): Ebbes, P. (2004). Latent instrumental variables: a new approach to solve for endogeneity s.n.
: Ebbes, P. (2004). Latent instrumental variables: a new approach to solve for endogeneity s.n.") University of Groningen Latent instrumental variables Ebbes, P. IMPORTANT NOTE: You are advised to consult the publisher's version (publisher's PDF) if you wish to cite from it. Please check the document
University of Groningen Latent instrumental variables Ebbes, P. IMPORTANT NOTE: You are advised to consult the publisher's version (publisher's PDF) if you wish to cite from it. Please check the document
Various Approaches to Szroeter s Test for Regression Quantiles
 The International Scientific Conference INPROFORUM 2017, November 9, 2017, České Budějovice, 361-365, ISBN 978-80-7394-667-8. Various Approaches to Szroeter s Test for Regression Quantiles Jan Kalina,
Testing the Predictability of Consumption Growth: Evidence from China
 Auburn University Department of Economics Working Paper Series Testing the Predictability of Consumption Growth: Evidence from China Liping Gao and Hyeongwoo Kim Georgia Southern University and Auburn
Two-Way Independent ANOVA
 Two-Way Independent ANOVA Analysis of Variance (ANOVA) a common and robust statistical test that you can use to compare the mean scores collected from different conditions or groups in an experiment. There
Final Exam - section 2. Thursday, December hours, 30 minutes
 Econometrics, ECON312 San Francisco State University Michael Bar Fall 2011 Final Exam - section 2 Thursday, December 15 2 hours, 30 minutes Name: Instructions 1. This is closed book, closed notes exam.
Carrying out an Empirical Project
 Carrying out an Empirical Project Empirical Analysis & Style Hint Special program: Pre-training 1 Carrying out an Empirical Project 1. Posing a Question 2. Literature Review 3. Data Collection 4. Econometric
Daniel Boduszek University of Huddersfield
 Daniel Boduszek University of Huddersfield d.boduszek@hud.ac.uk Introduction to Multiple Regression (MR) Types of MR Assumptions of MR SPSS procedure of MR Example based on prison data Interpretation of
Ec331: Research in Applied Economics Spring term, Panel Data: brief outlines
 Ec331: Research in Applied Economics Spring term, 2014 Panel Data: brief outlines Remaining structure Final Presentations (5%) Fridays, 9-10 in H3.45. 15 mins, 8 slides maximum Wk.6 Labour Supply - Wilfred
Intro to SPSS. Using SPSS through WebFAS
 Intro to SPSS Using SPSS through WebFAS http://www.yorku.ca/computing/students/labs/webfas/ Try it early (make sure it works from your computer) If you need help contact UIT Client Services Voice: 416-736-5800
Pitfalls in Linear Regression Analysis
 Pitfalls in Linear Regression Analysis Due to the widespread availability of spreadsheet and statistical software for disposal, many of us do not really have a good understanding of how to use regression
BIOL 458 BIOMETRY Lab 7 Multi-Factor ANOVA
 BIOL 458 BIOMETRY Lab 7 Multi-Factor ANOVA PART 1: Introduction to Factorial ANOVA ingle factor or One - Way Analysis of Variance can be used to test the null hypothesis that k or more treatment or group
Analysis of Variance (ANOVA) Program Transcript
 Program Transcript") Analysis of Variance (ANOVA) Program Transcript DR. JENNIFER ANN MORROW: Welcome to Analysis of Variance. My name is Dr. Jennifer Ann Morrow. In today's demonstration, I'll review with you the definition
Analysis of Variance (ANOVA) Program Transcript DR. JENNIFER ANN MORROW: Welcome to Analysis of Variance. My name is Dr. Jennifer Ann Morrow. In today's demonstration, I'll review with you the definition
Session 1: Dealing with Endogeneity
 Niehaus Center, Princeton University GEM, Sciences Po ARTNeT Capacity Building Workshop for Trade Research: Behind the Border Gravity Modeling Thursday, December 18, 2008 Outline Introduction 1 Introduction
Economics 345 Applied Econometrics
 Economics 345 Applied Econometrics Lab Exam Version 1: Solutions Fall 2016 Prof: Martin Farnham TAs: Joffré Leroux Rebecca Wortzman Last Name (Family Name) First Name Student ID Open EViews, and open the
Adjustment Guidelines for Autocorrelated Processes Based on Deming s Funnel Experiment
 Australian Journal of Basic and Applied Sciences, 4(6): 1031-1035, 2010 ISSN 1991-8178 Adjustment Guidelines for Autocorrelated Processes Based on Deming s Funnel Experiment Karin Kandananond Faculty of
THE WAGE EFFECTS OF PERSONAL SMOKING
 THE WAGE EFFECTS OF PERSONAL SMOKING MICHELLE RIORDAN Senior Sophister It is well established that smoking is bad for both your lungs and your wallet, but could it also affect your payslip? Michelle Riordan
USING STATCRUNCH TO CONSTRUCT CONFIDENCE INTERVALS and CALCULATE SAMPLE SIZE
 USING STATCRUNCH TO CONSTRUCT CONFIDENCE INTERVALS and CALCULATE SAMPLE SIZE Using StatCrunch for confidence intervals (CI s) is super easy. As you can see in the assignments, I cover 9.2 before 9.1 because
Simple Linear Regression the model, estimation and testing
 Simple Linear Regression the model, estimation and testing Lecture No. 05 Example 1 A production manager has compared the dexterity test scores of five assembly-line employees with their hourly productivity.
Validity, Reliability and Classical Assumptions
 , Reliability and Classical Assumptions Presented by Mahendra AN Sources: www-psych.stanford.edu/~bigopp/.ppt http://ets.mnsu.edu/darbok/ethn402-502/reliability.ppt http://5martconsultingbandung.blogspot.com/2011/01/uji-asumsi-klasik.html
Preliminary Report on Simple Statistical Tests (t-tests and bivariate correlations)
") Preliminary Report on Simple Statistical Tests (t-tests and bivariate correlations) After receiving my comments on the preliminary reports of your datasets, the next step for the groups is to complete
Preliminary Report on Simple Statistical Tests (t-tests and bivariate correlations) After receiving my comments on the preliminary reports of your datasets, the next step for the groups is to complete
MULTIPLE LINEAR REGRESSION 24.1 INTRODUCTION AND OBJECTIVES OBJECTIVES
 24 MULTIPLE LINEAR REGRESSION 24.1 INTRODUCTION AND OBJECTIVES In the previous chapter, simple linear regression was used when you have one independent variable and one dependent variable. This chapter
Your Task: Find a ZIP code in Seattle where the crime rate is worse than you would expect and better than you would expect.
 Forensic Geography Lab: Regression Part 1 Payday Lending and Crime Seattle, Washington Background Regression analyses are in many ways the Gold Standard among analytic techniques for undergraduates (and
Ordinary Least Squares Regression
 Ordinary Least Squares Regression March 2013 Nancy Burns (nburns@isr.umich.edu) - University of Michigan From description to cause Group Sample Size Mean Health Status Standard Error Hospital 7,774 3.21.014
Chapter 10: Moderation, mediation and more regression
 Chapter 10: Moderation, mediation and more regression Smart Alex s Solutions Task 1 McNulty et al. (2008) found a relationship between a person s Attractiveness and how much Support they give their partner
Bayesian Confidence Intervals for Means and Variances of Lognormal and Bivariate Lognormal Distributions
 Bayesian Confidence Intervals for Means and Variances of Lognormal and Bivariate Lognormal Distributions J. Harvey a,b, & A.J. van der Merwe b a Centre for Statistical Consultation Department of Statistics
Chapter 11: Advanced Remedial Measures. Weighted Least Squares (WLS)
") Chapter : Advanced Remedial Measures Weighted Least Squares (WLS) When the error variance appears nonconstant, a transformation (of Y and/or X) is a quick remedy. But it may not solve the problem, or it
Chapter : Advanced Remedial Measures Weighted Least Squares (WLS) When the error variance appears nonconstant, a transformation (of Y and/or X) is a quick remedy. But it may not solve the problem, or it
Daniel Boduszek University of Huddersfield
 Daniel Boduszek University of Huddersfield d.boduszek@hud.ac.uk Introduction to Multinominal Logistic Regression SPSS procedure of MLR Example based on prison data Interpretation of SPSS output Presenting
Online Appendix. According to a recent survey, most economists expect the economic downturn in the United
 Online Appendix Part I: Text of Experimental Manipulations and Other Survey Items a. Macroeconomic Anxiety Prime According to a recent survey, most economists expect the economic downturn in the United
Session 3: Dealing with Reverse Causality
 Principal, Developing Trade Consultants Ltd. ARTNeT Capacity Building Workshop for Trade Research: Gravity Modeling Thursday, August 26, 2010 Outline Introduction 1 Introduction Overview Endogeneity and
Dan Byrd UC Office of the President
 Dan Byrd UC Office of the President 1. OLS regression assumes that residuals (observed value- predicted value) are normally distributed and that each observation is independent from others and that the
Midterm STAT-UB.0003 Regression and Forecasting Models. I will not lie, cheat or steal to gain an academic advantage, or tolerate those who do.
 Midterm STAT-UB.0003 Regression and Forecasting Models The exam is closed book and notes, with the following exception: you are allowed to bring one letter-sized page of notes into the exam (front and
Sample Exam Paper Answer Guide
 Sample Exam Paper Answer Guide Notes This handout provides perfect answers to the sample exam paper. I would not expect you to be able to produce such perfect answers in an exam. So, use this document
What is Multilevel Modelling Vs Fixed Effects. Will Cook Social Statistics
 What is Multilevel Modelling Vs Fixed Effects Will Cook Social Statistics Intro Multilevel models are commonly employed in the social sciences with data that is hierarchically structured Estimated effects
Score Tests of Normality in Bivariate Probit Models
 Score Tests of Normality in Bivariate Probit Models Anthony Murphy Nuffield College, Oxford OX1 1NF, UK Abstract: A relatively simple and convenient score test of normality in the bivariate probit model
WDHS Curriculum Map Probability and Statistics. What is Statistics and how does it relate to you?
 WDHS Curriculum Map Probability and Statistics Time Interval/ Unit 1: Introduction to Statistics 1.1-1.3 2 weeks S-IC-1: Understand statistics as a process for making inferences about population parameters
Assessing Studies Based on Multiple Regression. Chapter 7. Michael Ash CPPA
 Assessing Studies Based on Multiple Regression Chapter 7 Michael Ash CPPA Assessing Regression Studies p.1/20 Course notes Last time External Validity Internal Validity Omitted Variable Bias Misspecified
Limited dependent variable regression models
 181 11 Limited dependent variable regression models In the logit and probit models we discussed previously the dependent variable assumed values of 0 and 1, 0 representing the absence of an attribute and
Fundamental Clinical Trial Design
 Design, Monitoring, and Analysis of Clinical Trials Session 1 Overview and Introduction Overview Scott S. Emerson, M.D., Ph.D. Professor of Biostatistics, University of Washington February 17-19, 2003
Unit 1 Exploring and Understanding Data
 Unit 1 Exploring and Understanding Data Area Principle Bar Chart Boxplot Conditional Distribution Dotplot Empirical Rule Five Number Summary Frequency Distribution Frequency Polygon Histogram Interquartile
Stepwise method Modern Model Selection Methods Quantile-Quantile plot and tests for normality
 Week 9 Hour 3 Stepwise method Modern Model Selection Methods Quantile-Quantile plot and tests for normality Stat 302 Notes. Week 9, Hour 3, Page 1 / 39 Stepwise Now that we've introduced interactions,
Exam 2 Solutions: Monday, April 2 8:30-9:50 AM
 Amherst College Department of Economics Economics 360 Spring 2012 Name: Exam 2 Solutions: Monday, April 2 8:30-9:50 AM Cigarette Consumption Data: Cross section of per capita cigarette consumption and
(C) Jamalludin Ab Rahman
 Jamalludin Ab Rahman") SPSS Note The GLM Multivariate procedure is based on the General Linear Model procedure, in which factors and covariates are assumed to have a linear relationship to the dependent variable. Factors. Categorical
SPSS Note The GLM Multivariate procedure is based on the General Linear Model procedure, in which factors and covariates are assumed to have a linear relationship to the dependent variable. Factors. Categorical
A NON-TECHNICAL INTRODUCTION TO REGRESSIONS. David Romer. University of California, Berkeley. January Copyright 2018 by David Romer
 A NON-TECHNICAL INTRODUCTION TO REGRESSIONS David Romer University of California, Berkeley January 2018 Copyright 2018 by David Romer CONTENTS Preface ii I Introduction 1 II Ordinary Least Squares Regression
Section 6: Analysing Relationships Between Variables
 6. 1 Analysing Relationships Between Variables Section 6: Analysing Relationships Between Variables Choosing a Technique The Crosstabs Procedure The Chi Square Test The Means Procedure The Correlations
Problem #1 Neurological signs and symptoms of ciguatera poisoning as the start of treatment and 2.5 hours after treatment with mannitol.
 Ho (null hypothesis) Ha (alternative hypothesis) Problem #1 Neurological signs and symptoms of ciguatera poisoning as the start of treatment and 2.5 hours after treatment with mannitol. Hypothesis: Ho:
7 Statistical Issues that Researchers Shouldn t Worry (So Much) About
 About") 7 Statistical Issues that Researchers Shouldn t Worry (So Much) About By Karen Grace-Martin Founder & President About the Author Karen Grace-Martin is the founder and president of The Analysis Factor.
7 Statistical Issues that Researchers Shouldn t Worry (So Much) About By Karen Grace-Martin Founder & President About the Author Karen Grace-Martin is the founder and president of The Analysis Factor.
Problem Set 5 ECN 140 Econometrics Professor Oscar Jorda. DUE: June 6, Name
 Problem Set 5 ECN 140 Econometrics Professor Oscar Jorda DUE: June 6, 2006 Name 1) Earnings functions, whereby the log of earnings is regressed on years of education, years of on-the-job training, and
Multiple Linear Regression Analysis
 Revised July 2018 Multiple Linear Regression Analysis This set of notes shows how to use Stata in multiple regression analysis. It assumes that you have set Stata up on your computer (see the Getting Started
Analyzing binary outcomes, going beyond logistic regression
 Analyzing binary outcomes, going beyond logistic regression 2018 EHE Forum presentation James O. Uanhoro Department of Educational Studies Premise Obtaining relative risk using Poisson regression Obtaining
Chapter 9: Comparing two means
 Chapter 9: Comparing two means Smart Alex s Solutions Task 1 Is arachnophobia (fear of spiders) specific to real spiders or will pictures of spiders evoke similar levels of anxiety? Twelve arachnophobes
Influence of overweight and obesity on the diabetes in the world on adult people using spatial regression
 International Journal of Advances in Intelligent Informatics ISSN: 2442-6571 149 Influence of overweight and obesity on the diabetes in the world on adult people using spatial regression Tuti Purwaningsih
Bootstrapping Residuals to Estimate the Standard Error of Simple Linear Regression Coefficients
 Bootstrapping Residuals to Estimate the Standard Error of Simple Linear Regression Coefficients Muhammad Hasan Sidiq Kurniawan 1) 1)* Department of Statistics, Universitas Islam Indonesia hasansidiq@uiiacid
Econometrics II - Time Series Analysis
 University of Pennsylvania Economics 706, Spring 2008 Econometrics II - Time Series Analysis Instructor: Frank Schorfheide; Room 525, McNeil Building E-mail: schorf@ssc.upenn.edu URL: http://www.econ.upenn.edu/
Meta-Analysis and Publication Bias: How Well Does the FAT-PET-PEESE Procedure Work?
 Meta-Analysis and Publication Bias: How Well Does the FAT-PET-PEESE Procedure Work? Nazila Alinaghi W. Robert Reed Department of Economics and Finance, University of Canterbury Abstract: This study uses
Chapter Eight: Multivariate Analysis
 Chapter Eight: Multivariate Analysis Up until now, we have covered univariate ( one variable ) analysis and bivariate ( two variables ) analysis. We can also measure the simultaneous effects of two or
MULTIPLE REGRESSION OF CPS DATA
 MULTIPLE REGRESSION OF CPS DATA A further inspection of the relationship between hourly wages and education level can show whether other factors, such as gender and work experience, influence wages. Linear
10. LINEAR REGRESSION AND CORRELATION
 1 10. LINEAR REGRESSION AND CORRELATION The contingency table describes an association between two nominal (categorical) variables (e.g., use of supplemental oxygen and mountaineer survival ). We have
The Effect of Guessing on Item Reliability
 The Effect of Guessing on Item Reliability under Answer-Until-Correct Scoring Michael Kane National League for Nursing, Inc. James Moloney State University of New York at Brockport The answer-until-correct
Simple Linear Regression One Categorical Independent Variable with Several Categories
 Simple Linear Regression One Categorical Independent Variable with Several Categories Does ethnicity influence total GCSE score? We ve learned that variables with just two categories are called binary
Step 3 Tutorial #3: Obtaining equations for scoring new cases in an advanced example with quadratic term
 Step 3 Tutorial #3: Obtaining equations for scoring new cases in an advanced example with quadratic term DemoData = diabetes.lgf, diabetes.dat, data5.dat We begin by opening a saved 3-class latent class
Inference with Difference-in-Differences Revisited
 Inference with Difference-in-Differences Revisited M. Brewer, T- F. Crossley and R. Joyce Journal of Econometric Methods, 2018 presented by Federico Curci February 22nd, 2018 Brewer, Crossley and Joyce
Applied Quantitative Methods II
 Applied Quantitative Methods II Lecture 7: Endogeneity and IVs Klára Kaĺıšková Klára Kaĺıšková AQM II - Lecture 7 VŠE, SS 2016/17 1 / 36 Outline 1 OLS and the treatment effect 2 OLS and endogeneity 3 Dealing
MULTIPLE OLS REGRESSION RESEARCH QUESTION ONE:
 1 MULTIPLE OLS REGRESSION RESEARCH QUESTION ONE: Predicting State Rates of Robbery per 100K We know that robbery rates vary significantly from state-to-state in the United States. In any given state, we
The Pretest! Pretest! Pretest! Assignment (Example 2)
") The Pretest! Pretest! Pretest! Assignment (Example 2) May 19, 2003 1 Statement of Purpose and Description of Pretest Procedure When one designs a Math 10 exam one hopes to measure whether a student s ability
The Pretest! Pretest! Pretest! Assignment (Example 2) May 19, 2003 1 Statement of Purpose and Description of Pretest Procedure When one designs a Math 10 exam one hopes to measure whether a student s ability
Chapter Eight: Multivariate Analysis
 Chapter Eight: Multivariate Analysis Up until now, we have covered univariate ( one variable ) analysis and bivariate ( two variables ) analysis. We can also measure the simultaneous effects of two or
Doing Quantitative Research 26E02900, 6 ECTS Lecture 6: Structural Equations Modeling. Olli-Pekka Kauppila Daria Kautto
 Doing Quantitative Research 26E02900, 6 ECTS Lecture 6: Structural Equations Modeling Olli-Pekka Kauppila Daria Kautto Session VI, September 20 2017 Learning objectives 1. Get familiar with the basic idea
Research Methods in Forest Sciences: Learning Diary. Yoko Lu December Research process
 Research Methods in Forest Sciences: Learning Diary Yoko Lu 285122 9 December 2016 1. Research process It is important to pursue and apply knowledge and understand the world under both natural and social
6. Unusual and Influential Data
 Sociology 740 John ox Lecture Notes 6. Unusual and Influential Data Copyright 2014 by John ox Unusual and Influential Data 1 1. Introduction I Linear statistical models make strong assumptions about the
2 Assumptions of simple linear regression
 Simple Linear Regression: Reliability of predictions Richard Buxton. 2008. 1 Introduction We often use regression models to make predictions. In Figure?? (a), we ve fitted a model relating a household
Confidence Intervals On Subsets May Be Misleading
 Journal of Modern Applied Statistical Methods Volume 3 Issue 2 Article 2 11-1-2004 Confidence Intervals On Subsets May Be Misleading Juliet Popper Shaffer University of California, Berkeley, shaffer@stat.berkeley.edu
A Study of the Spatial Distribution of Suicide Rates
 A Study of the Spatial Distribution of Suicide Rates Ferdinand DiFurio, Tennessee Tech University Willis Lewis, Winthrop University With acknowledgements to Kendall Knight, GA, Tennessee Tech University
Write your identification number on each paper and cover sheet (the number stated in the upper right hand corner on your exam cover).
.") STOCKHOLM UNIVERSITY Department of Economics Course name: Empirical methods 2 Course code: EC2402 Examiner: Per Pettersson-Lidbom Number of credits: 7,5 credits Date of exam: Sunday 21 February 2010 Examination
STOCKHOLM UNIVERSITY Department of Economics Course name: Empirical methods 2 Course code: EC2402 Examiner: Per Pettersson-Lidbom Number of credits: 7,5 credits Date of exam: Sunday 21 February 2010 Examination
Instructions for doing two-sample t-test in Excel
 Instructions for doing two-sample t-test in Excel (1) If you do not see Data Analysis in the menu, this means you need to use Add-ins and make sure that the box in front of Analysis ToolPak is checked.
Statistical Techniques. Masoud Mansoury and Anas Abulfaraj
 Statistical Techniques Masoud Mansoury and Anas Abulfaraj What is Statistics? https://www.youtube.com/watch?v=lmmzj7599pw The definition of Statistics The practice or science of collecting and analyzing
Infrastructure Development and Economic Growth Nexus in Nigeria
 Infrastructure Development and Economic Growth Nexus in Nigeria Owolabi-Merus, O School of Business, Economics and Law, University of New England, Armidale, NSW, 2351, Australia Email: oowolabimerus@gmail.com
The Linear Regression Model Under Test
 Walter Kramer Harald Sonnberger The Linear Regression Model Under Test Physica-Verlag Heidelberg Wien Professor Dr. WALTER KRAMER, Fachbereich Wirtschaftswissenschaften, UniversWit Hannover, Wunstorfer
Lessons in biostatistics
 Lessons in biostatistics The test of independence Mary L. McHugh Department of Nursing, School of Health and Human Services, National University, Aero Court, San Diego, California, USA Corresponding author:
SUMMER 2011 RE-EXAM PSYF11STAT - STATISTIK
 SUMMER 011 RE-EXAM PSYF11STAT - STATISTIK Full Name: Årskortnummer: Date: This exam is made up of three parts: Part 1 includes 30 multiple choice questions; Part includes 10 matching questions; and Part
HS Exam 1 -- March 9, 2006
 Please write your name on the back. Don t forget! Part A: Short answer, multiple choice, and true or false questions. No use of calculators, notes, lab workbooks, cell phones, neighbors, brain implants,
Chapter 19: Categorical outcomes: chi-square and loglinear analysis
 Chapter 19: Categorical outcomes: chi-square and loglinear analysis Labcoat Leni s Real Research The impact of sexualized images on women s self-evaluations Problem Daniels, E., A. (2012). Journal of Applied
Theory-Test Paradigm. 1 of 7. w w min w c D L
 Proposal (due 29 Mar) Dependent Variable - what will be explained Independent Variables - data to assemble o Define it o Report the source for the data o Describe hypothesis that will be tested with the
Lecture 14: Adjusting for between- and within-cluster covariates in the analysis of clustered data May 14, 2009
 Measurement, Design, and Analytic Techniques in Mental Health and Behavioral Sciences p. 1/3 Measurement, Design, and Analytic Techniques in Mental Health and Behavioral Sciences Lecture 14: Adjusting
Stat Wk 9: Hypothesis Tests and Analysis
 Stat 342 - Wk 9: Hypothesis Tests and Analysis Crash course on ANOVA, proc glm Stat 342 Notes. Week 9 Page 1 / 57 Crash Course: ANOVA AnOVa stands for Analysis Of Variance. Sometimes it s called ANOVA,
STA 3024 Spring 2013 EXAM 3 Test Form Code A UF ID #
 STA 3024 Spring 2013 Name EXAM 3 Test Form Code A UF ID # Instructions: This exam contains 34 Multiple Choice questions. Each question is worth 3 points, for a total of 102 points (there are TWO bonus
LAB ASSIGNMENT 4 INFERENCES FOR NUMERICAL DATA. Comparison of Cancer Survival*
 LAB ASSIGNMENT 4 1 INFERENCES FOR NUMERICAL DATA In this lab assignment, you will analyze the data from a study to compare survival times of patients of both genders with different primary cancers. First,
Two-Way Independent Samples ANOVA with SPSS
 Two-Way Independent Samples ANOVA with SPSS Obtain the file ANOVA.SAV from my SPSS Data page. The data are those that appear in Table 17-3 of Howell s Fundamental statistics for the behavioral sciences
Entering HIV Testing Data into EvaluationWeb
 Entering HIV Testing Data into EvaluationWeb User Guide Luther Consulting, LLC July, 2014/v2.2 All rights reserved. Table of Contents Introduction... 3 Accessing the CTR Form... 4 Overview of the CTR Form...
F1: Introduction to Econometrics
 F1: Introduction to Econometrics Feng Li Department of Statistics, Stockholm University General information Homepage of this course: http://gauss.stat.su.se/gu/ekonometri.shtml Lecturer F1 F7: Feng Li,