INTERVENTIONAL PHYSICAL AND OCCUPATIONAL THERAPY SERVICES AND MOTOR COORDINATION AMONG LOW BIRTH WEIGHT INFANTS. Stephanie Elaine Watkins
|
|
|
- Amberlynn Phillips
- 6 years ago
- Views:
Transcription
1 INTERVENTIONAL PHYSICAL AND OCCUPATIONAL THERAPY SERVICES AND MOTOR COORDINATION AMONG LOW BIRTH WEIGHT INFANTS Stephanie Elaine Watkins A dissertation submitted to the faculty of the University of North Carolina at Chapel Hill in partial fulfillment of the requirements for the degree of Doctorate of Philosophy in the Department of Epidemiology, Gillings School of Public Health. Chapel Hill 2012 Approved by: Julie Daniels PhD Michele Jonsson-Funk PhD Alan Brookhart PhD Michael O Shea MD, MPH Steven A. Rosenberg PhD
2 Abstract STEPHANIE ELAINE WATKINS: Interventional Physical and Occupational Therapy Services and Motor Coordination among Low Birth Weight Infants (Under the direction of Julie Daniels) Introduction: Children born very low birth weight (VLBW) have an increased risk of impaired preschool motor coordination, which may have negative effects on the child s mental and physical health. Physical and occupational therapy services are suggested to attenuate the negative effects of poor preschool coordination. We estimated the effect of physical and occupational therapy services delivered in early childhood on preschool motor coordination among VLBW children. To control for confounding, we implemented propensity score (PS) methods estimated using traditional logistic regression (LR) and tree based methods. Methods: Using the Early Childhood Longitudinal Study Birth Cohort (ECLS-B) we estimated the effect of therapy on: skipping eight consecutive steps, hopping five times, standing on one leg for ten seconds, walking backwards six steps on a line, jumping distance, and change in jumping distance from preschool to kindergarten. We estimated the PS using random forest classification, bagging, and a single tree using the R statistical program and with LR in SAS 9.2. Using linear regression, we modeled the estimated effect of therapy on the distance that the child jumped. We weighted the adjusted models using inverse probability of treatment weights estimated from all four ii
3 methods. We modeled all other end points as stated using LR. Results: Approximately 500 children were VLBW. RF and Bagging produced the best covariate balance between treatment groups (MSD 0.07, 0.03). The single classification tree produced the worst covariate balance (MDS 0.18). When estimating the PS with RF, treated VLBW children were 2.39 times as likely to successfully skipping eight steps (OR: 2.39, 95% CI: 0.75, 7.51) compared to the untreated group. Treated children jumped an additional 1.79 inches (95% CI: ) further and were also 52% (OR: 1.52, 95% CI: 0.51, 4.54) more likely to successfully complete the backwards walking task. There was little effect of therapy on other endpoints. Effect estimates were similar among models weighted with RF, bagging, and LR. Conclusion: Providing therapy to VLBW children, may improve the child s school age motor coordination. RF is a useful method to improve covariate balance when estimating the PS and to potentially reduce bias in observational studies. iii
4 TABLE OF CONTENTS List of Tables vi List of Figures viii Chapter I. BACKGROUND AND SIGNIFICANCE. 1 Statement of Specific Aims. 1 Motor Development in Low Birth Weight Infants 6 Early Intervention 9 Theoretical Foundation of Physical and Occupational Therapy. 10 Present State of the Literature 12 Early Intervention and Motor Outcomes among Low Birth Weight Children 12 Physical or Occupational Therapy and Motor Outcomes among LBW children. 14 Estimating Effects in Observational Data 17 II. METHODS.. 20 Data Source. 20 Exposure Assessment. 23 Outcome Assessment 24 Study Design. 29 Analysis Plan. 32 iv
5 Sources of Bias. 40 Power Calculations.. 43 III. PRELIMINARY ANALYSES 45 Variable description and coding. 45 Descriptive analysis: low birth weight cohort.. 51 Exploration of confounding 52 Building the propensity score. 55 Refined VLBW cohort: Crude and Standard Outcome Models 58 Missing Data IV. PHYSICAL AND OCCUPATIONAL THERAPY SERVICES AND MOTOR COORDINATION AMONG CHILDREN BORN VERY LOW BIRTH WEIGHT.. 61 V. AN ILLUSTRATION OF ENSEMBLE METHODS FOR PROPENSITY SCORE ESTIMATION: PHYSICAL AND OCCUPATIONAL THERAPY SERVICES AND PRESCHOOL AGE MOTOR ABILITY 81 VI. DISCUSSION.. 99 APPENDICES. 114 REFERENCES 175 v
6 LIST OF TABLES Table 1. Literature review: Skilled OT/PT and Motor Outcomes Literature review: Other interventions and Motor Outcomes Sample sizes for receipt of services: ECLS B Characteristics of low birth weight cohort Candidate variables for predictors of therapy services Variable importance in predicting preschool motor impairment Marginal relationship between covariates and therapy receipt Modeling covariates and therapy/preschool motor ability Change in estimate Candidate variables for propensity score model Sensitivity of effect estimates to propensity score model Association between receipt of physical and occupational therapy and early childhood motor performance among VLBW children: Average Treatment Effect, Crude and Standard Models Descriptive statistics of VLBW children by receipt of therapy services between nine months and age two Standardized differences among confounders Receipt of physical and occupational therapy and early childhood and preschool motor performance among VLBW children: Average Treatment Effect 142 vi
7 16. Sensitivity Analysis: Overlapping propensity scores and propensity scores trimmed contrary to prediction Out of bag error rates for prediction of receipt of early childhood therapy Distribution of propensity score/weights for the average treatment effect by method used to generate the propensity score Standardize differences among confounders by estimation method Average treatment effect of interventional physical or occupational therapy services and preschool motor skills: using three methods to estimate the propensity for treatment 149 vii
8 LIST OF FIGURES Figures 1. Motor Pathways Exposure Time Line Study Design Directed Acyclic Graph Power Analysis Flow Diagram of VLBW sample Variable Importance of Therapy Receipt Partial Dependence Plot: BSF-R and Motor Impairment Partial Dependence Plot: Birth weight and Motor Impairment Partial Dependence Plot: SES and Motor Impairment Partial Dependence Plot: Gestational Age and Motor Impairment Partial Dependence Plot: Hospital stay and Motor Impairment Partial Dependence Plot: Gestational Age and Therapy Receipt Partial Dependence Plot: Birth weight and Therapy Receipt Partial Dependence Plot: BSF-R Motor T Score and Therapy Receipt Partial Dependence Plot: APGAR and Therapy Receipt Partial Dependence Plot: SES and Therapy Receipt Partial Dependence Plot: CESD and Therapy Receipt. 162 viii
9 19. Partial Dependence Plot: Childcare hours and Therapy Receipt Partial Dependence Plot: KIDI score and Therapy Receipt Plot: odds ratios and 95% CI: Birth weight and Pre-K motor impairment Plot: odds ratios and 95% CI: Cruising and Pre-K motor impairment Plot: odds ratios and 95% CI: Hospital days and Pre-K motor impairment Plot: odds ratios and 95% CI: BSF-R Motor T score and Pre-K motor impairment Plot: odds ratios and 95% CI: APGAR scores and Pre-K motor impairment Plot: odds ratios and 95% CI:SES scale and Pre-K motor impairment Directed Acyclic Graph: Enumerated Pathways 171 ix
10 Chapter 1 BACKGROUND AND SIGNIFICANCE Statement of Specific Aims Since the 1980 s, rates of infants born with low birth weight (LBW) have increased in the United States. In 2010, approximately 8.2% of all births were LBW and 1.5% of all births were very low birth weight (VLBW). 1 Approximately 10% of children who are low birth weight exhibit severe neurological impairments including abnormalities in tone, transitional movement, and persistence of primitive reflexes. 2,3 However many low birth weight children only experience minor neurological impairments. Children born VLBW without notable neurological deficits often show an initial delay in foundational motor skills. However, these children often catch up to children of normal birth weight during the first few years of life. Although they typically attain foundational motor milestones, at school age these children are challenged to learn new motor tasks involving balance and coordination. They may appear clumsy or awkward and have difficulty with daily activities and classroom skills such as tying shoes or participating in physical education. 4 Poor 1
11 motor coordination in childhood has a negative effect on the child s mental and physical health with persists into adolescence. 5,6-9 In the absence of a neurological or medical diagnosis, these symptoms are described as developmental coordination disorder (DCD). 10 The prevalence of DCD among VLBW/very preterm infants has been reported to be as high as 72%. Children born with VLBW are six times as likely to develop DCD than children born with normal birth weight. 10 To attenuate the potential negative sequelae of poor childhood motor coordination, early intervention (EI) by physical and occupational therapists is recommended. 10 EI is a federal program providing interventional services to infants and toddlers to improve outcomes for children with developmental disabilities. Specifically, physical and occupational therapists often treat low birth weight children to improve function and to minimize morbidity during childhood. In the published literature, few studies have examined the efficacy of interventional physical and occupational therapy services on school age motor skills of low birth weight children. Previous research comprises a heterogeneous group of studies where small groups of preterm and low birth weight infants are typically randomized to neurodevelopmental treatment or typical care. The majority of the studies evaluate interventional effects within the first twelve months of life with variability in both intensity of treatment and length of follow up. In a population of VLBW infants without neurological involvement, two small randomized studies assessed the effect of occupational therapy and 2
12 physical therapy during the first year of life on motor ability in childhood. 11,12 Neither trial found a statistically significant difference in standardized motor scores between treatment groups. However, among children born of normal birth weight, interventions promoting motor development appear to improve children s locomotor ability. 13 Little is known regarding the efficacy of physical and occupational therapy on childhood motor coordination. Observational data are available to evaluate this relationship, yet research analyzing the effect of a treatment on an outcome in non-randomized studies is complicated by exposure group differences on measured and unmeasured characteristics associated with the outcome of interest. Propensity scores ( the predicted probability of treatment given a set of measured covariates) are a commonly used method to control for confounding when estimating the average treatment effect in observational studies, yet there are few guidelines in the literature regarding how to estimate the propensity score. 14 Logistic regression is frequently used, yet the model must conform to the assumption of linearity between ordinal and continuous covariates and the logit of the dependent variable. Furthermore the joint effect between independent variables in the model must be considered, as well as the functional form of covariates or interaction terms. 15 Violations can result in misspecification of the propensity score model and the resulting effect estimate may be biased. 16 3
13 Tree based methods, including Bagging and Random Forest classification (RFC), are non-parametric methods derived from learning based algorithms which offer robust alternative strategies for generating predicted probabilities of treatment. 17,18 Yet, these methods are underutilized in the literature. Using the Early Childhood Longitudinal Study Birth Cohort (ECLS-B) (N 1,150), this study will estimate the association between receipt of interventional physical and occupational therapy services and motor coordination during preschool and school age developmental periods in a population of children born VLBW. Furthermore, we will consider the use of novel methods, propensity score estimation using tree based methods, to control for confounders in these data. Specific Aim 1: In a population of very low birth weight children, we will estimate the effect of early childhood physical and occupational therapy services on preschool age motor coordination. Specific AIM 2: We will illustrate two novel methods, random forest classification and bagging, to estimate the predicted probability of receiving early childhood physical or occupational therapy. We will compare these methods with other tree based methods as well as logistic regression with regard to covariate balance, bias, and precision of the estimated effect of therapy on preschool motor performance. 4
14 Overview Since the 1980 s, rates of infants born with low birth weight (LBW) have increased in the United States. In 2010, approximately 8.2% of all births were LBW and 1.5% of all births were very low birth weight (VLBW). 1 Approximately 67% of low birth weight babies are also born preterm. 19 Low birth weight children are at risk for long term morbidity and developmental disability. 20,21 Especially among LBW infants who are also born preterm, these infants may experience major disturbances during a period of rapid brain growth which may result in abnormalities in tone and movement patterns. 22 These babies may have a poor ability to assume flexion and frequently maintain patterns of extension. These abnormal movement patterns often lead to delays in unsupported sitting and trunk rotation which in turn affects fine motors skills, behavior, and cognition. 23 A small percentage of VLBW children ( 10%) suffer from these severe neurological impairments that affect posture and movement. Yet, a large proportion experience only minor motor difficulties with complex movement later in development. 2,3 These impairments in motor coordination may have negative effects on the child s self-esteem and level of physical activity which may persist into adolescence
15 To minimize dysfunction and disability among children born LBW, early intervention programs are often implemented. Early Intervention is a federal program that delivers services to infants and toddlers through three years of age. 24 Physical therapy, occupational therapy, and speech therapy are services directly delivered to the child and the family. These services are frequently referred to as interventional therapy services. I. Motor Development in Low Birth Weight and Preterm Infants Over the last twenty years, a large body of research explored impairments in motor development among low birth weight and preterm children. Since a large percentage of low birth weight children are also preterm, we consider the implications of both factors on motor development. 19 Impairments in motor ability not only affect a child s ability to move about their environment but also handwriting, behavior, and cognitive performance Movement is a child s connectivity to the world. It is through exploration of their environment that children learn. The degree of impairment among children born low birth weight can be quite variable. Some children in this population exhibit severe motor delays with little independent movement, where other children experience milder delays in motor coordination. Approximately 10% of low birth weight preterm children develop cerebral palsy; a disorder of posture and movement. 2,29-31 These children have abnormalities in tone and transitional movement with persistence of primitive reflexes. Abnormalities in motor control lead to delays in motor milestone 6
16 attainment and functional ability. Typically these motor abnormalities are associated with perinatal brain hypoxia, ischemia, infection, intraventricular hemorrhage, and periventricular leukomalacia. 3 However, not all low birth weight preterm children develop such severe impairments in motor function. Many children who are born low birth weight show only minor or no obvious neurological impairments. Children that are born low birth weight perform more poorly on assessments of motor performance compared to children of normal birth weight. Furthermore, their motor performance appears to decline with increasing prematurity. 32 Between 1992 and 2009, over 24 studies examined motor development among very low birth weight and very preterm children. When compared to a normative sample, VLBW and very preterm children scored lower on the psychomotor developmental index (PDI) of the Bayley II. These children were on average 0.88 standard deviations behind their typically developing peers (95% CI to -0.80). 33 When researchers examined the PDI score for children with adverse perinatal complications, the effect size decreased further (0.51 SD). 33 VLBW and very preterm children also demonstrate difficulty with higher level motor skills of balance and coordination. These soft signs of motor impairments are often seen in school age children. 34 Researchers commonly evaluate level of impairment using one of the most recognized instruments of motor performance; The Movement Assessment Battery for Children. Compared 7
17 to their full term peers, very low birth weight or very preterm children consistently have a higher overall impairment score. Moreover, they scored lower on the following subscales: balls skills; balance skills; and manual dexterity. 33,35 Children exhibited the greatest deficit in balance skills. Compared to a normative sample, children in this population also have lower motor proficiency scores in running speed, agility, coordination, strength, and dexterity. 33 Although initially delayed, very preterm and very low birth weight children exhibited a catch up effect in early childhood. Yet, they exhibited a deficit in more complex motor tasks, as measured by the Movement Assessment Battery for Children, as they moved into school age and adolescence. 33 The divergence of skills began to appear at age five as children entered into elementary school. Children with delays and difficulty in motor coordination may be described as having Developmental Coordination Disorder (DCD). This condition is described as marked impairment in the development of motor coordination among children without a known neurological or medical condition which describes their incoordination. 36 Symptoms of the condition are often first noticed during preschool when the child first attempts to learn movement requiring balance and coordination. Prior to preschool, the majority of these children were meeting normal developmental milestones. 4 Children with this condition have difficulty with new motor tasks and execution of coordinated movement. These children often avoid activities which require bilateral balance and coordination. Children with DCD are at risk for low academic performance, low self-esteem, 8
18 and limited participation in physical activity. 37 Very low birth weight children are 6 times as likely to have DCD when compared to their normal birth weight peers. 10 II. Early intervention Early intervention physical and occupational therapy services are recommended to facilitate motor control among low birth weight children who are at risk for delays in gross motor skills. Early intervention describes a group of services and programs, provided to children with developmental delays, to improve their functional ability. In 1986, under the Individual with Disabilities Education Act, the United States Congress passed Public Law mandating the provision of infant and toddler early intervention services. These early intervention services are called Part C. 24 Part C intervention programs are multidisciplinary statewide programs which operate within the guidelines set by the federal government. Specific eligibility criteria are set by each state. Part C programs provide services for children from birth to age three. Children generally qualify if they have documented impairments in one or more of the following developmental areas: motor, cognitive, adaptive, communicative, social, or emotional. Early intervention offers a diversity of family and child programs. Trained professionals provide screening and assessments of the child as well as a long list of developmental services. Common services include the following interventions: physical therapy, occupational therapy, and speech therapy. These services are typically provided at no cost. 9
19 III. Theoretical Foundation of Physical and Occupational Therapy Both physical and occupational therapists frequently focus their treatment on facilitation of normal movement patterns as well as posture and refined motor control. Treatment is grounded in the theory of neural plasticity. Theoretically, the brain has the ability to reorganize neural pathways based on new experiences. This concept is referred to as neural plasticity and is the foundation for delivery of early developmental therapy. Animal models have established that new experiences allow for reorganization of cortical maps. In the first few years of life, although the majority of neurons have been formed, individual experiences drive modulation of neuronal death, stabilization of synapses, axonal reorientation, and budding of axonal dendrites. 38 Thus, early interventional services have the potential to reorganize neuronal pathways to improve functional outcomes. In human movement the cerebral cortex, cerebellum, basal ganglia, brain stem, and spinal cord are the main neuronal structures guiding motor control. Specifically, the frontal lobe of the cerebral cortex contains the premotor cortex, the motor cortex, and the supplemental motor cortex regions. Through complex interactions with other regions of the central nervous system, these structures guide and execute voluntary movement. The cerebellum assists with coordination and timing of movement while the basal ganglia modulates higher and lower brain functions
20 Figure 1. Motor Pathways Reprinted from: PIEK JP. Infant Motor Development. In: Wright JP, ed. Champaign, IL: Human Kinetics, Research suggests developmental and environmental stimulation can affect neuronal cell formation as well as organization of synaptic connections in the brain over the lifespan Merzenich and colleagues investigated the plasticity of the brain by mapping the topographical orientation of the fingers in the cortex. When two fingers were amputated, the location of those digits was eventually taken over by the palm and adjacent fingers. Furthermore, when monkeys were taught to pick up food with the tips of their fingers the corresponding cortical brain region enlarged. 44 These studies suggest that structures are not hard wired for a given function. Therefore, we hypothesize that environmental/developmental stimulation of low birth weight children has the potential to alter motor performance. 11
21 IV. Present State of the Literature Early intervention and Motor Outcomes among LBW children Services delivered to improve developmental outcomes, specifically motor ability, typically include two theoretical types of programs. Programs, in general, either deliver treatment directly to the child to facilitate motor milestone attainment or provide education to the families to facilitate infant child interaction. Services delivered directly to the child to improve motor outcomes are typically provided by licensed physical or occupational therapists. Facilitation of gross motor outcomes falls within the scope of practice for both disciplines. These services are referred to as interventional therapy services. Over the past twenty years, a substantial number of randomized controlled trials evaluated the effect of early intervention services on development among low birth weight children. These studies included direct interventional therapy, mother child interventions, and developmental education curricula. To date, two large trials reported positive effects of early interventions services on neurodevelopment. 45,46 Presently in the United States, the Infant Health and Development Program is the largest randomized controlled trial. This program was implemented in the mid-1980s to evaluate the effect of early intervention on cognitive competence, behavioral competence, and health status of low birth weight preterm infants. Researchers randomized approximately 1,000 infants to 12
22 receive learning activities in a child developmental center and in the home. Parents also participated in regular support group meetings. At thirty six months, children in the intervention group had significantly higher mean IQ scores. 45 Moreover, the effects of the educational curricula varied by maternal and infant characteristics. Among the heavier babies, Stanford Binet scores were significantly higher in the intervention group compared to the control group. Researchers also observed a small statistically significant behavioral advantage among babies with less educated mothers. The results did not show any difference in serious medical conditions between the two groups. 45 In the United Kingdom, the Avon Premature Infant Project evaluated the effect of developmental education and parent advice on neurodevelopment. Three hundred premature infants less than 33 weeks were randomly assigned to developmental education, social support, or usual care. These interventions were implemented from hospital discharge until age two. At twenty four months the results showed, for all three groups, no statistically significant difference in the mean Griffith Mental Developmental score. However, the results did show a statistically significant interaction by birth weight and presence of brain lesions. Among, children with abnormal cranial ultrasounds (hemorrhagic or ischemic lesions) or who were very low birth weight (<1251 grams), the intervention had a statistically significant beneficial effect. This effect was not observed among heavier infants. 46 These two large trials describe the effect of parent education programs on overall development in low birth weight toddlers. Although physical and 13
23 occupational therapy services were not directly implemented in these trials, the results suggest that early intervention services delivered before the age of two may have positive effects on development. The period between birth and age two may be a critical time window for neuroplasticity among subgroups of low birth weight children. Several smaller randomized trials (N 50) evaluated the effect of similar parent child programs on gross motor development among low birth weight toddlers. 47,48 Both interventions involved mother child interactions where the parent promoted perceptual, cognitive, and motor skills. At approximately three years of age, children of parents who were trained in these developmental techniques had higher mean Bayley scores in eye hand coordination, personal, social, and practical reasoning skills. 48 Furthermore, children who received parent led motor control techniques has a statistically significant improvement in object control compared to children with usual care (Table 1). 47 Physical or Occupational Therapy and Motor Outcomes among LBW children In the published literature, there are multiple small randomized trials that specifically evaluated the effect of physical, occupational, or physiotherapy services on motor outcomes in low birth weight children. 11,12,49-57 These trials began in the mid nineteen eighties with the majority of these studies evaluating the effect of treatment before one year of age with follow up at two years of age. The randomized trials published to date had small sample sizes of approximately 150 children. The largest randomized trial evaluating the effect of 14
24 pediatric physical therapy included one hundred and seventy six babies less than 32 weeks or less than 1,500 grams. The smallest trial included only nineteen infants. At study entry, researchers often assigned infants a neurodevelopmental score and stratified infants into three categories: normal, at risk, and neurologically impaired. Infants were then randomized to either interventional physical/occupational therapy or normal care within each stratum. Therapy was usually initiated within three months of age (chronological age) and treatment continued through twelve months. Motor skills were typically assessed using the following norm referenced standardized instruments: Bayley Scales of Infant Development, and the Griffiths Mental Developmental Scale. The frequency of treatment across these studies was highly variable and ranged from one sixty minute session per week to one treatment session per month and anywhere in between. 11,49-53,57 Overall, several studies found no statistically significant difference in the Griffith developmental quotient or locomotor subscale scores at one year for at risk or normal low birth weight infants. 12,49,50 However, between one and two years of age, the effect of interventional therapy appeared to vary by specific infant characteristics. Overall, at sixteen months of age, children receiving the intervention who were born with low birth weight did not demonstrate a statically significant improvement in their mean Bayley psychomotor score. Yet, infants who were less than 1500 grams at birth showed greater gains in their Bayley mental score than infants between 1500 and 2000 grams at birth. 51 At age two, children in this population who received six to eight sessions of pediatric physical 15
25 therapy had an increase of 6.4 points on the Bayley psychomotor scale after adjusting for perinatal and background variables. Moreover, in subgroup analyses, these researchers found improvements in both motor and mental outcomes among children with a history of bronchopulmonary dysplasia and biological and social risk factors for preterm birth. 57 One study in a Turkish population evaluated the effect of physical therapy intervention on actual age of motor milestone achievement. These authors recruited a small sample of 160 infants less than 34 weeks gestation and 2,000 grams from the Hacettepe University Hospital in Turkey. Infants were stratified into two groups: those with perinatal hypoxia or abnormal neurosonography, and infants without any risk other than prematurity. Researchers randomized the low risk infants into an interventional pediatric therapy group (N=78) or a control group (N=76). Children received approximately 17 therapy sessions between birth and two years of age. Over the course of follow up, researchers reported no statistically significant differences in age of motor milestone achievement between these two groups. 55 The literature evaluating the efficacy of occupational and physical therapy services on motor performance among preschool age low birth weight children is sparse. In a meta-analysis of preschool age children of normal birth weight, interventions that promoted motor skills appeared to improve early childhood object control and locomotor skills. 13 However, two small randomized studies evaluating the effect of physical therapy and occupational therapy, delivered before twelve months of age did not find a statistically significant difference in 16
26 school age motor scores compared to controls. 11,12 These studies evaluated therapy services in a small population (< 100 children) of VLBW children without neurological problems (Table 2). Presently, in the published literature, the majority of studies evaluated the effect of interventional therapy services delivered during the first year of life. The focus of treatment during this developmental window was most likely on fluidity of movement and independent transitions with pre ambulatory skills including head control, independent sitting, crawling, and walking with support. However, research evaluating the effect of therapy between one and two years of age and motor ability in later childhood is extremely limited. Therapy delivered during the toddler years may include facilitation of foundational skills of ambulation, strengthening, coordination, and balance. This type of treatment may more directly carry over into improvement in more complex movement patterns. V. Estimating Effects in Observational Data Observational data are publically available to evaluate the effect of interventional therapy on school age motor performance. However, use of these data is complicated by differences in measured and unmeasured characteristics that are independently associated with motor performance. Propensity scores are commonly used to control for confounding in observational studies. The propensity score is the predicted probability of receiving treatment given a set of measured confounders. 14 Subjects with the 17
27 same probability of receiving treatment have similar values of measured characteristics which are independently associated with the outcome. Once one conditions on the propensity score, any difference in the distribution of measured covariates between treatment groups should be from chance alone. Currently, there are few studies to guide the researcher on how to estimate the propensity score. Logistic regression is commonly used to estimate the propensity score; however the model is subject to several assumptions. The model assumes a linear relationship between continuous and ordinal variables and the logit of the dependent variable. Moreover one must consider the joint effect of variables. Inclusion of only main effects may misspecify the model and the resulting effect estimate may be biased. Yet, it appears in the published literature, that few researchers consider interactions or the functional form of the variable. 58 Regression tree based methods, including Bagging and Random Forest classification (RFC), are non-parametric methods derived from learning based algorithms which offer alternative strategies for generating predicted probabilities of treatment. The methods use a series of classification trees to estimate the average probability of membership in a given class. These techniques have been suggested to have improved predictive accuracy when compared to classical statistical techniques. 59 For example, in simulation studies, regardless of nonlinearity or non additivity, random forest performed well in terms of covariate balance between treatment groups and may result in further reduction in bias of the effect estimate when compared to traditional logistic regression. 17,18 18
28 The large nationally representative cohort proposed for this study, ECLS - B, provides nationally representative data regarding receipt of interventional therapy between nine months and two years of age and motor development through kindergarten. These data will allow us to explore the association between receipt of services and motor development during the preschool and school age developmental periods. 19
29 Chapter 2 METHODS Data Source We will address the specific aims of this study using existing data from the United States Early Childhood Longitudinal Study Birth Cohort. I. Early Childhood Longitudinal Study, Birth Cohort (ECLS-B) Overview The ECLS- B is a nationally representative longitudinal cohort of children born in the year 2001 who were followed through kindergarten. The study was sponsored by the United States Department of Education and the National Center for Education Statistics. Researchers obtained information on children s physical, social, emotional, and cognitive development as well as health and education over the child s early developmental years. Research Design and Sampling The ECLS-B is a longitudinal cohort study which followed children from nine months of age through kindergarten. Researchers collected data by both questionnaire and direct assessment at four time points: nine months ( ), age two ( ), age four (preschool: 2005), and kindergarten ( ). 20
30 In 2001, the study team randomly sampled 13,500 newborns from United States birth certificates. Asian, Pacific Islander, and Chinese children were oversampled. Researchers also oversampled twins as well children who were born low birth weight. At the nine month time point, approximately 10,700 children and their parents participated in data collection. At two years of age, approximately 9,850 children remained in the study. Data Collection Researchers collected information on APGAR test scores, parental background, and other child health information from the birth certificate records. Information on a child s cognitive, social, emotional, and physical development were collected from children s families, child care providers, and teachers. Questionnaires: At each wave of data collection families completed two questionnaires: the parent interview, and the resident father questionnaire. The parent questionnaire ascertained information regarding demographics, family structure, child development, the home environment, parent attributes and expectations, child care arrangements, child health, family health, marital history, social support, community support, respondent information, spouse information, and information on the nonresident father. 21
31 The resident father questionnaire ascertained information on education, employment history, childbearing, marital partner history, separations from the child, parenting practices, knowledge of child development, prenatal experiences, and home involvement. Childcare providers also completed information on center services and staffing. Direct Assessments: Researchers completed direct child assessments in the area of cognitive performance, socio-emotional development, and physical performance over the follow up period. The study team assessed physical growth and motor development with two standardized assessments: The Bayley Short Form Research Edition, and items from the Bruininks-Oseretsky Test of Motor Proficiency (Bruininks) and the Movement Assessment Battery for Children (MABC). They also obtained direct measures of weight, height, arm circumference, and head circumference. The Bayley was administered at nine months and two years of age. Items from the Bruininks and MABC were administered at preschool and kindergarten. Low Birth Weight Cohort The ECLS-B oversampled children who were less than 2,500 grams. At baseline, the cohort included approximately 1,650 a children who were low birth a Numbers have been rounded to the nearest 50 according to the data use agreement with ECLS-B 22
32 weight and 1,150 children who were very low birth weight. Approximately 2,900 children were preterm. Approximately ninety one percent of families completed parent interviews at two years (N 2,500), preschool, and kindergarten (N 1,900) waves of data collection. Exposure Assessment We will define interventional therapy services, as those therapies implemented to facilitate motor development in childhood. Children frequently receive physical and occupational therapy services concurrently. Facilitation of gross motor skills falls within the scope of practice for both disciplines. Yet, there may be some divergence in the tactics that each discipline implements to improve motor control. However, it is difficult to isolate the individual effects of each service. Therefore, we will consider interventional therapy as children who received physical and or occupational therapy. The ECLS-B cohort assessed exposure to therapy services when the child was 9 months of age, at two years of age, during preschool, and at entry into kindergarten. Researchers asked the parents at 9 months: For each service, please tell me if child or your family received this service to help with special needs. At 24 months, researchers asked Since your last interview does your child receive therapy services? On the preschool questionnaire, families were asked Since the age of two has your child received speech, physical therapy, occupational therapy, or vision services. 23
33 We will use the following criteria to define the exposure: 1) If the child received physical and or occupational therapy services any time between 9 and 24 months, they will be considered exposed. We will model this variable as a dichotomous outcome. Table 3 provides the distribution of services that low birth weight children received at nine months. Figure 2. Exposure definition ECLS-B For each service, please tell me if child or your family received this service to help with special needs. Exposure period 15 months 9 months 24 months Age in months Outcome Assessment The ECLS-B assessed motor development using both standardized assessments and parent report of developmental milestones. 24
34 We will assess the motoric ability of this low birth weight population using standardized assessments and caregiver report of developmental milestones. Standardized assessments: a) The Bayley Scales II of Infant Development is one of the most widely used standardized measures to assess cognitive and motor performance among children 0-42 months of age. The instrument provides standard scores for two indices: the Mental Developmental Index (MDI) and the Psychomotor Developmental Index (PDI). Composite scores are calculated for each index and compared to typically developing children of the same age. In the late 1980 s, the instrument was standardized using 1,700 US children born at weeks who were normal weight for gestational age and without medical conditions or disabilities. The concurrent validity of the Bayley Gross Motor Scale and the Peabody Developmental Motor Scale show a high correlation ( r=0.83). 60 Researchers evaluated child developmental skills at one month intervals between 1-42 months of age. The assessment provides a standard score for the Psychomotor Index with a mean of and a standard deviation of The lowest Psychomotor Developmental Index standard score on this instrument is 50. Investigators used the Bayley Short Form Research (BSF-R) Edition Motor Scale to assess gross motor performance at nine month and two 25
35 years of age. The BSF-R includes a subset of the BSID II. Researchers used Item Response Theory (IRT) modeling to select items that represented all constructs of the BSID II. The study team established that the BSF-R could be used in place of the BSID II to measure developmental performance. The scaled scores for this measure represent the same metric as the BSID II. 61 Data from the Bayley Short Form are available at both 9 months and age 2. We will use this instrument as an indicator of baseline functional ability during the nine month assessment period. b) Bruininks -Oseretsky Test of Motor Performance: The Bruininks is a norm referenced test designed to assess both gross and fine motor functioning among children between the ages of 4 1/2 to 14 1/2. The test was standardized using 765 children in the United States with standard scores and percentile ranks by age grouping. The full test includes 46 items that are divided into the following subtests: running speed, agility, balance, bilateral coordination, strength, upper limb coordination, response speed, visual motor control, and upper limb speed and dexterity. 62 Composite scores can be generated separately for gross motor and fine motor sections. Studies reported an intraclass correlation coefficient of 0.85 for gross motor subscales of the gross motor composite score. Factor analyses suggest this instrument has poor construct validity in 26
36 discriminating between fine and gross motor ability. The instrument offers a valid measure of general motor proficiency. 63 c) Movement Assessment Battery for Children (MABC) The MABC is a widely used standardized assessment to evaluate motor impairments in children between the ages of 3 and 17. The assessment is frequently used by educators, physical therapists, and occupational therapists to identify deficits in motor impairments. The assessment evaluates gross motor skills in the following areas: manual dexterity, aiming, catching, and balance. This instrument is frequently used to identify children with DCD. 64 The ECLS-B did not administer the Bruininks or MABC in their entirety. Rather, investigators chose select items from these assessments. Children to complete the following skills at each time point: skipping eight consecutive steps, hopping on one foot five times, walking backwards six steps on a taped line, standing on one foot for ten seconds, and jumping forward from a standing position. Children received one trial to complete the skipping and walking backwards items and three trials to complete the balance and hopping items. Investigators scored the items on a pass fail basis. For the balance and hopping items, investigators also recorded the greatest number of 27
37 hops as well as the greatest number of seconds the child balanced on one leg across all trials. For the jumping task, each child received two trials, and investigators reported the greatest distance the child jumped in inches. Investigators also asked children to catch a thrown bean bag. The score for this skill was the number of times that the child caught the bean bag. The ceiling for this item was low, at five tosses. We will model the association between receipt of interventional physical and occupational therapy and each individual preschool motor item. We will model the items scored on a pass fail basis as a dichotomous outcome. We will model jumping distance as a continuous outcome. Due to the low ceiling on the catching skill, we will not include this item in our analysis. We will calculate the change score in jumping distance between preschool and kindergarten. Developmental Milestones Parents reported the age at which their child completed gross motor milestones at two time points: 9 months and two years. 9 months: parents reported the age at which their child sat independently, crawled on hands and knees, pulled to stand, and cruised 28
38 24 months: the parents reported the age when their child started walking up the stairs alone At nine and 24 months, ECLS-B included all children in the one on one assessment. When children reach preschool and kindergarten, children in wheelchairs did not participate in gross motor assessments. Children, who used an assistive device, were allowed to use that device during the assessment. We will use caregiver report of developmental milestones to determine if the child is attaining typical developmental milestones during age appropriate time periods. Method Study Design: We will conduct a cohort study to estimate the effect of physical or occupational therapy on preschool motor coordination among children born LBW. 29
39 Figure 3: Study Design Exposure period 15 months Change in jumping distance Birth 9 months 2 years Preschool 4yrs K 5 yrs Age of child Items from Bruininks-Oseretsky Test of Motor Proficiency and MABC: coordination, balance, strength Directed Acyclic Graph: This graph represents unidirectional causation between the therapy services, preschool motor ability, and confounding variables (Figure 4)
40 Figure 4. Directed Acyclic Graph 31 31
41 Analysis Plan I. General Overview We will estimate the effect of interventional physical occupational therapy services on preschool motor development using data from the ECLS-B. Children who receive therapy services in this low birth weight population are a heterogeneous group. Naturally, children will have different propensities to get services based upon a host of demographic, medical factors, and functional ability. Therefore, in these observational data, we may have confounding between therapy and motor development by severity of the child s medical condition and or functional level. Children that are sicker are more likely to get services than those children who are healthier. II. Estimating the average causal effect in observational data We will use two general approaches to estimate the average treatment effect of therapy on preschool motor coordination. First we will use a standard logistic regression model while controlling for confounding. Second we will use a propensity score approach. We will estimate the predicted probability of treatment using both tree based methods and standard logistic regression. We will then create inverse probability of treatment weights with each method to then estimate the average treatment effect of therapy services on preschool motor coordination. 32
42 We will use measured confounders at nine months to control for confounding of the association between receipt of therapy services and preschool motor performance. These methods are based on the assumption of no unmeasured confounders in the data. Using a priori knowledge and a directed acyclic graph, we will include confounders associated with both receipt of therapy services and motor outcomes in the propensity score model. Moreover, to decrease bias and improve precision of the effect estimate, we will also include those covariates that are associated with motor development. 66 A. Standard Model: We will generate separate models to estimate the effect of interventional physical or occupational therapy services on preschool motor ability. We will use a logistic regression model, while controlling for relevant confounders, to estimate the average effect of therapy on the ability to hop five times independently, to skip eight consecutive steps, to maintain single leg stance for ten seconds, and to walk backwards six steps on a taped line. Logit (Pr(Y=1) = B 0 +B 1 X 1 +B 2 X 2 +B i X i +e Using a linear regression model, we will model the estimated effect of therapy services on preschool jumping distance and on the change in jumping distance (preschool to kindergarten), while controlling for confounders. Y= B 0 +B 1 X 1 +B 2 X 2 +e 33
43 We will consider the functional form of the covariate and evaluate the assumption of linearity between continuous and ordinal variables and our preschool outcomes for both the linear and logistic models. We will consider modification of the effect estimate by maternal social characteristics (maternal education). These variables are based on interaction effects reported in the literature. We will use the Breslow Day test of homogeneity to determine if there is heterogeneity of the odds ratio across strata of the covariate. Mostly likely we will encounter small cell sizes when the main effect is stratified by level of each interaction term. We will use a less stringent p value, p<0.10, since the power to detect interactions is often low. B. Inverse probability of treatment weights (IPW) We will create inverse probability of treatment weights to estimate the average treatment effect. These weights will create a pseudo population with the distribution of the covariates reflective of the combined sample. The weights are calculated from the propensity score, the predicted probability of treatment given a set of covariates. The weights are as follows: a) 1/(propensity score): if the child received therapy b) 1/(1-propensity score): if the child did not receive therapy 34
44 Children with a low probability of receiving treatment and actually received therapy receive a large weight, and children with a low probability of treatment and didn t get therapy receive a small weight. We will stabilize the inverse probability of treatment weights by multiplying the IPW weight by the marginal prevalence of the treatment that they actually received. Stabilizing the weights normalizes the range of the probabilities and increases the efficiency of the analysis. This prevents just a few people from contributing most of the observations in the pseudo population. Stabilizing the weights centers the weights around We will estimate the average treatment effect of interventional therapy delivered between 9 months and age two on preschool motor ability using propensity scores weights from each estimation method. We will generate separate models for each preschool motor item as described above. For each weighted model, we will control for residual confounding. Estimating the Propensity Score: We will estimate the probability of a child being exposed to interventional therapy services between nine months and age two using four methods: logistic regression, a single classification tree, random forest classification, and bagging. The propensity score provides a weighted summary of the covariates. Theoretically, when conditioning on this score, the distribution of measured covariates should be similar between treatment groups. Thus, the variation in the covariates between the groups should be from chance alone. 35
45 1. Logistic Regression: We will estimate the propensity for early childhood therapy with a logistic regression model. This model assumes linearity between covariates and the receipt of therapy. Logit (Therapy=1) = B 0 + B 1 X 1 +B 2 X 2 +B 2 X 3 +B p X p +e 2. A Non-Parametric Approach to Estimating the Propensity Score Recursive partitioning Recursive partitioning is a non-parametric classification and regression tree method which is commonly used in clinical medicine and genetics. This approach analyzes large numbers of predictor variables and complex interactions to create regression trees. The method partitions the data into subgroups which show the greatest heterogeneity with respect to the outcome. The method is objective and data driven, therefore the groupings will be automatically generated by the software package. The subgroups are objective and mutually exclusive. During each stage of partitioning, observations with similar outcome responses are grouped. Unlike linear regression where information is combined linearly, here recursive partitioning considers both nonlinear associations and multiple splits of the same variable. This method may be similar to stepwise regression where candidate variables are entered into the model one at a time, however with recursive partitioning; only those interactions which are used to grow the tree are used to fit the data
46 The tree is grown according to the concept of impurity reduction. With each split in the building process, the association between the daughter nodes and the outcome are more homogenous compared to the previous parent nodes. As the tree grows, variables that are more strongly associated with the outcomes are chosen to split. Many classification trees rely on p values for tests of association to determined cut points. 68 This splitting continues until a stop point is set. Criteria for a stop point may include a threshold for the minimum number of observations in the node or a threshold for the minimum change in the impurity measure. 68 Despite the popularity of this data mining method, results from a single classification tree are highly variable and are sensitive to the arrangement of the data. For example, the rank of each variable in the classification tree as well as the cut point of the variable is strongly dependent upon the distribution of observations in the data. With small changes in the data structure, the order of variable selection or the cut point of the variable may change resulting in an alternative tree structure. 68 Bagging and Random Forest Classification Both bagging and random forest classification are tree based methods derived from machine learning theory which aggregate estimates over multiple individual trees to improve the predictive performance of the algorithm. Bagging randomly draws a series of bootstrap samples from the data, and creates individual classification trees for each sample. With each of these bootstrap 37
47 samples, the data will vary slightly from the previous sample. Furthermore, each individual tree may then vary, perhaps substantially, from the previous tree. The algorithm then aggregates the predicted probability of class membership over the series of classification trees. 69 Random forest classification utilizes this same bootstrap method. However, random forest adds an additional level of variability to the algorithm. During construction of the individual classification trees, a random sample of predictor variables is chosen to split the data at each node. Therefore, each individual tree is even more diverse compared to the trees from bagging alone. 68 Although individual classification trees are inherently unstable, bagging and random forest classification have been shown to produce robust estimates. In both empirical and simulation studies, estimates aggregated over a series of classification trees, show improvements in prediction accuracy when compared to a single classification tree Bagging is suggested to equalize the influence of given observations in the data. Thus, data points which strongly influence the classification algorithm are downweighted. 68 Furthermore, the additional level of randomness introduced by random forest classification creates additional diversity between trees with a lower upper bound of error. 69 Overall, these methods produce a more robust final estimate with decreased variability. 69 We will generate predicted probabilities of class membership into interventional therapy between nine months and age two using logistic regression, random forest classification, bagging, and a single classification tree. 38
48 These analyses will be performed using the R statistical platform. We will use the RandomForest (random forest), Ipred (bagging), and Tree (single classification tree) packages. All categorical variables will be encoded as factors in the R environment. This transformation ensures that the R software recognizes these variables as categorical responses. We will check the sensitivity of the error rate to our chosen parameters by allowing the number of trees to vary between 250 and 1,000 and the number of randomly chosen variables to vary between 2 to 7. The error rate for the algorithm is generated from the 33% of the data remaining that was not used to form the classification trees. For example, with each bootstrap sample, the remaining data ( 33%) not in the sample is entered into the classification tree. The error in these out of bag predictions is collected over the series of trees to determine the final error rate over the forest. The error rate appears to be accurate if the predicted probabilities of class membership are aggregated across a sufficient number of trees. However, if the number of trees are too few, then the error rate may be upwardly biased. 74 The algorithm may therefore be a better predictor of the outcome than suggested by the error rate. We will assess balance of each method used to generate the propensity score by calculating the standardized difference of the weighted confounding variables between the treatment groups. Standardized differences represent the differences between the means by therapy status in units of standard deviations. The estimate is calculated as 39
49 d= (xbar therapy -xbar no therapy )/sqrt(s 2 therapy + S 2 no therapy )/2)). 75 Although there is no standard criterion to determine balance between treatment groups, researchers suggest a standardized difference of < Limitations of these approaches: These approaches attempt to control for confounding due to nonrandomization assignment of treatment. Propensity scores can balance the distribution of the covariates between the groups, so when conditioning on the propensity score, there is no longer unequal distribution of covariates between groups. Therefore the association is no longer confounded. However, this is dependent on the variables that are measured in the data as well as the variables that are included in the propensity score model. We still may have unmeasured confounding. In addition, the propensity score model may be misspecified if the analyst does not consider the functional form of the confounders or higher order effects. We will consider two methods from machine learning theory that are free from these parametric assumptions. Sources of Bias 1) Attrition and Selection Bias: Estimation of the predicted probability of treatment requires complete data on covariates used to generate the predicted probability of treatment. Children who 40
50 are missing data to generate the probability of treatment may differ from the children who have complete data. Attrition between twenty four months and preschool/kindergarten is also a concern, as children who have preschool outcome data may differ, in meaningful ways, from children who do not have data on preschool motor outcomes. These data were collected as a larger study evaluating early childhood health, development, and education so we do not anticipate that attrition would be related to children no longer receiving therapy services. Therefore, there would not be differential loss to follow up based on children doing better as a result of therapy. The proportion of children with preschool follow up data was similar among children who did (87%) and did not (84%) receive therapy services between 9 months and 24 months. Handling of missing data: Although the assumption can t be tested in the data, under the missing at random assumption, we will consider proc Iveware to impute the missing data. Proc Iveware imputes the missing values using multivariate sequential regression. We will impute the missing values for the raw data prior to making transformations or collapsing variables. We will impute five data sets, and run all analyses in each of the imputed data sets. The effect estimates will be averaged across imputations. The standard errors will be calculated to account 41
51 for variation both within and between imputations. We will calculate the standard errors across imputations using Rubin s Rule. 79 Missing data and recursive partitioning: Compared to standard regression methods, tree based approaches do not completely discard an observation with missing data. The observations that have missing data in a variable which is being partitioned are not included in that split. However, that observation will be included in other computations of variables where that observation has a data point. Random forest classification and bagging algorithms presently do not handle missing data. We will use complete covariate data to generate the predicted probability of treatment using these algorithms. Sensitivity Analysis: There is the potential for unobserved confounding of the effect estimate due to unmeasured variables that are not included in the propensity score. We will examine the sensitivity of our effect estimates by restricting our sample to those children with overlapping propensity scores. From our sample with overlapping propensity scores, we will also exclude children who were treated most contrary to prediction. For example, we will exclude children who received therapy but had a propensity for treatment lower than the 1 st percentile and children who did not receive therapy but had a propensity for treatment greater than the 99 th percentile. We will also trim the sample using the 2.5 th and 97.5 th percentile cut points for the treated and untreated children respectively
52 Simulation studies show, assuming a uniform effect of treatment, that asymmetric trimming of the propensity score leads to a reduction in bias in the presence of unmeasured confounding. 80 Power Calculations The ECLS-B cohort included approximately 3000 low birth weight children. We estimated the standard deviation of gross motor performance among school age children to range between 1 to At 80% power, we can expect to detect a change of 0.30 to 0.50 in the mean gross motor score. ECLS-B: Logistic regression power analysis with imputed sample: early childhood Approximate Proportion Probability of Power Sample Size receiving PT/OT Motor Delay Odds Ratio Alpha
53 Figure 5. ECLS-B Linear regression power analysis 44
54 Chapter 3 PRELIMINARY ANALYSES VARIABLE DESCRIPTION AND CODING EXPOSURE: At two years of age, researchers asked families of participating children if their child was receiving related services between nine months of age and age two. Families reported the type of therapy that the child received during this time frame as well as the amount of therapy the child received per month. Families reported total amount of therapy across all disciplines. We defined receipt of either physical or occupational therapy between nine months and age two as a dichotomous variable. OUTCOME: Researchers administered select items from the Bruininks Oseretsky Test of Motor Proficiency and the Movement Assessment Battery for Children to assess preschool and school age motor ability. The child completed the following tasks at preschool and kindergarten: skipping eight consecutive steps, hopping independently five times, maintaining single leg stance for ten seconds, walking backwards eight consecutive steps on a taped line, and performing a standing broad jump. 45
55 COVARIATES Continuous Measures: 1. Center for Epidemiologic Studies-Depression Scale. The items were scored according the ECLS-B manual and then summed for each individual who had fewer than four missing responses. We coded subjects with four or more missing items as missing on the composite CES D variable. 2. Home Observation for Measurement of the Environment (HOME): Measures the extent of quality and amount of child stimulation in the home environment. Researchers administered a subset of 8 items from HOME-SF which included items from the following subscales: responsivity, acceptance, involvement, learning material, organization subscales. These items are dichotomous answers with either positive or negative scores. These variables were recoded as yes =1 and no =0. Not observed were considered missing. The variables were summed to create the final HOME score at 9 months. Select questions from the HOME scale included: parent spontaneously vocalizes to the child, parent verbally response to the child s vocalization, parent caresses or kisses the child at least once, parent neither slaps nor spanks child during visit, parent does not interfere with or restrict child more than three times during the visit, parent provides toys to the child to play with during visit, parent keeps child in visual range, child s play environment is safe. We calculated the HOME score by taking the average across all items and multiplying this value by the number of question completed. 46
56 3. Knowledge of Infant Development Inventory (KIDI): 11 items from the KIDI designed to assess knowledge of parental practices, developmental processes, and infant norms of behavior. These 11 items were selected from 75 items on the KIDI questionnaire that the authors of the instrument recommend as the most successful items in differentiating high versus low parenting knowledge. The questions describe typical infant behavior or parenting that would affect infant growth and behavior. Parental responses include: agree, disagree, not sure. These questions are a measure of an individual child s development. We calculated the KIDI score by taking the average across all items and multiplying this value by the number of question completed. 4. Birth weight: all children in the cohort weighed less than 2500 grams. Birth weight was ascertained from the birth certificate record. 5. Number of siblings: This variable is continuous and indicates the total number of siblings either full, step, adoptive, or foster that lived in the household with the child at the nine month assessment 6. Gestational age at birth: gestational age was ascertained from the child s birth certificate record 7. 5 Minute APGAR scores: researchers ascertained the five minute APGAR scores from the birth certificate record 47
57 8. Length of hospital stay: at the nine month assessment families reported the number of days that the child stayed in the hospital at birth due to medical problems 9. Length of NICU stay: at the nine month assessment families reported the number of days since birth that the child stayed in the NICU month BSF-R Motor T Scores: standardized t scores of motor performance indicating the child s ability relative to other children the same age. The scores are norm references with a mean of 50 and a standard deviation of 10. Standardized T scores are adjusted for gestational age. 11. SES scale: this is a continuous measure for the composite of socioeconomic status which ranges from to The composite is the average of up to five measures: mother s education, father s education, mother s occupation, father s occupation, household income. 12. Hours per week in childcare: at the nine month assessment families reported the number of hours per week that their child spent in childcare. 13. Age of motor milestone attainment: Researchers asked parents to report whether their child could perform the behavior and when the child was first able to perform the skill. On the nine month assessment parents reported when the child first performed the following skills: sit alone and steady without support, crawl on hands and knees, pull to a standing position, and first walked holding onto something (cruising). Researchers derived these items 48
58 from the Minnesota Child Development Inventory. The appropriate age range for this measure is from birth through age six. Categorical Variables 1. Parental education: We collapsed parental education into the following five categories: less than a high school education, high school, technical training/some college, college degree, and graduate/professional training. We coded education as a series of indicator variables. 2. Caregiver Health: caregiver s reported their current health status during the nine month follow up assessment. Responses included excellent, very good, good, fair, and poor. We coded these responses as a series of indicator variables. 3. Injury of the child: how often the child was seen for an injury by a professional since the child has lived in the home 4. Child Health Condition: On the nine month questionnaire, researchers asked the caregiver if a doctor ever told them that their child had a health condition. This question is coded as a series of dichotomous variables with 1=yes and 0=no. The health categories are as follows: visual deficit, cleft palate, heart defect, congenital anomaly affecting motor skills, failure to thrive, difficulty with mobility, and other special needs. Turner s syndrome, Spina Bifida, and Downs Syndrome were included under the category of congenital anomaly. 49
59 5. Single parent status: researchers asked respondents if a spouse or partner lives in the household. This variable is coded as a dichotomous variable where 1= yes and 0= No 6. Help or advice with childcare: Researchers asked the primary caregiver, who you would ask for care and advice about your child. This variable was collapsed into a dichotomous variable where: 1=yes, the caregiver received advice, and 0= no, the caregiver had no one to ask for advice. 7. Health Insurance: at the nine month assessment parents reported whether or not the child was covered by health insurance as well as the type of insurance plan. Researchers asked the respondent about the following health insurance plans: private, Medicaid, SCHIP, military, Indian Health Service, and other government programs (Medicare, State sponsored health plan). 1=yes and 0 = no. This variable is coded as a series of dichotomous variables. 8. Race/Ethnicity: We collapsed race into the following categories: White Non- Hispanic, African American, Hispanic, Asian, and Other. We coded this variable as a series of indicator variables month Work Schedule: Mothers were asked whether they were currently working as well as their work schedule. We collapsed the responses into the following categories: does not work, regular daytime shift, regular evening shift, night shift, rotating shift, split shift, other shift. This variable was coded as a series of indicator variables. 50
60 10. 9 month questionnaire: Injury in the last three months: Families were asked Since you have lived here, how many times has your child seen a doctor or other medical professional or visited a clinic or ER. The range of responses included never, once, twice, more than three times. We coded this variable as a series of disjoint indicator variables. 11. Caregiver Health at nine months: This variable is an ordinal variable ranging from excellent to poor. Researchers as the respondent on the nine month questionnaire to rate their health in general. The responses ranged from excellent to poor. We coded this variable as a series of indicator variables. 12. Urbanicity: This variable is a coded as a nominal variable with three categories: urban (inside urban area), urban (inside urban cluster), rural. 13. Region: This variable indicated the region where families resided at the time of the 9 month assessment. This variable is coded as a nominal variable with the following categories: Northeast, Midwest, South, and West. I. PRELIMINARY ANALYSES DESCRIPTIVE ANALYSIS: LOW BIRTH WEIGHT COHORT In these data, approximately 3,000 children were born < 2500 grams. Nine percent of the sample received interventional physical or occupational therapy services between nine months and age two. Data on receipt of therapy were missing for 8.14% of the sample. Children who received therapy were more likely to be male (60% vs. 47%) and were born on average five weeks earlier 51
61 than children who did not receive therapy (29 weeks vs. 34 weeks). Overall children in this cohort who received therapy were on average very low birth weight (1138 grams vs.1785 grams) and demonstrated a lower functional ability at nine months. Children in the treatment group were hospitalized three times (75 days vs. 24 days) as long after birth and were five times as likely not to be sitting independently (45% vs. 7%) at the nine month follow up visit compared to children who did not receive treatment. Only 23% of children in the treatment group were cruising along furniture where 63% of children in the untreated group had attained this skill (Table 4). Exploration of Confounding We conducted exploratory analyses to determine: variables that were associated with receipt of therapy services between nine months and age two, variables that were predictive of preschool motor ability, and the functional form of the relationship between covariates and preschool motor ability. We entered a host of candidate variables into the RandomForest package in R version 2.1 (Table 5). The RandomForest package does not support missing data values. The percent of covariates missing data were extremely small ( <5%) with exception of APGAR and Bayley Motor T scores in which 15% of children were missing data for these measures. In this exploratory analysis, we used proc IVEware in SAS version 9.2 to impute the missing values. Using the RandomForest package we generated 1500 trees using 9 variables chosen randomly to partition the data at each node. Difficulty with 52
62 upper or lower extremity mobility indicated by a physician, the child s length of hospital stay after birth, and birth weight had the highest mean decrease in accuracy and were very strong predictors of therapy receipt (Figure 6). The mean decrease in accuracy is the difference in classification accuracy using the out of bag data when the variable is included and the classification accuracy when the values of the variable in the out of bag variable are permuted randomly. A higher mean decrease accuracy score indicates a variable of greater importance in prediction of receipt of early childhood therapy services. 69 Other strong predictors of therapy included the child s 9 month BSF-R Motor T score, gestational age, race, socioeconomic status, and the inability of the child to attain early developmental milestones (sitting, pulling to stand, and crawling) (Figure 7). Table 6 describes the importance of candidate variables to predict preschool motor ability. The ECLS-B did not administer the Bruininks Oseretsky Test of Motor Proficiency or Movement Assessment Battery for Children in its entirety. To explore this association, we calculated an overall motor score from the available administered items. We took the average of the following items: skipping, walking backwards, hopping left and right, balance left and right and multiplied the average by number of items without missing data. Children with a score of one standard deviation below the sample mean were considered to have impaired preschool motor coordination. Length of hospital stay, birth weight, gestational age, and a delay in foundation motor milestones (inability to pull to stand, crawl, and cruise) were strong predictors of preschool motor impairment in this low birth weight 53
63 population. Nine month BSF-R Motor T score, socioeconomic status, amount of time the child spent in childcare were also relatively strong predictors of preschool motor impairment (Table 8). Figures 8 through 12 provide partial dependence plots between covariates and the logit of preschool motor impairment. The graphs characterize the relationship between an individual predictor variable and the probability of preschool motor impairment from the Random Forest classification algorithm. The y axis is on the logit scale. The partial dependence plot represents the marginal effect or average trend of the variable after averaging out the effects of the other predictor variables b in the model. 82 The logit of the probability of preschool motor impairment decreased with increasing birth weight up through 2500 grams. There was an upward trend at the upper range of low birth weight (Figure 9). There was a monotonic linear trend between both gestational age and length of hospital stay and the logit of preschool motor impairment. The logit of the probability of a preschool motor impairment decreased with increasing gestational age and increased with length of hospital stay. The relationship between socioeconomic status and preschool motor impairment was U shaped. The relationship between 9 month BSF-R motor T score and the logit of b Variable in Random Forest classification model:9 month Bayley Motor T Score, Weekly childcare hours, number of siblings, length of hospital stay, length of NICU stay, hearing deficit, failure to thrive, other special healthcare need, gestational age, ever breastfed, number of ear infections, weekly hours of television watching, neighborhood safety, maternal depression, birth weight, APGAR score, HOME score, KIDI score, region, urbanicty, health insurance, maternal work schedule, PT/OT receipt, maternal support, congenital deficit, visual deficit, difficulty with upper or lower extremity mobility, childhood injury, caregiver health, age at sitting, crawling, standing, cruising, parental education 54
64 preschool motor impairment showed a relatively linear decreasing trend through a score of 50. Yet, there was a small upward trend with BSF-R score above 60 (Figure 8). The relation between many covariates (APGAR score, KIDI score, SES level, gestational age, and nine month BSF-R Motor T score) and the logit of the probability of therapy exposure was nonlinear (Figures 13-20) (Table 7). Building the propensity score: In our baseline cohort there was marked heterogeneity in children s baseline functional ability. We evaluated candidate confounders for the propensity to receive therapy, among children with similar baseline functional ability or need for therapy. We defined an at risk cohort of children who had similar baseline levels of functional ability. This included children who were sitting independently on the nine month assessment, were without a known upper or lower extremity mobility problem, and who were hospitalized for a month or more after birth (N 700;rounded to the nearest 50). Directed Acyclic Graph We constructed a Directed Acyclic Graph and enumerated all open door pathways (Figure 4). The following confounders were included in the minimally sufficient conditioning set to block all confounding pathways: gestational age, length of the child s hospital stay after birth, age of early motor milestone attainment, parental education, race/ethnicity, socioeconomic status, health 55
65 condition, birth weight, weekly hours in childcare, stimulation in the home, 9 month BSF-R Motor T Score. Modeling Variables Associated with Exposure and Outcome in the Unexposed: We evaluated the association between covariates and receipt of therapy services as well as preschool motor performance in the unexposed. We chose the skipping item as a strong indicator of motor coordination. Children with a visual deficit (OR: % CI: 0.22, 2.70) or with a hospital stay after birth of more than a month (45-60 days; OR: % CI 0.33, 1.64) had a decreased odds of successfully skipping eight consecutive steps. Increased age at which the child cruised (0.83, 95% CI 0.66, 1.05) was also associated with a decreased odds of passing the skipping assessment. Children who spent more than 40 hours per week in childcare were 0.56 times (OR: % CI 0.23, 1.46) as likely to be successful with the skipping task compared to children who were in childcare less than ten hours per week. Children whose parents had a high school education or some college were 20% to 80% more likely to skip eight consecutive steps successfully compared to children without a high school education (Table 8). In this sample, length of hospital stay and age at which the child achieved early developmental motor milestones were strongly associated with receipt of either occupational or physical therapy. (Table 8) Also, children who had a visual deficit were 4.54 times as likely (OR: 4.54, 95% CI: 2.44, 8.45) to receive services compared to children without a visual deficit. With every ten unit 56
66 increase in the child s BSF-R Motor T Score, the odds of (OR: 0.55, 95% CI: 0.43, 0.69) receiving therapy decreased by 45%. Children, whose families provided greater stimulation in the home, were also 89% more likely to receive therapy, than families who appeared to provide an average level of stimulation in the home (Table 8). When compared to white non-hispanic children, African American children were less likely to receive therapy (OR:0.53, 95% CI: 0.29,0.97) services, yet more likely to successfully (OR:3.18, 95% CI 1.75,5.78) complete the skipping task. We also explored potential confounders by calculating the percentage change in the effect estimate with a given covariate dropped from the full model. The change is estimate was calculated as follows ln(or full/orreduced). The following covariates changed the effect estimate more than thirty percent when dropped from the full model: length of the child s hospital stay, parental education, Medicaid status, APGAR score, and age at cruising. The effect estimate also changed more than ten percent when race or birth weight was dropped from the full model (Table 9). Based on these analyses of confounding, we included the following strong confounders in our propensity score model (Table 10): gestational age, birth weight, length of the child s hospital stay, cruising, race/ethnicity, parental education, socioeconomic status, and 9 month BSF-R Motor T score. Age at which the child cruised and length of time the child remained in the hospital after birth appeared to be the strongest confounders. We conducted a sensitivity analysis comparing effect estimates and the precision of our estimates including 57
67 all potential confounders (Model 1) (strong and weak) compared to a propensity score model including only strong confounders (Model 2) (Table 11). The effect estimates from the more parsimonious propensity score models showed similar effect estimates, for most outcomes, with greater precision. Therefore, when considering the bias precision trade off, we chose Model A to estimate the predicted probability of therapy between nine months and age two. Very Low Birth Weight Cohort: At risk for delayed motor coordination in preschool In our preliminary work, we examined the relationship between confounders and preschool motor ability in a population of low birth weight children with similar functional ability. Here, we further define a sample of very low birth weight children who are at risk for impairment in motor coordination in preschool. This sample included very low birth weight children, without known congenital anomalies, who appeared to be reaching normal developmental milestones (cruising on the nine month assessment) and did not have a known medical diagnosis that would affect mobility (Figure 6). Although the investigators obtained these indicators by parent-completed questionnaire, studies show that parents provide dependable reports of their child s motor ability and health. 58
68 I. Crude Model Crude models estimating the effect of interventional therapy services and preschool motor coordination showed reverse causality. Very low birth weight children who received the intervention were approximately 20%- 30% less likely to be successful with preschool motor coordination skills (Table 12). II. Standard Outcome Model We entered the following confounders in the model according to the functional form of the relationship depicted in our exploratory analysis ( Figures 8-12; 21-26) : days in hospital (continuous) age cruising (continuous), 9 month BSF-R Motor T score (continuous), birth weight (continuous), gestational age (continuous), race (indicator variables), education (indicator variables), socioeconomic status (restricted quadratic spline; knots -1.5,0.3,1.2). Using logistic regression in SAS version 9.2, receipt of interventional therapy was associated with improved preschool motor coordination among typically developing very low birth weight children. Very low birth weight children who received the treatment were 1.67 times as likely to successfully skip eight consecutive steps (OR: 1.67; 95% CI: 0.46, 6.03) when compared to children who did not receive the treatment. There was no effect of therapy on walking backwards (OR: 1.03, 95% CI: 0.37, 2.88). Children who received the treatment appeared to do marginally worse on balance and hopping skills (Table 13). 59
69 III. Missing Data Approximately 7% of children were missing at least one covariate used to estimate the propensity score. Therapy status was unknown for twenty seven percent of these children. Ninety seven percent of children with a missing covariate where missing either the 9 month BSF-R T score or gestational age. The majority of children missing a covariate used to estimate the propensity score (67%) did not receive treatment. The distribution of strong confounding covariates among children not included in estimating the propensity score was similar to the untreated group in the full sample. Approximately 20% of our VLBW sample was missing data on their ability to perform items measuring preschool motor coordination. Average birth weight (1148 grams vs grams), length of hospital stay (49 days vs days), and 9 month BSF-R motor scores (49.63 vs ) were similar between children with preschool motor scores and those with missing data respectively. Families with missing information on preschool motor performance scored lower on the socioeconomic scale (-0.21 vs ) compared to families with data on these preschool endpoints. 60
70 Chapter 4 PHYSICAL AND OCCUPATIONAL THERAPY SERVICES AND MOTOR COORDINATION AMONG CHILDREN BORN VERY LOW BIRTH WEIGHT c Introduction Since the 1980 s, rates of infants born with low birth weight (LBW) have increased in the United States. In 2010, approximately 8.2% of all births were LBW and 1.5% of all births were very low birth weight (VLBW). 1 A small percentage of VLBW children ( 10%) suffer from severe neurological impairments including abnormalities in tone, transitional movement, and persistence of primitive reflexes. A large proportion experience only minor motor difficulties with complex movement. 2,3 Children born VLBW without notable neurological deficit show an initial delay in foundational motor skills. However, these children often catch up to children of normal birth weight during the first few years of life. As VLBW children approach elementary school age and motor skills become more complex, there is once again a divergence in motor ability. 33 c Watkins, Stephanie MSPH, MSPT, Jonsson-Funk, M. PhD, Brookhart M A PhD., Rosenberg S A PhD. O Shea T M MD., MPH, Daniels J PhD. Physical and Occupational Therapy Services and Motor Coordination among Children Born Very Low Birth Weight (Under Review: Pediatrics). 61
71 Specifically, many VLBW children experience difficulty with motor coordination when they approach school age. Although they typically attain foundational motor milestones, these children are challenged to learn new motor tasks involving balance and coordination. They may appear clumsy or awkward and have difficulty with daily activities and classroom skills such as tying shoes or participating in physical education. 4 In the absence of a neurological or medical diagnosis, these symptoms are described as developmental coordination disorder (DCD). 10 In a metaanalysis, the prevalence of DCD among VLBW children has been reported to be as high as 72%. Moreover, VLBW children are six times as likely to develop DCD than children born with normal birth weight. 10 Poor motor coordination in childhood has a negative effect on the child s mental and physical health. Many children with impaired coordination avoid social situations, as well as classroom activities and recreational activities placing them at risk for low self-esteem, social isolation, low levels of physical activity and obesity which persists into adolescence. 5,6-9 To attenuate the potential negative sequelae of poor childhood motor coordination, early intervention by physical and occupational therapists is recommended. 10 Services are targeted toward facilitating motor control and motor planning that may improve motor coordination, overall levels of physical activity, and self-esteem at school age. 62
72 In the published literature, few studies have examined the efficacy of interventional physical and occupational therapy services on school age motor skills of low birth weight children. In a population of VLBW infants without neurological involvement, two small randomized studies assessed the effect of occupational therapy and physical therapy during the first year of life on motor ability in childhood. 11,12 Neither trial found a statistically significant difference in standardized motor scores between treatment groups. However, among children born of normal birth weight, interventions promoting motor development appear to improve children s locomotor ability. 13 Little is known regarding the efficacy of physical and occupational therapy on childhood motor coordination. Therefore, in a population of VLBW children at risk for developmental coordination disorder, we estimated the effect of interventional physical and occupational therapy services delivered between nine months and two years of age on preschool motor coordination and change in motor skills between preschool and kindergarten. Methods Data Source We used data from the Early Childhood Longitudinal Study Birth Cohort (ECLS-B), sponsored by the United States Department of Education and the National Center for Education Statistics. The ECLS-B is a nationally representative sample of children born in the United States in 2001 and followed through kindergarten
73 The ECLS-B collected data on children s physical, social, emotional, and cognitive development as well as health and education at four time points: nine months ( ), two years ( ), preschool (2005), and kindergarten ( ). Specifically, at each wave of data collection, caregivers completed a self-administered questionnaire reporting demographic information, family structure, child health, family health, information on the home environment, parental attitudes, child development, and community support. Researchers directly assessed children s cognitive performance, socio-emotional development, and physical performance over each follow up period. 85 Researchers oversampled selected demographic groups including: Asian, Pacific Islander and Chinese children as well as twins and children born low birth weight. Children who were born to mother s less than 15 years old, children who were adopted, and children who died before nine months of age were excluded from the cohort. At the nine month assessment, about 10,700 d children and their parents participated in data collection. Study Population From participating families, we identified a sample of 500 VLBW children (<1500 grams) who were at risk for developing developmental coordination disorder. This sample included children who appeared to be developing normal motor skills in infancy and who did not have a known medical diagnosis that would affect mobility. Motor skills develop in typical sequential patterns which are d All numbers are rounded to the nearest 50 to protect the confidentiality of participating families 64
74 described by developmental milestones. 86 On the nine month interview (mean age of assessment 11.9 months) parents reported the age at which their child attained the following motor milestones: sitting independently, crawling, pulling to stand, and walking with support. These motor milestones are fundamental to the development of upright locomotion and provide a framework for monitoring development over time. 87,88 We considered children who were successfully walking with support, the most advanced skill in this developmental sequence, as meeting normal developmental milestones. In addition, on the nine month interview, families reported whether a physician identified their child as having difficulty with either upper or lower extremity mobility problems. We used this question as an indicator of children with a medical diagnosis that could potentially affect the child s motor ability. (Figure 6) We excluded children with congenital anomalies and known upper or lower extremity mobility impairments. Although the investigators obtained these indicators by parent-completed questionnaire, studies show that parents provide dependable reports of their child s motor ability and health. 83,84,89 Measures At the two year follow up assessment, all caregivers were asked if their child or family received services to help with their child s special needs. Families reported the type of service that the child received since the previous nine month assessment. We classified children as exposed to physical or occupational 65
75 therapy services if the family indicated that the child ever received either type of service between nine months and two years of age. The Bruininks-Oseretsky Test of Motor Proficiency (Bruininks) and the Movement Assessment Battery for Children (MABC) are norm referenced assessments used to identify children with mild to moderate impairments in motor ability among children between the ages of 4 to 21 and 3to17 respectively. The instruments are intended for use by practitioners to screen for motor impairments, support diagnoses of motor impairment, to assist with placement, and to evaluate the effect of interventions. 62,64,90 The preschool assessment included direct measures of children s gross motor ability adapted from both the Bruininks and the MABC. Investigators did not administer the gross motor assessment from these measures in their entirety. Rather, ECLS-B selected items from these assessments emphasizing strength, agility, and motor coordination. Investigators asked participating children to complete each of the following items: skipping eight consecutive steps, hopping on one foot five times, walking backwards six steps on a taped line, standing on one foot for ten seconds, and jumping forward from a standing position. Children received one trial to complete the skipping and walking backwards items and three trials to complete the balance and hopping items. Investigators scored the items on a pass/ fail basis. For the balance and hopping items, we classified the child as passing the item if they completed the skill on either foot. For the jumping task, each child received two trials, and investigators reported the greatest distance the child jumped in inches. 66
76 The assessment was repeated at the kindergarten follow up assessment. Thus, we calculated the change in jumping distance between preschool and kindergarten. The other items were scored as present or absent and did not provide a continuous scale for us to assess change in the skill level between preschool and kindergarten. Confounders We considered a list of covariates, measured on the 9 month questionnaire, as potential confounders of the relation between receiving therapy services in the toddler years (9 months to 2 years) and motor performance in preschool. e To determine a final list of confounders, we considered both a priori substantive knowledge and analyses of confounding in the data set. We created a directed acyclic graph to identify a minimally sufficient conditioning set of variables to control confounding. 65 We also used logistic regression to model the relation between covariates and therapy receipt as well as the relation between covariates and preschool skipping ability among children who did not receive the treatment. The final covariates included in the analysis were variables in the minimally sufficient conditioning set and those variables associated with only the outcome. 66 The covariates included: gestational age, birth weight, length of the child s hospital stay after birth, age at which the child began to walking while e Maternal depression (Center for Epidemiologic Studies-Depression Scale), child stimulation in the home environment (Home Observation for Measurement of the Environment- Short Form), parental knowledge of infant behavioral norms and child developmental processes (Knowledge of Infant Development Inventory), birth weight, number of siblings, gestational age, 5 minute APGAR scores, length of hospital stay after birth, length of NICU stay after birth, 9 month BSF-R motor T score, socioeconomic status, hours per week in childcare, age of early motor milestone attainment, parental education, health condition of the caregiver, history of childhood injury, health condition of the child, single parent status, social support with childcare, health insurance status, race/ethnicity, maternal work schedule, urbanicity, and geographic region 67
77 holding onto furniture, race/ethnicity, parental education, socioeconomic status, and the child s 9 month BSF-R T score. Statistical Analysis In this non-experimental study, treatment assignment into physical or occupational therapy is not random. Children who received physical and occupational therapy services may differ from the children who did not receive therapy on demographic characteristics and baseline severity of their functional ability. In particular, children who received therapy may be more functionally limited than the untreated children resulting in confounding by severity of the child s health. To estimate the average treatment effect of early childhood physical and occupational therapy on preschool motor skills, we used propensity score methods to control for confounding. The propensity score is the conditional probability of receiving treatment given a set of observed covariates. Once we condition on the propensity score, receipt of therapy should then be independent of covariate patterns, assuming no unmeasured confounders. 14 We estimated the conditional probability of treatment given our covariates using a Random Forest model. 69 This approach is based on an aggregation of classification trees, each built using a recursive partitioning algorithm. Researchers have shown in simulation studies that propensity scores estimated 68
78 using machine learning methods, such as the Random Forest algorithm, may reduce bias when compared to standard logistic regression. 17,18 We therefore fit the Random Forest with 1000 trees using 4 variables chosen randomly at each split, given the covariates listed above using the Random Forest package in R version The analysis included all confounders and variables associated with the outcome in the algorithm. 66 All children with complete data on confounders used to estimate the propensity score were included in the Random Forest model (93.04% of sample). We used the propensity score to create inverse probability of treatment weights. Children who received the treatment received a weight of (1/propensity score) and children who did not receive treatment received a weight of (1/ (1- propensity score)). By weighting each individual in this manner, we create a pseudo population in which the distributions of covariates in each of the two treatment groups should mirror the covariate distributions of the original combined sample. To assess the comparability of the distribution of confounding covariates after weighting the sample, we calculated the standardized difference of confounding covariates between the treated and untreated children. f If the covariates are similarly distributed after weighting, then the treatment group is no longer associated with risk factors for the outcome, and the comparison of f Standardized differences represent the differences between the means by therapy status in units of standard deviations. The estimates is calculated as d=(xbar therapy -xbar no therapy )/sqrt(s 2 therapy + S 2 no therapy )/2))75.Flury BK, Riedwyl H. Standard distance in univariate and multivariate analysis. The American Statistician 1986;40:
79 outcomes in the two groups should be an unbiased estimate of the average treatment effect of early childhood therapy. 92 We then modeled the association between receipt of physical and occupational therapy between nine months and age two and the odds of performing select motor tasks in preschool in SAS version 9.2. Using logistic regression, we generated separate multiple regression models to estimate the average effect of physical and occupational therapy on the ability of the child to pass preschool motor outcomes. In addition, we modeled the effect of therapy on the distance that the child could jump using linear regression. To limit the potential for residual confounding, we adjusted both logistic and linear regression models for strong confounding variables including: birth weight, length of the child s hospital stay after birth, and age at which the child began to walk with assistance, all included as continuous terms into the model. Finally, we calculated the change in jumping distance between preschool and kindergarten. We used linear regression to model the average change in jumping distance by children s exposure to early childhood physical and occupational therapy services. We adjusted this model for the child s jumping distance at baseline (preschool) and age when the child first began to walk with assistance. 70
80 Results Descriptive Statistics Our sample included about 500 VLBW children who were at risk for impairments in motor coordination during early childhood. Six percent of children in the sample received physical or occupational therapy services between nine months and two years of age. Treatment status was unknown for ten percent of the sample and these children were not included in the analysis. Children who received therapy were more likely to be male (61% vs. 45%), and white (58% vs. 38%). The mean birth weight for children receiving treatment was 1,030 grams (STD: ) compared to the untreated children with a mean birth weight of 1,148 grams (STD: ). Children in the therapy group had a longer mean hospital stay after birth (68 days vs. 48 days) and were born on average two weeks earlier than children in the non-treated group (28 weeks vs. 30 weeks). Developmentally, the treated children sat independently and crawled one month later, on average, than the untreated children. Five minute APGAR scores were similar between the two groups (Table 13). Missing Data Children without complete data on the covariates used to estimate the propensity score were excluded from the analysis. Approximately 7% of children were missing at least one covariate used to estimate the propensity score. Therapy status was unknown for twenty seven percent of these children. Ninety seven percent of children with a missing covariate where missing either the 9 71
81 month BSF-R T score or gestational age. The majority of children missing a covariate used to estimate the propensity score (67%) did not receive treatment. The distribution of strong confounding covariates among children not included in estimating the propensity score was similar to the untreated group in the full sample. Approximately 20% of our VLBW sample were missing data on their ability to perform items measuring preschool motor coordination. Average birth weight (1148 grams vs grams), length of hospital stay (49 days vs days), and 9 month BSF-R motor scores (49.63 vs ) were similar between children with preschool motor scores and those with missing data respectively. Families with missing information on preschool motor performance scored lower on the socioeconomic scale (-0.21 vs ) compared to families with data on these preschool endpoints. Covariate Balance A standardized difference, representing the difference in the means of a covariate by treatment status, of less than 0.10 is suggested as a cut point indicating only a minimal difference between treatment groups. 76,77 In the weighted sample, the distribution of baseline covariates was similar (<0.10) by receipt of physical and occupational therapy. The standardized difference between age of length of hospital stay (0.14), gestational age (0.15), and birth weight (0.08) were marginally different by therapy status (Table 14). In the weighted sample, children who received therapy stayed in the hospital on 72
82 average ten days longer, were born one week earlier, and weighed 44 grams less than the children who did not receive therapy. However, the means standardized difference across all covariates was Overall the covariates were well balanced between treatment groups. Multivariable Regression In the weighted sample, receipt of physical or occupational therapy between nine months and age two was strongly associated with the ability to perform coordinated movement in preschool. Specifically, children who received physical or occupational therapy between nine months and two years of age were 2.39 times (95% CI: 0.76, 7.51) as likely to skip eight consecutive steps compared to children who did not receive these services during early childhood, though the estimate was imprecise. Children who received therapy were also somewhat more likely (OR: 1.52, 95% CI: 0.51, 4.54) to successfully walk backwards six steps consecutively on a line when compared to children who did not receive the treatment, though this estimate was also imprecise. There was no association between therapy receipt and balancing independently on one leg (OR: 1.07, 95% CI: 0.45, 3.13 nor successfully hopping on one foot independently (OR: 0.90, 95% CI: 0.33, 2.45). In the linear regression analysis, children who received therapy jumped slightly further than children who did not receive therapy, although not statistically significant at conventional levels. With regard to jumping performance between 73
83 preschool and kindergarten, therapy appeared to have little effect on the change in jumping distance during this time period (Table 15). Sensitivity Analysis We examined the sensitivity of our effect estimates by restricting our sample to those children with overlapping propensity scores. Twenty five percent of the sample was excluded. From our sample with overlapping propensity scores, we also excluded children who were treated most contrary to prediction. For example, we excluded children who received therapy but had a propensity for treatment lower than the 1 st percentile and children who did not receive therapy but had a propensity for treatment greater than the 99 th percentile. We also trimmed the sample using the 2.5 th and 97.5 th percentile cut points for the treated and untreated children respectively. 80 Together, these trimmed percentiles excluded an additional 1% of the sample with overlapping propensity scores. Simulation studies show that asymmetric trimming of the propensity score leads to a reduction in bias in the estimate of a uniform effect of treatment in the presence of unmeasured confounding. 80 Effect estimates were similar across the unrestricted sample, the sample with overlapping propensity scores, and across the trimmed samples (Table 16). 74
84 Discussion In a sample of VLBW children who were at risk for developmental coordination disorder, receipt of physical or occupational therapy services between nine months and two years of age was associated with the child s ability to perform certain coordinated movement tasks in preschool. Although not statistically significant, when compared to the untreated children, therapy may also improve lower extremity strength as suggested by the child s jumping distance. Although our estimates were imprecise, these findings suggest physical and occupational therapy services delivered during the toddler years may improve a child s functional ability to perform refined coordinated movement in early childhood. Children who are born VLBW are at an increased risk for developmental coordination disorder in childhood. 10 Although initially many of these children attain foundational developmental milestones, motor skills that involve balance and coordination become challenging. Children who experience difficulty with motor coordination frequently feel less confident around their peers and may withdraw from social situations involving physical activity. 7 This avoidance behavior may set a precedent for low levels of fitness since proficiency of motor skills during this early childhood developmental period is an important predictor of physical activity into adolescence. 93 Improvement in school age motor coordination may promote the child s confidence to engage in leisure time physical activity with peers and to participate in organized sports improving their overall mental and physical health. 75
85 The literature evaluating the efficacy of occupational and physical therapy services to improve motor coordination among low birth weight infants is sparse. In a meta-analysis of preschool age children of normal birth weight, interventions that promoted motor skills appeared to improve early childhood object control and locomotor skills. 13 However, two small randomized studies evaluating the effect of physical therapy and occupational therapy, delivered before twelve months of age did not find a statistically significant difference in school age motor scores compared to controls. 11,12 These studies evaluated therapy services in a small population (< 100 children) of VLBW children without neurological problems. Previous studies evaluated the effect of physical and occupational therapy delivered during the child s first year of life. The focus of treatment during this developmental window was most likely on fluidity of movement and independent transitions with pre ambulatory skills including head control, independent sitting, crawling, and walking with support. However, our work focuses on therapy between one and two years of age where the focus of treatment may include facilitation of foundational skills of ambulation, strengthening, coordination, and balance. This type of treatment may more directly carry over into improvement in more complex movement patterns. Several limitations in our work should be noted. First, the ECLS-B data, while rich, only provided a crude measure of therapy receipt over an approximate fifteen month period. We were unable to assess whether children consistently received therapy over this time period or how their dose of therapy may have 76
86 affected the results. Since therapy treatment plans in early intervention are frequently written for a year, there was most likely minimal transition out of services during this 15 month period. Yet, with only a crude measure of treatment, the magnitude of our results may be attenuated where accounting for degree of treatment may reveal more profound results. Additional studies are needed that provide information regarding the amount, frequency, and length of treatment to determine the optimal duration and dosing of therapy that will result in improved school age motor coordination in this population. These data had rich measures of the child s demographic status, health, and functional ability that we accounted for in our analysis. Yet, although we used robust methods to account for self-selection into therapy, there is the possibility that residual confounding could have influenced our effect estimates. However, when we trimmed children from the analysis who were treated contrary to their probability of receiving therapy, our results were similar to our original estimates. We also estimated the association between receipt of physical and occupational therapy services and preschool age motor coordination using only observations with complete data. Although the percent of children who were missing baseline covariates was small (<10%), approximately 20% of children did not have measures of motor skills in preschool. Therefore, due to missing data, our sample size was reduced which decreased the precision of our estimates. When compared to children without missing data, children with incomplete data were of similar birth weight, had a similar hospital stay after birth, and met 77
87 developmental milestones on a similar time frame. However, the complete cases had a higher mean score on the socioeconomic scale. Thus, our results may not be fully generalizable to very low birth weight children from a lower socioeconomic status. Nonetheless, our study has many strengths. Previous studies evaluated the effect of physical and occupational therapy delivered during the child s first year of life. The focus of treatment during this developmental window was most likely on fluidity of movement and independent transitions with pre ambulatory skills including head control, independent sitting, crawling, and cruising. However, our work focuses on therapy between one and two years of age where the focus of treatment may include facilitation of foundational skills of ambulation, strengthening, coordination, and balance. This type of treatment may more directly carry over into improvement in more complex movement patterns. Moreover, our work evaluated acquisition of individual preschool motor skills compared to scores on a standardized assessment. Although standardized assessments are useful to compare children to a developmental norm, standard scores may be highly variable in infants and toddlers and the sensitivity of standard scores to detect motor coordination difficulties, especially among children with DCD, has been questioned in the literature We found that interventional therapy was beneficial for selective skills, where therapy appeared to have little effect on the achievement of other motor tasks. Assessment of individual skills may therefore be useful to evaluate effects of interventions in this population. 78
88 We used data from a prospective longitudinal study which was representative of children in the United States born in the year Researchers interviewed families at multiple developmental stages (9 months, 2 years, preschool age) which most likely limited poor recall of whether or not the child was receiving occupational or physical therapy services. Moreover, researchers implemented quality control procedures for direct child assessments. Even though the researchers did not assess reliability of the gross motor assessment, the field investigators agreed on the scoring of direct assessment of fine motor talks approximately 90% of the time. 85 In our analysis, we used rigorous methods to both select appropriate confounding variables and to balance the distribution of these variables between treatment groups. We considered the sensitivity of our findings to children that did not have a similar need for treatment and who were treated contrary to their estimated propensity for treatment. Our findings were robust to these sensitivity analyses. In a sample of children born VLBW who were at risk for poor motor coordination in childhood, we found that those who received interventional physical and occupational therapy between nine months and age two were more likely to successfully perform higher level coordination tasks compared to children who did not receive these services. Providing treatment to these children while ambulation, coordination, and balance skills are emerging may optimize health in function in school age children. The implications for 79
89 improvement in motor performance may have far reaching effects on physical activity, school performance, and self-esteem perhaps into early adulthood
90 Chapter 5 AN EMPIRICAL COMPARISON OF TREE-BASED METHODS FOR PROPENSITY SCORE ESTIMATION: PHYSICAL AND OCCUPATIONAL THERAPY SERVICES AND PRESCHOOL AGE MOTOR ABILITY g Introduction Research treatment effectiveness in non-randomized studies is complicated by exposure group differences on measured and unmeasured characteristics that are independently related to the outcome of interest. Propensity scores are commonly used to control for confounding when estimating treatment effects in non-randomized studies. The propensity score is the probability of receiving treatment given confounders. 14 Subjects with similar propensity scores can be expected to have similar values on measured background characteristics. Once one conditions on the propensity score, differences in measured characteristics between the treatment groups should be from chance alone. 14 g Stephanie Watkins MSPH, MSPT, Brookhart M A PhD, Jonsson-Funk M PhD, Rosenberg S. A. PhD, O Shea M. MD MPH, Daniels J PhD. An empirical comparison of tree based methods for propensity score estimation: physical and occupational therapy services and preschool age motor ability (Under Review: Child Development). 81
91 Logistic regression is frequently used to estimate propensity scores, but requires several assumptions. The relation between continuous and ordinal independent variables and the dependent variable logit must be linear. Furthermore the joint effect between independent variables in the model must be considered, as well as the functional form of covariates or interaction terms. 15 Violations can result in misspecification of the propensity score model and the resulting effect estimate may be biased. 16 Regression tree based methods, including Bagging and Random Forest classification (RFC), are non-parametric methods derived from learning based algorithms which offer alternative strategies for generating predicted probabilities of treatment. The methods use a series of classification trees to estimate the average probability of membership in a given class. These techniques have been suggested to have improved predictive accuracy when compared to classical statistical techniques. 59 For example, in simulation studies, regardless of nonlinearity or non additivity, random forest performed well in terms of covariate balance between treatment groups and may result in further reduction in bias of the effect estimate when compared to traditional logistic regression. 17,18 There has been relatively little investigation into the use of tree based methods to estimate the propensity score. 58 In this article, we illustrate the use of two tree based methods, bagging and RFC, in the context of an analysis to understand the effect physical and occupational therapy services on the motor skills of preschoolers who were born with very low birth weight (VLBW). We consider the propensity scores generated by bagging and RFC as well as two 82
92 additional estimation approaches: a single classification tree and a main effects logistic regression model. We then compare the distribution of the estimated propensity scores and both the balance of covariates as well as effect estimates after applying inverse probability of treatment weights (IPTW). Conceptual Overview Classification Trees Classification tree analysis is a non-parametric method commonly used in data mining where a set of independent variables are used to predict membership of observations in a given class of the dependent variable. The method evaluates the relationship between predictors and treatment with a learning algorithm using decision trees to partition observations into nodes with similar probabilities of class membership in the treatment group. 59 The data set is partitioned until nodes, or branches of the tree, are as homogenous as possible with respect to class membership. 101 The tree begins with a root node and continues to split until the nodes reach either a given sample size or a given level of impurity reduction. At each terminal node, the algorithm predicts the response class by taking the majority vote from all of the observations within a given node. 68 Despite the popularity of this data mining method, results from a single classification tree are highly variable and are known to be highly unstable. For example, the rank of each variable in the classification tree as well as the cut point of the variable is strongly dependent upon the distribution of observations in 83
93 the data. With small changes in the data structure, the order of variable selection or the cut point of the variable may change resulting in an alternative tree structure. 68 Bagging and Random Forest Classification Both bagging and RFC are tree based methods that attempt to improve the stability of tree based regression methods based on single trees. These methods aggregate predictions over multiple individual classification trees to improve the overall predictive performance of the algorithm. Bagging randomly draws a series of bootstrap samples from the data, and creates individual classification trees for each sample. With each of these bootstrap samples, the data will vary slightly from the previous sample. Furthermore, each individual tree may then vary, perhaps substantially, from the previous tree. The algorithm then aggregates the predicted probability of class membership over the series of classification trees. 69 Random forest classification utilizes this same bootstrap method. However, random forest adds an additional level of variability to the algorithm. During construction of the individual classification trees, a random sample of predictor variables is chosen to split the data at each node. Therefore, each individual tree is even more diverse compared to the trees from bagging alone. 68 Although individual classification trees are inherently unstable, bagging and random forest classification have been shown to produce robust estimates. In 84
94 both empirical and simulation studies, estimates aggregated over a series of classification trees show improvements in prediction accuracy when compared to a single classification tree Bagging is suggested to equalize the influence of given observations in the data. Thus, data points which strongly influence the classification algorithm are downweighted. 68 Furthermore, the additional level of randomness introduced by RFC creates additional diversity between trees with a lower upper bound of error. 69 Overall, these methods produce a more robust final estimate with decreased variability. 69 Methods We illustrate the use of three tree based methods: bagging, RFC, and a single classification tree, as well as parametric logistic regression in an analysis that evaluates the effect of physical and occupational therapy services on motor performance among preschool children who are VLBW and at risk for developmental coordination disorder (DCD). DCD is a condition defined as impairment in the development of motor coordination among children without known physical or neurological impairments. 36 Children with DCD are at an increased risk for low academic performance, low self-esteem, and limited physical activity which may continue into adolescence. Children who are born with VLBW are six times as likely to have DCD compared to their normal birth weight peers
95 Population and Variables Using data from the Early Childhood Longitudinal Study Birth Cohort (ECLS-B), our sample included approximately 500 VLBW children who were without known mobility problems and appeared to be meeting normal developmental motor milestones at nine months. Researchers asked families between nine months and age two if their child had ever received physical or occupational therapy services. We considered the child exposed if the child ever received either therapy during this time period. Researchers directly assessed preschool gross motor performance using items from the Bruininks-Oseretsky Test of Motor Proficiency (Bruininks) and the Movement Assessment Battery for Children (MABC). Both assessments are norm referenced and designed to assess both gross and fine motor functioning from childhood through adolescence. 62 Researchers directly reported the child s ability to complete the following tasks on a pass fail basis: skipping eight consecutive steps, hopping on one foot five times, walking backwards six steps on a taped line, and standing on one foot for ten seconds. Based on a priori substantive knowledge, we created a directed acyclic graph and determined a minimum sufficient conditioning set of confounders. The final covariates in our analysis included: gestational age, birth weight, length of the child s hospital stay after birth, age at which the child began to walk with assistance, race/ethnicity, parental education, socioeconomic status, and the child s nine month Bayley Short Form-Research Edition (BSF-R) motor T score. 86
96 The BSF-R is a subset of items taken from the standardized Bayley Scales of Infant Development Second Edition to assess children s cognitive, motor, and language skills. Propensity Score In this observational study, treatment assignment into physical and occupational therapy services was not randomized. Children and their families may participate in therapy treatment based on a host of factors including their child s functional ability and access to healthcare. Therefore, the distribution of baseline characteristics between children in the treated and untreated groups may differ and children between these two groups would not be exchangeable. We estimated the average treatment effect of early childhood physical and occupational therapy using a propensity score approach to control for confounding. Estimating the Propensity Score We estimated the conditional probability of treatment given the identified confounders stated above using the following four methods: bagging, random forest classification, a single classification tree, and logistic regression. Using the R statistical platform we first used the RandomForest package to estimate the predicted probability of class membership in the therapy group given the following covariates: gestational age, birth weight, length of the child s 87
97 hospital stay after birth, age at which the child began to walk with assistance, race/ethnicity, parental education, socioeconomic status, and the child s nine month BSF-R Motor T score. Race/ethnicity and parental education were entered as a series of indicator variables; all other variables were entered as continuous variables. All categorical variables were encoded as factors in the R environment. This transformation ensured that the R software recognized these variables as categorical responses. We set the random forest algorithm to generate 1,000 individual classification trees. The suggested default for the number of random splitting variables at each node is the square root of the number of variables in the algorithm. Our model included 19 variables, so we set the default to 4 variables chosen at each split. We checked the sensitivity of the error rate to our chosen parameters by allowing the number of trees to vary between 250 and 1,000 and the number of randomly chosen variables to vary between 2 to 7. The error rate for the algorithm is generated from the 33% of the data remaining that was not used to form the classification trees. For example, with each bootstrap sample, the remaining data ( 33%) not in the sample is entered into the classification tree. The error in these out of bag predictions is collected over the series of trees to determine the final error rate over the forest. The error rate is suggested to be robust if the predicted probabilities of class membership are aggregated across a sufficient number of trees. However, if the number of trees are too few, then the 88
98 error rate may be upwardly biased. 74 The algorithm may therefore be a better predictor of the outcome than suggested by the error rate. We then implemented the Ipred package and the Tree package using the R statistical software to estimate the predicted probabilities of having class membership in the treatment group using bagging and a single classification tree respectively. For both models, we entered the same covariates as in the RFC algorithm. In the Ipred package, we generated a series of 1,000 trees and checked the sensitivity of the error rate by varying the number of trees between 250 and 1,000. For both methods, the splitting variables were chosen by the algorithm in a hierarchical fashion based on impurity reduction. Lastly, we generated predicted probabilities of receiving physical or occupational therapy using logistic regression. As in common practice, we entered potential confounders as main effects. Race/ethnicity and parental education were modeled as indicator variables; all others were entered into the model as continuous terms. Statistical Analysis We generated unique inverse probability of treatment weights using each method: RFC, bagging, a single classification tree, and logistic regression. These weights create a pseudo population of children with a distribution of covariates that represents the combined sample. 92 To estimate the average treatment effect, treated children received a weight of (1/propensity score). 89
99 Children in the untreated group received a weight of (1/ (1-propensity score)). To evaluate the balance of each propensity score method, we then calculated the standardized difference of the weighted confounding variables between the treatment groups. Standardized differences represent the differences between the means by therapy status in units of standard deviations. The estimate is calculated as d=(xbar therapy -xbar no therapy )/sqrt(s 2 therapy + S 2 no therapy )/2)) 75. Although there is no standard criterion to determine balance between treatment groups, experts suggest a standardized difference of < We then averaged the standardized differences across all confounders to determine the mean standardized difference (MSD). Finally, for each of the four methods, we estimated the average effect of physical and occupational therapy on preschool motor performance using logistic regression and inverse probability of treatment weights (IPTW) in SAS version 9.2. We controlled for birth weight, age at which the child walked with assistance, and the child s length of hospital stay after birth. The relationship between length of the child s hospital stay, birth weight, and age at which the child walked with assistance and the log odds of preschool motor development appeared linear and were entered as continuous variables. We stabilized the weights to obtain a narrower confidence interval around the estimated effect estimate by multiplying the child s IPTW by the probability of receiving the treatment that they actually received
100 Missing Data In these data, approximately 7% of children were missing at least one covariate used to estimate the propensity score. We therefore included only children with complete data to estimate the predicted probability of treatment. Thus, we compare the balance of covariates and the estimated effect estimates for each method among the same group of children. Results The sample included approximately 500 h children weighing less than 1500 grams at birth of which 6.5% of children received therapy between nine months and age two. Children who received therapy were more likely to be white (58.06% vs %) and male (61.29 vs %) and were born on average two weeks earlier in gestation. Developmentally, the treated children sat independently, crawled, and walked with assistance on average, one month later than the untreated children. Five minute APGAR scores were similar between the two groups (Table 13). Random Forest Classification/Bagging: Error Rate In our sample of approximately 450 children with complete covariate data, the algorithm misclassified treatment status 15.65% of the time over 1,000 trees with 4 variables randomly chosen at each split. Overall, there was little change in h Numbers are rounded to the nearest 50 for data security 91
101 the error rate with small changes in the number of splitting variables. The error rate over our chosen range of trees and number of splitting variables varied by approximately 0.50%. The misclassification rate for the bagging algorithm over 1000 trees was 15.65%. The misclassification rate increased to 17.10% with only 250 trees (Table 17). Propensity Score The mean predicted probability of receiving treatment for the children who received therapy ranged between 0.16 to 0.20 across the RFC and bagging tree based methods and the main effects logistic regression model. The single classification tree yielded a predicted probability of treatment that was approximately twice that of the other three methods for children who received therapy. The mean predicted probability of treatment for children who did not receive therapy ranged between 0.05 and 0.07 across all four methods used to generate the propensity score. Children in the treatment groups received similar weights across estimation methods with the exception of the single classification tree algorithm. Children had a higher propensity for treatment and received a lower weight compared to the other estimation methods. The weights for children who did not receive physical or occupational therapy were similar for all four methods (Table 18). 92
102 Covariate Balance In the unweighted sample, the MSD across strong confounding covariates was The length of the infant s hospital stay after birth (Standardized Difference: 0.73) and the age at which the child crawled and walked with assistance (Standardized Difference: 0.74 and 0.64 respectively) had the greatest imbalance between the treatment groups. After applying the weights generated by the RF and bagging tree based methods, only a negligible difference existed in the distribution of baseline covariates by treatment status. The MSD across covariates was 0.07 using the random forest method and 0.03 using the bagging algorithm. After implementing the random forest algorithm, length of hospital stay and birth weight remained slightly unbalanced (Standardized Difference: 0.14 and 0.08 respectively). The mean length of hospital stay and birth weight after applying the bagging method was quite similar (Standardized difference: 0.03 and 0.02 respectively) by therapy status (Table 19). The MSD for the covariates weighted with the logistic model was The standardized difference for birth weight, length of hospital stay, and age at crawling and walking with assistance was greater than the suggested 0.10 criterion for these covariates. The propensity score estimated by the single classification tree demonstrated a poor ability to balance the covariates between treatment groups. These covariates continued to differ by approximately 0.18 standard deviations (Table 19). 93
103 Multivariable Regression Overall, in the weighted multivariable logistic regression models, receipt of interventional physical or occupational therapy services between nine months and age two was associated with improvement in preschool coordination skills in this VLBW population. The effect was consistent across both the tree based methods as well as the logistic method used to generate the propensity score; however the magnitude of the effect as well as the precision of the estimate varied by method. The random forest algorithm produced the most precise estimate in the weighted model for hopping and single leg stance. The bagging algorithm produced slightly more precise estimates for the other preschool skills (Table 5). When we used logistic regression to estimate the propensity score, the confidence intervals for the effect estimates were the least precise. The magnitude of the estimate for skipping ability was largest (OR: 3.34, 95% CI 1.07, 10.44) using the bagging technique and smallest (OR: % CI: 0.71, 7.71) using logistic regression to estimate the propensity score. The bagging estimate continued to generate the effect estimates of the greatest magnitude for the additional motor outcomes modeled in these data. In general, logistic regression estimation of the propensity score produced the most conservative effect estimates for the majority of preschool motor items. The single classification tree algorithm did not balance the covariates well between treatment groups, and therefore the results of the weighted models using this method are not presented (Table 20). 94
104 Discussion In this paper, we illustrated the use of various tree based methods to estimate the predicted probability of receiving interventional physical and occupational therapy services in a sample of VLBW children. Furthermore, we considered how propensity scores estimated from bagging and RFC balanced covariates between treatment groups and compared these methods with the performance of propensity scores estimated from a single classification tree as well as traditional logistic regression. In our sample, bagging and RFC achieved the best overall balance of covariates across treatment groups. Among all methods used to estimate the propensity score, the mean standardized difference of all covariates was smallest for these two methods. The propensity scores estimated from the logistic model showed a marginal imbalance in covariates, where the single classification tree method had the worst performance. These findings are supported by the study of Lee and colleagues who studied machine learning methods when estimating the propensity score in simulated data. In a small sample, when compared to standard logistic regression and a single classification tree, random forest and bagging returned the lowest mean absolute standardized differences. The standardized differences between individual covariates were also less dispersed with these two methods. The resulting bias in these simulated models was highest when the propensity score was estimated from a single classification tree and lowest 95
105 when the propensity score was estimated using either bagging (10.3%) or RFC (7.7%). 17 In our data, it appeared that propensity score estimation using logistic regression did a reasonable job of balancing the covariates between our treatment groups. However, it is unknown how well this model performed in reducing the amount of bias since the true treatment effect is unknown. While the effect estimates assessing preschool coordination were similar between the two models when we estimated the propensity score by RFC and logistic regression, the effect estimates for the child s ability to balance differed by approximately 13%. In simulation studies, a main affects logistic regression model performed adequately in reducing bias when the relation between independent variables is linear and additive. 17 However, researchers reported a mean absolute bias of 30% in the presence of non additivity and non-linearity. 17 For comparison, we used a main effects only logistic regression model which appears to be commonly used by researchers. However, in our data, the relation between several confounders and the logit of receiving treatment was curvilinear. Due to our small sample size, we were limited in our ability to test for interactions. Therefore the difference in the estimated effects may be due to lack of consideration of the relation between confounders and the logit of receiving treatment. However, by modeling the functional form of the variable, for example including spline terms, and considering interactions the logistic regression model 96
106 may be more effective. However the non-parametric random forest algorithm naturally incorporates interactions as well as non- linear functional forms which may be more feasible for the naïve researcher. In our analysis, ensemble tree based methods, including random forest and bagging, appear to outperform traditional logistic regression methods with main effects. Both tree based methods performed well in balancing the covariates between treatment groups, however the bagging method resulted in effect estimates of greater magnitude. It is possible that the additional level of randomness implemented by the random forest classifier allowed less important variables to be expressed in predicting therapy exposure thereby attenuating the magnitude of the effects. In addition to the improved performance of these methods over logistic regression, random forest performs well against other classifiers in simulated data. 69 For example, the predictive accuracy of a single classification tree is highly variable to small changes in the data structure. However, the variability introduced by aggregating responses over bootstrap samples of classification trees with variable tree structures improves the predictive accuracy of the algorithm. 68 Thus we would expect the predictive accuracy of the RF algorithm to also be robust to other populations of VLBW children with a similar distribution of baseline characteristics. In this study, estimation of the propensity score using ensemble tree based methods produced the smallest standardized differences across 97
107 covariates. The resulting effect estimates varied slightly depending on the method used to estimate the propensity score. Although, we are unsure of the true effect estimate, studies show that the effect estimates estimated from RFC and Bagging are the least biased and logistic regression may adequately reduce bias in the presence of non-additivity and non-linearity. However, in many epidemiological studies, many exposure outcome relations are complex in nature. Estimation of the propensity score using tree based ensemble methods may be a useful method to evaluate the effect of interventions on childhood motor skills. These methods appear to be a robust creating better covariate balance for control of confounding and further bias reduction compared to logistic regression. 98
108 Chapter 6 DISCUSSION In this dissertation work, we estimated the effect of interventional therapy services delivered between nine months and two years of age on preschool motor skills in a population of low birth weight children. Interventional physical and occupational therapy services are frequently delivered to low birth weight children in early childhood to facilitate transitional movement and to promote strength, balance, and coordination. It appears based on the published literature that therapy may have some beneficial effects on neurodevelopment, particularly among very low birth weight children. 46,51 The majority of present studies, specific to interventional therapy, evaluated treatment during the child s first year of life with follow up through age two. Yet, little is known regarding the efficacy of services on more complex motor ability later in childhood. In these data, we first defined a population of children who weighed less than 2500 grams. This cohort comprised a heterogeneous group of low birth weight infants with diverse functional ability. Children in the treatment group had a lower mean baseline motor score, a longer average hospital stay after birth, and were significantly delayed on fundamental motor milestones compared to the children who didn t receive treatment. For example, forty six percent of low birth weight children in the treatment group were unable to sit independently without 99
109 support during the nine month assessment, yet only 7% of children in the untreated group had not attained this motor milestone. Due to such a disparate need for therapy between the two groups, we further defined a cohort of very low birth weight children with similar functional ability that were at risk for developing delays in motor coordination in preschool. These children appeared to be achieving early motor developmental milestones during an age appropriate developmental window and, at approximately 11 months of age (mean age of the nine month assessment), did not have a physician documented upper or lower extremity movement problem. Children who have difficulty with coordination often avoid participation in social play and physical activities that involve these skills. In turn, many children with impaired coordination have both low self-esteem and poor fitness levels. 5,7 Interventions which promote motor coordination among very low birth weight children are important since poor fitness levels in early childhood are important predictors of physical activity into adolescence. 93 Specifically, children who are born with very low birth weight are six times as likely to experience motor coordination disorder compared to children born with normal birth weight. 10 In this sample of children with similar need for therapy, we then estimated the effect of interventional physical and occupational therapy on motor coordination in preschool. Very low birth weight children who received either physical or occupational therapy between nine months and two years of age showed improved ability in preschool motor coordination compared to children who did not receive services during this time period, although the estimate was 100
110 imprecise. Few studies have evaluated the effect of therapy services on child motor development after age two in this population. Yet, these results support those of Riethmuller and colleagues who, in a systematic review, determined that interventions promoting motor development among children of normal birth weight, improved children s locomotor ability at preschool/school age. 13 Specifically, in our study, therapy was beneficial for a child s ability to walk backwards on a line and to skip eight consecutive steps. Despite these encouraging findings, there appeared to be no effect of therapy on the child s ability to balance, while children in the treatment group, although not statistically significant, appeared to do marginally worse with hopping. Both hopping and maintaining single leg stance involve components of both strength and motor coordination. There is the possibility that therapy may improve performance with these skills, yet with greater intensity or perhaps duration of treatment that was not reflected in our crude measure of treatment. ECLS B captured whether a child received treatment for individual therapies between nine months and two years of age. Yet, the amount of therapy that they received was reported for all therapies, including special education, during that time period. We were unable to accurately estimate the amount of treatment per month from an estimate that included multiple disciplines. There is a strong possibility that there may be a dose response relationship between intensity of physical and occupational therapy and success with preschool motor skills. For example, a greater amount of therapy during the toddler years may be required for a child to achieve success with motor skills that involve components 101
111 of strength and motor coordination compared to skipping, which lacks the strength component. With additional information regarding the child s intensity of treatment, our effect estimates may have been larger in magnitude. By using such a crude estimate, with overall regression of intensity towards the mean, the true measure of the association may have been attenuated. There is also the potential for residual confounding in the data that may be stronger for these two motor items. For example, children that are very low birth weight are often born with low muscle tone. Low muscle tone in turn affects the child s muscle force production. If children in the treatment group had lower muscle tone than the untreated children, this confounding could have attenuated the true effect of therapy. In this analysis, we analyzed the effect of therapy among children with similar baseline functional ability while controlling for baseline motor score and length of hospital stay after birth among other confounders. However, it is a possibility that our covariates did not capture a proxy for muscle tone, leaving residual confounding in the estimated effect estimates. To address confounding using measured covariates, we implemented a robust propensity score approach to balance the distribution of known confounders between our treatment groups. To estimate the propensity score, we used a novel method, random forest classification, which has been suggested in simulation studies to achieve better covariate balance and to produce less biased effect estimates when compared with commonly used logistic regression models. However, this approach is rarely used in practice
112 In our sample, we first used multiple methods to determine confounders to enter into the propensity score model. To build a parsimonious model in the context of our small sample size, we considered strong confounders in addition to variables that were strongly associated with the outcome. We considered multiple methods to assess confounding: a directed acyclic graph, change in the effect estimate of more than 10% when a confounder was dropped from the model, and the association of confounders and the outcome among children who did not receive the treatment. We compared covariate balance between treatment groups when the sample was weighted with the propensity score estimated from random forest classification to that of alternative methods used to estimate the propensity score. Our results were similar to that of Lee and colleagues who reported, when compared to standard logistic regression and a single classification tree, random forest and bagging returned the lowest mean absolute standardized differences across these algorithms. 17 In these data, bagging and random forest classification achieved the best overall balance of covariates across treatment groups. The propensity scores estimated from the logistic model showed a marginal imbalance in covariates, where the single classification tree method had the worst performance. We also considered the results of this estimation method on bias of our estimated effect estimate. The random forest algorithm naturally models higher order effects and non-linear functional forms. Simulation studies suggest that 103
113 logistic regression main affect models perform adequately in reducing bias when the relationship between the treatment and independent variables is non-linear and non-additive. Yet, the mean absolute bias is up to 30% in the presence of these relationships. 17 The relationship between receiving interventional physical and occupational therapy services and covariates is complex and most likely does not conform to these model assumptions. In practice, use of these tree based methods, either random forest classification or bagging, are relatively straight forward to implement. The algorithms used to estimate the predicted probability of treatment are executed using the free R statistical platform. Documentation is available for each statistical package (RandomForest,Ipred) to guide the investigator. In propensity score estimation, both of these tree based methods offer several advantages over estimating with propensity score using traditional logistic regression. These methods are non-parametric where all predictor variables are partitioned in the feature space into rectangular areas where observations have similar responses. This partitioning naturally considers the functional form of the data as well as higher order interactions. 68 When using parametric models, one needs to consider these relationships to prevent model misspecification. For example, if there is strong non additivity between confounders and the predicted probability of treatment, a model with only main effects may misspecify the propensity score model producing a biased effect estimate. For the naïve researcher, both tree based methods require less 104
114 decision making during model building. One simply enters relevant confounders into the tree based algorithm to estimate the predicted probability of treatment. In simulation studies, when compared with logistic regression, these methods do a better job balancing the distribution of confounders between treatment groups and result in less biased effect estimates. 17 Second, these methods are useful to estimate predicted probabilities of treatment in the context of small sample sizes where there is the potential for higher order interactive effects. When using traditional parametric models, entering multiple interaction terms in a model with a small sample size may result in cell counts that are too small for parameter estimation. 68 However, tree based methods are advantageous for small sample sizes with large numbers of parameters. At each split, only a select number of random variables are considered. Moreover, each of these variables is considered individually in a sequential order. This approach was particularly useful in our analysis which included a small sample of approximately 500 VLBW children where the propensity to receive physical or occupational therapy is most likely not linear and may vary within levels of confounding variables: SES for example. Although these methods offer improvement in propensity score estimation when compared to logistic regression models, the classification made by the algorithm may be difficult to interpret. The algorithm improves the predictive performance by perturbing the data to grow many trees from bootstrap samples. 105
115 In addition the number of predictor variables available to split the data at each tree branch is random, therefore decorrelating the tree structure and increasing the variability. However, at the cost of improving prediction accuracy, we are unable to determine the structure of an individual tree as well as the pathway that was taken for classification based on the predictors in the algorithm. 68 The main limitation of the random forest algorithm, is its potential to overfit the data. In this case, the algorithm mirrors the data too closely, including the true structure of the data as well as the random variation, resulting in poor generalizability to other samples. Breiman addressed this issue reporting that the algorithm did not result in overfitting of the data. 69 However, recent work by Segal in 2004 reported that the algorithm may overfit the data, specifically in the context of deep trees. 103 Whether the algorithm overfits the data and under which parameters is still being researched. The number of variables randomly chosen to split the data in our algorithm was modest (N=4), and our trees were not extensively deep. Based on the findings of the Breiman, we would expect our findings to generalize to other groups of VLBW children with a similar distribution of baseline covariates. Finally, in our work, we checked the sensitivity of our estimated effect estimates by restricting our population to children in the treated and untreated groups with overlapping propensity score distributions. Moreover, from this overlapping distribution, we then trimmed children who were treated most contrary to prediction based on the 1 st and 99 th percentile as well as the 2.5 th and 106
116 97.5 th percentile of the distribution. Here, assuming uniformity of effects, there may be an unmeasured confounding factor that influences why an untreated child who should have received the treatment did not and vice versa for the treated group. For example, children who did not receive therapy yet had a propensity to receive treatment that was greater than the 99 th percentile were excluded. Children in the treatment group with a propensity for treatment lower than the 1 st percentile were also excluded. All of our estimated effect estimates were similar for each of these sensitivity analyses. Thus, we feel our results are robust to unmeasured confounders which may have influence treatment decisions. In these data, we used robust methods to control for confounding by severity of the child s baseline functional ability. While we limited our cohort to children with similar functional ability at nine months to decrease bias, we greatly reduced our sample size from approximately 2,500 children to 500 children. This decision was a tradeoff between bias and precision. Without restricting our population, the bias due to differential need for therapy may have been too heterogenous to account for with propensity score methods. Yet, restricting our sample size limited our power to detect an effect and decreased the precision of our estimate. In addition to our small sample size, additional children (approximately 20% of the cohort) were dropped out of the model due to missing data on preschool motor skills. Children who did not have complete information on their 107
117 ability to perform preschool motor skills were more likely to be from a lower socioeconomic status. Children from a lower socioeconomic group may experience different levels of cognitive stimulation in the home as well as different environmental stressors which may alter their response to therapy treatment. Additional work on disparities in response to treatment may be an interesting avenue for future work in this area. Overall, methodologically, we used advanced statistical tools and discovered that physical and occupational therapy had a modest positive effect on preschool motor skills. The magnitude of our effect was most likely attenuated and imprecise due to our small sample size, lack of complete data on preschool motor skills, and use of a crude measure of therapy treatment. However, this body of work also has important implications for evidence based clinical practice. Major developmental milestones among children born with very low birth weight are initially delayed, yet these children show a catch up effect to that of normal birth weight children before or near two years of age. 33 Once these children have reached appropriate age adjusted motor milestones, clinicians may consider discontinuing services. However, these children are at increased risk of motor coordination disorder later in childhood. 10 Providing treatment to these children while ambulation, coordination, and balance skills are emerging may optimize health and function at school age. The implications for improvement in motor performance may have far reaching effects on physical activity, school performance, and self-esteem perhaps into early adulthood. 98,99,
118 In our study, with only a crude measure of services, receipt of physical or occupational therapy services during the toddler years showed a modest, though imprecise effect, on preschool motor coordination. Our misclassification of treatment during this time frame was most likely minimal since treatment plans are typically written for twelve month periods. Yet, our measure did not accurately reflect timing, amount, or duration of therapy which are important parameters when tailoring therapy to improve patient outcomes. One may anticipate that the magnitude of effect may actually be larger than our modest effect, especially with greater intensity or duration of therapy. This study provides initial support that physical and occupational therapy may be beneficial in improving preschool motor skills among children born VLBW. Yet additional studies should increase the sample size to improve both precision and power of the study as well as collect detailed information on treatment measures. For instance, future work should consider specific parameters of treatment. In the early intervention setting, there is frequent clinical discussion regarding whether to treat children in a clinical setting versus the child s natural environment. 104 In these settings, some children are treated in a group where other therapists treat children one on one. Moreover, there is a move toward an interdisciplinary treatment model. For example, speech therapy and occupational therapy may co treat a child where each therapist focuses on a particular component of a play activity. 109
119 In addition to treatment setting, one should also consider the amount of time per week the child receives therapy. It would be helpful for clinicians to understand the dose response relationship between amount of therapy and the child s motor performance. Perhaps there may be a minimal threshold of treatment that the child needs to gain mobility skills and a threshold where additional treatment offers no additional benefit. One must also consider the duration of treatment and how optimal frequency of therapy may vary depending on the length of treatment over time. Understanding these relationships would help to optimize motor function in this very low birth weight population. In addition to treatment parameters, future studies may also consider the method in which motor performance is evaluated. In our work, we used specific items which assessed motor coordination taken from a standardized assessment. This approach was novel, since the majority of studies in this substantive area measured motor performance using a standardized score. In many of these studies, there was no effect of therapy on infant motor ability. 49,50 However, there is the possibility that therapy is more or less beneficial for targeted skills during different developmental windows. Perhaps there is no difference in motor score by treatment status at follow up, yet children who receive therapy may achieve a given skill earlier in development. There is the possibility that therapy may differentially impact specific skills, which would be masked using a composite standardized score. Although standardized assessments are useful to compare children to a developmental 110
120 norm, standard scores may be highly variable in infants and toddlers and the sensitivity of standard scores to detect motor coordination difficulties, especially among children with DCD, has been questioned in the literature In our work, therapy was beneficial for items involving complex motor coordination (skipping, backwards walking), yet there appeared to be no effect for skills that involved a strength component to the task. Although, standardized assessments provide a score for service eligibility as well as a population percentile reference for children the same age, there may be some benefit to considering either subscale scores or individual tasks. Specifically, future studies may consider attainment of individual skills perhaps using a survival analysis approach. In this body of work, our sample included children born VLBW with similar functional ability at nine months (successfully cruising), without known congenital anomalies, and who did not appear to have mobility problems with their arms or legs. Due to small cell counts, we were therefore unable to complete an analysis of how our effect may vary within levels of maternal characteristics. However, working in this small sample, we were able to illustrate how we can gain increased precision of our effect estimates when we represent confounders using one scalar, the propensity score, compared to controlling for confounders in a standard logistic regression model. Moreover, this analysis demonstrated the benefits of estimating the propensity score with an ensemble method tree based method such as random forest classification. This method is particularly useful 111
121 when one has a small sample size with a large number of confounders to be entered into the propensity score model. In summary, we estimated the effect of physical and occupational therapy services between nine months and two years of age and preschool motor coordination in a sample of very low birth weight children at risk for impaired school age motor coordination. We applied robust methods, inverse probability of treatment weights, among children with similar need for therapy to estimate the average effect of therapy on preschool motor outcomes. We considered several novel methods, random forest classification and bagging, to estimate the predicted probability of treatment. In this sample, very low birth weight children, without congenital anomalies who appeared to be meeting normal milestones at nine months, and who received therapy were more likely to be successful with complex motor coordination compared to children who did not receive the treatment. Although our magnitude of the effect was modest and imprecise, most likely due to our small sample size and crude estimate of treatment, these findings provide initial support that providing therapy services may attenuate preschool motor coordination impairment among children born VLBW. Although modest, these findings provide initial support for evidence based treatment of children born VLBW. Even though additional work is needed to more clearly define initiation, duration, and timing of therapy, these findings support the general delivery of early intervention physical and occupational therapy services to facilitate preschool motor performance in these children. 112
122 Although VLBW children may catch up to their normal birth weight peers during their toddler years, these children are at risk for poor coordination later in childhood. Healthcare reimbursement organizations and policy makers should consider these findings when making decisions regarding reimbursement and program guidelines for early intervention services for children born VLBW. Clinically, these results support the treatment of VLBW children during the toddler years to facilitate motor control as new complex motor skills are beginning to emerge. Additional research is needed to fine tune the parameters of treatment in this population as well as the effect of therapy among children born VLBW with more severe neurological impairments. 113
123 Table 1. Skilled Physical/Occupational/Physiotherapy Intervention and Motor Outcomes in LBW Preterm Children Author Year Study Design Population Sample Size Exposure Frequency Timing of Exposure Goodman et al 1985 RCT <1700 grams, GA<34 weeks N=107 Outpatient NDT 1xmox45minx12mo PT in the first year of life Piper et al 1986 RCT <1500 grams N=115 Physiotherapy Every 2 wks for 9 mo From 40 wks postmentrual age Barrera et al 1986 <1500 grams, grams N=20(<1500 grams) N=39 (1500 to 2000grams) Group 1: Developmental therapy ( training in speech and OT) ; Group 2: educational training of parent 1-2 hrs wkly X3mo, 2Xmo 6 mo, quarterly until 1 year From 4 months CA Rothberg et al 1991 RCT <1700 grams, <34 weeks, NICU stay N=25 (normal) N=24 (at risk) Treated monthly at hospital with home program 45 minutes session in the hospital From 3 months- 12 months 114 Girolami and Campbell 1994 RCT <35 weeks and <1800 grams with 3 abnormal reflexes on NBAS at weeks postconception N=19 Developmental PT Salokorpi 1998 RCT <1000 grams N=104 OT NDT and SI 60 minutes per week treatment session 2Xday 15 mins weeks post conception over 7 to 17 days 6mo (adjusted age) until 12 months ( adjusted age) Appendix Lekskulchai and Cole 2001 RCT GA<37 weeks N=34 control, N=38 intervention Developmental PT intervention Monthly Term age until four months corrected age Yigit 2002 RCT <34 weeks and <2,000 grams considered "low risk" N=160 Physical Therapy 1xmo 9 months and every other month until mo Birth until age 2 Salokorpi et al 2002 RCT <1000 grams N=126 OT NDT and SI 60 minutes per week 6mo (adjusted age) until 12 months ( adjusted age) Cameron 2005 RCT <32 weeks, <1500 grams N=72 Neonatal developmental program delivered by pediatric physiotherapists Early PT intervention Koldewijn 2010 RCT <32 weeks and/or <1500 g N=176 Infant Behavioral Assessment and Intervention Program 6-8 sessions delivered by a pediatric PT Post discharge intervention until 6 months 114
124 Table 1 Cont. Skilled Physical/Occupational/Physiotherapy Intervention and Motor Outcomes in LBW Author Age at Assessment Outcome Measures Main Effects Subgroup Analyses Goodman et al 12 mo Griffith GCI and locomotor subscales No significant difference in DQ score or locomotor subscale score between intervention and control for either "at risk" or "normal" low birth weight infants No Piper et al 6 months, 12 months Wolanski Gross Motor Evaluation, Milani Comparetti Motor Development Screening Test, Griffith Mental Development Scale No significant differences on any dependent measure of motor performance between intervention and controls at 6 months or 12 months No Barrera et al 16 months Bayley Mental and Motor Score Lower Bayley scored or VLBW compared to LBW. No sig Infants <1500 grams showed greater gains with differences in motor scores between interv and control for either developmental intervention in the Bayley Mental Score than VLBW or LBW groups infants 1500< Rothberg et al 12 months adjusted, two assessments before age 3, and assessment age 6 Griffith Mental Development Scale, Griffith 2 Scale ages 2-8 No difference between physiotherapy and control groups for "normal" or "at risk" children at either 1 year or 6 years No Girolami and Campbell NICU Discharge Neonatal Behavioral Assessment Scale, Supplmental Motor Test SMT exp group has statistically sign higher scores on functional postural scores. Tx group demonstrated more midlien behaviors, anti gravity movement, and head rotation. No differences noted on the Neonatal Assessment Scale. No Salokorpi 3, 6, 9, 12, 18,24 months No difference in neurodevelopment with exception of social development at 12 months No Lekskulchai and Cole 4 months corrected age Test of Infant Motor Performance Intervention group scored signficantly higher on the TIMP than the control group at four months corrected age No Yigit throughout Reflexes and motor milestones No Salokorpi et al age 4 Miller Assessment for Preschoolers No significant difference in any MAP sub scores between groups No difference between groups within strata of neurological status: minor vs not minor impairment at either age 2 or age 4. NO STATISTICALLY SIGN interactions with GA, dev risk score, gender Cameron 4 months corrected age AIMS Assessment at 4 months No significant difference between Median AIMS percentile rank between the two groups at 4 months No Koldewijn 24 months corrected age BSID-II, CBCL Children in the intervention has an increase of 6.4 points ± 2.4 p=0.006 on the motor scale. This estimate was adjusted for perinatal and background variables Subgroup analyses showed improved motor and mental outcomes in intervention infants with bronchopulomonary dysplasia and combined biological and social risk factors 115
125 Table 2. Other Interventions and Developmental Outcomes Low Birth Weight Population and Developmental Outcomes Author Year Study Design Population Sample Size Exposure Frequency Timing of Expsure Resnick 1987 RCT LBW 500 to 1800 grams N=255 Infant Developmental Program (visual, vestibular stim, PROM) by nursing, OT, psychologist through age 2 NICU and twice a month after discharge NICU until age 2 Infant Health and Development Program 1990 RCT Low Birth weigt (<2500 grams) premature (<37 week) infants N=985 Home visits, child attendance at a child development center, parent group meetings Learning activities at child development center 5 days a week Hosppital discharge through 36 months 116 Gianni 2006 RCT <1250 grams N=36 Mother Child Intervention Program: mother support and promotion of perceptual and social cognitive skills Twice a month 3 to 12 months Ho et al 2010 RCT wks and <1500 grams N=24 Massage therapy in the NICU 15 mins 5xwk for 4 wks NICU Hamilton et al 1999 Quasi At risk for Developmental Delay N=11 preterm,sga N=43 Parent Led Motor Skills Post Test 8 wk follow up Normal Birth Weight Population and Motor Outcomes Author Year Study Design Population Sample Size Exposure Frequency Timing of Expsure Riethmuller 2009 Systematic Review Children < 5 yo 10 published studies Motor Development Interventions: delivered by researchers, teachers, parents: non skilled 5-30 hours of instruction Average 11 weeks 116
126 Table 2 Cont. Other Interventions and Developmental Outcomes Low Birth Weight Population and Developmental Outcomes Author Age at Assessment Outcome Measures Main Effects Subgroup Analyses Resnick 12 and 24 months Bayley Scales Experimental group had significantly higher scores mental and physical indices. Lower orevalence of developmental delay in experimental group No Infant Health and Development Program 36 months Cognitive competence ( Stanford Binet), Behavioral competence (CBC), health status (morbidity, functional status, matern perception of child health). Intervention group had significantly higehr mean IQ scores. No difference in mean score or Functional Status II Scale. Among healvier babies, Stanford Binet scores were significantly higher for intervention kids. Small statistically significant behavioral advantage for intervention among less educated mothers 117 Gianni 36 months CA Griffiths Mental Development Scale Ho et al Pre Assessment 34 weeks and post at 38 weeks; Test of Infant Motor Performance No difference in subscale scores at 12 and 24 months. At 36 months children in the intervention had higher mean scores in eye hand coordination,personal social, and practial reasoning skills No No difference in TIMP score gain between groups Looked at differences among kids by GA, BW, TIMP score at 34 weeks. Among babies with an initial low TIMP score (<35 points) the intervention group showed sign higher TIMP score p=0.043 Hamilton et al Post Test 8 wk follow up TGMD:object control skills Statistically sign change in object control total score in the exp group not change observed in the control group No Normal Birth Weight Population and Motor Outcomes Author Age at Assessment Outcome Measures Main Effects Subgroup Analyses Riethmuller Motor Skills 7 studies found statistically significant improvements in motor skills. There was variability in the skills that they assesses: locomotor, object control No 117
127 Table 3. ECLS-B samples sizes for children s receipt of services * Normal Low Very Low Total 9-Month Services Physical therapy Vision services Hearing services Social work services Psychological services Home Service Parent support/training Any services Year Services Speech therapy Occupational therapy Physical therapy Vision services Hearing services Social work services Psychological services Home Service Parent support/training Special needs class with other children Any services Preschool Services Speech therapy Occupational therapy Physical therapy Vision services Hearing services Social work services Psychological services Home Service Parent support/training Special needs class with other children Private tutoring Instruction in Braille Instruction in Sign-language Any services Kindergarten Services Speech therapy Occupational therapy Physical therapy Vision services Hearing services
128 Social work services Psychological services Home Service Parent support/training Special needs class with other children Private tutoring Instruction in Braille Instruction in Sign-language Any services * Estimates rounded to nearest
129 Table 4. Comparison of baseline characteristics by early childhood physical (PT) or occupational therapy (OT) receipt among low birth weight children N 3,000 Received early childhood PT/OT (N 300) Did not receive early childhood PT/OT (N 2400) P value Gender Male 59.70% 46.65% < Missing 0.21% Race/Ethnicity White Non- Hispanic 51.12% 46.61% African American 20.15% 23.55% Hispanic 18.66% 18.58% Asian 2.24% 4.27% Other 7.84% 6.82% Missing 0.16% Parental Education Less than High School 11.94% 14.84% High School or equivalent 26.49% 25.73% Technical Training/Some college 30.22% 28.81% Bachelor s Degree 17.54% 17.02% Graduate Professional Training 13.43% 13.52% Missing 0.37% 0.08% SES level (mean;std) (0.818) (0.846) Urbanicity Urban, inside UA 71.27% 71.19% Urban, inside UC 14.18% 11.92% Rural 14.55% 16.89% Region
130 Northwest 16.79% 16.73% Midwest 26.87% 23.51% South 36.57% 39.87% West 19.78% 19.89% Number of Siblings % 32.10% % 33.99% % 20.43% % 8.59% 4 or more 4.85% 4.89% Birth Weight (494.89) (573.80) < Gestational age; wks (mean,std) (4.30) (4.45) < Missing 3.73% 1.6% 5 minute AGPGAR score; (mean, std) 7.42 (1.47) 8.38 (1.18) < Missing 12.31% 16.35% Length of hospital stay; days (mean,std) (53.11) (32.16) < Missing 0.37% 0.16% Length of NICU admission; days (mean, std) 5.68 (19.83) 2.76 (11.97) Missing % Health Insurance ( Not Mutually Exclusive) Private 52.24% 50.84% SCHIP 9.09% 9.95% Medicaid 60.45% 46.44% < Military Insurance 1.49% 2.47% Indian Health Services % Other 6.72% 2.55% Missing 0.37% 0.21% 121
131 Health condition at birth * (Not Mutually Exclusive) Frequency of treatment for injury ; birth and 9 months Overall caregiver health status Visual Deficit 25.37% 2.92% < Heart Defect 14.93% 5.51% < Difficulty hearing 10.07% 0.78% < Failure to Thrive 11.19% 1.52% < Difficulty with mobility 31.34% 2.47% < Cleft palate 1.49% 0.41% Other Special Need 32.84% 3.82% < Missing 0.37% 0.16% Never 98.88% 95.51% Once 3.37% 4.03% Twice 0.75% 0.29% Three or More % Excellent 21.27% 29.92% Very Good 35.07% 32.31% Good 29.85% 27.21% Fair 11.19% 9.49% Poor 2.61% 0.95% Missing % Age adjusted Bayley Motor T score (mean,std) (14.09) (10.23) < Missing 16.0% 6.58% HOME score (mean,std) 5.30 (1.21) 5.47 (1.12) Missing 5.60% - 122
132 KIDI score (mean,std) 6.84 (2.04) 6.65 (2.14) CESD score (mean,std) 6.70 (6.37) 5.66 (5.83) Missing 7.84% 11.55% Partner in the home Yes 73.13% 74.72% Caregiver social support # Yes 99.25% 98.77% Missing % Age when child sat without support (months) Not sitting independently 45.52% 6.70% < to % 3.21% 5 to % 55.49% 8 to % 34.48% Missing 0.37% 0.12% Age when child crawled on hands and knees (months) < Not crawling 64.55% 21.70% 3 to % 15.74% 7 to % 49.98% 10 to % 12.49% Missing 0.37% 0.08% Age when pulled to standing (months) < Not pulling to stand 73.51% 25.98% 4 to % 15.91% 8 to % 48.86% 11 to % 9.54% Missing 0.37% 0.12% 123
133 Age walked while holding onto something (months) < Not cruising 77.61% 36.87% 5 to % 7.44% 8 to % 42.99% 11 to % 12.58% Missing 0.37% 0.12% Maternal work schedule Mother does not work 61.57% 51.34% Regular daytime shift 27.24% 35.14% Regular evening shift 5.60% 5.67% Regular night shift 2.61% 1.81% Rotating shift 4 (1.49%) 71 (2.92%) Split shift % Other 1.12% 2.10% Missing 0.37% 0.25% * Sixteen kids with congenital defects affecting motor ability were excluded from the analysis. Defects included Downs Syndrome, Turners Syndrome, and Spina Bifida. # Caregivers were asked about the people they turn to for social support and advice with childcare. Among the 3,000 low birth weight children, 8.19% of the sample were missing data on receipt of therapy between 9 months and age 2. We used a chi squared test (for categorical data) or independent t tests (assuming unequal variance between groups) to test for significant differences in covariates by therapy status. 124
134 Table 5. Candidate variables for predictors of therapy services between 9 months and 2 years of age Health Insurance Categorical General Knowledge of child development Continuous 9 month child s health condition Categorical 9 month Parenting measure (KIDI) Continuous Birth weight continuous 9 month maternal CESD score Continuous 9 month Bayley Motor T score continuous Race/ethnicity categorical 9 month Injury in the last three months dichotomous Parental education categorical 9 month caregiver health categorical Income continuous 9 month HOME score continuous Gestational Age at Birth continuous Number of Siblings continuous 9 month Zip code continuous 5 minute APGAR scores continuous SES scale continuous Length of hospital stay continuous Paternal Education Length of NICU stay continuous 9 month hours per week in childcare continuous Mother s occupation Categorical Urbanicity dichotomous 9 month parent report of age of motor milestone attainment Sitting, crawling, pulling to stand, walking Geographic region Nominal 125
135 Table 6. Variable importance of preschool impairment in motor coordination among low birth weight 126 Variable MDC * Variable MDC * Variable MDC * Length Hospital Stay(days) 0.65 Congenital Deficit 0.17 Child s Weight;2 years 0.03 Unable to stand 0.63 Sat without support 7 to 14 month 0.17 Sat without support 2 to 4 months 0.03 Birth weight (grams) 0.55 APGAR score 0.16 Breastfed > 19 mo 0.03 Gestational Age(weeks) 0.54 CESD score 0.14 Excellent caregiver health 0.03 Unable to cruise 0.48 Fair caregiver health 0.14 Difficulty with UE/LW mobility 0.02 Unable to crawl 0.47 Crawled 10 to 14 mo 0.14 Cruised 10 to 14 months 0.00 Cruised 7 to 10 months 0.45 Child injured once birth to 9 mont 0.14 Child injured >3 times birth to 9 months 0.00 Bayley Motor T score 0.44 Hours of weekly TV; age Military health insurance Weekly childcare hours; 2 yrs 0.41 Good caregiver health 0.13 Breastfed 11mo SES level 0.40 Failure to thrive 0.13 Neighborhood safety Crawled 3 to 7 months 0.37 Days in NICU 0.12 Child injured twice; birth to 9 months Weekly childcare hours at 9months 0.37 Bachelor s Degree 0.12 Poor caregiver health Private Health Insurance 0.35 Maternal partner in home 0.11 Indian Health Insurance Sat without support 4 to 7 months 0.32 Ever breastfed 0.10 Maternal Support Maternal work schedule 0.29 Cruised 10 to 14 months 0.10 Other Health Insurance Crawled 7 to 10 months 0.27 Other special healthcare need 0.09 Unable to sit 0.26 Less than High School Education 0.08 Pulled to stand 8 to 11 months 0.26 High School Education 0.07 Pulled to stand 4 to 8 months 0.26 HOME score 0.07 Graduate Training 0.25 Mother Ever Major Depression 0.07 Race 0.24 Visual Deficit 0.07 PT/OT receipt 0.23 SCHIP insurance 0.07 Medicaid insurance 0.22 Did not breastfeed 0.07 KIDI score 0.22 Very good caregiver health 0.06 HOME score; 2 years 0.21 Number of ear infections 0.06 Number of siblings 0.20 Technical/some college 0.06 Urbanicity 0.19 Hearing deficit 0.06 Mother works 0.19 Breastfed 11 to 19 months 0.04 Region 0.18 Pulled to stand 11 to 14 months 0.03 * The mean decrease in accuracy (MDC) is the difference in classification accuracy using the out of bag data when the variable is included and the classification accuracy when the values of the variable in the out of bag variable are permuted randomly. A higher mean decrease accuracy score indicates a variable of greater importance in prediction of preschool impairment in motor coordination. & Variable importance measures estimated using RandomForest package with 500 trees and 9 variables randomly chosen at each Variables with a mean decrease in accuracy above the absolute value of the lowest mean decrease in accuracy estimate is suggested as a cut point for importance in predicting class membership of the outcome. Therefore variables with a mean decrease in accuracy above 0.08 are suggested important predictors of impaired preschool motor ability. 126
136 *, ^, # Table 7. Marginal relationship between continuous/ordinal covariates and the exposure Variable Number of hours per week in childcare APGAR scores KIDI score SES level Gestational Age Birth weight Number of days the child stayed in the hospital after birth Shape of the relationship Generally linear U shaped U shaped U shaped U Shaped Relatively linear Strong Linearity 9 month Age adjusted BSF-R Motor T score U shaped Maternal Depression CESD score Linear * Partial dependence plots represent the marginal effect of one variable on receipt of early childhood PT/OT therapy services. The plot provides the average trend of the variables after averaging out the effects of the other predictor variables in the model. ^Plots generated using the RandomForest package with 500 trees and 6 variables chosen randomly at each split. Variables included parent education, child injury, caregiver health, maternal support, child congenital deficit, visual deficit, difficulty with upper or lower extremity mobility, region, urbanicity, maternal education, father education, health insurance, race, hearing impairment, failure to thrive, other special healthcare need, maternal work schedule, maternal partner in home, age sitting, age crawling, age standing, age walking, birth weight, gestational age, SES level, KIDI score, CESD score, HOME score, 9 month BSF-R Motor R score, APGAR, length of hospital stay after birth, number of hours per week in childcare 127
137 Table 8. Association between covariates and therapy services and ability to pass skipping item in the unexposed Variable Early Childhood Motor Performance Preschool Skipping OR 95% CI CLR OR 95% CI CLR Baseline(9mo) Health Insurance: Dichotomous variables Medicaid Yes , , Private Health Insurance Yes , , Children s State Health Plan Child s Health Status Yes , , Visual Deficit , , No events Hearing Deficit , here Drop Other special healthcare need , , No events Failure to thrive , here Drop Birth weight (grams): Scaled at 200 grams , , <1000 grams Ref - - Ref grams , , >1500 grams , , Bayley Motor T Scores scaled 10 unit inc , , Race/ethnicity 128
138 White ref - - ref - - Black , , Other , , Parental Education <High School ref - - ref - - High School , , Some College , , College/Graduate Training , , Gestational Age at Birth(wks) , , Number of Siblings , , minute APGAR score , , Length of Hospital stay(days) 30 to 45 days ref - - ref to 60 days , , to 90 days , , >90 days , , Parent report of age of motor milestone attainment (categorical) Age at which the child sat indep , ,
139 Age at which the child crawled , , Age at which the child walked , , Parental knowledge of child development (KIDI score) <5 ref - - ref to < , , >= , , Maternal depression (CESD score) 5 unit increase , , General health of the caregiver Excellent , , Fair , , Good , , Poor , , Very Good ref - - ref - - Caregiver received advice with childcare Cognitive stimulation in the home (HOME score) 9 months 130
140 131 Region Urbanicity <2 Too small 2<= , , ref - - ref - - > , , Northwest , , Midwest , , South , , West ref - - ref - - Urban inside UA , , Urban inside UC , , Rural ref - - ref - -- Hours per wk in childcare 9mo , , Work schedule: collapse this variables Partner in the home SES <10 ref - - ref to <= , , to <= , , > , , Not working , , Regular days , , Other ref - - ref - - No variability <-0.70 ref - - ref to , , > , ,
141 Table 9. Therapy exposure and preschool skipping ability: change in estimate Beta coefficient Upper 95 CI% Lower 95% CI OR Upper 95% CI Lower 95% CI CLR Backwards Elimination Full Model: therapy,sitting,standing, cruising, race,visual deficit, hospital, education, caregiver health, gestwk,medicaid, private,schip, ses, homescore, workschedule,region,kidiscore ln(or full/or reduced) Motor score Birth weight Age of sitting Age of crawling Age of cruising SES Time in hospital after birth Race KIDI score HOME Education Medicaid SCHIP Private HI Visual Deficit Caregiver health Gestational Age Region Work Schedule APGAR
142 Table 10. Candidate variables for the propensity score model Minimally Sufficient Conditioning Set: DAG Covariates associated Variable with skipping Age of cruising X X X (strong) Age crawling Age of independent sitting Gestational Age X X Medicaid x X x Days in the hospital after birth X X X Birth weight X X X SES X X Race X X X Education X X X Vision x x x Other Special healthcare need x x Motor Score X X Change in estimate >10% KIDI score x Work Schedule x x APGAR X x Private HI x(marginal) Caregiver health x Number of siblings x HOME score x x Hours in childcare x x 133
143 Table 11. Sensitivity of the effect estimates in the propensity score model^ Skipping Hopping Balance Walking backwards N 700 OR Lower 95% CI Upper 95% CI CLR OR Lower 95% CI Upper 95% CI CLR OR Lower 95% CI Upper 95% CI CLR OR Lower 95% CI Upper 95% CI CLR Propensity Score 1 * Stabilized Propensity Score 2 % Stabilized ^ Propensity estimated using random forest classification with 1,000 trees and 7 variables randomly chosen at each node; models adjusted for birth weight, length of hospital stay, age at which the child cruised *Variable strongly associated with outcome and DAG: GA, SCHIP Health Insurance, Visual Deficit, Other Special Healthcare need, birth weight, race, education number of siblings, APGAR score, child s length of hospital stay after birth, age of cruising, HOME score, region, maternal work schedule, hours in childcare, SES % Reduction of propensity score model to strong confounders to improve precision: GA, Birth weight, race, education, length of the child s hospital stay after birth, age of cruising, SES, BSF-R Motor T score 134
144 Table 12. Association between receipt of physical and occupational therapy in early childhood and preschool motor performance among very low birth weight children ^ * Crude Estimate Standard Model Adjusted Model Preschool Motor Skills & N OR 95 % CI N OR 95 % CI Skipping eight , ,6.03 consecutive steps & Hopping five times independently & , ,2.11 Maintaining single leg stance for ten seconds independently & , ,2.04 Walking Backwards six , ,2.88 steps on a line & Beta(SE) P Value Beta (SE) P Value Jumping Distance (inches) & (1.72) (1.86) 0.86 Change in Jumping Distance Preschool- Kindergarten (inches) # (2.39) (2.70) 0.70 ^Early Childhood Longitudinal Study, Birth Cohort All counts have been rounded to the nearest 50 for data security. $ We defined children who received physical and occupational therapy between nine months and age two as treated. * The model was missing the outcome for 20% of the sample. & The model was adjusted for length of hospital stay(continuous). cruising (continuous), birth weight( continuous), gestational age (continuous), race, education, SES ( restricted quadratic spline), 9 month BSF-R Motor T score ( continuous) # Model adjusted for preschool jumping distance and age of cruising (continuous) 135
145 Table 13. Descriptive statistics of VLBW children by receipt of therapy services between nine months and age two^ N 500 Gender Race/Ethnicity Received early childhood PT/OT (6.5%) Did not receive early childhood PT/OT (83.3%) % % Male Missing - <.8% White Non- Hispanic African American Hispanic Other Parental Education Less than High School High School or equivalent Technical Training/Some college Bachelor s/graduate Degree Missing - <0.8% SES level (mean;std) -0.14(0.71) (0.80) Urban city Urban, Inside Urban Area Urban, Inside Urban Cluster Region Rural Northwest Midwest South West Number of Siblings
146 or more Birth Weight (Mean;std) (212.63) (250.31) Gestational age; wks (mean,std) 27.84(3.17) 30.13(3.80) Missing - 1.8% Fetal Growth Ratio & 0.94(0.28) 0.78(0.30) Missing - 3.8% Age adjusted BSF-R T score # (10.85) (8.44) Missing <9.7% 3.8% 5 minute AGPGAR score; (mean, std) 7.15 (1.89) 7.89 (1.26) Missing 16.1% 14.9% Length of hospital stay; days (mean,std) 67.94(22.33) 48.46(30.40) Health Insurance (Not mutually exclusive) Private SCHIP Medicaid Military Insurance Indian Health Services Other <
147 Health condition at birth * (Not mutually exclusive) Visual Deficit Heart Defect Difficulty hearing Failure to Thrive Cleft palate Other Special Need Frequency of treatment for injury ; birth and 9 months Overall caregiver health status Never Once Twice 3.2 <0.8 Excellent Very Good Good Fair Poor HOME score (mean,std) 5.70(1.09) 5.44(1.15) Missing <9.7% 2.3% KIDI score (mean,std) 6.81(1.80) 6.46(1.97) CESD score (mean,std) 5.0(4.98) 5.66(5.73) Missing 9.7% 10.9% 138
148 Partner in the home Caregiver social support Yes No Partner Yes Age when child sat without support (months) 8.45 (1.57) 7.77(1.73) Missing <9.7% 1.0% Age when child crawled on hands and knees (months) 9.81(1.63) 8.56(1.74) Missing 16.1% 6.8% Age walked while holding onto something (months) 11.00(1.53) (10.00)1.59 Maternal work schedule Mother does not work Regular daytime shift Regular evening shift Regular night shift Rotating shift Split shift Other Pre K Mean Jumping Distance inches 21.12(8.58) 22.52(8.41) Missing 16.1% 16.6% Pre K Ability to Maintain SLS 10 seconds 35.5% 40.3% Missing 12.9% 15.7% Child did not respond 3.2% 2.0% 139
149 Pre K Ability to Hop 5 times 35.5% 50.6% Missing 12.9% 15.7% Child did not respond 12.9% 6.1% Pre K Ability to Walk Backwards on line for six 19.4% 21.0% steps Missing 16.1% 15.4% Child did not respond - 3.0% Pre K Ability to Skip 8 alternating steps 12.9% 16.5% Missing 16.1% 16.0% Child did not respond 9.7% 9.1% * Therapy status missing for 10.13% of the sample. All counts have been rounded to the nearest 50 according to the data use agreement. Counts with less than three cases are expressed as approximate percentages according to data use agreement. # The BSF-R T score has a mean of 50 and standard deviation of 10. & Fetal growth ratio=birth weight/median birth weight for gestational age. ^ Early Childhood Longitudinal Study, Birth Cohort
150 Table 14. Standardized difference among confounders Unweighted Random Forest Confounder Early Childhood Therapy No Early Childhood Therapy Standardized Differences^ Early Childhood Therapy No Early Childhood Therapy Standardized Differences^ Mean(SE) Mean(SE) Mean (SE) Mean(SE) Birth weight (grams) (212.63) (250.31) (746.04) (259.76) 0.08 BSF-R T score (10.85) (8.44) (32.91) (8.88) 0.02 Days in Hospital after birth (22.33) (30.40) (87.00) (31.78) 0.14 SES (0.71) (0.80) (2.66) (0.84) 0.01 Age of independent sitting (months) 8.45 (1.57) 7.77 (1.73) (6.53) 7.84 (1.82) 0.00 Age of crawling (months) 9.81 (1.63) 8.56 (1.74) (7.62) 8.62 (1.79) 0.09 Age of walking with support (months) (1.53) (1.59) (4.96) (1.66) 0.05 Gestational Age (weeks) (3.17) (3.80) (11.16) (3.92) 0.15 Mean ^Standardized differences represent the differences between means by therapy status in units of standard deviations. The estimates are calculated as d=(xbar therapy -xbar no therapy )/sqrt(s 2 therapy + S 2 no therapy )/2))
151 Table 15. Association between receipt of physical and occupational therapy in early childhood and preschool motor performance among VLBW children: Average Treatment Effect^ $ * Crude Estimate (N 500) Adjusted Estimate (N 300 ) Preschool Motor Skills & N OR 95 % CI N OR 95 % CI Skipping eight consecutive , ,7.51 steps & Hopping five times , ,2.45 independently & Maintaining single leg stance for , ,3.13 ten seconds independently & Walking Backwards six steps on , ,4.54 a line & N Beta 95% CI N Beta 95% CI Jumping Distance (inches) & , ,5.79 Change in Jumping Distance , ,3.69 Preschool-Kindergarten (inches) # ^ Early Childhood Longitudinal Study, Birth Cohort All counts have been rounded to the nearest 50 for data security. These data were weighted using (1/propensity score) for children who received therapy and (1/(1-propensity score)) for those children who did not receive treatment. The propensity scores were stabilized by multiplying the treatment weights by the marginal prevalence of the treatment that they actually received. $ We estimated the propensity score using random forest classification. The out of bag error rate for the algorithm was 15.65% across 1,000 trees where the algorithm chose 4 random variables at each split of the node. & Weighted models were adjusted for age at which the child walked (continuous), birth weight (continuous), number of days the child was in the hospital after birth (continuous term). * We defined children who received physical and occupational therapy between nine months and age two as treated. 7% of children were missing covariate data to estimate the propensity score and are not included in the final mode. Outcome data were missing for approximately 20% of the sample, 6% of children were missing data on receipt of therapy. # Model adjusted for preschool jumping distance and age of walking with support (continuous) 142
152 Table 16. Sensitivity Analysis: Overlapping propensity scores and propensity scores trimmed contrary to prediction Preschool Motor Skills & Overlapping Propensity 1 st and 99 th % trimmed 2.5 and 97.5 % Score ** trimmed && OR 95 % CI OR 95 % CI OR 95 % CI Skipping eight consecutive steps & (N 300) Hopping five times independently & (N 300) Maintaining single leg stance for ten seconds independently & (N 350) Walking Backwards six steps on a line & (N 350) , , , , , , , , , , , ,4.77 Beta (SE) P Value Beta (SE) P Value Beta (SE) P Value Jumping Distance (inches) & (N 350) 1.99 (2.11) (2.12) (2.11) 0.32 ^These data were weighted using (1/propensity score) for children who received therapy and (1/(1-propensity score)) for those children who did not receive treatment. The propensity scores were stabilized by multiplying the treatment weights by the marginal prevalence of the treatment that they actually received. & We estimated the propensity score using random forest classification. The out of bag error rate for the algorithm was 15.65% across 1,000 trees where the algorithm chose 4 random variables at each split of the node $ Weighted models were adjusted for age at which the child walked (continuous), birth weight (continuous), number of days the child was in the hospital after birth (continuous term). # We defined children who received physical and occupational therapy between nine months and age two as treated. ** 25% of sample trimmed && Trimmed an additional 2% of the overlapping sample 143
153 Table 17. Out of bag error rates * for prediction of receipt of early childhood therapy Out of Bag Error Number of Trees Random Forest % % % Number of Randomly Chosen Variables per split Bagging *The out of bag data is put down each bootstrap classification tree and the results are aggregate to determine the out of bag error rate over the forest of trees. 144
154 Table 18. Distribution of propensity score and weights for the average treatment effect by method used to estimate the propensity score * Random Forest Classification Logistic Regression Classification Tree Bagging Early Childhood Therapy No Early Childhood Therapy Early Childhood Therapy No Early Childhood Therapy Early Childhood Therapy No Early Childhood Therapy Early Childhood Therapy No Early Childhood Therapy Propensity Score & Minimum Maximum Mean Average Treatment Effect Weights Minimum Maximum Mean * Average treatment effect weight is estimated as (1/propensity score) for those children who received early childhood therapy. For the those children who did not receive therapy, the weight is (1/(1-propensity score)). These weights are stabilized so the sum of the weights reflects the size of the original population. We multiplied the weight by the probability of receiving the treatment that the child actually received. & The propensity score includes the following covariates: 9 month BSF-R motor T score, socioeconomic status, length of child s hospital stay after birth, gestational age, birth weight, parental education, race, age at which the child walked with assistance. 145
155 Table 19. Standardized differences among confounders by propensity score method Unweighted Random Forest Classification Confounder Early Childhood Therapy No Early Childhood Therapy Standardized Differences^ Early Childhood Therapy No Early Childhood Therapy Standardized Differences^ Mean(SE) Mean(SE) Mean (SE) Mean(SE) Birth weight (grams) (212.63) (250.31) (746.04) (259.76) BSF-R Motor T Score 45.16(10.85) 49.81(8.44) (32.91) 49.44(8.88) Days in Hospital after birth 67.94(22.33) 48.46(30.40) (87.00) 49.27(31.78) SES -0.14(0.71) -0.27(0.80) (2.66) -0.25(0.84) Age of independent sitting (months) 8.45(1.57) 7.77(1.73) (6.53) 7.84(1.82) Age of crawling (months) Age of cruising (months) Gestational Age (weeks) 9.81(1.63) 8.56(1.74) (7.62) 8.62(1.79) (1.53) 10.00(1.59) (4.96) 10.07(1.66) (3.17) (3.80) (11.16) (3.92) Mean ^Standardized differences represent the differences between means by therapy status in units of standard deviations. The estimates are calculated as d=(xbar therapy-xbar no therapy)/sqrt(s 2 therapy + S 2 no therapy )/2))
156 Table 19. Cont. Standardized differences among confounders by propensity score Logistic Regression Classification Tree Confounder Early Childhood Therapy No Early Childhood Therapy Standardized Differences^ Early Childhood Therapy No Early Childhood Therapy Standardized Differences^ Mean(SE) Mean(SE) Mean (SE) Mean(SE) Birth weight (grams) (673.98) (262.88) (418.10) (257.16) BSF-R Motor T Score 48.34(34.29) 49.36(8.85) (17.99) 49.33(8.95) Days in Hospital after birth 60.97(66.65) 49.60(32.32) (47.86) 49.61(31.50) SES -0.26(2.46) -0.25(0.85) (1.29) -0.23(0.85) Age of independent sitting (months) 8.11(5.76) 7.85(1.83) (3.52) 7.83(1.80) Age of crawling (months) 9.45(5.95) 8.63(1.81) (4.01) 8.61(1.78) Age of walking with assistance (months) 10.44(4.42) 10.08(1.67) (2.89) 10.07(1.65) Gestation Age weeks) (13.57) (3.93) (6.11) (3.90) Mean ^Standardized differences represent the differences between the means by therapy status in units of standard deviations. The estimates are calculated as d=(xbar therapy-xbar no therapy)/sqrt(s 2 therapy + S 2 no therapy )/2))
157 Table 19. cont. Standardized differences among confounders by propensity score method Bagging Early Childhood Therapy Mean (SE) No Early Childhood Therapy Mean(SE) Standardized Differences^ Birth weight (grams) (673.17) (262.42) BSF-R Motor T Score 48.53(31.48) 49.35(9.00) Days in Hospital after birth 51.26(85.37) 49.58(31.97) SES -0.25(2.92) -0.24(0.85) Age of independent sitting (months) 7.55(7.04) 7.85(1.84) Age of crawling (months) 8.63(8.22) 8.64(1.82) Age of cruising (months) 10.10(5.19) 10.09(1.68) Gestational Age (weeks) (11.17) (3.95) Mean ^Standardized differences represent the differences between the means by therapy status in units of standard deviations. The estimates are calculated as d=(xbar therapy -xbar no therapy )/sqrt(s 2 therapy + S 2 no therapy )/2))
158 Table 20. Average treatment effect of interventional physical or occupational therapy services and preschool motor skills: using three methods to estimate the propensity for treatment^ $ * Preschool Motor Outcomes Crude Model Random Forest Classification Logistic Regression Bagging Preschool Motor Skills & N OR 95 % CI CLR N OR 95 % CI CLR OR 95% CI CLR OR 95 % CI CLR Skipping eight , , , * consecutive steps & 1.04, Hopping five times , , , , independently & 149 Maintaining single leg stance for ten , , , , second independently & Walking Backwards six steps on a line & , , , , ^ Early Childhood Longitudinal Study, Birth Cohort Counts rounded to the nearest 50 according to data use agreement. These data were weighted using (1/propensity score) for children who received therapy and (1/(1-propensity score)) for those children who did not receive treatment. The propensity scores were stabilized by multiplying the treatment weights by the marginal prevalence of the treatment that they actually received. & Models were adjusted for age at which the child walked (continuous), birth weight (continuou s), number of days the child was in the hospital after birth (continuous term). *p<0.05 $ We defined children who received physical and occupational therapy between nine months and age two as treated.*7% percent of children were missing at least one covariate used to generate the propensity score and were excluded. Outcome data were missing for approximately 20% of the sample, 6% of children were missing data on receipt of therapy 149
159 150
160 Figure 7. Variable importance in predicting receipt of physical or occupational therapy between 9 months and age 2 among low birth weight infants * The mean decrease in accuracy is the difference in classification accuracy using the out of bag data when the variable is included and the classification accuracy when the values of the variable in the out of bag variable are permuted randomly. A higher mean decrease accuracy score indicates a variable of greater importance in prediction of receipt of early childhood therapy services. 151
161 152
162 153
163 154
164 155
165 156
166 157
167 158
168 159
169 160
170 161
171 162
172 163
173 164
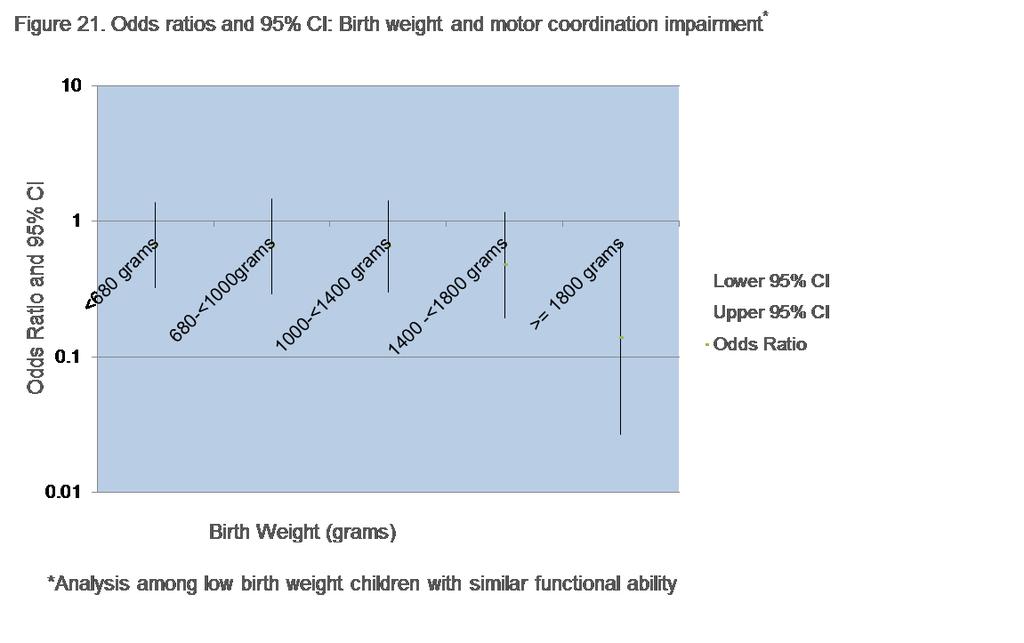
174 165
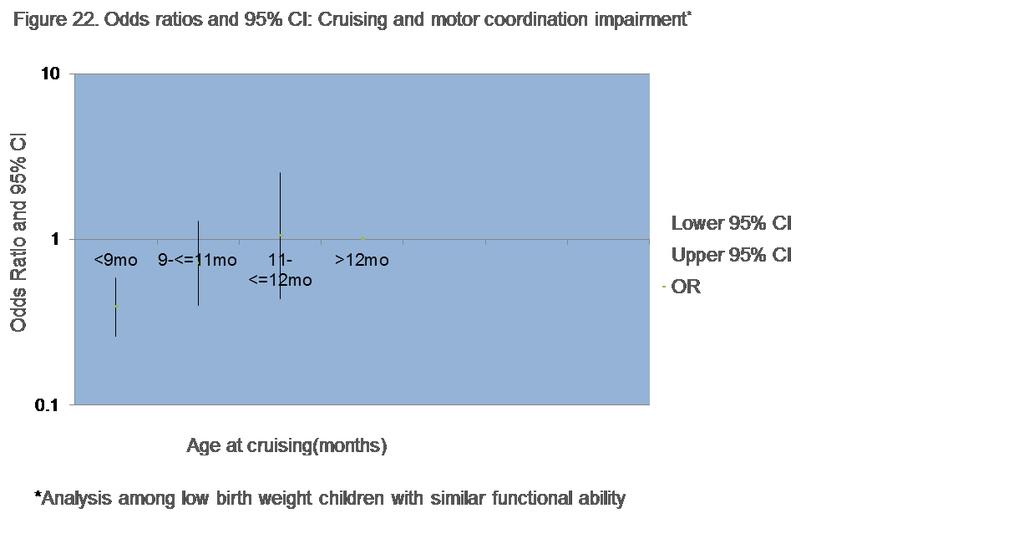
175 166
176 167
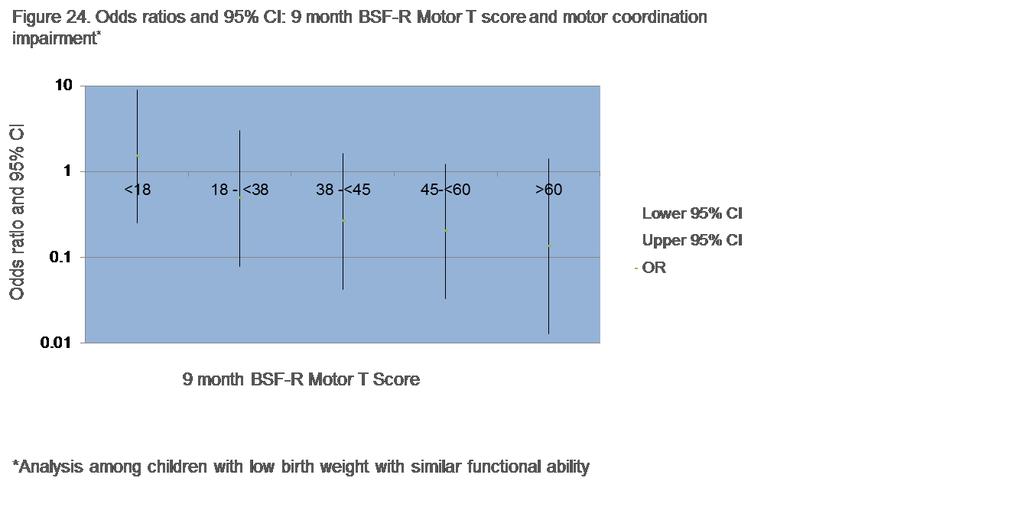
177 168
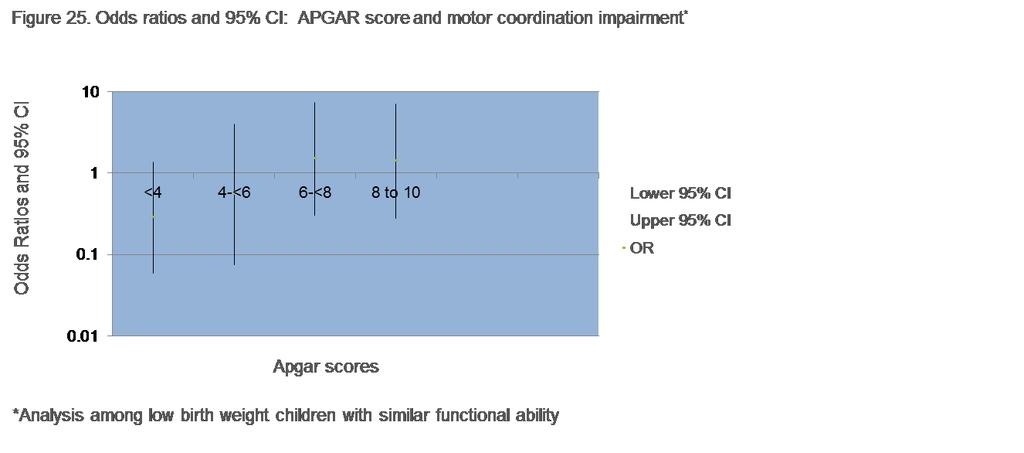
178 169
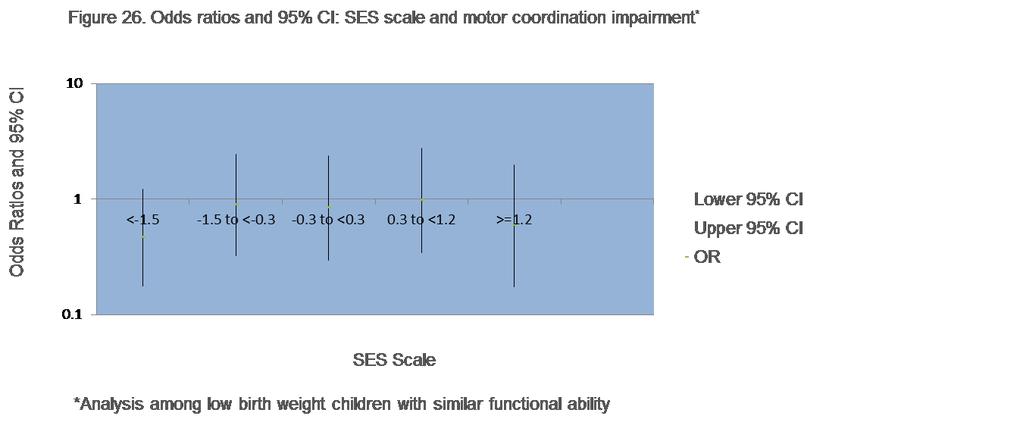
179 170
The Predictive Validity of the Test of Infant Motor Performance on School Age Motor Developmental Delay
 Pacific University CommonKnowledge PT Critically Appraised Topics School of Physical Therapy 2012 The Predictive Validity of the Test of Infant Motor Performance on School Age Motor Developmental Delay
Infant Reflexes and Stereotypies. Chapter 9
 Infant Reflexes and Stereotypies Chapter 9 Infant reflexes and stereotypies are very important in the process of development Importance of Infant Reflexes Reflexive movements occur during the last 4 months
Insults to the Developing Brain & Effect on Neurodevelopmental Outcomes
 Insults to the Developing Brain & Effect on Neurodevelopmental Outcomes Ira Adams-Chapman, MD Assistant Professor of Pediatrics Director, Developmental Progress Clinic Emory University School of Medicine
Strength and Endurance
 Strength and Endurance What is strength and endurance? In practical terms, muscle strength is how strong the child is and muscular endurance is how long the child s muscles can work. In more specific terms:
Executive Function in Infants and Toddlers born Low Birth Weight and Preterm
 Executive Function in Infants and Toddlers born Low Birth Weight and Preterm Patricia M Blasco, PhD, Sybille Guy, PhD, & Serra Acar, PhD The Research Institute Objectives Participants will understand retrospective
Response to the Language Equality and Acquisition for Deaf Kids (LEAD-K) Task Force Report
 Task Force Report") Response to the Language Equality and Acquisition for Deaf Kids (LEAD-K) Task Force Report Louisiana Department of Health Office of Public Health March 21, 2019 Report Title Version Number Version Date
Response to the Language Equality and Acquisition for Deaf Kids (LEAD-K) Task Force Report Louisiana Department of Health Office of Public Health March 21, 2019 Report Title Version Number Version Date
Balance & Coordination
 Balance & Coordination What is balance and coordination? Balance is the ability to maintain a controlled body position during task performance, whether it is sitting at a table, walking the balance beam
LABETTE COMMUNITY COLLEGE BRIEF SYLLABUS. Please check with the LCC bookstore for the required texts for this class.
 LABETTE COMMUNITY COLLEGE BRIEF SYLLABUS SPECIAL NOTE: This brief syllabus is not intended to be a legal contract. A full syllabus will be distributed to students at the first class session. TEXT AND SUPPLEMENTARY
Dr Veenu Gupta MD MRCPsych Consultant, Child Psychiatrist Stockton on Tees, UK
 Dr Veenu Gupta MD MRCPsych Consultant, Child Psychiatrist Stockton on Tees, UK Extremely Preterm-EP Very Preterm-VP Preterm-P Late Preterm-LP There is greater improvement of survival at extremely low
HUGHES BASIC MOTOR ASSESSMENT MOTOR PERFORMANCE EVALUATION I
 HUGHES BASIC MOTOR ASSESSMENT MOTOR PERFORMANCE EVALUATION I NAME: AGE AT TIME OF TEST: BIRTHDATE: DATE OF EVALUATION: PERFORMANCES STATIC BALANCE: Client standing in an 18" square is asked to balance
Course Descriptions for Courses in the Entry-Level Doctorate in Occupational Therapy Curriculum
 Course Descriptions for Courses in the Entry-Level Doctorate in Occupational Therapy Curriculum Course Name Therapeutic Interaction Skills Therapeutic Interaction Skills Lab Anatomy Surface Anatomy Introduction
TRANSIENT NEUROLOGICAL ABNORMALITIES: EARLY SCHOOL OUTCOMES IN EXTREMELY PREMATURE INFANTS HEIDI HARMON, M.D. Master of Science
 TRANSIENT NEUROLOGICAL ABNORMALITIES: EARLY SCHOOL OUTCOMES IN EXTREMELY PREMATURE INFANTS by HEIDI HARMON, M.D. Submitted in partial fulfillment of the requirements for the degree of Master of Science
STATE COLLEGE OF FLORIDA OCCUPATIONAL THERAPY ASSISTANT PROGRAM
 STATE COLLEGE OF FLORIDA OCCUPATIONAL THERAPY ASSISTANT PROGRAM OTH 1114C OCCUPATIONAL THERAPY SKILLS AND TECHNIQUES I (AS) LEC LAB CR 2 3 3 COURSE DESCRIPTION This course is designed to prepare the student
Correspondence between the DRDP (2015) and the California Preschool Learning Foundations. Foundations (PLF)
 and the California Preschool Learning Foundations. Foundations (PLF)") 1 Desired Results Developmental Profile (2015) [DRDP (2015)] Correspondence to California Foundations: Physical Development Health (PD-HLTH) and the Overall, the Physical Development Health (PD-HLTH) domain
1 Desired Results Developmental Profile (2015) [DRDP (2015)] Correspondence to California Foundations: Physical Development Health (PD-HLTH) and the Overall, the Physical Development Health (PD-HLTH) domain
Results. NeuRA Motor dysfunction April 2016
 Introduction Subtle deviations in various developmental trajectories during childhood and adolescence may foreshadow the later development of schizophrenia. Studies exploring these deviations (antecedents)
Prematurity as a Risk Factor for ASD. Disclaimer
 Prematurity as a Risk Factor for ASD Angela M. Montgomery, MD, MSEd Assistant Professor of Pediatrics (Neonatology) Director, Yale NICU GRAD Program Suzanne L. Macari, PhD Research Scientist, Child Study
Prediction of Brain Network Age and Factors of Delayed Maturation in Very Preterm Infants
 Prediction of Brain Network Age and Factors of Delayed Maturation in Very Preterm Infants Colin J. Brown 1, Kathleen P. Moriarty 1, Steven P. Miller 2, Brian G. Booth 1, Jill G. Zwicker 3, Ruth E. Grunau
Cerebral Palsy. By:Carrie Siders and Kelsey Hampsey. 3rd hour.
 Cerebral Palsy By:Carrie Siders and Kelsey Hampsey 3rd hour. What is Cerebral Palsy? Cerebral palsy is a physical disability It affects movement and posture It is a permanent life-long condition does not
Social Determinants and Consequences of Children s Non-Cognitive Skills: An Exploratory Analysis. Amy Hsin Yu Xie
 Social Determinants and Consequences of Children s Non-Cognitive Skills: An Exploratory Analysis Amy Hsin Yu Xie Abstract We assess the relative role of cognitive and non-cognitive skills in mediating
Longitudinal Study of Executive Function and Low Birth Weight
 Longitudinal Study of Executive Function and Low Birth Weight Patricia M Blasco, Sybille Guy, Serra Acar The Research Institute at Western Oregon University Sage N Saxton Oregon Health & Science University
University of Manitoba - MPT: Neurological Clinical Skills Checklist
 Name: Site: Assessment Skills Observed Performed Becoming A. Gross motor function i. Describe movement strategies (quality, devices, timeliness, independence): supine sidelying sit stand supine long sitting
Understanding Early Childhood Brain Development
 Understanding Early Childhood Brain Development 201 Understanding Early Childhood Brain Development Why should caregivers know about brain development? The brain is the part of the body that allows us
CRITICALLY APPRAISED PAPER (CAP)
") CRITICALLY APPRAISED PAPER (CAP) FOCUSED QUESTION What is the effectiveness of a 12-week family-centered evaluation and intervention program for children with attention deficit hyperactivity disorder (ADHD)
CRITICALLY APPRAISED PAPER (CAP) FOCUSED QUESTION What is the effectiveness of a 12-week family-centered evaluation and intervention program for children with attention deficit hyperactivity disorder (ADHD)
12/7/2011. JDBP 32,6, July/August011468July/August011
 Easy (?) as 1,2,3: Issues in Developmental Follow UP of NICU GRADS Martin T. Hoffman, MD Dept. of Pediatrics University at Buffalo School of Medicine and Biomedical Science Women and Children s Hospital
DWI assessment of ischemic changes in the fetal brain
 DWI assessment of ischemic changes in the fetal brain Dafi Bergman, 4 th year Medical student in the 4-year program, Sackler school of medicine B.Sc Life and Medical Sciences, Tel Aviv University Supervised
Chapter 7 BAYLEY SCALES OF INFANT DEVELOPMENT
 Chapter 7 BAYLEY SCALES OF INFANT DEVELOPMENT 7.1 Introduction The Bayley Scales of Infant Development III (BSID-III) will be administered at the 24 months +/- 2 months (adjusted age) visit. The BSID-III
Motor Skills Among Preschool-Aged Children Born Prematurely
 Wayne State University Wayne State University Dissertations 1-1-2016 Motor Skills Among Preschool-Aged Children Born Prematurely Brittany Nicole Peters Wayne State University, Follow this and additional
Mullen Scales of Early Learning: AGS Edition
 Overview The Mullen Scales of Early Learning: AGS Edition (Mullen, 1995) is an individually administered, standardized measure of cognitive functioning designed to be used with children from birth through
Organization of Knowledge
 & Substance Yearly Curriculum : Movement and Manipulative Proficiencies What are the different patterns/forms of movement? PE.A.1.1.7 Locomotor skills (Hop,walk,jump, skip,leap,run, gallop, slide) Be able
THE EFFECT OF METHYLPHENIDATE TREATMENT ON EXERCISE PERFORMANCE IN CHILDREN WITH ATTENTION-DEFICIT HYPERACTIVITY DISORDER
 Acta Kinesiologiae Universitatis Tartuensis. 2011, Vol. 17 THE EFFECT OF METHYLPHENIDATE TREATMENT ON EXERCISE PERFORMANCE IN CHILDREN WITH ATTENTION-DEFICIT HYPERACTIVITY DISORDER Y. Meckel 1, D. Nemet
Appendix C NEWBORN HEARING SCREENING PROJECT
 Appendix C NEWBORN HEARING SCREENING PROJECT I. WEST VIRGINIA STATE LAW All newborns born in the State of West Virginia must be screened for hearing impairment as required in WV Code 16-22A and 16-1-7,
RESPONSE TO THE LANGUAGE EQUALITY AND ACQUISITION FOR DEAF KIDS (LEAD K) TASK FORCE REPORT
 TASK FORCE REPORT") REPORT TO THE HOUSE AND SENATE COMMITTEES ON EDUCATION AND HEALTH AND SENATE COMMITTEES ON HEALTH AND WELFARE OF THE LOUISIANA LEGISLATURE RESPONSE TO THE LANGUAGE EQUALITY AND ACQUISITION FOR DEAF KIDS
REPORT TO THE HOUSE AND SENATE COMMITTEES ON EDUCATION AND HEALTH AND SENATE COMMITTEES ON HEALTH AND WELFARE OF THE LOUISIANA LEGISLATURE RESPONSE TO THE LANGUAGE EQUALITY AND ACQUISITION FOR DEAF KIDS
Propensity Score Methods for Estimating Causality in the Absence of Random Assignment: Applications for Child Care Policy Research
 2012 CCPRC Meeting Methodology Presession Workshop October 23, 2012, 2:00-5:00 p.m. Propensity Score Methods for Estimating Causality in the Absence of Random Assignment: Applications for Child Care Policy
The Aboriginal Maternal and Infant Health Service: a decade of achievement in the health of women and babies in NSW
 The Aboriginal Maternal and Infant Health Service: a decade of achievement in the health of women and babies in NSW Elisabeth Murphy A,B and Elizabeth Best A A Maternity, Children and Young People s Health
Prediction of infant s motor development
 Available online at www.sciencedirect.com Procedia Social and Behavioral Sciences 9 (2010) 456 461 WCLTA 2010 Prediction of infant s motor development Sophia Charitou a *, Katerina Asonitou b, Dimitra
Discriminating ability of the Infant Neurological International Battery
 Discriminating ability of the Infant Neurological International Battery (Infanib) for the neurological outcome of high-risk infants in a cohort of 5857 low birth weight infants followed during their irst
How We Grow & Change
 How We Grow & Change Neural Development What makes up nerves? Neurons! (single cells) Interesting Facts About Neurons: Average brain has approx 100 billion neurons and we only use 10% (10 billion neurons)!
The aim of this study was to investigate the reliability
 Jacqueline M. Langendonk, 1 C. E. M. van Beijsterveldt, 1 Silvia I. Brouwer, 1 Therese Stroet, 1 James J. Hudziak, 1,2 and Dorret I. Boomsma 1 1 Department of Biological Psychology,Vrije Universiteit,Amsterdam,
Why Movement Experiences at U6 Impact a Soccer Career
 Why Movement Experiences at U6 Impact a Soccer Career Readiness for Soccer Readiness for sports is the match between a child s level of growth, maturity and development, and the task demands presented
MIRT Program ABSTRACTS 2011
 MIRT Program ABSTRACTS 2011 Risk of spontaneous preterm birth in relation to maternal depressive, anxiety and stress symptoms SE Sanchez, GC Puente*, G Atencio, C Qiu, D Yanez, B Gelaye, MA Williams (Hospital
BRAIN DEVELOPMENT STRUCTURES OF THE BRAIN DEVELOPMENTAL PROCESSES THE IMPORTANCE OF EXPERIENCE BRAIN DAMAGE AND RECOVERY
 BRAIN DEVELOPMENT STRUCTURES OF THE BRAIN DEVELOPMENTAL PROCESSES THE IMPORTANCE OF EXPERIENCE BRAIN DAMAGE AND RECOVERY Brain Development Virtually all human behavior is governed by the brain. Exceptions?
Randomized controlled trial of physiotherapy in 56 children with cerebral palsy followed for 18 months
 Randomized controlled trial of physiotherapy in 56 children with cerebral palsy followed for 18 months E Bower* PhD MCSP, Senior Research Fellow; D Michell BSc MCSP, Research Associate; M Burnett BSc,
CRITICALLY APPRAISED PAPER (CAP)
") CRITICALLY APPRAISED PAPER (CAP) Kwon, J. Y., Chang, H. J., Yi, S. H., Lee, J. Y., Shin, H. Y., & Kim, Y. H. (2015). Effect of hippotherapy on gross motor function in children with cerebral palsy: A randomized
CRITICALLY APPRAISED PAPER (CAP) Kwon, J. Y., Chang, H. J., Yi, S. H., Lee, J. Y., Shin, H. Y., & Kim, Y. H. (2015). Effect of hippotherapy on gross motor function in children with cerebral palsy: A randomized
CONTENTS. Acknowledgments... 5 Preface... 6
 CONTENTS Acknowledgments..................................................... 5 Preface.............................................................. 6 Chapter 1: Perspective for Physical Education in
Physical Therapist Assistant Principles of Neuromuscular Rehabilitation
 Western Technical College 10524144 Physical Therapist Assistant Principles of Neuromuscular Rehabilitation Course Outcome Summary Course Information Description Career Cluster Instructional Level Total
CRITICALLY APPRAISED PAPER (CAP)
") CRITICALLY APPRAISED PAPER (CAP) Huseyinsinoglu, B. E., Ozdincler, A. R., & Krespi, Y. (2012). Bobath concept versus constraint-induced movement therapy to improve arm functional recovery in stroke patients:
CRITICALLY APPRAISED PAPER (CAP) Huseyinsinoglu, B. E., Ozdincler, A. R., & Krespi, Y. (2012). Bobath concept versus constraint-induced movement therapy to improve arm functional recovery in stroke patients:
Development and Prediction of Hyperactive Behaviour from 2 to 7 Years in a National Population Sample
 Development and Prediction of Hyperactive Behaviour from 2 to 7 Years in a National Population Sample Elisa Romano, Ph.D. University of Ottawa Richard E. Tremblay, Ph.D. Abdeljelil Farhat, Ph.D. Sylvana
Effects of Prenatal Illicit Drug. Use on Infant and Child
 Effects of Prenatal Illicit Drug Use on Infant and Child Development Andrew Hsi, MD, MPH Larry Leeman, MD, MPH Family Medicine MCH Grand Rounds 6 July 2011 Objectives for Presentation At the end of this
FARMINGDALE STATE COLLEGE
 FARMINGDALE STATE COLLEGE DEPARTMENT: PSYCHOLOGY PREPARED BY: PSYCHOLOGY DEPT. DATE: FALL 2017 COURSE TITLE: Child Development COURSE CODE: PSY 232 CREDITS: 3 CONTACT HOURS: 45 CATALOG DESCRIPTION: In
Reminders. What s a Neuron? Animals at Birth. How are Neurons formed? Prenatal Neural Development. Week 28. Week 3 Week 4. Week 10.
 Reminders What s a Neuron? Exam 1 Thursday Multiple Choice and Short Answer Bring Scantron form and #2 pencil Includes Chapter 1- Chapter 3 BUT NOT 3.1 (We will cover this on the next test) You may use
Development & Growth
 Development & Growth Brainstorm a definition of development. What is development? What does it include? Development is.. the constant process of change that begins at conception and ends at death; it includes
Physical Therapy Module
 Physical Therapy Module Table of Contents Introduction... 1 What is a Physical Therapist?? Education and Training Work Settings Scope of Practice... 1 Framework for Practice... 2 History... 2 The Future
Readiness for Soccer
 Youth Fitness? Readiness for Soccer Readiness for sports is the match between a child s level of growth, maturity and development, and the task demands presented in competitive sports. Robert M. Malina,
Psychological consequences of congenital hypothyroidism: Cognitive, motor and psychosocial functioning van der Sluijs Veer, L.
 UvA-DARE (Digital Academic Repository) Psychological consequences of congenital hypothyroidism: Cognitive, motor and psychosocial functioning van der Sluijs Veer, L. Link to publication Citation for published
Early Assessment and Intervention
 Early Assessment and Intervention S A M E E R R A H I M P H Y S I O T H E R A P I S T R C W M C H S A M E E R. R A H I M @ W E S T E R N C A P E. G O V. Z A What is early intervention Developmental theories
Early Accurate Diagnosis & Early Intervention for Cerebral Palsy INTERNATIONAL RECOMMENDATIONS
 Early Accurate Diagnosis & Early Intervention for Cerebral Palsy INTERNATIONAL RECOMMENDATIONS Professor Iona Novak Cerebral Palsy Alliance Australia Neuroplasticity is fundamentally why we believe in
Providing Highly-Valued Service Through Leadership, Innovation, and Collaboration
 ~ivingston Providing Highly-Valued Service Through Leadership, Innovation, and Collaboration March 3, 27 Dear Parents and Community Members: We are pleased to present you with the Annual Education Report
Life Goes On: High Risk Infant Follow up & Early Intervention. Learning Objectives. Why Do We Need HRIF? 6/7/2013. Outcome studies
 Life Goes On: High Risk Infant Follow up & Early Intervention Anne DeBattista RN, MS, CPNP, CPMHS, PhD(c) Developmental Behavioral Pediatrics Lucile Packard Children s Hospital Learning Objectives Describe
Case History Report Form
 Child details ( * required) Name (first name only) or *Code John *Chronological age (CA) Actual age since birth *Diagnosis and/or presenting problems 18-27 mos Joubert Syndrome - a rare brain malformation
Cognitive Functioning in Children with Motor Impairments
 Cognitive Functioning in Children with Motor Impairments Jan P. Piek School of Psychology & Speech Pathology Curtin Health Innovation Research Institute (CHIRI) Curtin University Perth Western Australia
Evaluation of the Family - Rated Kinder Infant Development Scale (KIDS) for Disabled Children
 for Disabled Children") Jikeikai Med J 2012 ; 59 : 5-10 Evaluation of the Family - Rated Kinder Infant Development Scale (KIDS) for Disabled Children Keiji Hashimoto, Naoko Matsui, Hidemi Yakuwa, and Kohei Miyamura Division of
Jikeikai Med J 2012 ; 59 : 5-10 Evaluation of the Family - Rated Kinder Infant Development Scale (KIDS) for Disabled Children Keiji Hashimoto, Naoko Matsui, Hidemi Yakuwa, and Kohei Miyamura Division of
Prof. Greg Francis 7/8/08
 Attentional and motor development IIE 366: Developmental Psychology Chapter 5: Perceptual and Motor Development Module 5.2 Attentional Processes Module 5.3 Motor Development Greg Francis Lecture 13 Children
Cochrane Pregnancy and Childbirth Group Methodological Guidelines
 Cochrane Pregnancy and Childbirth Group Methodological Guidelines [Prepared by Simon Gates: July 2009, updated July 2012] These guidelines are intended to aid quality and consistency across the reviews
Running Head: PDMS-2 AND BSID-11 USE IN PREMATURE CHILDREN 1. Use of the Peabody Developmental Motor Scales 2 and Bayley Scales of Infant
 Running Head: PDMS-2 AND BSID-11 USE IN PREMATURE CHILDREN 1 Use of the Peabody Developmental Motor Scales 2 and Bayley Scales of Infant Development II with Premature Infants and Toddlers Judith C. Rhodes
Visual Impairment & Eye Health in Children. Susan Cotter, OD, MS So CA College of Optometry Marshall B Ketchum University Fullerton, CA
 Visual Impairment & Eye Health in Children Susan Cotter, OD, MS So CA College of Optometry Marshall B Ketchum University Fullerton, CA Consequences of Childhood VI Social Emotional Physical Educational
By: Armend Lokku Supervisor: Dr. Lucia Mirea. Maternal-Infant Care Research Center, Mount Sinai Hospital
 By: Armend Lokku Supervisor: Dr. Lucia Mirea Maternal-Infant Care Research Center, Mount Sinai Hospital Background My practicum placement was at the Maternal-Infant Care Research Center (MiCare) at Mount
PREGNANCY SMOKING AND CHILD OUTCOMES FROM BIRTH TO 15 MONTHS: FINDINGS FROM NORTHEAST TENNESSEE. Beth Bailey, PhD
 PREGNANCY SMOKING AND CHILD OUTCOMES FROM BIRTH TO 15 MONTHS: FINDINGS FROM NORTHEAST TENNESSEE Beth Bailey, PhD Associate Professor of Family Medicine, East Tennessee State University Associate Director
3-86 Psychological Tests and Evaluation Procedures ^ General Ability Measures
 3-86 Psychological Tests and Evaluation Procedures ^ General Ability Measures Kent Infant Development Scale (KIDS) The purpose of the KIDS is to help describe behaviors characteristic of the first year
Evaluations. Learn the Signs. Act Early. The Importance of Developmental Screening. Conflict of Interest Statement.
 Learn the Signs. Act Early. The Importance of Developmental Screening. April 19, 2012 Featured Speakers Judith Lucas, MD Pediatrician, Behavioral Health Albany Medical Center Donna M. Noyes, PhD Associate
Neonatal Neurobehavioral Impacts of Iodine Insufficiency and Pesticide Exposures
 Neonatal Neurobehavioral Impacts of Iodine Insufficiency and Pesticide Exposures Susan Woskie, Pornpimol Kongtip, Noppanun Nankongnab, Wiroj Thanasanpaiboon, Napaporn Kiatdamrong, Nantha Charoonrungsirikul
OCFP 2012 Systematic Review of Pesticide Health Effects: Executive Summary
 OCFP 2012 Systematic Review of Pesticide Health Effects: Executive Summary The second Ontario College of Family Physicians (OCFP) Systematic Review of Pesticide Health Effects reviewed the relevant literature
Physiotherapy Services. Gross Motor Skills
 Physiotherapy Services LEARN TO MOVE. MOVE TO LEARN Gross Motor Skills The following list of activities have been recommended as beneficial to the development of gross motor skills. The activities serve
SCOPE OF PRACTICE PGY-4 PGY-6
 PGY-4 Completion of 1 st year of DBP Core Curriculum and Conferences: Participate in Didactic teaching sessions Typical Behavior and Development: Understanding of Theories of Development for: Infant, Toddler,
Objectives. Terminology 6/29/2016. Neuroprotective Care in the NICU
 Neuroprotective Care in the NICU Small Baby Unit July 2016 Mary Wardell PT, DPT, PCS Objectives Review NICU neuroprotective core measures Discuss sensory processing, what it is, and how it typically develops
Medical Necessity Guidelines: Applied Behavioral Analysis (ABA) including Early Intervention for RITogether
 including Early Intervention for RITogether") Medical Necessity Guidelines: Applied Behavioral Analysis (ABA) including Effective: August 1, 2017 Clinical Documentation and Prior Authorization Required Applies to: Coverage Guideline, No prior Authorization
Medical Necessity Guidelines: Applied Behavioral Analysis (ABA) including Effective: August 1, 2017 Clinical Documentation and Prior Authorization Required Applies to: Coverage Guideline, No prior Authorization
Developmental Effects of Prenatal Exposure to Organophosphate Pesticides
 Developmental Effects of Prenatal Exposure to Organophosphate Pesticides Research findings from the Columbia Center for Children s Environmental Health Rauh 1, Garfinkel 1, Perera 1, Andrews 1, Hoepner
BIOSTATISTICAL METHODS
 BIOSTATISTICAL METHODS FOR TRANSLATIONAL & CLINICAL RESEARCH PROPENSITY SCORE Confounding Definition: A situation in which the effect or association between an exposure (a predictor or risk factor) and
Spinal Muscular Atrophy: Case Study. Spinal muscular atrophy (SMA) is a fairly common genetic disorder, affecting
 is a fairly common genetic disorder, affecting") Spinal Muscular Atrophy: Case Study Spinal muscular atrophy (SMA) is a fairly common genetic disorder, affecting approximately one in 6,000 babies. It is estimated that one in every 40 Americans carries
Spinal Muscular Atrophy: Case Study Spinal muscular atrophy (SMA) is a fairly common genetic disorder, affecting approximately one in 6,000 babies. It is estimated that one in every 40 Americans carries
MOTION DIAGNOSTIC IMAGING (CMDI)/ GAIT ANALYSIS
/ GAIT ANALYSIS") Page: 1 of 5 MEDICAL POLICY MEDICAL POLICY DETAILS Medical Policy Title COMPUTERIZED MOTION DIAGNOSTIC IMAGING (CMDI)/ GAIT ANALYSIS Policy Number 2.01.13 Category Technology Assessment Effective Date
Page: 1 of 5 MEDICAL POLICY MEDICAL POLICY DETAILS Medical Policy Title COMPUTERIZED MOTION DIAGNOSTIC IMAGING (CMDI)/ GAIT ANALYSIS Policy Number 2.01.13 Category Technology Assessment Effective Date
Part 8 Logistic Regression
 1 Quantitative Methods for Health Research A Practical Interactive Guide to Epidemiology and Statistics Practical Course in Quantitative Data Handling SPSS (Statistical Package for the Social Sciences)
MULTIPLE CHOICE. Choose the one alternative that best completes the statement or answers the question.
 Exam Name MULTIPLE CHOICE. Choose the one alternative that best completes the statement or answers the question. Identify the W's for the description of data. 1) A survey of bicycles parked outside college
Development of the Central Nervous System
 Development of the Central Nervous System an ongoing process, through adolescence and maybe even adult hood? the nervous system is plastic Experience plays a key role Dire consequences when something goes
Are randomised controlled trials telling us what rehabilitation interventions work?
 Are randomised controlled trials telling us what rehabilitation interventions work? Focus on stroke Jane Burridge March 6 th 2014 Neurorehabilitation: facts, fears and the future Overview Stroke recovery
Critical Review: What Presenting Speech and Language Characteristics of Late Talkers Distinguish Those Who Recover from Those Who Do Not?
 Critical Review: What Presenting Speech and Language Characteristics of Late Talkers Distinguish Those Who Recover from Those Who Do Not? Melissa Dumoulin M.Cl.Sc. Speech-Language Pathology Candidate University
Neurodevelopmental Disorders
 Neurodevelopmental Disorders Intellectual Disability Disorder Autism Spectrum Disorder (ASD) Attention-Deficit Hyperactivity Disorder (ADD/ADHD) Motor Disorders/Tourette s Disorder Intellectual Disability
How the Brain Works. The Amazing Developing Brain. Presented by Pat Wolfe, Ed.D. LACOE Transitional Kindergarten Conference May 1, 2014
 The Amazing Developing Brain Presented by Pat Wolfe, Ed.D. LACOE Transitional Kindergarten Conference May 1, 2014 How the Brain Works What are some of the common neuromyths concerning the brain? The brain
Wheelchair/Scooter/Stroller Seating Assessment Form (CCP/Home Health Services) ( pages)
 ( pages)") Wheelchair/Scooter/Stroller Seating Assessment Form (CCP/Home Health Services) ( pages) Instructions A current wheelchair/scooter/stroller seating assessment conducted by a physician or a physical or occupational
Wheelchair/Scooter/Stroller Seating Assessment Form (CCP/Home Health Services) ( pages) Instructions A current wheelchair/scooter/stroller seating assessment conducted by a physician or a physical or occupational
Normal development & reflex
 Normal development & reflex Definition of Development : acquisition & refinement of skills 1 대근육운동발달 2 소근육운동발달 3 대인관계및사회성발달 4 적응능력혹은비언어성발달 5 의사소통및언어발달 6 학습, 청각, 시각의발달 Department of Rehabilitation Medicine,
Objectives_ Series II
 Interaction Between the Development of Posture Control and Executive Function of Attention (Reilly et. al 2008) Journal of Motor Behavior, Vol. 40, No. 2, 90 102 Objectives_ Series II Gain an understanding
CHAPTER 3 RESEARCH METHODOLOGY. In this chapter, research design, data collection, sampling frame and analysis
 CHAPTER 3 RESEARCH METHODOLOGY 3.1 Introduction In this chapter, research design, data collection, sampling frame and analysis procedure will be discussed in order to meet the objectives of the study.
BRAIN DEVELOPMENT: HELPING ALL CHILDREN DO AND BE THEIR BEST. February 9, :30 8:00 p.m. (Delicious Dinner First!)
") BRAIN DEVELOPMENT: HELPING ALL CHILDREN DO AND BE THEIR BEST February 9, 2012 5:30 8:00 p.m. (Delicious Dinner First!) Most annoying thing about learning about the brainmom was right! Everything we talk
BRAIN DEVELOPMENT: HELPING ALL CHILDREN DO AND BE THEIR BEST February 9, 2012 5:30 8:00 p.m. (Delicious Dinner First!) Most annoying thing about learning about the brainmom was right! Everything we talk
Cortical Control of Movement
 Strick Lecture 2 March 24, 2006 Page 1 Cortical Control of Movement Four parts of this lecture: I) Anatomical Framework, II) Physiological Framework, III) Primary Motor Cortex Function and IV) Premotor
CORE MEASURE: CORE MEASURE: BERG BALANCE SCALE (BBS)
") OVERVIEW NUMBER OF TEST ITEMS SCORING EQUIPMENT TIME (NEW CLINICIAN) TIME (EXPERIENCED CLINICIAN) COST o The BBS is a widely-used, clinician-rated scale used to assess sitting and standing, static and
OVERVIEW NUMBER OF TEST ITEMS SCORING EQUIPMENT TIME (NEW CLINICIAN) TIME (EXPERIENCED CLINICIAN) COST o The BBS is a widely-used, clinician-rated scale used to assess sitting and standing, static and
On the purpose of testing:
 Why Evaluation & Assessment is Important Feedback to students Feedback to teachers Information to parents Information for selection and certification Information for accountability Incentives to increase
CLINICAL BOTTOM LINE Early Intervention for Children With Autism Implications for Occupational Therapy
 Dawson, G., Rogers, S., Munson, J., Smith, M., Winter, J., Greenson, J.,... Varley, J. (2010). Randomized, controlled trial of an intervention for toddlers with autism: The Early Start Denver Model. Pediatrics,
Inspiring Athleticism in Children and Youth. By Peter Twist. IDEA World 2011
 Inspiring Athleticism in Children and Youth By Peter Twist IDEA World 2011 Critical Factors to Consider When Training Young Athletes o Children are not little adults they have very specialized needs o
Autism in the 6-12 months of life: prelinguistic vocal trajectories and repetitive movements as markers of autism
 Autism in the 6-12 months of life: prelinguistic vocal trajectories and repetitive movements as markers of autism Filippo Muratori & F. Apicella, N. Chericoni, C. Valerio, S. Maestro Montpellier 2017,
Motor systems.... the only thing mankind can do is to move things... whether whispering or felling a forest. C. Sherrington
 Motor systems... the only thing mankind can do is to move things... whether whispering or felling a forest. C. Sherrington 1 Descending pathways: CS corticospinal; TS tectospinal; RS reticulospinal; VS
Family-centered early intervention for families and children who are deaf or hard of hearing
 Family-centered early intervention for families and children who are deaf or hard of hearing Christine Yoshinaga-Itano, Ph.D. University of Colorado, Boulder Best Practice Matters Family-centered early