Autism and Developmental Disabilities Monitoring Network
|
|
|
- Brian Joseph
- 6 years ago
- Views:
Transcription


1 Autism and Developmental Disabilities Monitoring Network

2 To read the MMWR reports in their entirety, go to To read more about autism, go to CDC s autism site at The findings and conclusions in this report are those of the authors and do not necessarily represent the official position of the Centers for Disease Control and Prevention.
3 Prevalence of the Autism Spectrum Disorders (ASDs) in Multiple Areas of the United States, 2004 and 2006 Community Report from the Autism and Developmental Disabilities Monitoring (ADDM) Network Funded by the Centers for Disease Control and Prevention (CDC), U.S. Department of Health and Human Services *This report summarizes the main findings from the following published report: Centers for Disease Control and Prevention (CDC). Prevalence of Autism Spectrum Disorders Autism and Developmental Disabilities Monitoring Network, United States, MMWR Surveill Summ 2009;58(SS-10). 1
4 table of contents Introduction... 3 What Are Autism Spectrum Disorders (ASDs)?... 4 How Many People Have An Autism Spectrum Disorder?... 5 What Is The ADDM Network?... 6 What Are The Results?... 8 State By State Questions and Answers What else do I need to Know? Summary Where Can I Get More Information?... 28
5 Introduction Autism spectrum disorders (ASDs) are conditions that begin early in life and typically affect many areas of a person s daily functioning. The challenges associated with ASDs require collaboration between individuals, family members, professionals, and members of the community to meet the needs of people with ASDs. We still have much to learn about ASDs, but we do know that the number of children identified with ASDs has increased over the past 20 years. It is unclear how much this increase is due to changes in how we identify and classify ASDs and how much is due to a true increase. For the most part, the cause or causes of ASDs are still unknown. However, the heightened concern and awareness of ASDs that have occurred in recent times have accelerated the research and availability of services for people with ASDs. There is still much to do to make sure each person with an ASD has the supports and tools he or she needs to reach his or her full potential. To get a better picture of the scope of ASDs in the United States, the Centers for Disease Control and Prevention (CDC) has established the Autism and Developmental Disabilities Monitoring (ADDM) Network. The network provides estimates of the number of children affected by ASDs, describes the population affected, and evaluates changes in ASDs over time. This report summarizes the findings from the ADDM Network s retrospective estimate of the prevalence of ASDs in the years 2004 and In the report you will find: An overview of ASDs A discussion about the prevalence of ASDs An overview of the ADDM Network ADDM Network results to date Questions and answers A summary Resources for learning more about ASDs and support for families, individuals affected, and communities This report summarizes up-to-date prevalence information from the ADDM Network s efforts. This is the second multisite report from the ADDM Network. Detailed information from the initial report of the ADDM Network can be found at 2,3
6 What Are Autism Spectrum Disorders? Autism spectrum disorders (ASDs) are a group of developmental disabilities that typically begin before a child is 3 years of age and last throughout a person s life. People with ASDs have substantial challenges in social interaction and communication. They handle information in their brain differently than other people, and might have unusual ways of learning, paying attention, and reacting to different sensations. ASDs are part of the broader category of pervasive developmental disorders (PDDs) and include autistic disorder, Asperger disorder, and pervasive developmental disorder-not otherwise specified (PDD-NOS). Although everyone with an ASD has significant challenges in certain areas of his or her life, some might be gifted in other areas. Also, not everyone with an ASD has the same challenges. Some individuals might have relatively good verbal skills, but have difficulty interacting with other people. Others might not be able to talk or have very little ability or interest in communicating or interacting with others. People with ASDs often do not take part in pretend play, have a hard time starting social interactions, and engage in unusual or repetitive behaviors (e.g., flapping hands, making unusual noises, rocking from side to side, or toe walking). There is no medical test for ASDs. Typically, a diagnosis is made after a thorough evaluation by a qualified professional. Such an evaluation might include clinical observations, parent interviews, developmental histories, psychological testing, speech and language assessments, and possibly the use of one or more autism diagnostic tests. Children with ASDs might have other developmental disabilities, such as intellectual disability, seizure disorder, fragile X syndrome, Down syndrome, or tuberous sclerosis. Also, some children might have mental health problems, such as depression or anxiety. Some children with ASDs also might have attention problems, sensory issues, sleep problems, and digestive disorders. Children and adults with an ASD might: Not play pretend games (for example, pretend to feed a doll). Not point at objects to show interest (for example, point at an airplane flying over). Not look at objects when another person points at them. Have trouble relating to others or not have an interest in other people at all. Avoid eye contact and want to be alone. Have trouble understanding other people s feelings or talking about their own feelings. Prefer not to be held or cuddled or might cuddle only when they want to. Appear to be unaware when other people talk to them, but respond to other sounds. Be very interested in people, but not know how to talk to, play with, or relate to them. Repeat or echo words or phrases said to them, or repeat words or phrases in place of normal language (echolalia). Have trouble expressing their needs using typical words or motions. Repeat actions over and over again. Have trouble adapting to changes in routine. Have unusual reactions to the way things smell, taste, look, feel, or sound. Lose skills they once had (for instance, stop saying words they were once using). 6 To learn more about these and other conditions, visit the National Institutes of Mental Health website at
7 How Many People Have an Autism Spectrum Disorder? What is Prevalence? Prevalence is the number of cases of a disease or condition among a defined group of people during a specific time period. For example, one can estimate the prevalence of ASDs among 8-year-olds in 2006 in Atlanta, Georgia, by counting all of the 8-year-olds in Atlanta who were identified with an ASD, and then dividing that number by the total number of 8-year-olds in Atlanta during By monitoring ASDs in the same way over time, we can find out whether the prevalence of autism is increasing, decreasing, or staying the same. Each year, special education programs in the United States are required to report how many children receive services for an ASD. From 1998 to 2007, the number of 6- to 21-year-old children receiving services for an ASD in public special education programs increased from 54,064 to 258, Those numbers likely did not include all children with ASDs, because some children received special education for a particular need, like speech therapy, and not for a diagnosis of autism. Why has it been hard to get accurate reports of prevalence for ASDs? Autism was described first by Leo Kanner in Surveys to find the prevalence of autism started in the mid-1960s in England. 6 Diagnostic criteria for autism and related developmental disabilities came out in 1980, 7,8 and they have been revised several times. There is now an understanding that autism is a spectrum disorder, and can occur in a milder or higher functioning form, or both. In addition, it also has been recognized that ASDs can co-occur with other disabilities. Thus, one challenge in getting an accurate count of people with autism has been the change to a broader, more inclusive, definition of ASDs. 9,10 Furthermore, the fact that the diagnostic criteria of autism and related disorders must rely on behavioral observations of development makes describing the population of people with ASDs challenging, especially when the criteria for diagnosing ASDs have changed over time. Another challenge is that the United States has not had a population-based system to track the full range of ASDs over time. One thing we do know is that more people than ever before are being diagnosed with an ASD. It is unclear how much of this increase is due to a broader definition of ASDs and how much to better efforts in diagnosis. However, a true increase in the number of people who have autism and related disorders cannot be ruled out. It is likely that the increase in the diagnosis of ASDs is due to a combination of these factors. How can we get the most accurate information about the prevalence of ASDs? CDC has established the only collaborative network to determine the prevalence of ASDs in the United States the Autism and Developmental Disabilities Monitoring (ADDM) Network. To get the most accurate data possible, the ADDM Network is guided by the following principles, outlined by Rutter: 10 Use a large enough population so that a substantial number of individuals with autism will be included. Use a defined population that would contain all people likely to have autism. Have a systematic, standardized screening of the total population. Include a focus on an age group for which diagnostic assessments are known to be reliable and valid. Include diagnoses by trained professionals using high-quality, standardized research assessments. 7
8 What do we know today about the prevalence of ASDs in the United States? CDC considers ASDs an urgent public health concern and recognizes that more children are being identified with an ASD than in the past. Despite the emerging concerns in the 1990s about increases in the number of children affected with an ASD, at that time there was no population-based surveillance system for ASDs in the United States. CDC began collecting data on ASD prevalence in Metropolitan Atlanta in CDC also began the ADDM Network in 2000 to collect comparable epidemiologic data in multiple areas of the United States. By 2004, CDC early prevalence results confirmed that more children with ASDs were being identified than in the past. 11 CDC partnered with the American Academy of Pediatrics to issue an Autism A.L.A.R.M. to raise awareness of ASDs. 12 In addition, CDC began the Learn the Signs. Act Early. ( campaign to improve the early identification of children with ASDs. In 2007, the ADDM Network issued its first reports (study years ), indicating a prevalence range of 1 in 100 to 1 in 300, with an average of 1 in 150 children affected by an ASD. 2,3 Why is the accurate reporting of ASD prevalence important? Accurate reporting of ASD prevalence is important for all educators, health providers, policy makers, and families. The ADDM Network provides an estimate of the number of children with ASDs in the areas included who require educational and health interventions. Only by appreciating the true scope of a condition can we make realistic plans for funding and resources (such as therapies, trained teachers, diagnosticians, health care providers, and related service professionals) needed to support children with ASDs and their families. It has been shown that among families who have children with special health care needs, those affected with ASDs are more likely to report problems with access to coordinated care and to experience financial and time burdens. Many parents even reported having to stop work to care for their child with an ASD. 13 One study showed that individuals with an ASD had average medical expenditures that exceeded those without an ASD by $4,110 to $6,200 per year. 14 It has been estimated that, overall, economic costs associated with autism are approximately $35 billion dollars per year. 15 These costs include education for children with ASDs and treatments to help reduce the symptoms of the disorders. Families, public agencies, and some private agencies bear the responsibility of paying for these services. What is the ADDM Network? The Autism and Developmental Disabilities Monitoring (ADDM) Network is the largest multisite collaboration to monitor ASDs in the United States. Its mission is aimed at achieving multiple goals: To obtain as complete a count as possible of the number of children with ASDs in each project area. To report comparable, population-based ASD prevalence estimates from different sites and to determine if these rates are changing over time. To study whether autism is more common among some groups of children than among others. To provide data to characterize those among the ASD population. The Children s Health Act of 2000 authorized CDC to create the ADDM Network. Since the network s inception, CDC has funded programs at 16 sites covering 17 states Alabama, Arizona, Arkansas, California, Colorado, Florida, Georgia, Illinois, Maryland, Missouri, New Jersey, North Carolina, Pennsylvania, South Carolina, Utah, West Virginia, and Wisconsin. 8
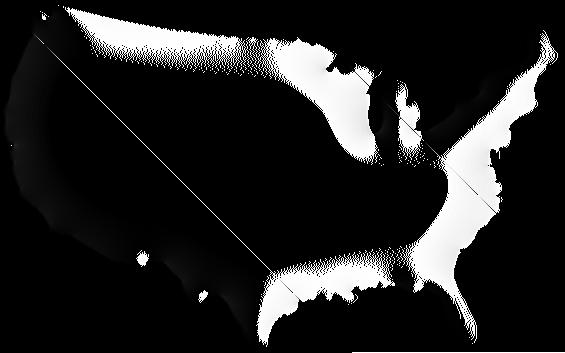
9 The sites represented in this report include areas of Alabama, Arizona, Colorado, Florida, Georgia, Maryland, Missouri, North Carolina, Pennsylvania, South Carolina, and Wisconsin. The ADDM sites work together to maintain consistent study methods based on CDC s Metropolitan Atlanta Developmental Disabilities Surveillance Program (MADDSP), which monitors the occurrence of developmental disabilities among 8-year-old children in metropolitan Atlanta. CDC has been working on the methodology for developmental disability surveillance for more than 20 years, and its application to ASDs was undertaken following concerns about increases in autism during the mid -1990s. The ADDM Network does not rely solely on a child s previous ASD diagnosis or special education eligibility category to classify a child as having ASD. The ADDM Network issued its first reports on ASD prevalence in ,3 These data since have been referenced as the standard for estimating ASD prevalence in the United States. As the network continues to use the same methods across additional years, more information describing the changes in ASD prevalence over time will be available. What methods did the ADDM sites use for their study? Although this report is being published in 2009, the data reflect prevalence estimates from 2004 and 2006 in order to go back in time and evaluate how ASDs have changed over time. Each ADDM site identified for its study area a geographic region with a large enough population and identified children who were 8 years old during the targeted study year. The methodology included screening records at multiple sources that educated, diagnosed, treated, and provided services for children with developmental disabilities, and abstracting detailed behavioral data on children who met the screening criteria. A panel of clinicians with expertise in identifying and assessing ASDs systematically reviewed the abstracted information based on the Diagnostic and Statistical Manual of Mental Disorders (Fourth Editor, Text Revision) definition of autism,8 and determined whether the identified children met the requirements of the monitoring program and could be considered as having an ASD. All program staff received extensive training and met ongoing quality assurance standards. Washington Montana North Dakota Maine Vermont Minnesota Oregon Idaho New Hampshire Wisconsin South Dakota Wyoming Michigan Iowa Nebraska Nevada Illinois Colorado Kansas Massachusetts Rhode Island Connecticut Pennsylvania Utah California New York Indiana New Jersey Ohio West Virginia Virginia Missouri Kentucky Tennessee Delaware Maryland DC North Carolina Arizona Oklahoma Arkansas South Autism and Developmental Disabilities Monitoring (ADDM) Networks New Mexico Carolina Mississippi Alabama Washington Georgia Texas Montana Alaska North Dakota Vermont Minnesota Louisiana Maine Oregon Idaho South Dakota Wyoming Utah Illinois Colorado California Arizona New York Michigan Kansas Kentucky Delaware Maryland DC North Carolina Tennessee Arkansas Massachusetts New Jersey Ohio West Virginia Virginia Missouri Oklahoma New Mexico Indiana Florida Rhode Island U.S. Virgin Islands Guam Pennsylvania Connecticut Iowa Nebraska Nevada New Hampshire Puerto Rico Wisconsin Hawaii South Carolina Mississippi Alabama Georgia Texas Louisiana Alaska Florida Hawaii Puerto Rico U.S. Virgin Islands Guam To find out more about CDC s prevalence and monitoring programs for developmental disabilities, please visit 9
10 What Are the Results? What does the ADDM Network Tell Us about Autism Spectrum Disorders? Study Site Information States Participating in the ADDM Network Alabama, Arizona, Georgia (CDC), Maryland, Missouri, North Carolina, South Carolina, and Wisconsin Alabama, Arizona, Colorado, Florida, Georgia (CDC), Maryland, Missouri, North Carolina, Pennsylvania, South Carolina, and Wisconsin Population of 8-Year-Olds in the Study Area ,335 8-year-olds across 8 study areas (Approximately 4.3% of all 8-year-olds in the United States) ,790 8-year-olds across 11 study areas (Approximately 7.9% of all 8-year-olds in the United States) Results 2004 ASD Prevalence Number of 8-year-old children identified with an ASD: 1,376 Total prevalence of ASDs: 4.6 (about 1in 215) to 9.8 (about 1 in 100) per 1,000 8-year-old children. Overall average prevalence of ASDs across all sites: 8.0 per 1,000 8-year-old children, or approximately 1 in 125 children. Boys: 8.9 to 15.8 per 1,000 8-year-old children Girls: 1.5 to 3.7 per 1,000 8-year-old children White, non-hispanic: 9.7 per 1,000 8-year-old children Black or African American, non-hispanic: 6.9 per 1,000 8-year-old children Hispanic: 6.2 per 1,000 8-year-old children Asian or Pacific Islander: 4.3 to 12.3 per 1,000 8-year-old children* 2006 ASD Prevalence Number of 8-year-old children identified with an ASD: 2,757 Total prevalence of ASDs: 4.2 (about 1 in 240) to 12.1 (about 1 in 80) per 1,000 8-year-old children. Overall average ASD prevalence: 9.0 per 1,000 children, or approximately 1 in 110 children. Boys: 7.3 to 19.3 per 1,000 8-year-old children Girls: 1.0 to 4.9 per 1,000 8-year-old children White, non-hispanic: 9.9 per 1,000 8-year-old children Black or African American, non-hispanic: 7.2 per 1,000 8-year-old children Hispanic: 5.9 per 1,000 8-year-old children Asian or Pacific Islander: 1.0 to 16.2 per 1,000 8-year-old children* * Please see MMWR SS report 1 for additional information by race and ethnicity (American Indian or Alaska Native) The ADDM sites do not make up a nationally representative sample, and caution is needed when generalizing rates to every community in the United States. Rates might be higher or lower in some places. However, the average estimated prevalence across all sites of 9.0 per 1,000 8-year-old children (or approximately 1 in 110) can help communities estimate for planning and identification purposes how many children in their communities might have an ASD. 10
11 Comparison between 2002 and 2006 Prevalence Estimates Ten sites (Alabama, Arizona, Colorado, Georgia, Maryland, Missouri, North Carolina, Pennsylvania, South Carolina, and Wisconsin.) collected data in both 2002 and We compared the prevalence of ASDs at these 10 sites and found that the prevalence increased at all of the sites, from 27% in Colorado to 95% in Arizona. On average, the prevalence at all sites increased by 57% from 2002 to Other changes from 2002 to 2006: Prevalence among boys: Increased an average of 60% Prevalence among girls: Increased an average of 48% expect in Wisconsin, which stayed the same, and South Carolina and Maryland, which decreased Prevalence among White, Non-Hispanic children: Increased an average of 55% (except in Colorado, Pennsylvania, and South Carolina) Prevalence among Black or African-American, Non-Hispanic children: Increased an average of 41% in four states (Alabama, Arizona, Georgia, and Pennsylvania) Special Education Classifications 2004 and 2006 For all sites with access to educational records, at least 80% of children with an ASD were receiving special education services for autism. Cognitive Functioning 2004 From 37.9% (Arizona) to 63% (Alabama) (overall average: 43.8 %) of the children identified with an ASD also had an intellectual disability (an IQ 70, at the sites that had test results on intellectual ability for at least 75% of the children identified) From 29.3% (Colorado) to 51.2% (South Carolina) (overall average: 41.0 %) of the children identified with an ASD also had an intellectual disability (an IQ 70, at the sites that had test results on intellectual ability for at least 75% of the children identified). Early Developmental Concerns and Age of ASD Diagnosis At all of the sites for 2004 and 2006, more than half of the children meeting surveillance criteria for ASDs 8 years of age had documented developmental concerns before 3 years of age Median age range of earliest reported ASD diagnosis was 4 years (North Carolina) to 5 years, 7 months (Arizona) Median age range of earliest reported ASD diagnosis was 3 years, 5 months (Florida) to 5 years (Colorado); full range from 2 months (Georgia) to 8 years, 10 months (North Carolina and Wisconsin). 11


12 Alabama The Alabama Autism Surveillance Program (AASP) Results Prevalence, 2004 Number of children identified with an ASD: 54 Total prevalence of ASDs: 4.6 per 1,000 Boys: 6.8 per 1,000 Girls: 2.3 per 1,000 White, non-hispanic: 3.8 per 1,000 Black non-hispanic: 6.0 per 1,000 Prevalence, 2006 Number of children identified with an ASD: 212 Total prevalence of ASDs: 6.0 per 1,000 Boys: 9.1 per 1,000 Girls: 2.9 per 1,000 White, non-hispanic: 5.8 per 1,000 Black non-hispanic: 6.8 per 1,000 Hispanic: 0.6 per 1,000 Asian or Pacific Islander: 2.7 per 1,000 Median age of ASD diagnosis 4 years, 3 months site information Part of Alabama Included in ADDM counties: Jefferson, Shelby, Blount Part of Alabama Included in ADDM counties: Bibb, Blount, Calhoun, Cherokee, Clay, Cleburne, Colbert, Cullman, Dekalb, Etowah, Fayette, Franklin, Greene, Hale, Jackson, Jefferson, Lamar, Lauderdale, Lawrence, Limestone, Madison, Marion, Marshall, Morgan, Pickens, Shelby, St. Clair, Sumter, Talladega, Tuscaloosa, Walker, and Winston Population of 8-Year-Old Children in Study Area, ,676 White, non-hispanic: 57.9% Black, non-hispanic: 37.1% Hispanic: 3.2% Asian or Pacific Islander: 1.4% Children in special education: 16.7% Population of 8-Year-Old Children in Study Area, ,126 White, non-hispanic: 68.2% Black, non-hispanic: 25.7% Hispanic: 4.6% Asian or Pacific Islander: 1.1% Children in special education: 16.7% For more information, please contact: Neva Garner University of Alabama-Birmingham 320 Ryals Public Health Building 1665 University Blvd Birmingham, AL Phone: (205) Fax: (205) ngarner@ms.soph.uab.edu 2006 Yellow - County in the ADDM Network


13 Arizona The Arizona Developmental Disabilities Surveillance Program (ADDSP) Results Prevalence, 2004 Number of children identified with an ASD: 133 Total prevalence of ASDs: 9.8 per 1,000 Boys: 15.8 per 1,000 Girls: 3.6 per 1,000 White, non-hispanic: 12.6 per 1,000 Black, non-hispanic: 5.6 per 1,000 Hispanic: 7.0 per 1,000 Asian or Pacific Islander: 11.9 per 1,000 Prevalence, 2006 Number of children identified with an ASD: 504 Total prevalence of ASDs: 12.1 per 1,000 Boys: 18.9 per 1,000 Girls: 4.9 per 1,000 White, non-hispanic: 14.8 per 1,000 Black, non-hispanic: 12.9 per 1,000 Hispanic: 8.3 per 1,000 Asian or Pacific Islander: 16.2 per 1,000 Median age of ASD diagnosis 4 years 11 months site information Part of Arizona Included in ADDM Maricopa County (metropolitan Phoenix, Arizona). Population of 8-Year-Old Children in Study Area, ,620 White, non-hispanic: 48.2% Black, non-hispanic: 5.2% Hispanic: 40.9% Asian or Pacific Islander: 3.1% Children in special education: 10.2 % Population of 8-Year-Old Children in Study Area, ,650 White, non-hispanic: 47.2% Black, non-hispanic: 5.4% Hispanic: 42.2% Asian or Pacific Islander: 3% Children in special education: 16/7% Yellow - County in the ADDM Network For more information, please contact: Sydney Pettygrove, PhD Department of Pediatrics Arizona Health Sciences Center 1501 N. Campbell Ave. Tucson, AZ Phone: (520) Fax: (520) sydneyp@u.arizona.edu 13

14 Colorado Colorado Autism Developmental Disabilities Monitoring Program (CO-ADDM) RESULTS Prevalence, 2006 Number of children identified with an ASD: 54 Total prevalence of ASDs: 7.5 per 1,000 Boys: 11.5 per 1,000 Girls: 3.4 per 1,000 White, non-hispanic: 6.7 per 1,000 Black, non-hispanic: 12.5 per 1,000 Hispanic: 4.5 per 1,000 Asian or Pacific Islander: 7.3 per 1,000 Median age of ASD diagnosis 5 years site information Part of Colorado Included in ADDM Arapahoe County (metropolitan Denver, Colorado) Population of 8-Year-Old Children in the Study Area, ,184 White-Non-Hispanic: 55.8% Black-Non-Hispanic: 13.4% Hispanic: 24.5% Asian or Pacific Islander: 5.7% Children in special education: 10.7% Yellow - County in the ADDM Network For more information, please contact: Andria Ratchford, MSPH Colorado Responds to Children with Special Needs Colorado Department of Public Health and Environment 4300 Cherry Creek Drive, South A3 Denver, CO Phone: (303) Andria.ratchford@state.co.us 14

15 Florida The University of Miami Autism and Developmental Disabilities Monitoring Project (UM-ADDM) RESULTS Prevalence, 2006 Number of children identified with an ASD: 116 Total prevalence of ASDs: 4.2 per 1,000 Boys: 7.3 per 1,000 Girls: 1.0 per 1,000 White, non-hispanic: 3.4 per 1,000 Black, non-hispanic: 1.6 per 1,000 Hispanic: 5.2 per 1,000 Median Age of ASD diagnosis 3 years 5 months site information Part of Florida Included in ADDM Dade County, (Miami, Florida) Population of 8-Year-Old Children in the Study Area, ,615 White-Non-Hispanic: 23.3% Black-Non-Hispanic: 22.7% Hispanic: 52.3% Asian or Pacific Islander: 1.6% Children in special education: 11.8% For more information, please contact: Marygrace Yale Kaiser, PhD Department of Psychology University of Miami PO Box Coral Gables, FL Phone: (305) Fax: (305) myale@miami.edu Yellow - County in the ADDM Network 15


16 Georgia Metropolitan Atlanta Developmental Disabilities Monitoring Program (MADDSP) Results Prevalence, 2004 Number of children identified with an ASD: 401 Total prevalence of ASDs: 8.9 per 1,000 Boys: 14.1 per 1,000 Girls: 3.6 per 1,000 White, non-hispanic: 9.7 per 1,000 Black, non-hispanic: 7.9 per 1,000 Hispanic: 6.4 per 1,000 Asian or Pacific Islander: 8.1 per 1,000 Prevalence, 2006 Number of children identified with an ASD: 474 Total prevalence of ASDs: 10.2 per 1,000 Boys: 16.6 per 1,000 Girls: 3.4 per 1,000 White, non-hispanic: 12.0 per 1,000 Black, non-hispanic: 9.5 per 1,000 Hispanic: 4.8 per 1,000 Asian or Pacific Islander: 7.8 per 1,000 Median Age of ASD diagnosis 4 years 5 months site information Part of Georgia Included in ADDM 5 counties: Clayton, Cobb, DeKalb, Fulton, and Gwinnett (metropolitan Atlanta) Population of 8-Year-Old Children in Study Area, ,190 White-Non-Hispanic: 40.4%Black- Non-Hispanic: 42.4% Hispanic: 11.4% Asian or Pacific Islander: 5.4% Children in special education: 10.8% Population of 8-Year-Old Children in Study Area, ,621 White-Non-Hispanic: 38.3% Black-Non-Hispanic: 42.6% Hispanic: 12.9% Asian or Pacific Islander: 5.8% Children in special education: 11.3% Yellow - County in the ADDM Network 16 For more information, please contact: Catherine Rice, PhD CDC/NCBDDD MS E Clifton Road Atlanta, GA Phone: Fax: crice@cdc.gov


17 Maryland The Maryland Autism and Developmental Disabilities Monitoring Project (MD-ADDM) Results Prevalence, 2004 Number of children identified with an ASD: 185 Total prevalence of ASDs: 8.8 per 1,000 Boys: 14.1 per 1,000 Girls: 3.2 per 1,000 White, non-hispanic: 7.4 per 1,000 Black, non-hispanic: 12.8 per 1,000 Hispanic: 8.8 per 1,000 Asian or Pacific Islander: 12.3 per 1,000 Prevalence, 2006 Number of children identified with an ASD: 243 Total prevalence of ASDs: 9.2 per 1,000 Boys: 15.6 per 1,000 Girls: 2.4 per 1,000 White, non-hispanic: 9.3 per 1,000 Black, non-hispanic: 7.9 per 1,000 Hispanic: 6.3 per 1,000 Asian or Pacific Islander; 9.6 per 1,000 Median age of ASD diagnosis 5 years site information Part of Maryland Included in ADDM counties: Baltimore, Carroll, Cecil, Harford, Howard Part of Maryland Included in ADDM counties: Anne Arundel, Baltimore, Carroll, Cecil, Harford, and Howard Population of 8-Year-Old Children in the Study Area, ,981 White-Non-Hispanic: 71.7% Black-Non-Hispanic: 20.1% Hispanic: 3.3% Asian or Pacific Islander: 4.7% Children in special education: 12.8% Population of 8-Year-Old Children in the Study Area, ,489 White-Non-Hispanic: 69.7% Black-Non-Hispanic: 21.1% Hispanic: 4.2% Asian or Pacific Islander: 4.7% Children in special education: 12.6% 2004 For more information, please contact: Li-Ching Lee, PhD, ScM Department of Epidemiology Johns Hopkins Bloomberg School of Public Health 615 N. Wolfe St., Suite E6032 Baltimore MD Phone: Fax: llee2@jhsph.edu 2006 Yellow - County in the ADDM Network 17


 Population of 8-Year-Old Children in the Study Area, 2004-26,970 White-Non- Hispanic: 69.8% Black-Non- Hispanic: 24.7% Hispanic: 2.7% Asian or Pacific Islander: 2.")
18 Missouri The Missouri Autism and Developmental Disabilities Monitoring Project (MO ADDM) RESULTS Prevalence 2004 Number of hildren identified with an ASD: 221 Total prevalence of ASDs: 8.2 per 1,000 Boys: 13.5 per 1,000 Girls: 2.8 per 1,000 White, non-hispanic: 8.7 per 1,000 Black, non-hispanic: 3.2 per 1,000 Hispanic: 5.5 per 1,000 Asian or Pacific Islander: 4.3 per 1,000 Prevalence 2006 Number of children identified with an ASD: 321 Total prevalence of ASDs: 12.1 per 1,000 Boys: 19.3 per 1,000 Girls: 4.7 per 1,000 White, non-hispanic: 13.7 per 1,000 Black, non-hispanic: 5.1 per 1,000 Hispanic: 2.6 per 1,000 Asian or Pacific Islander: 7.8 per 1,000 Median age of ASD diagnosis 4 years 5 months site information Part of Missouri Included in ADDM 5 counties: St. Louis, St. Louis City, Franklin, Jefferson, St. Charles (metropolitan St. Louis, Missouri) Population of 8-Year-Old Children in the Study Area, ,970 White-Non- Hispanic: 69.8% Black-Non- Hispanic: 24.7% Hispanic: 2.7% Asian or Pacific Islander: 2.6% Children in special education: 19.0% Population of 8-Year-Old Children in the Study Area, ,533 White-Non-Hispanic: 68.6% Black-Non-Hispanic: 25.3% Hispanic: 2.9% Asian or Pacific Islander: 2.9% Children in special education: 17.6% For more information, please contact: Robert Fitzgerald, MPH Department of Psychiatry Washington University in St. Louis Phone: (314) Fax: (314) fitzgeraldr@wustl.edu Yellow - County in the ADDM Network 18

19 North Carolina The North Carolina Center for Autism and Developmental Disabilities Monitoring Project RESULTS Prevalence 2004 Number of children identified with an ASD: 176 Total prevalence of ASDs: 8.7 per 1,000 Boys: 14.8 per 1,000 Girls: 2.4 per 1,000 White, non-hispanic: 8.6 per 1,000 Black, non-hispanic: 9.0 per 1,000 Hispanic: 6.8 per 1,000 Asian or Pacific Islander: 5.3 per 1,000 Prevalence 2006 Number of children identified with an ASD: 230 Total prevalence of ASDs: 10.4 per 1,000 Boys: 17.0 per 1,000 Girls: 3.4 per 1,000 White, non-hispanic: 12.2 per 1,000 Black, non-hispanic: 7.5 per 1,000 Hispanic: 6.1 per 1,000 Asian or Pacific Islander: 4.8 per 1,000 Median age of ASD diagnosis 4 years 2 months site information Part of North Carolina Included in ADDM counties: Alamance, Chatham, Davidson, Durham, Forsyth, Guilford, Orange, and Randolph Part of North Carolina Included in ADDM counties: Alamance, Caswell, Chatham, Davidson, Durham, Forsyth, Guilford, Orange, Randolph and Rockingham 2004 Population of 8-Year-Old Children in the Study Area, ,187 White-Non-Hispanic: 57.8% Black-Non-Hispanic: 28.7% Hispanic: 10.3% Asian or Pacific Islander: 2.8% Children in special education: 14.4% Population of 8-Year-Old Children in the Study Area, ,195 White-Non-Hispanic:57.3% Black-Non-Hispanic: 27.8% Hispanic: 11.8% Asian or Pacific Islander: 2.8% Children in special education: 13.6% For more information, please contact: Julie Daniels, PhD University of North Carolina at Chapel Hill School of Public Health Department of Epidemiology, CB# 7435 Chapel Hill, NC Phone: (919) Julie_daniels@unc.edu 2006 Yellow - County in the ADDM Network 19

20 Pennsylvania The Pennsylvania Autism and Developmental Disabilities Surveillance Program (PADDSP) RESULTS Prevalence 2006 Number of children identified with an ASD: 150 Total prevalence of ASDs: 8.4 per 1,000 Boys: 13.3 per 1,000 Girls: 3.3 per 1,000 White, non-hispanic: 10.1 per 1,000 Black, non-hispanic: 7.5 per 1,000 Hispanic: 7.7 per 1,000 Asian or Pacific Islander: 1.0 per 1,000 Median age of ASD diagnosis 4 years 4 months Site Information Part of Pennsylvania Included in ADDM Philadelphia County Population of 8-Year-Old Children in the Study Area, ,886 White-Non-Hispanic:28.2% Black-Non-Hispanic: 50.1% Hispanic: 15.9% Asian or Pacific Islander: 5.4% Children in special education: 13% Yellow - County in the ADDM Network For more information, please contact: Ellen Giarelli, EdD, RN University of Pennsylvania, School of Nursing 418 Curie Blvd Philadelphia, PA Phone: (215) Fax: (215) Giarelli@nursing.upenn.edu 20


21 South Carolina The South Carolina Autism and Developmental Disabilities Monitoring Program (SC-ADDM) RESULTS Prevalence 2004 Number of children identified with an ASD: 118 Total prevalence of ASDs: 5.3 per 1,000 Boys: 8.9 per 1,000 Girls: 1.5 per 1,000 White, non-hispanic: 5.5 per 1,000 Black, non-hispanic: 4.1 per 1,000 Hispanic: 2.4 per 1,000 Prevalence 2006 Number of children identified with an ASD: 196 Total prevalence of ASDs: 8.6 per 1,000 Boys: 14.3 per 1,000 Girls: 2.6 per 1,000 White, non-hispanic: 7.1 per 1,000 Black, non-hispanic: 7.3 per 1,000 Hispanic: 4.8 per 1,000 Asian or Pacific Islander: 3.6 per 1,000 Median age of ASD diagnosis 4 years 6 months Site Information Part of South Carolina Included in ADDM 23 counties: Allendale, Bamberg, Barnwell, Beaufort, Berkeley, Charleston, Chesterfield, Clarendon, Colleton, Darlington, Dillon, Dorchester, Florence, Georgetown, Hampton, Horry, Jasper, Lee, Marion, Marlboro, Orangeburg, Sumter, Williamsburg Population of 8-Year-Old Children in the Study Area, ,399 White-Non-Hispanic: 53.0% Black-Non-Hispanic: 41.7% Hispanic: 3.7% Asian or Pacific Islander: 1.1% Children in special education: 16.2% Population of 8-Year-Old Children in the Study Area, ,681 White-Non-Hispanic: 53.6% Black-Non-Hispanic: 39.9% Hispanic: 4.6% Asian or Pacific Islander: 1.2% Children in special education: 15.9% For more information, please contact: Walter Jenner, MS, CAS Medical University of South Carolina Developmental Pediatrics 135 Rutledge Ave, MSC567 Charleston, SC Phone: (843) jennerw@musc.edu Yellow - County in the ADDM Network 21

22 Wisconsin The Wisconsin Surveillance of Autism and Other Developmental Disabilities System (WISADDS) RESULTS Prevalence 2004 Number of children identified with an ASD: 88 Total prevalence of ASDs: 7.8 per 1,000 Boys: 12.0 per 1,000 Girls: 3.7 per 1,000 White, non-hispanic: 7.4 per 1,000 Black, non-hispanic: 3.6 per 1,000 Hispanic: 1.6 per 1,000 Asian or Pacific Islander: 6.0 per 1,000 Prevalence 2006 Number of children identified with an ASD: 257 Total prevalence of ASDs: 7.6 per 1,000 Boys: 12.7 per 1,000 Girls: 2.3 per 1,000 White, non-hispanic: 8.5 per 1,000 Black, non-hispanic: 3.6 per 1,000 Hispanic: 1.7 per 1,000 Asian or Pacific Islander: 5.8 per 1,000 Median age of ASD diagnosis 4 years 5 months Site Information Part of Wisconsin Included in ADDM counties: Dane, Jefferson, and Waukesha Part of Wisconsin Included in ADDM counties: Kenosha, Racine, Milwaukee, Ozaukee, Waukesha, Jefferson, Rock, Dane, Green and Walworth Population of 8-Year-Old Children in the Study Area, ,312 White-Non-Hispanic: 84.8% Black-Non-Hispanic: 4.9% Hispanic: 5.6% Asian or Pacific Islander: 4.4% Children in special education: 14.4% Population of 8-Year-Old Children in the Study Area, ,058 White-Non-Hispanic: 65.7% Black-Non-Hispanic: 18.1% Hispanic: 12.2% Asian or Pacific Islander: 3.5% Children in special education: 15.0% 22 For more information, please contact: Carrie Arneson, MS University of Wisconsin-Madison Waisman Center, Rm. A Highland Avenue Madison, WI Phone: (608) Fax: (608) clarneso@wisc.edu Yellow - County in the ADDM Network

23
24 Questions and Answers What do the ADDM Network results tell us about the prevalence of ASDs in the United States? The most recent ADDM Network data affirm that ASDs are conditions of urgent public health concern, affecting approximately 1% of all children. In other words, from 1 in 80 to 1 in 240 with an average of 1 in 110 children have an ASD. Does this mean that the prevalence of ASDs is 1 in 110 in every community in the United States? It is important to remember that the estimate of 1 in 110 children with an ASD is an average based on data on 8-year-olds in specific time periods in several areas of the United States. These areas are not representative of the entire United States. It would not be expected that all 11 sites in the ADDM Network would have the same rate and, indeed, every site did not have the same prevalence rate. When the margin of error is taken into account, the prevalence estimate range is from 8.6 to 9.3 per 1,000, or 1 in 116 to 1 in 108. How can I summarize the findings across all sites? In 2004, the overall average prevalence was 8.0 per 1,000 children and most of the ADDM Network sites found from 7.8 to 8.9 children with ASDs per 1,000 8-year old children. The prevalences in Alabama and South Carolina were lower than those for all other sites. For 2006, the overall average prevalence was 9.0 per 1,000 children and ranged from 4.2 (Florida) to 12.1 (Arizona and Missouri), with the majority of sites from 7.6 to These data support that ASDs continue to be an urgent public health concern affecting approximately 1% of children overall, with about 1 in 70 boys and 1 in 310 girls affected with ASDs. Why would rates be lower at some sites and higher in others? The majority of sites had similar estimates; however, some variations were found. Study representatives worked closely with community providers in each given study area to ensure that all 8-year-old children with an ASD were included in the prevalence estimates. Some sites across the network partnered with both health care and education providers, while others work solely with health care providers. Sites that worked with both types of providers tended to have higher prevalence estimates because they had access to additional information to help identify children with ASDs. Overall, we know that approximately 1% of children were affected with ASDs and concerted efforts are needed to improve identification and services for all people affected. What do we know about trends? The ADDM Network was able to look at ASD prevalence changes at 10 sites from the years 2002 to During this time, the prevalence of ASDs increased 57% across all the sites and ranged from 27% to 95%. Identified ASD prevalence increased consistently across all sites among boys and increased at some sites among girls. By 2006, the average prevalence of ASDs was approaching 1% of 8-year-old children. These data confirm that the prevalence of children identified with ASDs has been rising, and continued monitoring is important to document and understand changes over time. Concerted efforts are needed to address the many service needs of the individuals and families affected. 24 What is causing the increase in children identified with ASDs? No single factor can explain changes in the ADDM Network-identified ASD prevalence over time, and although some of the increases can be accounted for by improved identification, it also is possible that the symptoms
25 associated with ASDs have increased steadily among the population. The question of how much of this increase in ASD prevalence is due to a genuine increase in risk is impossible to answer fully. It also is clear that there is not a single reason for the increase. Instead, many different factors have been at play. While we are reaching a better understanding of ASD prevalence among children in the United States, we are still in the midst of a changing landscape with changes in identification, awareness, and improved understanding of the complex causes of ASDs. As more studies indicate that ASD prevalence is approaching 1% or greater, it will be essential to know if the estimated prevalence will level out or continue to change over time. Continuing to evaluate the prevalence of ASDs among children born in this millennium is very important. What else can ADDM Network results tell us? Beyond the prevalence of ASDs, the ADDM Network also can help us to understand some characteristics of children with ASDs. For instance, we know that most children identified with an ASD are receiving some form of special education, but that for the 2006 study year, children with ASDs who received special education services under an ASD exceptionality ranged from 34.1% in Colorado to 76% in Maryland. We also know that for 2006, the proportion of children with ASDs who also had cognitive impairment ranged from 29% in Colorado to 51% in South Carolina, with an average of 41%. Girls with ASDs were more likely to have cognitive impairment. ADDM data also can help us to understand the developmental characteristics of children with ASDs. At all sites for both study years (2004 and 2006), more than half of the children who were identified with an ASD had documented developmental concerns before 3 years of age. The most common concern, noted by either a parent, educator, or health care provider was for language skills. The median age for earliest reported diagnosis in a child s record ranged from 41 months in Florida to 60 months in Colorado (2006). The percentage of children with ASDs who also experienced a developmental regression or loss of skills ranged from 13% in Alabama to 30% in Wisconsin (2006). From 3% (Georgia) to 10% (Missouri) of children with an ASD had documentation of experiencing a developmental plateau or leveling off of skills without continued development or regression. How many children in the United States have ASDs? At this time, there is not a full population count of all individuals with an ASD in the United States. However, using the prevalence data cited previously (approximately 1 in 110 children with an ASD), we can estimate that if 4 million children are born in the United States every year, approximately 36,500 children from each birth cohort eventually will be diagnosed with an ASD. Assuming the prevalence rate has been constant over the past two decades, we can estimate that about 730,000 individuals 21 years of age or younger have an ASD. However, many of these individuals might not be classified as having an ASD until school age or later. Because behaviors related to the ASDs usually are present before a child is 3 years of age, it is important to make sure children are being classified and are receiving appropriate intervention services as early as possible. How do the rates of ASDs compare with rates of other childhood disabilities and special health care needs? Approximately 2% of children younger than 18 years of age have a serious developmental disability (DD) and these include intellectual disability (ID), cerebral palsy, hearing loss, and vision loss. 16 Of these serious DDs, ID is the most common. A genetic disorder often associated with having an ID that many people recognize is Down syndrome. Current information indicates that Down syndrome occurs among approximately 1 out of 1,000 children. 17 Approximately 13% of children have some type of DD, including more mild conditions such 25
26 as speech and language disorders, learning disabilities, and attention-deficit/hyperactivity disorder (ADHD), which appear to be more common than ASDs. 18 For example, according to the 2007 National Survey of Children s Health (NSCH), approximately 1 in every 16 children 2 through 17 years of age has ADD/ADHD. Many children are faced with other special health care needs. According to the American Diabetes Association, approximately 1 in every 400 to 600 children and adolescents has juvenile diabetes. 19 ASDs are more common than childhood cancer, which has a prevalence of 1.5 per 10,000 children (1 in 300 males and 1 in 333 females have a probability of developing cancer by 20 years of age according to the National Cancer Institute). 20 According to the 2007 National Survey of Children s Health, approximately 1 in every 10 children younger than 18 years of age has asthma. How many children with ASDs are being served through public special education programs? In 2007, 258,305 children 6 through 21 years of age and 39,434 children 3 through 5 years of age were served under the autism classification for special education services. 4 Not all children with an ASD receive special education services under the classification of autism, so the education data are not meant to represent the actual number of people with an ASD. While it is clear that more children are getting special education services for autism than ever before, it is important to remember that this classification was added only in the early 1990s and the growth in the number of children classified might be due in part to the addition of this as a special education category. How does the number of children with ASDs in special education compare with the number of children with other disabilities? In 2007, according to Individuals with Disabilities Education Act administrative counts, 5,912,586 children 6 through 21 years of age received services through any of 13 categories in public special education programs. Specific learning disability was the most frequent education category identified, followed by speech and language impairment. Together, these two categories made up nearly 64% of all special education placements. The intellectual disability classification accounted for about 8% (487,854). Autism accounted for about 4% (256,863). 4 What is CDC s response to autism? Providing data to describe the current prevalence of ASDs is one of CDC s roles in the public health response to ASDs. These data affirm the clear need for research investigating risk factors and causes of ASDs. CDC is currently enrolling study participants for the Study to Explore Early Development (SEED) which is designed to help identify factors that might put children at risk for ASDs and other DDs. SEED is studying potential risk factors that might be related to genes, health conditions, and other factors that can affect a mother s pregnancy and a child s first few years of life. CDC also recognizes the importance of helping people understand developmental milestones for children through the Learn the Signs. Act Early. campaign, ( actearly).the campaign, launched in 2005, helps to inform parents, health care professionals, and early educators about the importance of monitoring a child s developmental milestones and obtaining early intervention services. While these projects contribute to the many needs in autism research and services, they will not be sufficient by themselves and coordinated public and private partnerships are vital as well. As we move forward, we also will need to better connect new findings to practical public health guidance. 26 The larger federal response is coordinated by the Interagency Autism Coordinating Committee (IACC) and has both federal and public members with a range of perspectives, including advocacy groups, researchers, and individuals affected by ASDs. It was established to coordinate ASD-related activities in the U.S. Department of Health and Human Services; facilitate the exchange of information on ASD activities among the member
27 agencies; and increase public understanding of the member agencies activities, programs, policies, and research by providing a public forum for discussions related to ASD research, screening, education, and interventions, In January 2009, the IACC approved the Strategic Plan for Autism Research ( The plan warns that autism is emerging as a national health emergency based on ADDM findings published in Ongoing surveillance using common methods provides important information when strategic plans such as this are being shaped. What Else Do I Need To Know? How can I tell if my child s development is on track? Children develop at their own pace, so it can be hard to tell exactly when a child will learn a particular skill. But, there are age-specific milestones designed to measure a child s development in the first few years of life. To learn more about developmental milestones, visit Learn the Signs. Act Early. ( ), a campaign by CDC and national partners to educate parents, health care professionals, and child care providers about early childhood development, including potential early warning signs of autism and other developmental disabilities. What should I do if I think my child might have an ASD? If you are concerned about your child s development, or think that your child might have an ASD, talk with your child s health care professional or teacher, or both. Your child s health care professional can refer your child to a developmental pediatrician or psychologist for a full developmental evaluation. (For tips on how to share your concerns with your health care professional, visit the First Signs website at Your child s teacher can ask the special education department of your local school district to do a psychoeducational evaluation of your child. What services are available for children with ASDs? The Individuals with Disabilities Education Act (IDEA) 21 is a law that ensures that all children with disabilities, from birth through 21 years of age, can get a free, appropriate public education that emphasizes special education and related services designed to meet their unique needs and prepare them for employment and independent living. IDEA also provides for evaluation of children who might have or be at risk for developmental disabilities. (For more information about IDEA, please visit Children 3 through 21 years of age can receive educational assessments and programs through public schools. Programs can include direct teaching by or consultation with a special education teacher or related services (such as speech and language therapy, occupational and physical therapy, and supportive counseling), or both. Infants and toddlers can receive assessments and programs through public health departments or other state agencies. IDEA requires that all children receiving services who are younger than 3 years of age should have an Individualized Family Service Plan (IFSP). Children receiving services who are 3 or older should have an Individualized Education Program (IEP). The IEP and IFSP provide a detailed plan to meet the unique and specific educational needs of each child. 27
28 What kinds of treatments or educational interventions can help children with ASDs? Currently, there is no cure for ASDs; however, research shows that early intervention treatment services can greatly improve a child s development. Therefore, it is important to talk to your child s health care provider as soon as possible if you think your child has an ASD or other developmental delay. According to reports by the American Academy of Pediatrics 22 and the National Research Council, 23 educational interventions that provide structure, direction, and organization for children are thought to help those with ASDs. Educational interventions must be tailored to each child and take into account his or her overall developmental status and specific strengths and needs. For guidance on choosing a treatment program, visit the Treatment Options section of the National Institute of Mental Health s autism website at publications/autism/complete-index.shtml. Can medication help children with ASDs? There are no medications that can cure ASDs or treat their core symptoms; however, there are medications that can help some people with related symptoms. For example, medication might help manage high energy levels, inability to focus, depression, or seizures. Also, the U.S. Food and Drug Administration has approved the use of risperidone and aripiprazole (antipsychotic drugs) to treat children with ASDs who have severe tantrums and aggression, and cause self-injury. Medications might not affect a child with an ASD in the same way they affect other children. It is important to work with a health care professional who has experience in treating children with ASDs. Parents and health care professionals must monitor closely a child s progress and reactions while he or she is taking a medication to be sure that the side effects of the treatment do not outweigh the benefits. To learn more about medications and ASDs, go to the National Institute of Mental Health s autism website at What can I do to keep my child with an ASD healthy? It is important to remember that children with ASDs can get sick or injured just like children without ASDs. Regular medical and dental examinations should be part of your child s intervention plan, as well as preventive measures such as routine childhood and yearly influenza vaccinations. Often, it is difficult to determine if a child s behavior is related to his or her ASD or is caused by a separate health condition. For instance, head banging could be a symptom of an ASD, or it could be a sign that the child is having headaches. In those instances, a thorough physical examination is needed. If you are concerned, act quickly. The sooner you get a diagnosis, the sooner you can start appropriate treatment and the better the progress your child can make. Although currently there is no cure for ASDs, most people believe that recognizing the signs of a developmental delay as early as possible and immediately seeking early intervention services right away can have the greatest effect on overall improvement. 28
29 Summary These data confirm that ASDs continue to be conditions of urgent public health concern affecting approximately 1% of children in the United States. ASDs affect an average of 1 in every 110 children: approximately 1 in 70 boys and 1 in 310 girls. These data also confirm that the prevalence of ASDs increased from 2002 to 2006 and support the continued monitoring of ASDs to document and understand changes in prevalence over time. ASDs are the second most common serious DD after ID, but are still less common than other conditions that affect children s development, such as speech and language delay, learning disabilities, and ADHD. The effect of having a DD is immense for the families affected and for the community services that provide intervention and support for these families. These prevalence estimates from the ADDM Network can be and have been used to inform policy and educational and intervention services for people with an ASD. CDC is actively engaged with other federal and private partners in a coordinated response to identify risk factors and meet the significant needs of the individuals and families affected by ASDs. 29
30 Where can I get more information? The resources that follow will help you learn more about ASDs and find services for children with ASDs and their families. Developmental Milestones and Warning Signs for Developmental Disabilities Learn the Signs. Act Early. Campaign This site can help you find out if your child s development is on track and learn the signs of developmental delays. General Information About Autism CDC Autism Information Center You can check out a full range of resources for parents, educators, researchers, and practitioners at this site. Also, learn what CDC is doing to better understand ASDs and their causes and risk factors. Autism Speaks This site will let you read about what autism is and how to cope with it. Also, it will assist you in learning about research and efforts to raise awareness about the disorder. American Academy of Pediatrics This site provides information for parents and providers alike. Services and Support for Children with ASDs Autism Society of America or AUTISM This national organization can link you with local resources. Click on the Chapters link to find an ASA chapter in your state. National Early Childhood Technical Assistance Center Use this site to find early intervention programs in your state. Easter Seals Search this site to find an Easter Seals near you and learn about services for people with ASDs. 30
31 Questions Often Asked by Parents About Special Education Services or At this site, get answers to your questions about services provided under the Individuals with Disabilities Education Act (also available en Español). Note: Your public school special education director also can help guide you with a referral to the local infant, toddler, or preschool assessment and intervention programs in your area. Diagnosis and Treatment of ASDs Educating Children with Autism This site provides a review of interventions for autism by the National Academy of Sciences. National Institute of Mental Health Find out about the process of diagnosing ASDs and about treatment options, including medications used to help people with ASDs, at this site. The Pediatrician s Role in the Diagnosis and Management of Autistic Spectrum Disorder in Children Learn about treatments and interventions physicians use to treat ASDs in this report from the American Academy of Pediatrics. Research Interagency Autism Coordinating Committee (IACC) Visit this site to learn about the IACC and to access the IACC approved Strategic Plan for Autism Research. This site is a searchable database that provides patients, family members, and the public with information about current, ongoing clinical research studies. The Autism Science Foundation (ASF) Visit this site to learn more about the ASF, which provides funding to scientists and organizations conducting, facilitating, and promoting autism research. National Institute of Neurological Disorders and Stroke (NINDS) At this site, read (in both English and Spanish) about research being done on autism. 31
32 References 1. Centers for Disease Control and Prevention. Prevalence of autism spectrum disorders Autism and Developmental Disabilities Monitoring Network, United States, MMWR Surveill Summ 2009;58 (NoSS-10). 2. Centers for Disease Control and Prevention. Prevalence of autism spectrum disorders Autism and Developmental Disabilities Monitoring Network, Six Sites, United States, MMWR Surveill Summ 2007;56(No.SS-1). 3. Centers for Disease Control and Prevention. Prevalence of autism spectrum disorders Autism and Developmental Disabilities Monitoring Network, 14 Sites, United States, MMWR Surveill Summ 2007;56(No.SS-1). 4. IDEA Part B Child Count (2007). Individuals with Disabilities Education Improvement Act (IDEA) Data Site. [Cited 2009 Aug]. Available at: 5. Kanner L. Autistic disturbances of affective contact. Nervous Child. 1943;2: Lotter V. Epidemiology of autistic conditions in young children. Some characteristics of the parents and children. Soc Psychiatry. 1966;1: American Psychiatric Association. Diagnostic and statistical manual of mental disorders, 3rd ed. Washington (DC): APA; American Psychiatric Association. Diagnostic and statistical manual of mental disorders, 4th ed, text revision. Washington (DC): APA; Fombonne E. Epidemiologic surveys of autism and other pervasive developmental disorders: an update. J Autism Dev Disord. 2003;33(4): Rutter M. Incidence of autism spectrum disorders: changes over time and their meaning. Acta Paediatr. 2005;94: Yeargin-Allsopp M, Rice C, Karapurkar T, Doernberg N, Boyle C, Murphy C. Prevalence of autism in a US metropolitan area. JAMA. 2003;289: American Academy of Pediatrics, The National Center of Medical Home Initiatives for Children with Special Needs. Autism A.L.A.R.M. [cited 2009 Aug.]. Available from: Autism%20downloads/AutismAlarm.pdf. 13. Kogan MD, Strickland BB, Blumberg SJ, Singh GK, Perrin JM, van Dyck PC. A national profile of the health care experiences and family impact of autism spectrum disorder among children in the United States, Pediatrics Dec;122(6):e Shimabukuro TT, Grosse SD, Rice C. Medical Expenditures for Children with an Autism Spectrum Disorder in a Privately Insured Population. J Autism Devl Disord. 2008;38:
33 15. Ganz, M.L. The costs of autism. In: Moldin SO, Rubenstein JLR. Understanding autism: from basic neuroscience to treatment (1st ed). Boca Raton (FL): CRC Press; 2006: Boyle CA, Decoufle P, Yeargin-Allsopp M. Prevalence and health impact of developmental disabilities in US children. Pediatrics. 1994;93: Besser LM, Shin M, Kucik JE, Correa A. Prevalence of Down syndrome among children and adolescents in Atlanta. Birth Defects Res Part A Clin Mol Teratol. 2007;79: Boulet SL, Boyle CA, Schieve L. Health care use and health and functional impact of developmental disabilities among U.S children, Arch Pediatr Adolesc Med. 2009;163: National Center for Chronic Disease Prevention and Health Promotion. National Diabetes Fact Sheet. [cited 2006 Nov]. Available at: Gloeker Ries LA, Percy CL, Bunin GR. Cancer incidence and survival among children and adolescents: United States SEER Program National Cancer Institute. [cited 2005 Jan 21]. Available at: seer.cancer.gov/publications/childhood. 21. Individuals with Disabilities Education Act. Pub. L. No Dec. 3, 2004, H.R [cited 2006 Nov]. Available at: laws&docid=f:publ American Academy of Pediatrics. Technical report: the pediatrician s role in the diagnosis and management of autistic spectrum disorder in children [online article]. Pediatrics. 2001;107:e85. [cited 2006 Nov]. Available at: Committee on Educational Interventions for Children with Autism, National Research Council. Educating Children with Autism. Washington (DC): National Academies Press; [cited 2006 Nov]. Available at: 33


34

35
Autism Activities at CDC: The Public Health Model
 Autism Activities at CDC: The Public Health Model Act Early Region II Summit Bronx, NY March 26, 2009 Marshalyn Yeargin-Allsopp, MD Georgina Peacock, MD, MPH National Center on Birth Defects and Developmental
Georgina Peacock, MD, MPH
 Autism Activities at CDC Act Early Region IX Summit Sacramento, CA June 8, 2009 Georgina Peacock, MD, MPH National Center on Birth Defects and Developmental Disabilities Autism Activities at CDC Surveillance/Monitoring
CDC activities with Autism Spectrum Disorders
 CDC activities with Autism Spectrum Disorders Georgina Peacock, MD, MPH Centers for Disease Control and Prevention National Center on Birth Defects and Developmental Disabilities The findings and conclusions
2012 Asthma Summit Greenville SC, Aug. 9, 2012
 Burden of In South Carolina 2012 Asthma Summit Greenville SC, Aug. 9, 2012 Khosrow Heidari, M.A., M.S., M.S. State Chronic Disease Epidemiologist Director of Chronic Disease Epidemiology & Evaluation,
CDC activities Autism Spectrum Disorders
 CDC activities Autism Spectrum Disorders Georgina Peacock, MD, MPH Centers for Disease Control and Prevention National Center on Birth Defects and Developmental Disabilities The findings and conclusions
2012 Medicaid and Partnership Chart
 2012 Medicaid and Chart or Alabama $525,000.00 $4,800.00 Minimum: 25,000.00 Alaska $525,000.00 Depends on area of state; Minimum: $113,640 $10,000 in Anchorage $1,656 Minimum:$1838.75 Maximum:$2,841 Minimum:
Prevalence of Self-Reported Obesity Among U.S. Adults by State and Territory. Definitions Obesity: Body Mass Index (BMI) of 30 or higher.
 of 30 or higher.") Prevalence of Self-Reported Obesity Among U.S. Adults by State and Territory Definitions Obesity: Body Mass Index (BMI) of 30 or higher. Body Mass Index (BMI): A measure of an adult s weight in relation
Prevalence of Self-Reported Obesity Among U.S. Adults by State and Territory Definitions Obesity: Body Mass Index (BMI) of 30 or higher. Body Mass Index (BMI): A measure of an adult s weight in relation
Obesity Trends:
 Obesity Trends: 1985-2014 Compiled by the Centers for Disease Control and Prevention Retrieved from http://www.cdc.gov/obesity/data/prevalencemaps.html Organized into two groupings due to methodological
ACEP National H1N1 Preparedness Survey Results
 1) On a scale from 1 to 10 (10 being totally prepared and 1 being totally unprepared), do you think your hospital is prepared to manage a surge of H1N1 flu patients this fall and winter? (totally prepared)
National Deaf Center on Postsecondary Outcomes. Data Interpretation Guide for State Reports: FAQ
 National Deaf Center on Postsecondary Outcomes Data Interpretation Guide for State Reports: FAQ This document was developed under a grant from the U.S. Department of Education, OSEP #HD326D160001. However,
The 2004 National Child Count of Children and Youth who are Deaf-Blind
 The 2004 National Child Count of Children and Youth who are Deaf-Blind NTAC The Teaching Research Institute Western Oregon University The Helen Keller National Center Sands Point, New York The National
2018 HPV Legislative Report Card
 2018 HPV Legislative Report Card This report card is a snapshot of each state s documented efforts to enact or introduce HPV vaccine legislation to improve education and awareness, or provide access to
Prevalence of Autism Spectrum Disorders --- Autism and Developmental Disabilities Monitoring Network, United States, 2006
 Surveillance Summaries December 18, 2009 / 58(SS10);1-20 Prevalence of Autism Spectrum Disorders --- Autism and Developmental Disabilities Monitoring Network, United States, 2006 Autism and Developmental
How Many Children have an Autism Spectrum Disorder?
 How Many Children have an Autism Spectrum Disorder? Cathy Rice, Ph.D. National Center on Birth Defects and Developmental Disabilities Centers for Disease Control and Prevention The findings and conclusions
HIV/AIDS and other Sexually Transmitted Diseases (STDs) in the Southern Region of the United States: Epidemiological Overview
 in the Southern Region of the United States: Epidemiological Overview") HIV/AIDS and other Sexually Transmitted Diseases (STDs) in the Southern Region of the United States: Epidemiological Overview Prepared by The Henry J. Kaiser Family Foundation for Southern States Summit
HIV/AIDS and other Sexually Transmitted Diseases (STDs) in the Southern Region of the United States: Epidemiological Overview Prepared by The Henry J. Kaiser Family Foundation for Southern States Summit
Using Policy, Programs, and Partnerships to Stamp Out Breast and Cervical Cancers
 Using Policy, Programs, and Partnerships to Stamp Out Breast and Cervical Cancers National Conference of State Legislatures Annual Meeting J August 2006 Christy Schmidt Senior Director of Policy National
Percent of U.S. State Populations Covered by 100% Smokefree Air Laws April 1, 2018
 Defending your right to breathe smokefree air since 1976 Percent U.S. State Populations Covered by 100% Smokefree Air April 1, 2018 This table lists the percent each state s population covered by air laws
STATE RANKINGS REPORT NOVEMBER mississippi tobacco data
 STATE RANKINGS REPORT NOVEMBER 2017 mississippi tobacco data METHODS information about the data sources the youth risk behavior surveillance system The Youth Risk Behavior Surveillance System (YRBSS)
Cirrhosis and Liver Cancer Mortality in the United States : An Observational Study Supplementary Material
 Cirrhosis and Liver Cancer Mortality in the United States 1999-2016: An Observational Study Supplementary Material Elliot B. Tapper MD (1,2) and Neehar D Parikh MD MS (1,2) 1. Division of Gastroenterology
2003 National Immunization Survey Public-Use Data File
 SECTION 1. ID, WEIGHT AND FLAG VARIABLES Section 1 Variable Name SEQNUMC Label UNIQUE CHILD IDENTIFIER Frequency of Missing/Non-missing Values All Data 30930 21310 NON-MISSING CHARACTER STRING 000011 MINIMUM
DISCLAIMER: ECHO Nevada emphasizes patient privacy and asks participants to not share ANY Protected Health Information during ECHO clinics.
 DISCLAIMER: Video will be taken at this clinic and potentially used in Project ECHO promotional materials. By attending this clinic, you consent to have your photo taken and allow Project ECHO to use this
Environmental Epidemiology: Centers for Autism and Developmental Disabilities Research and Epidemiology (CADDRE)
") Environmental Epidemiology: Centers for Autism and Developmental Disabilities Research and Epidemiology (CADDRE) Autism and the Environment: Challenges and Opportunities for Research A Workshop April 18-19,
Environmental Epidemiology: Centers for Autism and Developmental Disabilities Research and Epidemiology (CADDRE) Autism and the Environment: Challenges and Opportunities for Research A Workshop April 18-19,
Chapter Two Incidence & prevalence
 Chapter Two Incidence & prevalence Science is the observation of things possible, whether present or past. Prescience is the knowledge of things which may come to pass, though but slowly. LEONARDO da Vinci
Responses to a 2017 Survey on State Policies Regarding Community Health Workers: Home Visiting to Improve the Home Environment
 Responses to a 2017 Survey on State Policies Regarding Community Health Workers: Home Visiting to Improve the Home Environment The National Academy for State Health Policy (NASHP), with support from the
Peer Specialist Workforce. State-by-state information on key indicators, and links to each state s peer certification program web site.
 Peer Specialist Workforce State-by-state information on key indicators, and links to each state s peer certification program web site. Alabama Peer support not Medicaid-reimbursable 204 peer specialists
HIV and AIDS in the United States
 HIV and AIDS in the United States A Picture of Today s Epidemic More than 20 years into the AIDS epidemic, HIV continues to exact a tremendous toll in the United States. Recent data indicate that African
April 25, Edward Donnell Ivy, MD, MPH
 HRSA Hemoglobinopathies Programs: Sickle Cell Disease Newborn Screening Follow-Up Program(SCDNBSP) and Sickle Cell Disease Treatment Demonstration Regional Collaboratives Program (SCDTDP) April 25, 2017
NCDB The National Center on Deaf-Blindness
 The 2016 National Child Count of Children and Youth who are Deaf-Blind NCDB The National Center on Deaf-Blindness October 2017 Table of Contents The 2016 National Child Count of Children and Youth who
Trends in COPD (Chronic Bronchitis and Emphysema): Morbidity and Mortality. Please note, this report is designed for double-sided printing
: Morbidity and Mortality. Please note, this report is designed for double-sided printing") Trends in COPD (Chronic Bronchitis and Emphysema): Morbidity and Mortality Please note, this report is designed for double-sided printing American Lung Association Epidemiology and Statistics Unit Research
Trends in COPD (Chronic Bronchitis and Emphysema): Morbidity and Mortality Please note, this report is designed for double-sided printing American Lung Association Epidemiology and Statistics Unit Research
MAKING WAVES WITH STATE WATER POLICIES. Washington State Department of Health
 MAKING WAVES WITH STATE WATER POLICIES Washington State Department of Health Lead poisoning is a public health problem. Health Effects of Lead Lead Exposures and Pathways HOME Paint Lead pipes Lead solder
Prevalence of Autism Spectrum Disorders Autism and Developmental Disabilities Monitoring Network, United States, 2006
 Morbidity and Mortality Weekly Report www.cdc.gov/mmwr Surveillance Summaries December 18, 2009 / Vol. 58 / No. SS-10 Prevalence of Autism Spectrum Disorders Autism and Developmental Disabilities Monitoring
Medical Advisory Board. reviews medical issues for licensure regarding individual drivers. medical conditions. not specified. reporting encouraged,
 State Reporting Regulations for Physicians Adapted from the Physician s Guide to Assessing and Counseling Older Drivers 44 and Madd.org 45 State Physician/Medical Reporting (NOTE MERGED CELLS) Mandatory,
B&T Format. New Measures. Better health care. Better choices. Better health.
 1100 13th Street NW, Third Floor Washington, DC 20005 phone 202.955.3500 fax 202.955.3599 www.ncqa.org TO: Interested Organizations FROM: Patrick Dahill, Assistant Vice President, Policy DATE: August 13,
B&T Format. New Measures. Better health care. Better choices. Better health.
 1100 13th Street NW, Third Floor Washington, DC 20005 phone 202.955.3500 fax 202.955.3599 www.ncqa.org TO: Interested Organizations FROM: Patrick Dahill, Assistant Vice President, Policy DATE: February
Autism Case Training: Web-based Continuing Education Course. October 24, 2012
 Autism Case Training: Web-based Continuing Education Course October 24, 2012 Introduction Webinar Overview Presentation Walter Jenner, MS, CAS: Act Early Ambassador, Education and Outreach Officer for
Geographical Accuracy of Cell Phone Samples and the Effect on Telephone Survey Bias, Variance, and Cost
 Geographical Accuracy of Cell Phone Samples and the Effect on Telephone Survey Bias, Variance, and Cost Abstract Benjamin Skalland, NORC at the University of Chicago Meena Khare, National Center for Health
Michigan Nutrition Network Outcomes: Balance caloric intake from food and beverages with caloric expenditure.
 DRAFT 1 Obesity and Heart Disease: Fact or Government Conspiracy? Grade Level: High School Grades 11 12 Subject Area: Mathematics (Statistics) Setting: Classroom and/or Computer Lab Instructional Time:
NCQA did not add new measures to Accreditation 2017 scoring.
 2017 Accreditation Benchmarks and Thresholds 1 TO: Interested Organizations FROM: Patrick Dahill, Assistant Vice President, Policy DATE: August 2, 2017 RE: 2017 Accreditation Benchmarks and Thresholds
Average Number Citations per Recertification Survey
 10 Average Citations per Recertification Survey 201 201 2017 1Q 8 7.7 7.3 3 3.3 3..2 2 1 0..80.2.0.8.70.8.17.8.1 7.3 SRO SERO NERO NRO WRO WI 1 Source: WI DQA, March 31, 2017 3% Percentage of Recertification
Perinatal Health in the Rural United States, 2005
 Perinatal Health in the Rural United States, 2005 Policy Brief Series #138: LOW BIRTH WEIGHT RATES IN THE RURAL UNITED STATES, 2005 #139: LOW BIRTH WEIGHT RATES AMONG RACIAL AND ETHNIC GROUPS IN THE RURAL
Forensic Patients in State Hospitals:
 Forensic Patients in State Hospitals: 1999-2016 Vera Hollen, M.A. Senior Director of Research & Consulting Director, Mental Health/Criminal Justice Research Center National Association of State Mental
B&T Format. New Measures. 2 CAHPS is a registered trademark of the Agency for Healthcare Research and Quality (AHRQ).
.") TO: Interested Organizations FROM: Patrick Dahill, Assistant Vice President, Policy DATE: February 4, 2018 RE: 2018 Accreditation Benchmarks and Thresholds This document reports national benchmarks and
TO: Interested Organizations FROM: Patrick Dahill, Assistant Vice President, Policy DATE: February 4, 2018 RE: 2018 Accreditation Benchmarks and Thresholds This document reports national benchmarks and
States with Authority to Require Nonresident Pharmacies to Report to PMP
 States with Authority to Require Nonresident Pharmacies to Report to PMP Research current through May 2016. This project was supported by Grant No. G1599ONDCP03A, awarded by the Office of National Drug
The Rural Health Workforce. Policy Brief Series. Data and Issues for Policymakers in: Washington Wyoming Alaska Montana Idaho
 The Rural Health Workforce Data and Issues for Policymakers in: Washington Wyoming Alaska Montana Idaho Policy Brief Series ISSUE #1: THE RURAL HEALTH WORKFORCE: CHALLENGES AND OPPORTUNITIES ISSUE #2:
The FASD Regional Training Centers: What do they offer and what can they do for you?
 The FASD Regional Training Centers: What do they offer and what can they do for you? Elizabeth P. Dang, MPH Behavioral Scientist, FAS Prevention Team Prevention Research Branch, DBDDD, NCBDDD NBDPN 14
Exhibit 1. Change in State Health System Performance by Indicator
 Exhibit 1. Change in State Health System Performance by Indicator Indicator (arranged by number of states with improvement within dimension) Access and Affordability 0 Children ages 0 18 uninsured At-risk
Autism Spectrum Disorder (ASD) Surveillance Year 2010 Findings
 Surveillance Year 2010 Findings") Arkansas Autism and Developmental Disabilities Monitoring (AR ADDM) Program Autism Spectrum Disorder (ASD) Surveillance Year 2010 Findings & Comparison with Arkansas 2002 Baseline Prevalence Study Eldon
Arkansas Autism and Developmental Disabilities Monitoring (AR ADDM) Program Autism Spectrum Disorder (ASD) Surveillance Year 2010 Findings & Comparison with Arkansas 2002 Baseline Prevalence Study Eldon
Training for Professionals to Work with Children with Autism
 Training for Professionals to Work with Children with Autism Jenna Miller, M.A. Superheroes social skills training, Rethink Autism internet interventions, parent training, EBP classroom training, functional
AAll s well that ends well; still the fine s the crown; Whate er the course, the end is the renown. WILLIAM SHAKESPEARE, All s Well That Ends Well
 AAll s well that ends well; still the fine s the crown; Whate er the course, the end is the renown. WILLIAM SHAKESPEARE, All s Well That Ends Well mthree TrEATMENT MODALITIES 7 ž 21 ATLAS OF ESRD IN THE
MetLife Foundation Alzheimer's Survey: What America Thinks
 MetLife Foundation Alzheimer's Survey: What America Thinks May 11, 2006 Conducted by: Harris Interactive 2005, Harris Interactive Inc. All rights reserved. Table of Contents Background and Objectives...
Peer Specialist Workforce. State-by-state information on key indicators, and links to each state s peer certification program web site.
 Peer Specialist Workforce State-by-state information on key indicators, and links to each state s peer certification program web site. Alabama Peer support not Medicaid-reimbursable 204 peer specialists
The Chiropractic Pediatric CE Credit Program with Emphasis on Autism
 The Chiropractic Pediatric CE Credit Program with Emphasis on May 24-26, 2018- Lombard, IL The seminar meets all standards or is approved for 24 HOURS of Continuing Education credit in the following states
Health Care Reform: Colorectal Cancer Screening Expansion, Before and After the Affordable Care Act (ACA)
") University of Arkansas for Medical Sciences From the SelectedWorks of Michael Preston April 9, 2014 Health Care Reform: Colorectal Cancer Screening Expansion, Before and After the Affordable Care Act (ACA)
University of Arkansas for Medical Sciences From the SelectedWorks of Michael Preston April 9, 2014 Health Care Reform: Colorectal Cancer Screening Expansion, Before and After the Affordable Care Act (ACA)
HIV in Prisons,
 U.S. Department of Justice Office of Justice Programs Bureau of Justice Statistics Bureau of Justice Statistics BULLETIN HIV in Prisons, 2007-08 Laura M. Maruschak BJS Statistician Randy Beavers, BJS Intern
Health Care Reform: Colorectal Cancer Screening Disparities, Before and After the Affordable Care Act (ACA)
") University of Arkansas for Medical Sciences From the SelectedWorks of Michael Preston June 7, 2014 Health Care Reform: Colorectal Cancer Screening Disparities, Before and After the Affordable Care Act
University of Arkansas for Medical Sciences From the SelectedWorks of Michael Preston June 7, 2014 Health Care Reform: Colorectal Cancer Screening Disparities, Before and After the Affordable Care Act
West Nile virus and other arboviral activity -- United States, 2013 Provisional data reported to ArboNET Tuesday, January 7, 2014
 West Nile virus and other arboviral activity -- United States, 2013 reported to ArboNET Tuesday, This update from the CDC Arboviral Diseases Branch includes provisional data reported to ArboNET for January
Opioid Deaths Quadruple Since 1999
 THE COUNCIL OF STATE GOVERNMENTS CAPITOL RESEARCH AUGUST 2017 HEALTH POLICY Opioid Deaths Quadruple Since 1999 Since 1999, the number of overdose deaths involving opioids (including prescription opioids
It's tick time again! Recognizing black-legged (deer ticks) and measuring the spread of Lyme disease
 and measuring the spread of Lyme disease") It's tick time again! Recognizing black-legged (deer ticks) and measuring the spread of Lyme disease Actual sizes: These guys below (Ixodes scapularis) spread Lyme and other tick born diseases. Ixodes
It's tick time again! Recognizing black-legged (deer ticks) and measuring the spread of Lyme disease Actual sizes: These guys below (Ixodes scapularis) spread Lyme and other tick born diseases. Ixodes
An Unhealthy America: The Economic Burden of Chronic Disease Charting a New Course to Save Lives and Increase Productivity and Economic Growth
 An Unhealthy America: The Economic Burden of Chronic Disease Charting a New Course to Save Lives and Increase Productivity and Economic Growth Ross DeVol Director, Center for Health Economics Director,
NM Coalition of Sexual Assault Programs, Inc.
 NM Coalition of Sexual Assault Programs, Inc. PREVALENCE OF SEXUAL VIOLENCE AMONG WOMEN IN NEW MEXICO: A SUMMARY OF THE FINDINGS FROM THE NATIONAL INTIMATE PARTNER AND SEXUAL VIOLENCE SURVEY 2010 2012
Analysis of State Medicaid Agency Performance in Relation to Incentivizing the Provision of H1N1 Immunizations to Eligible Populations
 Analysis of State Medicaid Agency Performance in Relation to Incentivizing the Provision of H1N1 Immunizations to Eligible Populations Nancy Lopez, JD, MPH, Ross Margulies, JD/MPH [Cand.], and Sara Rosenbaum,
Trends in Lung Cancer Morbidity and Mortality
 Trends in Lung Cancer Morbidity and Mortality American Lung Association Epidemiology and Statistics Unit Research and Program Services Division November 2014 Table of Contents Trends in Lung Cancer Morbidity
HIV in Prisons, 2000
 U.S Department of Justice Office of Justice Programs Bureau of Justice Statistics Bulletin October, NCJ HIV in Prisons, By Laura M. Maruschak BJS Statistician On December,,.% of State prison inmates, and.%
Autism and Transition to Adulthood. Lorri Unumb, Esq. Vice President State Government Affairs Autism Speaks
 Autism and Transition to Adulthood Lorri Unumb, Esq. Vice President State Government Affairs Autism Speaks Science Awareness Family Services Advocacy Autism and the Law Cases, Statutes, and Materials
Vocational Rehabilitation Funding for a Power Wheelchair with Power Adjustable Seat Height:
 Vocational Rehabilitation Funding for a Power Wheelchair with Power Adjustable Seat Height: The Americans with Disabilities Act (ADA) was signed into law on July 26, 1990. It is a wide-ranging law intended
The 2010 National Child Count of Children and Youth who are Deaf-Blind
 The 2010 National Child Count of Children and Youth who are Deaf-Blind NCDB The National Consortium on Deaf-Blindness The Teaching Research Institute Western Oregon University The Helen Keller National
Medical Marijuana Responsible for Traffic Fatalities Alfred Crancer, B.S., M.A.; Phillip Drum, Pharm.D.
 Medical Marijuana Responsible for Traffic Fatalities Alfred Crancer, B.S., M.A.; Phillip Drum, Pharm.D. Abstract In California, where only 25% of the drivers in fatal crashes are tested for drugs, 252
Act Against AIDS Healthy Communities Program Partnering and Communicating Together (PACT) to Act Against AIDS
 to Act Against AIDS") Act Against AIDS Healthy Communities Program Partnering and Communicating Together (PACT) to Act Against AIDS Dear LULAC Council: We are thrilled to announce our partnership with the Act Against AIDS campaign
Act Against AIDS Healthy Communities Program Partnering and Communicating Together (PACT) to Act Against AIDS Dear LULAC Council: We are thrilled to announce our partnership with the Act Against AIDS campaign
National, State, and Local Area Vaccination Coverage among Adolescents Aged Years United States, 2009
 National, State, and Local Area Vaccination Coverage among Adolescents Aged 13 17 Years United States, 2009 The Advisory Committee for Immunization Practices (ACIP) recommends that adolescents routinely
ROAD SAFETY MONITOR. ALCOHOL-IMPAIRED DRIVING IN THE UNITED STATES Results from the 2017 TIRF USA Road Safety Monitor
 Background What is the context of alcohol-impaired driving in the U.S.? According to the National Highway Traffic Safety Administration (NHTSA), alcohol-impaired driving fatalities involving a driver with
Hawai i to Zero. Timothy McCormick Harm Reduction Services Branch Hawai i Department of Health. January 16, 2018
 HIV Prevention Efforts in Hawai i Hawai i to Zero Timothy McCormick Harm Reduction Services Branch Hawai i Department of Health January 16, 2018 People living with HIV who take HIV medicine as prescribed
DEPARTMENT OF DEFENSE (AFHSB)
") In NORTHCOM during week 48 Influenza activity continued to increase during week 48 and ranged from minimal to high, depending on the state. The percentage of outpatient visits due to ILI continued to increase
In NORTHCOM during week 48 Influenza activity continued to increase during week 48 and ranged from minimal to high, depending on the state. The percentage of outpatient visits due to ILI continued to increase
ARE STATES DELIVERING?
 The Promise of Quality, Affordable Health Care for Women ARE STATES DELIVERING? A 50-State Report Card on Women s Health OCTOBER 2014 TAKING ACTION, MAKING CHANGE The Alliance for a Just Society s mission
If you suspect Fido's owner is diverting prescription pain meds meant for the pet, checking your state's drug monitoring database may not help
 Prescriptions If you suspect Fido's owner is diverting prescription pain meds meant for the pet, checking your state's drug monitoring database may not help by Ann M. Philbrick, PharmD, BCPS The Centers
KEY FACTS LATINOS AND HIV/AIDS
 KEY FACTS November 2001 LATINOS AND HIV/AIDS Latinos and HIV/AIDS November 2001 List of Figures Figure 1. Distribution of People Living with AIDS, by Race/Ethnicity, 1999 Figure 2. New and Cumulative AIDS
The Availability and Use of Publicly Funded Family Planning Clinics: U.S. Trends,
 The Availability and Use of Publicly Funded Family Planning Clinics: U.S. Trends, 1994 2001 By Jennifer J. Frost, Lori Frohwirth and Alison Purcell Jennifer J. Frost is senior research associate, Lori
Radiation Therapy Staffing and Workplace Survey 2016
 Radiation Therapy Staffing and Workplace Survey 2016 2016 ASRT. All rights reserved. Reproduction in any form is forbidden without written permission from publisher. TABLE OF CONTENTS Executive Summary...
This report was developed with support from the following CDC offices: National Center for Chronic Disease Prevention and Health Promotion
 This report summarizes selected data on child health and nutrition indicators received from states, U.S. territories, and Indian Tribal Organizations that contributed to the Centers for Disease Control
West Nile virus and other arboviral activity -- United States, 2016 Provisional data reported to ArboNET Tuesday, October 11, 2016
 West Nile virus and other arboviral activity -- United States, 2016 Provisional data reported to ArboNET Tuesday, October 11, 2016 This update from the CDC Arboviral Disease Branch includes provisional
American Association of Suicidology. Statistics AAS. Statistics. National Statistical Information FMHI. American Association of Suicidology (AAS)
") American Association of Suicidology Statistics AAS Statistics S National Statistical Information The following pages of statistical informartion are provided with permission from the web site of the American
American Association of Suicidology Statistics AAS Statistics S National Statistical Information The following pages of statistical informartion are provided with permission from the web site of the American
Act Early Initiative: Federal and State Collaboration for Improving Early Identification of Autism Spectrum Disorders and other Developmental
 Act Early Initiative: Federal and State Collaboration for Improving Early Identification of Autism Spectrum Disorders and other Developmental Disabilities CDC s Learn the Signs. Act Early. Katie K. Green,
Instant Drug Testing State Law Guide
 Instant Drug Testing State Law Guide State Alabama Alaska Arizona POCT / Instant Testing Status Comment outside this voluntary law but not by companies that wish to qualify for the WC discount. FDA-cleared
Quarterly Hogs and Pigs
 Quarterly Hogs and Pigs ISSN: 9- Released December 22,, by the National Agricultural Statistics Service (NASS), Agricultural Statistics Board, United s Department of Agriculture (USDA). United s Hog Inventory
The Healthy Indiana Plan
 The Healthy Indiana Plan House Enrolled Act 1678 A Pragmatic Approach Governor Mitch Daniels July 16, 2007 Indiana s Fiscal Health is Good First Back-to-Back Balanced Budget in Eight Years $1,000.0 Revenue
Women s health status is one of the strongest determinants of how women use the health care system. The
 Women s health status is one of the strongest determinants of how women use the health care system. The poorer their health, the more women need and benefit from high-quality, appropriate care. Overall,
Medicaid represents an important
 How States Use Medicaid to Fund Community-Based Services to Children With Autism Spectrum Disorders Rafael M. Semansky, M.P.P., Ph.D. Ming Xie, M.S. Lindsay J. Lawer, M.S. David S. Mandell, Sc.D. Objective:
What Do We Know: Autism Screening and Diagnosis and Supporting Families of Young Children
 What Do We Know: Autism Screening and Diagnosis and Supporting Families of Young Children militaryfamilieslearningnetwork.org/event/30358/ This material is based upon work supported by the National Institute
Lessons from Population-Based Surveillance for ASD
 Lessons from Population-Based Surveillance for ASD Marshalyn Yeargin-Allsopp, MD Medical Epidemiologist Developmental Disabilities Branch National Center on Birth Defects and Developmental Disabilities
Cessation and Cessation Measures
 Cessation and Cessation Measures among Adult Daily Smokers: National and State-Specific Data David M. Burns, Christy M. Anderson, Michael Johnson, Jacqueline M. Major, Lois Biener, Jerry Vaughn, Thomas
DEPARTMENT OF DEFENSE (AFHSB)
") DEPARTMENT OF DEFENSE (AFHSB) Seasonal Influenza Surveillance Summary Northern Command -- Week 45 (03 November 10 November 2018) In NORTHCOM during week 45 Influenza activity was minimal to low for most
DEPARTMENT OF DEFENSE (AFHSB) Seasonal Influenza Surveillance Summary Northern Command -- Week 45 (03 November 10 November 2018) In NORTHCOM during week 45 Influenza activity was minimal to low for most
Plan Details and Rates. Monthly Premium Rate Schedule
 Basis of Reimbursement Plan Details and Rates MetLife Option 1 (Low) MetLife Option 2 (High) In-Network Out-of-Network In-Network Out-of-Network 70th percentile 70th percentile of Negotiated Negotiated
Quarterly Hogs and Pigs
 Quarterly Hogs and Pigs ISSN: 9- Released December 23,, by the National Agricultural Statistics Service (NASS), Agricultural Statistics Board, United s Department of Agriculture (USDA). United s Hog Inventory
DEPARTMENT OF DEFENSE (AFHSB)
") DEPARTMENT OF DEFENSE (AFHSB) Seasonal Influenza Surveillance Summary Northern Command -- Week 42 (14 October 20 October 2018) In NORTHCOM during week 42 Influenza activity was minimal to low for NORTHCOM,
DEPARTMENT OF DEFENSE (AFHSB) Seasonal Influenza Surveillance Summary Northern Command -- Week 42 (14 October 20 October 2018) In NORTHCOM during week 42 Influenza activity was minimal to low for NORTHCOM,
DEPARTMENT OF DEFENSE (AFHSB) Seasonal Influenza Surveillance Summary Northern Command -- Week 17 (22 Apr 28 Apr 2018)
 Seasonal Influenza Surveillance Summary Northern Command -- Week 17 (22 Apr 28 Apr 2018)") DEPARTMENT OF DEFENSE (AFHSB) Seasonal Influenza Surveillance Summary Northern Command -- Week 17 (22 Apr 28 Apr 2018) In NORTHCOM during week 17 Influenza activity continued to be minimal for the majority
DEPARTMENT OF DEFENSE (AFHSB) Seasonal Influenza Surveillance Summary Northern Command -- Week 17 (22 Apr 28 Apr 2018) In NORTHCOM during week 17 Influenza activity continued to be minimal for the majority
DEPARTMENT OF DEFENSE (AFHSB)
") DEPARTMENT OF DEFENSE (AFHSB) Seasonal Influenza Surveillance Summary Northern Command -- Week 13 (04 Mar 07 Apr 2018) In NORTHCOM during week 13 Influenza activity was minimal to low for the majority
DEPARTMENT OF DEFENSE (AFHSB) Seasonal Influenza Surveillance Summary Northern Command -- Week 13 (04 Mar 07 Apr 2018) In NORTHCOM during week 13 Influenza activity was minimal to low for the majority
Overview of the States Pesticide Registration Process AAPCO Laboratory Committee
 Overview of the States Pesticide Registration Process AAPCO Laboratory Committee Feb 16 th, 2011 Ana Cristina Rodriguez Manager, State Registration/Regulatory Affairs DuPont Crop Protection March 6, 2017
September 20, Thomas Scully Administrator Centers for Medicare and Medicaid Services 200 Independence Avenue SW Washington, DC 20201
 September 20, 2001 Thomas Scully Administrator Centers for Medicare and Medicaid Services 200 Independence Avenue SW Washington, DC 20201 Dear Mr. Scully: The medical organizations listed below would like
DEPARTMENT OF DEFENSE (AFHSB)
") DEPARTMENT OF DEFENSE (AFHSB) Seasonal Influenza Surveillance Summary Northern Command -- Week 16 (15 Apr 21 Apr 2018) In NORTHCOM during week 16 Influenza activity continued to be minimal for the majority
DEPARTMENT OF DEFENSE (AFHSB) Seasonal Influenza Surveillance Summary Northern Command -- Week 16 (15 Apr 21 Apr 2018) In NORTHCOM during week 16 Influenza activity continued to be minimal for the majority
Autism Spectrum Disorders: Findings from CDC s Latest Prevalence Report
 Autism Spectrum Disorders: Findings from CDC s Latest Prevalence Report Jon Baio, Ed.S. Epidemiologist National Center on Birth Defects and Developmental Disabilities Centers for Disease Control and Prevention