DECIPHERING X-CHROMOSOME INACTIVATION AND THE ROLE OF MECP2E1 IN RETT SYNDROME PATIENT INDUCED PLURIPOTENT STEM CELLS
|
|
|
- Daisy Harrell
- 5 years ago
- Views:
Transcription
1 DECIPHERING X-CHROMOSOME INACTIVATION AND THE ROLE OF MECP2E1 IN RETT SYNDROME PATIENT INDUCED PLURIPOTENT STEM CELLS by Aaron Y. L. Cheung A thesis submitted in conformity with the requirements for the degree of Doctorate of Philosophy Graduate Department of Molecular Genetics University of Toronto Copyright by Aaron Y. L. Cheung 2013
2 Deciphering X-chromosome inactivation and the role of MECP2e1 in Rett Syndrome patient induced pluripotent stem cells Aaron Y. L. Cheung Doctorate of Philosophy Graduate Department of Molecular Genetics University of Toronto 2013 Abstract Rett Syndrome (RTT) is a neurodevelopmental disorder that affects girls due primarily to heterozygous mutations in the gene encoding methyl-cpg binding protein 2 (MECP2). MECP2 encodes four exons that are alternatively spliced into two isoforms, MECP2e1 and MECP2e2. MECP2 isoform-specific functions are unknown, but due to the higher abundance in the brain and MECP2e1-specific mutations associated with RTT, MECP2e1 is hypothesized to be the functional isoform in the brain. MECP2 is an X-linked gene subject to random X- chromosome inactivation (XCI) resulting in mosaic expression of mutant MECP2. The lack of readily accessible human brain tissue motivates the need for alternative human cellular models to study RTT. In this thesis, I established a novel human in vitro model of RTT by isolating human induced Pluripotent Stem cells (hipscs) from RTT patient fibroblasts. RTT-hiPSCs retained the MECP2 mutation, are pluripotent and fully reprogrammed, and retained an inactive X-chromosome in a nonrandom pattern. Taking advantage of the latter characteristic, I obtained a pair of isogenic wild-type and mutant MECP2 expressing RTT-hiPSC lines that retained this MECP2 expression pattern upon differentiation into neurons. Phenotypic analysis of mutant RTT-hiPSC-derived neurons demonstrated a reduction in soma size compared with the isogenic control RTT-hiPSC-derived neurons from the same RTT patient validating RTT-hiPSC-derived ii
3 neurons for disease phenotyping. To further understand the role of MECP2e1 in RTT, I took advantage of RTT-hiPSCs carrying a MECP2 mutation that specifically disrupts MECP2e1 while MECP2e2 remains intact (RTTe1). RTTe1-hiPSC-derived neurons exhibited a soma size defect compared to wild-type neurons. Furthermore, this phenotype was rescued by MECP2e1 vectors in a cell autonomous manner suggesting that disruption of MECP2e1 alone is sufficient to cause a cellular RTT phenotype. Altogether, in this thesis, I isolated mutant and isogenic control RTT-hiPSCs by taking advantage of their unique XCI pattern. Upon differentiation, mutant RTT-hiPSC-derived neurons exhibited a RTT phenotype compared to isogenic control hipsc-derived neurons from the same patient. Analysis of mutant and isogenic control hipscderived neurons represents a novel human in vitro model for understanding the pathogenesis of RTT and the role of MECP2 and its isoforms in human neurons. iii
4 Always be grateful for what you have iv
5 Acknowledgments The journey of my Ph.D. would not have not have been possible without the support of all the wonderful people surrounding me from all walks of life, within and outside of the lab, during and before my Ph.D., friends and families, lab mates and collaborators. I dedicate these pages to all of you. I would like to thank my supervisor, James Ellis, for giving me the incredible opportunity to work on a project that I have become so passionate about. My supervisory committee member, Gabrielle Boulianne, for opening the doors to the world of science when a naïve undergraduate student with no research experience approached her, and Cindi Morshead, where I found my passion in stem cells when I was a undergraduate student attending one of her guest lectures. Thank you all for your constant supervision and mentorship. I would like to thank all Ellis lab members, past and present, for creating such a supportive environment where I looked forward and coming to work everyday. Akitsu Hotta, for training and teaching me all the fundamentals of induced pluripotency. You are one of the most brilliant scientists I know of and it was the utmost pleasure to have worked with you. All the post-doctoral fellows, Mojgan Rastegar, Sylvie Gervier, Amy Wong, Joel Ross, Shahryar Khattak, Deivid Rodrigues, and Dae Sung Kim, for their vast amount of diverse knowledge, expertise, and wisdom. All the graduate students, Mandy Lo, Ugljesa Djuric, my collaborator for chapter three, Natalie Farra, who joined the laboratory with me and was with me every step, Kirill Zaslavsky, Rebecca Mok, and Wesley Lai. It was fun to have shared the graduate experience with all of you. All the technicians, Peter Pasceri, for keeping the lab running smoothly, Tadeo Thompson, Zhanna Konovalova, and Wei Wei, the three of you for maintaining the tissue culture facility, and Alina Piekna, my collaborator for chapter three. All the secretaries, Jill Flewelling, Kim Hunyh, and Anna Corpuz for all their administrative assistance. I would like to thank all the collaborators that have donated their generous time and effort towards my project. Lindsay Horvath, one of the most talented fellow graduate students I have met during my Ph.D., who is in Laura Carrel s lab at Pennsylvania State University. It was such a fortune to have such a dedicated, motivated, and detail-oriented person to work with in my second chapter. I will never forget the quantity and quality of hard work that you put in over the Christmas holidays during the revisions of our manuscript. Finally, writing a review with you was inspirational as I learnt so much from you. Thanks to Laura Carrel for her v
6 professionalism and sharp eye to come up with the most crucial experiments to tackle the most fundamental questions for our manuscript. Neither of our manuscripts would have been possible without both of your great minds. Daria Grafodatskaya and Rosanna Weksberg for providing the incentive to publish my second chapter. Without your spark of initiation, I may have missed the small window to publish my work in one of the most competitive areas in my field. Wenbo Zhang and Michael Salter for providing their knowledge and technical expertise in electrophysiology. Reagan Ching from Dr. David Bazett Jones lab who generously donated his time to aid in the experiments required for the publication of my second chapter. I would like to thank many people outside the lab who have selflessly helped me in all sorts of way. Simone Russel, for all your expertise in the androgen receptor assay. Beverly Apresto and Sanjeev Pullenayegum, for all your expertise in sequencing. Mary-Ann George, for all your expertise in karyotyping. Cheryle Seguin, for teaching me the basics of stem cell culture. Jodi Garner, for all the reagents you have provided over the years. The neighbouring labs of Janet Rossant and Peter Dirks, for all the reagents and reagents you have generously provided. Andras Nagy, Hsiao Tuan Chao, Xue Jun Li, Peter Weick, Allison Ebert, and Cassiano Carromeu and all the people from labs around the world who replied to random s from a student and proved that science is a collaborative field where knowledge is shared between companions. I would like to thank all the funding agencies who have supported me financially throughout my graduate career including the Natural Science and Engineering Research Council of Canada, Ontario Student Opportunity Trust Funds (University of Toronto), and the Ontario Mental Health Foundation. To my friends and family who have kept me grounded and balanced in life. My mother and father who supported me emotionally and financially over the years. I am so grateful for all the opportunities, freedom, and education that you have provided me throughout my life to lead me to this point. My aunt and uncle from Toronto, who took care of me when I came over to Toronto on my own as a teenager and continue to take care of me and ensuring my well-being. I cannot imagine living in Toronto on my own all this time. I hope I have made all of you proud and I am forever grateful to all of you. vi
7 Table of Contents Abstract... ii Acknowledgments... v Table of Figures... xi Table of Tables... xiii List of Abbreviations... xiv Chapter Introduction Rett Syndrome Clinical Features of RTT Genetic basis of RTT MECP XCI and Phenotypic Variability in RTT MECP2 structure MECP2 isoforms MECP2 expression MECP2 function RTT Mouse models Cell autonomous MECP2 dysfunction in the brain Non-cell autonomous MECP2 dysfunction in the brain Rescue of RTT mouse models Adult requirement of MECP Embryonic Stem Cells MESCs from the mouse embryo HESCs from the human embryo Induced Pluripotent Stem Cells Reprogramming by transcription factors mipscs Reprogramming by transcription factors hipscs Developmental principles in neurodevelopment HiPSCs in disease modeling HiPSC disease models of RTT Issues relating to hipscs X-Chromosome Inactivation vii
8 Mediators of XCI XCI in the Mouse Pluripotent System XCI in the Human Pluripotent System in vivo XCI in the Human Pluripotent System in vitro Conversion of mpscs and hpscs to the naïve state Early studies of XCI in hipscs Outline, Rationale, and Hypothesis of Thesis Chapter Isolation of MECP2-null Rett Syndrome patient hipscs and isogenic control through X- chromosome inactivation Abstract Brief Introduction and Rationale Results Characterization of the Δ3-4 MECP2 mutation Additional RTT-fibroblasts Generation and characterization of RTT-hiPSCs RTT-hiPSCs retain an Xi in a nonrandom pattern MECP2 expression follows the pattern of XCI in RTT-hiPSCs and their neuronal derivatives Brief Summary and Discussion Materials and Methods MECP2 Genotyping RTT-fibroblast cell culture Generation of RTT-hiPSCs and cell culture of hpscs Generation and transduction of lentivirus and retrovirus Immunocytochemistry RNA isolation and qpcr analysis In vitro and in vivo differentiation Karyotyping and DNA fingerprinting RNA-FISH and DNA-FISH Androgen Receptor assay Directed differentiation of hipscs into neurons Chapter viii
9 3. Disruption of MECP2e1 isoform alone is sufficient for a Rett Syndrome phenotype in hipsc-derived neurons Abstract Brief Introduction and Rationale Results Isolation of mutant RTTe1-hiPSCs through XCI Directed differentiation of RTTe1-hiPSCs into neurons Transduction of MECP2e1 vectors into RTTe1-NPCs RTTe1-hiPSC derived-neurons exhibit a soma size defect that is rescued by exogenous MECP2e1 in a cell autonomous manner Brief Summary and Discussion Materials and Methods RTTe1-fibroblast cell culture Generation and cell culture of RTTe1-hiPSCs Immunocytochemistry In vitro and in vivo differentiation RNA isolation and qpcr analysis Karyotyping Androgen Receptor assay Sequencing of RTTe1-hiPSC cdna Directed differentiation of RTTe1-hiPSCs into NPCs and neurons Construction of isoform-specific MECP2 lentiviral vectors Generation and transduction of lentivirus Single cell Fluidigm array Chapter Discussion Summary of Principal Findings Outline of discussion XCI and RTT-hiPSCs Most hipscs retain an Xi in a nonrandom pattern Post-XCI hipscs allows the generation of isogenic hipscs from X-linked diseases Post-XCI hipscs are prone to X-chromosome erosion ix
10 A minority of hipscs undergo XCR and are pre-xci XCI in RTT-hiPSCs Post-XCI RTT-hiPSCs Pre-XCI RTT-hiPSCs Inconsistencies between the XCI status of RTT-hiPSCs Evaluation of XCI in RTT-hiPSCs Pros and Cons of Post- and Pre-XCI RTT-hiPSCs Impact of XCI in other diseases Workflow in identifying XCI status of RTT-hiPSCs Functional relevance of MECP2e1 and MECP2e RTT-hiPSCs as a novel human in vitro model of RTT Future Perspectives Establishing a platform using RTT-hiPSC-derived neurons for drug screens Elucidating isoform-specific roles of MECP2e1 and MECP2e2 in RTT-hiPSCderived neurons Conclusions References x
11 Table of Figures Figure 1.1. XCI in RTT... 4 Figure 1.2. Schematic of MECP Figure 1.3. MECP2 is alternatively spliced into two isoforms... 8 Figure 1.4 RTT can be characterized by reprogramming patient fibroblasts into hipscs for in vitro phenotyping of differentiated neurons Figure 2.1. Mapping of the Δ3-4 MECP2 mutation Figure 2.2. Sequence analysis of the Δ3-4 MECP2 mutation Figure 2.3. Sequencing of T158M- and R306C-hiPSCs Figure 2.4. RTT-hiPSCs express pluripotency markers Figure 2.5. RTT-hiPSCs express bona fide pluripotency markers Figure 2.6. RTT-hiPSCs are pluripotent in vitro Figure 2.7. RTT-hiPSCs are pluripotent in vivo Figure 2.8. RTT-hiPSCs have largely silenced the reprogramming factors Figure 2.9. RTT-hiPSCs have reactivated the endogenous loci of reprogramming factors Figure RTT-hiPSCs carry an identical genetic profile as their parental fibroblast of origin Figure Karyotype of RTT-hiPSCs Figure Female RTT-hiPSCs express XIST RNA indicative of an Xi Figure Female RTT-hiPSCs exhibit H3K27me3 signal indicative of an Xi Figure Δ3-4-hiPSC #37 carry two X-chromosomes Figure XCI is nonrandom in female RTT-hiPSCs Figure AR Assay of BJ-fibroblasts Figure MECP2 expression follows the pattern of XCI in Δ3-4-hiPSCs Figure MECP2 expression follows the pattern of XCI in T158M- and R306C-hiPSCs Figure Schematic of directed differentiation of RTT-hiPSCs into neurons Figure MECP2 expression follows the pattern of XCI in Δ3-4-hiPSC-derived neurons Figure Δ3-4-hiPSC-derived neurons inherit the Xi from their parental hipscs Figure Mutant Δ3-4-hiPSC-derived neurons exhibit a soma size defect compared to isogenic control Δ3-4-hiPSC-derived neurons Figure Summary of chapter two Figure 3.1. Schematic of the RTTe1 MECP2 mutation xi
12 Figure 3.2. XCI analysis of RTTe1-hiPSCs and -neurons Figure 3.3. RTTe1-hiPSCs expressed bona fide pluripotency markers and silenced the reprogramming factors Figure 3.4. RTTe1-hiPSCs are pluripotent in vitro Figure 3.5. Karyotype of RTTe1-hiPSCs Figure 3.6. Schematic of directed differentiation of RTTe1-hiPSCs into NPCs and neurons Figure 3.7. Single cell Fluidigm array of RTTe1-hiPSC-derived neurons Figure 3.8. MECP2 isoform-specific lentivirus vectors Figure 3.9. Transduction of MECP2e1 lentivirus into RTTe1-hiPSC-derived NPCs Figure Differentiation of MECP2e1-transduced RTTe1-hiPSC-derived NPCs into neurons Figure Differentiation of RTTe1-hiPSCs into neurons Figure RTTe1-hiPSC-derived neurons exhibit a soma size defect that is rescued by MECP2e1 in a cell autonomous manner Figure Summary of chapter three Figure 4.1. Generation of post- and pre-xci RTT-hiPSCs xii
13 Table of Tables Table 1.1 Summary of hipsc disease models Table 2.1. Summary of RTT-fibroblasts reprogrammed Table 2.2. Karyotype of RTT-hiPSCs Table 2.3. Quantification of AR assay in RTT-hiPSCs Table 2.4. Primers Table 2.5. Antibodies Table 3.1. Quantification of AR assay in RTT-hiPSCs Table 3.2. Summary of RTTe1-hiPSCs studied Table 3.3. Antibodies Table 3.4. Summary of neurons scored in soma size analysis Table 3.5. Primers Table 4.1. Summary of RTT-fibroblasts reprogrammed, method of reprogramming, and the XCI status of RTT-hiPSCs Table 4.2. Summary of RTT-hiPSCs generated and their XCI status as determined by different methods Table 4.3. Commonly used techniques to evaluate XCI status in hpscs Table 4.4. Proposed workflow of XCI analysis in RTT-hiPSCs Table 4.5. Summary of phenotypes observed in neurons derived from RTT-hiPSCs, -mipscs, and mescs xiii
14 List of Abbreviations 1NR Primary neural rosettes 2NR Secondary neural rosettes 5mC - 5-methylcytosine 5hmC - 5-hydroxymethylcytosine 6TG - 6-Thio-Guanine AR - Androgen Receptor BDNF - Brain-Derived Neurotrophic Factor BMP - Bone Morphogenic Protein bfgf - Basic Fibroblast Growth Factor camp - N6,2 -O-Dibutyryladenosine 3,5 -Cyclic Monophosphate Sodium Salt CAs - Cellular Aggregates CNVs - Copy Number Variations CNS - Central Nervous System D - Day DAPI - 4,6-Diamidino-2-Phenylindole Dihydrochloride Diff. fnscs - Differentiated Fetal Neural Stem Cells DMEM - Dulbecco s Modified Eagle Medium DZNep - 3-Deazaneplanocin A e - Embryonic Day ExPSCs - Excitatory Postsynaptic Currents EZH2 - Enhancer Of Zeste Homolog 2 FD - Familial Dysautonomia FISH - Fluorescent In Situ Hybridization FGF2 - Fibroblast Growth Factor 2 FX - Fragile X Syndrome GDNF - Glial Cell Line-Derived Neurotrophic Factor H3K4me3 - Histone H3 Trimethylation at Lysine 4 H3K18ac - Histone H3 Acetylation at Lysine 18 H3K27me3 - Histone H3 Lysine 27 Trimethylation H4K20me1 Histone H4 Monomethylation at Lysine 20 HAT - Hypoxanthine, Aminopterin, and Thymidine xiv
15 HDACs - Histone Deacetylases hescs - Human Embryonic Stem Cells hpscs - Human Pluripotent Stem Cells hipscs - Human Induced Pluripotent Stem Cells hnrna - Heterogeneous Nuclear RNA HTS High Throughput Screening PGD - Preimplantation Genetic Diagnosis PSCs - Pluripotent Stem Cells ICM - Inner Cell Mass ICC - Immunocytochemistry IGF1 - Insulin-Like Growth Factor 1 IKBKAP - I-k-B kinase complex-associated protein InPSCs - Inhibitory Postsynaptic Currents IU - Infectious Units KOSR - Knockout Serum Replacement LIF - Leukemia Inhibitory Factor LNS - Lesch-Nyhan Syndrome mescs - Mouse Embryonic Stem Cells MBD - Methyl-CpG Binding Domain MECP2 - Methyl-CpG Binding Protein 2 Mecp Mecp2 truncation mutation at amino acid 308 Mecp2 lox-stop Mecp2 with a lox-stop cassette Mecp2 Tg - Mecp2 Overexpressing MEFs - Mouse Embryonic Feeders MEM - Minimum Essential Medium mescs - Mouse Embryonic Stem Cells mipscs - Mouse Induced Pluripotent Stem Cells mpscs - Mouse Pluripotent Stem Cells MOI - Multiplicity Of Infection NC - Neural Crest ncrna - Non-Coding RNA NE - Neuroepithelial NPCs - Neural Precursor Cells xv
16 PBS - Phosphate-Buffered Saline qpcr - Quantitative Polymerase Chain Reaction qrt-pcr - Quantitative Reverse Transcribe Polymerase Chain Reaction RA - Retinoic Acid RT-PCR - Reverse Transcribe Polymerase Chain Reaction RTT - Rett Syndrome RTTe1-11 bp deletion in MECP2 affecting MECP2e1 but not MECP2e2 SB - Sodium Butyrate SEM - Standard Error of Mean SHH - Sonic Hedgehog SMA - Spinal Muscular Atrophy SMN1 - survival motor neuron 1 TRD - Transcriptional Repression Domain TCAG - The Centre for Applied Genomics TM - Tamoxifen TS - Timothy Synrome UTR - untranslated-region WNT - Wingless-Type MMTV Integration Site Family WT - Wild-Type wt/vol - Weight Per Volume vol/vol - Volume Per Volume X/A - X-Chromosome To Autosome Xa - Active X-Chromosome XCE - X-Chromosome Erosion XCI - X-Chromosome Inactivation XCR - X-Chromosome Reactivation Xe - Eroded X-Chromosome Xi - Inactive X-Chromosome Xic - X-Inactivation Centre Δ3-4 - RTT mutation with an indel affecting exons three and four of MECP2 xvi
17 Chapter 1 1. Introduction The background pertaining to X-chromosome inactivation described in this chapter is published in part in the following review: Cheung AYL, Horvath LM, Carrel L, Ellis J. X-chromosome inactivation in Rett Syndrome human induced pluripotent stem cells. Frontiers in Psychiatry 3, 24 (2012) Rett Syndrome Clinical Features of RTT Rett Syndrome (RTT [MIM ]) is a neurodevelopmental disorder affecting females almost exclusively at an incidence of roughly 1 in 10,000 (Chahrour and Zoghbi, 2007). RTT patients develop normally, achieving appropriate milestones such as the ability to walk and talk. RTT patients become symptomatic around 6-18 months of age when they enter a stage of developmental stagnation (Hagberg et al., 1983). During this stage, RTT patients exhibit a deceleration of head growth leading to microcephaly and growth retardation leading to weight loss and weak posture due to muscle hypotonia. As RTT progresses, patients undergo a phase of rapid regression and lose previously acquired skills such as purposeful use of their hands and instead develop characteristic hand wringing and washing movements. They develop autistic features such as social withdrawal, loss of language, mental deterioration, and loss of motor coordination and the development of ataxia and gait apraxia. RTT patients commonly experience seizures and respiratory abnormalities such as breath holding, aerophagia, and apnea. Postregression, at around 5 to 10 years age, RTT patients stabilize at a stationary stage where seizures tend to decrease in severity and RTT patients experience amelioration of the social component of autistic-like behaviours. RTT patients develop scoliosis and lose mobility and are wheelchair bound with increased anxiety. RTT patients ultimately develop Parkinsonian features and can survive up to the seventh decade of life, albeit in a severely debilitated physical condition. Currently, there are no effective treatments for this disease and treatment is aimed at 1
18 improving the ability of patients in different tasks via occupational therapy, speech therapy, and physical therapy Genetic basis of RTT MECP2 Genetically, over 95% of classic RTT patients harbour a heterozygous mutation in the X- linked gene encoding Methyl-CpG Binding Protein 2 (MECP2) (Amir et al., 1999). Most mutations in MECP2 are de novo from the paternal germline involving a C to T mutation at CpG hotspots (Trappe et al., 2001; Wan et al., 1999). Eight missense and nonsense mutations account for ~70% of all mutations (Percy et al., 2007). In North America, approximately 39% and 35% of RTT patients are due to missense and nonsense mutations in MECP2, respectively (Percy et al., 2007). Large deletions are relatively rare (~6%) (Percy et al., 2007), but associated with a more clinically severe form of RTT compared to other mutation types (Bebbington et al., 2012; Neul et al., 2008; Scala et al., 2007). The nature of MECP2 mutations are loss-of-function including complete absence of the protein in nonsense mutations via introduction of a premature termination codon, or a hypomorphic protein that retains partial function via missense mutations in key residues or C-terminus truncation mutations (Ballestar et al., 2005; Ballestar et al., 2000; Shahbazian et al., 2002a; Yusufzai and Wolffe, 2000). A small minority of RTT cases have been attributed to mutations in other genes including CDKL5 (Archer et al., 2006; Cordova-Fletes et al., 2010; Kalscheuer et al., 2003; Scala et al., 2005; Tao et al., 2004; Weaving et al., 2004) and FOXG1 (Ariani et al., 2008; Bahi-Buisson et al., 2010; Jacob et al., 2009; Le Guen et al., 2011; Mencarelli et al., 2010; Philippe et al., 2010) located on chromosomes X and 14, respectively. How these genes contribute to RTT remains poorly understood. CDKL5 has been shown to phosphorylate MECP2 in vitro and this function is abolished in CDKL5 mutants (Bertani et al., 2006). On the other hand, Foxg1 has been implicated in interacting with the Mecp2e2 isoform to promote neuronal survival (Dastidar et al., 2012). Therefore, both CDKL5 and FOXG1 mutations seem to ultimately converge on MECP2, which may explain the identification of non- MECP2 mutations in RTT patients. Intriguingly, gain in MECP2 dosage also results in neurological phenotypes similar to lack of MECP2 (Ariani et al., 2004; Friez et al., 2006; Meins et al., 2005; Van Esch et al., 2005). Duplications within Xq28 spanning the MECP2 locus have been reported in patients, most of whom are male. These patients suffer from progressive neurodevelopmental symptoms similar to RTT females including severe mental retardation, hypotonia, seizures, and recurrent 2
19 respiratory infections. Distinct from RTT females, however, is the association with early death. These observations in the clinic indicate that the dosage of MECP2 must be tightly regulated for the well-being of an individual. Indeed, loss-of-function MECP2 mutations in males have also been identified (Hardwick et al., 2007; Schanen and Francke, 1998; Schanen et al., 1998; Schule et al., 2008; Villard et al., 2000; Wan et al., 1999; Zeev et al., 2002). These patients suffer from neurological symptoms similar to RTT females but without a grace period of normal development, and suffer from severe infantile encephalopathy and early death. Heterozygous females having at least one wild-type (WT) MECP2 allele likely explains the relatively lesser degree in severity compared to males which are effectively null for MECP XCI and Phenotypic Variability in RTT The X-linked nature of MECP2 lends itself to be subjected to the effect of X- chromosome inactivation (XCI) in female cells. XCI occurs during female development when one of the two X-chromosomes is randomly inactivated such that approximately half the cells inactivate the maternally derived X-chromosome and the other half inactivate the paternally derived X-chromosome (Amos-Landgraf et al., 2006). Therefore, RTT patients are mosaic where half of their cells express WT MECP2 while the other half express mutant MECP2 (Figure 1.1). Although XCI is random in most cases, it can occasionally be nonrandom which can lead to phenotypic variability in RTT patients and mouse models such that they are only mildly affected or even asymptomatic depending on the extent of favourable XCI skewing (Amir et al., 2000; Archer et al., 2007; Huppke et al., 2006; Shahbazian et al., 2002c; Young and Zoghbi, 2004). These observations further highlight how MECP2 dosage, as determined by XCI skewing, can contribute to the well-being of an individual. 3

20 Figure 1.1. XCI in RTT The X-linked nature of MECP2 lends itself to be subject to the effects of XCI in female cells. For this reason, RTT females are mosaic such that approximately half their cells are WT as they have inactivated the mutant MECP2 allele, while the other half of the cells are mutant as they have inactivated the WT MECP2 allele. 4
21 MECP2 structure MECP2 is situated on the long arm of the X-chromosome at Xq28 (Figure 1.2). Mecp2 is a member of the methyl-cpg binding protein family (Hendrich and Bird, 1998; Lewis et al., 1992). Mecp2 has two main domains, the methyl-cpg binding domain (MBD) (Nan et al., 1993), which is important for its role in binding methylated DNA, and the transcriptional repression domain (TRD), which is important for its role in recruiting chromatic remodeling proteins such as the corepressor complex containing transcriptional repressor msin3a and Histone Deacetylases (HDACs) 1 and 2 (Nan et al., 1997; Nan et al., 1998). In addition, Mecp2 contains a nuclear localization signal (Nan et al., 1996), a C-terminal domain which facilitates binding of Mecp2 to DNA (Chandler et al., 1999), and a WW domain important for proteinprotein interactions (Buschdorf and Stratling, 2004). Finally, Mecp2 has a large and highly conserved 3 untranslated-region (UTR) that contains multiple polyadenylation sites, generating four different transcripts with the longest transcript being most abundant in the brain, providing a tissue-specific function in regulation of protein synthesis (Pelka et al., 2005). 5

22 Figure 1.2. Schematic of MECP2 MECP2 is situated on the long arm of the X-chromosome at Xq28. It encodes four exons with two main domains, MBD and TRD. It also encodes a nuclear localization signal, a WW domain, and a large 3 untranslated region. MBD, Methyl-CpG Binding Domain. TRD, Transcriptional Repression Domain. NLS, nuclear localization signal. UTR, untranslated region. 6
23 MECP2 isoforms MECP2 encodes four exons and is alternatively spliced into two isoforms that differ at the N-termini referred to as MECP2e1 and MECP2e2 (Figure 1.3) (Kriaucionis and Bird, 2004; Mnatzakanian et al., 2004). MECP2e1 includes exons one, three and four, while MECP2e2 encodes all four exons, although the start codon of the latter is situated in exon two. The relative importance and isoform-specific functions of MECP2e1 and MECP2e2 are poorly understood. MECP2e1 is thought to be the predominant isoform given its higher expression in the mouse brain and human neurons (Dragich et al., 2007; Kriaucionis and Bird, 2004; Mnatzakanian et al., 2004). The relatively higher expression of Mecp2e1 compared to Mecp2e2 is thought to be due to translation interference and/or competition with the upstream start codon in exon 1 (Kriaucionis and Bird, 2004). Furthermore, MECP2 mutations in RTT patients that specifically disrupt MECP2e1 but not MECP2e2 have been identified (Amir et al., 2005; Bartholdi et al., 2006; Chunshu et al., 2006; Fichou et al., 2009; Mnatzakanian et al., 2004; Quenard et al., 2006; Ravn et al., 2005; Saunders et al., 2009). However, Mecp2e2 interacts with Foxg1 and regulates apoptosis in mouse neurons (Dastidar et al., 2012). Mecp2e2-isoform specific mutant mice have no neurological phenotypes associated with RTT but instead exhibit placental defects leading to reduced embryo viability when the Mecp2e2-null allele is from the maternal origin (Itoh et al., 2012). Together with the abundant expression of Mecp2e2 in the mouse placenta, it likely plays a role in placental development. These studies suggest isoform-specific functions of MECP2e1 and MECP2e2. However, although there is debate, it has been suggested that mutations affecting MECP2e1 genetically can interfere with MECP2e2 translation resulting in complete loss of MECP2 protein (Fichou et al., 2009; Gianakopoulos et al., 2012; Saxena et al., 2006). Furthermore, Mecp2-null mice phenotypes can also be improved by either Mecp2e1 or Mecp2e2 transgenes when expressed at appropriate levels (Alvarez-Saavedra et al., 2007; Giacometti et al., 2007; Jugloff et al., 2008; Kerr et al., 2012; Luikenhuis et al., 2004), suggesting that it is total Mecp2 expression, contributed by the two isoforms, which is the deterministic factor for the well-being of the animal. 7

24 Figure 1.3. MECP2 is alternatively spliced into two isoforms MECP2 encodes four exons that are alternatively spliced into two isoforms, MECP2e1 and MECP2e2. MECP2e1 contains exons one, three, and four, while MECP2e2 contains all four exons. The start codon of MECP2e1 and MECP2e2 are in exons one and two, respectively. 8
25 MECP2 expression In the adult mouse, Mecp2 is expressed high in the brain, lung, and spleen, intermediate in heart and kidney, and weak in the liver, stomach, and small intestine (Shahbazian et al., 2002b). During embryonic development, Mecp2 expression correlates with neuronal maturation in the central nervous system (CNS) (Kishi and Macklis, 2004; Shahbazian et al., 2002b). In the cortex, MECP2 is first prominently detected in the Cajal-Retzius cells, one of the earliest born neurons, at around embryonic day (e)16.5 in mice and 10 to 14 weeks gestation in humans (Kishi and Macklis, 2004; Shahbazian et al., 2002b). MECP2 expression increases following the development of the cortex, first in neurons of the deeper more mature cortical layers, and finally in neurons of the more superficial layers (Shahbazian et al., 2002b). Mecp2 expression continues to increase postnatally and into adulthood where it is expressed throughout the adult brain in neurons and reaches maximum levels in five week old mice to an abundance similar to that of nucleosomes (Kishi and Macklis, 2004; Skene et al., 2010). At the subcellular level, Mecp2 localizes to the nucleus via its NLS (Nan et al., 1996) and colocalizes with methylated heterochromatic foci in mouse cells (Kishi and Macklis, 2004; Lewis et al., 1992) while MECP2 exhibits a diffuse staining pattern in the nucleus of human cells due to differences in the distribution of CpG dinucleotides in the genome (Nan et al., 1997; Shahbazian et al., 2002b). It was originally thought that MECP2 was detected exclusively in neurons in the CNS (Kishi and Macklis, 2004; Shahbazian et al., 2002b). However, its expression in glial cell types including astrocytes and microglia and their role in mediating non-cell autonomous phenotypes in RTT has been recently appreciated (Ballas et al., 2009; Derecki et al., 2012; Lioy et al., 2011; Maezawa and Jin, 2010; Maezawa et al., 2009; Rastegar et al., 2009) and will be discussed below (section ) MECP2 function Mecp2 functions by tracking the genome in a DNA-methylation (specifically, 5- methylcytosine [5mC]) dependent manner (Baubec et al., 2013; Skene et al., 2010). It does this via binding to single methylated CpG dinucleotide pairs with adjacent A/T-rich motifs (Klose et al., 2005; Lewis et al., 1992; Nan et al., 1993). Mecp2 has been traditionally thought of as a transcriptional repressor of target genes (Nan et al., 1997). The repression of target genes by Mecp2 is achieved via its TRD, which recruits chromatic remodeling proteins such as the corepressor complex containing the transcriptional repressor msin3a and HDACs 1 and 2 9
26 (Jones et al., 1998; Nan et al., 1998). However, recent studies have demonstrated that Mecp2 also activates transcription by binding to promoters and associating with the transcriptional activator CREB1 (Ben-Shachar et al., 2009; Chahrour et al., 2008). Furthermore, Mecp2 binds to 5-hydroxymethylcytosine (5hmC), which is enriched in highly expressed genes in the mouse brain, and increases the chromatin accessibility to facilitate transcription (Mellen et al., 2012). Therefore, the dual role of MECP2 to activate and repress genes stems from its ability to bind to both 5mC and 5hmC, which are enriched in repressive and active genes, respectively. Finally, in addition to being a transcriptional regulator, Mecp2 also interacts with the Y box-binding protein 1 to regulate alternative splicing (Young et al., 2005). Although the transcriptional regulatory role of MECP2 is relatively well established, MECP2 targets remain elusive. There are two hypotheses: 1) MECP2 regulates specific target genes, or 2) MECP2 regulates transcription at a genome-wide level. Early studies of transcriptional profiling in RTT patients and mouse models only revealed subtle differences in gene expression (Ballestar et al., 2005; Colantuoni et al., 2001; Traynor et al., 2002; Tudor et al., 2002). Therefore, MECP2 was thought to regulate a specific subset of target genes. One of the most studied Mecp2 targets is brain-derived neurotrophic factor (BDNF) (Chen et al., 2003; Martinowich et al., 2003). In the absence of neuronal stimulation, Mecp2 is bound to the Bdnf promoter and represses its transcription (Chen et al., 2003; Martinowich et al., 2003). During neuronal stimulation in vitro, Mecp2 is phosphorylated in an activity-dependent manner and released from the Bdnf promoter resulting in transcriptional derepression (Chen et al., 2003; Martinowich et al., 2003; Zhou et al., 2006). The relevance of the Bdnf and Mecp2 interaction was further exemplified as deletion or overexpression of Bdnf in Mecp2-null mice promoted earlier onset or improvements of RTT-associated phenotypes, respectively (Chang et al., 2006). Recently, the hypothesis that MECP2 acts on specific target genes has been challenged while its function at the genome-wide level has been increasingly appreciated. In neurons of adult mice, Mecp2 is nearly as abundant as histone octamers and binds throughout the genome tracking DNA-methylation leading to the hypothesis that the role of Mecp2 is to regulate chromatin state and dampen transcriptional noise at a genome-wide level (Skene et al., 2010). Furthermore, activity dependent phosphorylation of Mecp2 also occurs genome-wide where it is hypothesized to facilitate a global response of neuronal chromatin to activity during nervous system development (Cohen et al., 2011). Contrary to the in vitro studies above, it was found that displacement of phosphorylated Mecp2 during neuronal activity does not occur and is not required for activity-dependent gene transcription in vivo. Finally, transcriptional profiling of 10
27 restricted brain regions such as the hypothalamus and cerebellum in Mecp2-null and Mecp2- overexpressing (referred to as Mecp2 Tg ) mice has revealed that thousands of genes are dysregulated in both directions (Ben-Shachar et al., 2009; Chahrour et al., 2008). Collectively, these studies argue against Mecp2 functioning as a transcriptional regulator at specific target genes. Instead, Mecp2 primarily functions as a transcriptional regulator by tracking the genome in a DNA-methylation dependent manner and altering its chromatin state in response to neuronal activity resulting in gene expression changes at a global scale RTT Mouse models Numerous RTT mouse models have been generated with a diverse array of mutations affecting Mecp2. These include, null mutations (Chen et al., 2001; Guy et al., 2001; Pelka et al., 2006), missense mutations (Goffin et al., 2012), truncation mutations (Baker et al., 2013; Shahbazian et al., 2002a), hypomorphic mutations (Kerr et al., 2008; Samaco et al., 2008), overexpression mutations (Collins et al., 2004; Luikenhuis et al., 2004), or cell- and regionspecific mutations (Adachi et al., 2009; Chao et al., 2010; Chen et al., 2001; Fyffe et al., 2008; Gemelli et al., 2006; Guy et al., 2001; Lioy et al., 2011; Samaco et al., 2009). Mecp2 mutant mouse models recapitulate key characteristics associated with RTT patients including an initial phase of apparently normal development followed by severe neurodevelopmental dysfunction (Chen et al., 2001; Guy et al., 2001; Shahbazian et al., 2002a). Mecp2 -/y mice develop normally until approximately 6 weeks where they develop severe neurological symptoms and abnormal behaviours including hypoactivity, hindlimb or forelimb clasping, tremors, seizures, motor dysfunction, breathing abnormalities, altered anxiety, learning and memory deficits, social behaviours abnormalities, ataxia, and eventually death by 10 weeks (Chen et al., 2001; Guy et al., 2001). Mecp2 +/- mice follow a similar neurological and behavioural progression as their male counterparts with a later age of onset of symptoms during adulthood and death. Most importantly, neuron-specific deletion of Mecp2 in mice results in a phenotype resembling that of a ubiquitous Mecp2 deletion indicating that Mecp2 dysfunction in neurons is sufficient to cause the disease (Chen et al., 2001; Guy et al., 2001). Finally, Mecp2 Tg mice that overexpress MECP2 exhibit progressive neurological abnormalities, such as seizures and severe motor dysfunction, similar to that seen in MECP2 duplication patients (Collins et al., 2004; Luikenhuis et al., 2004). In summary, Mecp2 mutant mouse models recapitulate key characteristics of RTT and lack of Mecp2 specifically in neurons is sufficient to induce RTT-like phenotypes. 11
28 Furthermore, Mecp2-null and Tg mice further highlight the notion that Mecp2 levels must be tightly regulated for the well-being of an animal Cell autonomous MECP2 dysfunction in the brain Lack of Mecp2 in neurons is sufficient to cause RTT phenotypes in mice suggesting a cell autonomous effect (Chen et al., 2001; Guy et al., 2001). Absence of MECP2 results in a diverse array of neuropathological phenotypes related to neuronal maturation. Mecp2-null mouse brains show no obvious alterations in brain architecture other than a reduction in size and weight (Belichenko et al., 2008; Chen et al., 2001; Guy et al., 2001). Consistently, Mecp2-null mouse neurons are smaller in size and more densely packed (Chen et al., 2001; Kishi and Macklis, 2004). Furthermore, they appear immature as there is a decrease in density and size of dendritic spines, decrease in density and alteration in orientation of axons, and decrease in complexity of dendritic arbourization (Belichenko et al., 2009b; Kishi and Macklis, 2004). These neuropathologies have also been consistently observed in postmortem tissues of RTT patients (Armstrong et al., 1995; Armstrong et al., 1999; Armstrong et al., 1998; Bauman et al., 1995a, b; Belichenko et al., 1994). Neurophysiologically, Mecp2 mutant mouse models exhibit an overall reduction in excitatory glutamatergic neurotransmission (Chao et al., 2007; Dani and Nelson, 2009; Nelson et al., 2006) and altered inhibitory GABAergic neurotransmission (Dani et al., 2005; Medrihan et al., 2008; Zhang et al., 2008). Finally, Mecp2-null mouse neural precursor cells (NPCs) show no alterations in cell fate, further suggesting that it is neuronal maturation, rather than neuronal commitment, that is compromised in the absence of Mecp2 (Kishi and Macklis, 2004). Altogether, aspects of MECP2 dysfunction in neurons are cell autonomous resulting in neuronal maturation defects highlighting the critical role of MECP2 in neuronal maturation Non-cell autonomous MECP2 dysfunction in the brain Although lack of MECP2 in neurons has cell autonomous effects and is sufficient to cause the disease, the role of MECP2 in non-neuronal cell types that mediate non-cell autonomous effects has recently been appreciated. Mecp2 is expressed, at low levels, in nonneuronal cell types of the brain including astrocytes (Ballas et al., 2009; Maezawa et al., 2009; Rastegar et al., 2009) and microglia (Maezawa and Jin, 2010). These non-neuronal cell types can mediate RTT phenotypes in a non-cell autonomous manner as Mecp2-null astrocytes and 12
29 conditioned media from Mecp2-null microglia fail to support normal dendritic morphology of WT neurons (Ballas et al., 2009; Maezawa and Jin, 2010; Maezawa et al., 2009). Mechanistically, these non-cell autonomous effects can be caused by abnormalities in Bdnf regulation and cytokine production in Mecp2-mutant astrocytes (Maezawa et al., 2009) or by elevated release of glutamate in Mecp2-mutant microglia (Maezawa and Jin, 2010). On the other hand, astrocytes and microglia can have positive, in addition to negative, non-cell autonomous effects on the progression of RTT (Derecki et al., 2012; Lioy et al., 2011). Re-expression of Mecp2 in astrocytes in Mecp2-null mice can improve RTT phenotypes and abnormal neuronal morphology in vivo (Lioy et al., 2011). Furthermore, introduction of WT microglia via bone marrow transplantation into irradiated Mecp2-null mice arrest RTT phenotypes (Derecki et al., 2012). Interestingly, non-cell autonomous effects are also evident within a mosaic culture of neurons as Mecp2-negative cells negatively influence Mecp2-positive cells with respect to Mecp2 expression, soma size, dendritic arbourization, and dendritic spines (Belichenko et al., 2009a; Braunschweig et al., 2004; Kishi and Macklis, 2010). Altogether, Mecp2 is expressed most abundantly in neurons where it has cell autonomous functions and is sufficient to cause RTT. However, Mecp2 is also expressed at low levels in non-neuronal cell types, such as astrocytes and microglia, where it can mediate non-cell autonomous functions and have roles in disease progression of RTT Rescue of RTT mouse models The monogenic nature of RTT and the lack of obvious cell loss in RTT patients prompt the question of whether restoration of MECP2 can restore normal function in MECP2 deficient cells and abrogate the disease. Reintroduction of Mecp2 into brain-restricted regions of Mecp2- mutant mice was inefficient in improving RTT symptoms, indicating that widespread Mecp2 reintroduction was required (Alvarez-Saavedra et al., 2007; Jugloff et al., 2008). To that end, transgenic mice harbouring a lox-stop cassette in the endogenous Mecp2 locus were used (Guy et al., 2007). The Mecp2 lox-stop allele functions as a null mutation but can be reactivated by deleting the lox-stop cassette with tamoxifen (TM)-inducible Cre-recombinase. Acute TM injections prior to symptom onset resulted in Mecp2 reactivation and led to either development of neurological symptoms followed by rapid death or complete prevention of RTT symptom development in the mice. The former was shown to be due to toxicity associated with abrupt widespread Mecp2 reactivation, but not the TM injections, resembling that seen in Mecp2 Tg mice (Collins et al., 2004; Luikenhuis et al., 2004). Using a more gradual TM administration in 13
30 immature males or mature females during onset of symptoms eliminated this toxicity, which ultimately prevented and reversed the progression of RTT symptoms resulting in increased lifespan and general well-being of the mice similar to that of WT littermates (Guy et al., 2007). Using a similar strategy, it was found that the extent of reversal of RTT symptoms was dependent on the time and level of Cre expression (Giacometti et al., 2007). Early activation of Cre in the majority of the CNS led to the most efficient reversal of RTT symptoms while postnatal activation of Cre in a subset of neurons was the least efficient. Altogether, these observations suggest that lack of Mecp2 does not result in permanent loss of function in those cell types and that it is reversible. Mechanistically, it is hypothesized that molecular preconditions, such as DNA methylation, are established and maintained during the development of the animal, in the absence of Mecp2 (Guy et al., 2007; Mellen et al., 2012). Therefore, restoration of Mecp2 will allow newly synthesized protein to bind methylated DNA and resume its normal role. The finding that RTT is reversible in mouse models has prompted the investigation for drugs that can recapitulate this effect. Given that RTT is hypothesized to be due to a defect in neuronal maturation, agents that promote brain development are good candidates for ameliorating the symptoms of RTT. To this end, several drugs have been shown to improve RTT symptoms in Mecp2-mutant mice including Insulin-like Growth Factor 1 (IGF1) (Tropea et al., 2009), Bdnf (Kline et al., 2010), Fingolimod, a sphinogosine-1 phosphate receptor agonist that increases Bdnf levels (Deogracias et al., 2012), and TrkB agonists, where TrkB is the Bdnf receptor (Schmid et al., 2012). IGF1 is of particular interest as it crosses the blood-brain-barrier when administered systemically (as does Fingolimod and TrkB agonists, but not BDNF), it is produced endogenously and promotes brain maturation, and is already approved for pediatric use (Pini et al., 2012). Altogether, these studies demonstrate that RTT phenotypes in Mecp2 mutant mice can be improved genetically or pharmacologically. Building upon this, it may be possible to translate these drugs from RTT mouse models to RTT patients. Indeed, a pilot clinical study with six RTT patients showed that IGF1 administration is safe and well tolerated without major and/or permanent side effects (Pini et al., 2012). Furthermore, keeping the small sample number in mind, beneficial effects were observed in the treated patients including improvements in cognitive function, motor abilities, social interaction, and breathing. 14
31 Adult requirement of MECP2 RTT has long been considered as a neurodevelopmental disorder as symptom onset occurs during a critical period of brain developmental. For this reason, MECP2 is thought to have critical roles in neuronal maturation of the nervous system early on and establishing normal adult neurological function later on in life. However, it was unknown whether MECP2 function was required continually and equally throughout adult life to maintain proper brain function. To that end, transgenic mice where the endogenous Mecp2 allele is floxed and can be deleted via TM-inducible Cre were used (Cheval et al., 2012; McGraw et al., 2011; Nguyen et al., 2012). Surprisingly, deletion of Mecp2 postnatally resulted in the appearance of RTT symptoms, indicating a requirement for Mecp2 function in adult life (Cheval et al., 2012; McGraw et al., 2011; Nguyen et al., 2012). Furthermore, inactivation of Mecp2 postnatally uncovered two phases of life where Mecp2 function is particularly important (Cheval et al., 2012). The first phase occurred around 11 weeks of age when postnatal inactivation of Mecp2 in mice led to symptoms (Cheval et al., 2012) and coincided with the period in which Mecp2-null mice exhibit severe terminal symptoms and die (Chen et al., 2001; Guy et al., 2001). This indicates that Mecp2 function is critical soon after birth, at a time when major neuronal maturation and brain development is occurring, and when Mecp2 protein reach maximum levels in the brain. The second phase occurred around 39 weeks of age when postnatal inactivation of Mecp2 becomes incompatible with life (Cheval et al., 2012) and coincided with the period in which Mecp2 +/- mice develop symptoms (Chen et al., 2001; Guy et al., 2001). This indicates Mecp2 function is also critical later in life, perhaps with roles in the aging brain. Mechanistically, adult deletion of Mecp2 results in active regression of the mature brain including shrinking of the brain resulting in increased neuronal cell packing and density, decreased dendritic arbourization and spine density in neurons, and less complex ramified processes in astrocytes (Nguyen et al., 2012). Therefore, in addition to neuronal maturation, Mecp2 may also play a role in neuronal maintenance. Altogether, these observations extend Mecp2 function to include a requirement throughout adult life with heightened importance in specific phases coinciding with neuronal maturation and perhaps the aging brain. Furthermore, in addition to neuronal maturation, Mecp2 has critical roles in neuronal maintenance where its absence results in active regression of the mature brain. 15
32 1.2. Embryonic Stem Cells MESCs from the mouse embryo Mouse embryonic stem cells (mescs) are isolated from the preimplantation epiblast cells of blastocysts at e3.5 (Evans and Kaufman, 1981; Martin, 1981). MESCs have two defining features: 1) the ability to self renew indefinitely in vitro, and 2) their pluripotency which is defined by the ability to generate all cell types derived from the three germ layers, ectoderm, mesoderm, and endoderm, which make up the embryo proper but not the extra embryonic tissues (Rossant, 2008; Silva and Smith, 2008). Most notably, the pluripotency of mescs can be convincingly demonstrated by aggregating donor mescs into host tetraploid embryos (Nagy et al., 1993). This results in viable mice that are comprised of cells exclusively from donor mescs while the tetraploid embryos only contribute to extra embryonic tissues. Altogether, mescs are mouse pluripotent stem cells (mpscs) isolated from the preimplantation epiblast of mouse blastocysts. They are defined by their ability to self renew and their pluripotency giving them the ability to theoretically generate all cell types of the embryo HESCs from the human embryo Human embryonic stem cells (hescs) are isolated from the preimplantation epiblast cells of blastocysts (Reubinoff et al., 2000; Thomson et al., 1998). Similar to mescs, hescs are defined by the same cardinal features, the ability to self renew and their pluripotency. For hescs, pluripotency is demonstrated by the formation of teratomas when injected into immune deficient mice (Reubinoff et al., 2000; Thomson et al., 1998). Teratomas are solid tumours which are comprised of cells representing the three germ layers. The isolation of hescs was significant as it represented a potentially inexhaustible source of human differentiated cell types that were previously inaccessible. HESC-derived cells have major implications for human developmental biology, disease modeling, drug discovery, and cell replacement therapy. In the case of disease modeling, new hescs can be derived from embryos carrying mutations detected by preimplantation genetic diagnosis (PGD). However, many issues revolve around the use of hescs. The generation of hescs requires the destruction of embryos, which raises ethical concerns surrounding the moral status and use of such embryos. PGD often only detects rare monogenic disorders while more complex multifactorial diseases without a clear genetic basis are missed preventing the 16
33 generation of such disease-specific hescs. Finally, hescs cannot be generated from individuals and thus their use in cell replacement therapy is limited to recipients that are treated with immunosuppressants. Altogether, hescs are human pluripotent stem cells (hpscs) derived from the human embryo that represent a source of previously inaccessible human differentiated cell types. However, their use is associated with many disadvantages and therefore immense efforts have been made to investigate alternative methods for generating hpscs from adult somatic cells Induced Pluripotent Stem Cells Reprogramming by transcription factors mipscs In 2006, Takahashi and Yamanaka published their seminal work describing the reprogramming of mouse embryonic fibroblasts (MEFs) to mouse induced Pluripotent Stem cells (mipscs) (Takahashi and Yamanaka, 2006). They introduced 24 candidate transcription factors, known to be associated with pluripotency, into MEFs with β-geo knocked into the mesc-specific, but not essential, Fbx15 locus, which would be expressed upon reprogramming. Introduction of all 24 transcription factors via retroviral transduction into MEFs in mesc culture conditions resulted in neo-resistant embryonic-like stem cells, which the authors termed mipscs. By systematically eliminating the transcription factors, it was deduced that four transcription factors, Oct4, Sox2, Klf4, and c-myc, were sufficient to mediate the generation of mipscs. MiPSCs were pluripotent based on activation of a subset of pluripotency genes and the ability to generate the three germ layers in vitro via embryoid body (EB) formation and in vivo via teratoma formation. However, these mipscs were also distinct from mescs, and were partially reprogrammed, as indicated by continuous expression of exogenous transcription factors, an intermediate gene expression profile between MEFs and mescs, and an inability to generate viable chimeric mice when injected into blastocysts. However, the subsequent use of more stringent pluripotency reporter genes, such as Oct4 and Nanog, resulted in mipscs that were fully reprogrammed (Maherali et al., 2007; Okita et al., 2007; Wernig et al., 2007). MiPSCs were almost indistinguishable from mescs including activation of pluripotency genes such as Oct4, Sox2, and Nanog, hypomethylation of promoters associated with pluripotency genes, silencing of exogenous retroviral vectors, and their ability to generate viable chimeras, which contributed to the germline. Finally, mipscs could generate mice comprised entirely of 17
34 mipsc-derived cells when aggregated with tetraploid blastocysts (Boland et al., 2009; Kang et al., 2009; Zhao et al., 2009). Altogether, these studies confirm that transcription factors are sufficient to mediate the conversion of mouse somatic cells into mipscs Reprogramming by transcription factors hipscs The practicality of nuclear reprogramming was realized when it was reported that transduction of OCT4, SOX2, with either, KLF4 and c-myc, or NANOG and LIN28, into human fibroblasts resulted in the generation of human induced Pluripotent Stem cells (hipscs) (Lowry et al., 2008; Park et al., 2008b; Takahashi et al., 2007; Yu et al., 2007). HiPSCs were almost indistinguishable from hescs as they shared a similar expression and epigenetic profile including expression of pluripotency-associated genes and hypomethylation of their promoters, and the ability to differentiate into the three germ layers in vitro and in vivo. The generation of hipscs was revolutionary as it represented a potentially inexhaustible source of human differentiated cell types that were previously inaccessible, without the ethical issues surrounding hescs. HiPSCs can be generated from any individual, providing the opportunity for personalized stem cells, which may be used for cell replacement therapy. Most importantly, disease-specific hipscs can be generated from patients, such as with RTT, allowing disease modeling and drug screens, and/or toxicity studies, to be performed in human cells. However, to achieve these goals, efficient directed differentiation protocols to generate the cell type of interest is required Developmental principles in neurodevelopment The study of embryology in different organisms has provided invaluable insights into how pluripotent epiblast cells of the embryo differentiate into the three germ layers and their downstream derivatives (Murry and Keller, 2008). By following these developmental principles, it is possible to direct the differentiation of hpscs in vitro into cell types of interest. The mouse postimplantation blastocyst consists of three distinct cell lineages, the trophectoderm that forms the outer boundary of the inner cell mass (ICM), which itself consists of epiblast cells lined by hypoblast cells (Rossant, 2008). The trophectoderm and hypoblast give rise to extraembryonic tissues including the placenta and yolk sac while the epiblast gives rise to the embryo proper. The latter is achieved by epiblast cells going through gastrulation to form the three germ layers, ectoderm, mesoderm, and endoderm, where their derivatives generate cells that comprise the 18
35 embryo (Murry and Keller, 2008). The ectoderm forms the neural lineages and the skin, mesoderm forms the hematopoietic, vascular, cardiac, and skeletal muscle lineages, and endoderm forms the gastrointestinal and respiratory lineages. During neural induction, the ectoderm differentiates into neuroectoderm, which comprises the neuroepithelia (NE) (Liu and Zhang, 2011). This process is commonly referred to as the default pathway as it is normally inhibited by bone morphogenic protein (BMP). To relieve this inhibition in mammals, BMP is inhibited by noggin. In addition to noggin, activation or inhibition of fibroblast growth factor (FGF) or wingless-type MMTV integration site family (WNT), respectively, can also act as instructive factors. Ultimately, these morphogens converge on Smad signaling where its inhibition is crucial during neural induction. Indeed, these morphogens have been used in neural induction of hpscs towards NE in the form of neural rosettes (Chambers et al., 2009; Li et al., 2009b; Pankratz et al., 2007; Zhang et al., 2001). The neuroectoderm is formed in the head region and extends caudally to form the neural plate which eventually folds at the neck region and folds rostrally and caudally to form the neural tube (Liu and Zhang, 2011). NPCs that make up the neural plate have a regional identity at any given domain along the neural plate, which is determined by gradients of morphogens. Morphogens can exist along the rostral-caudal axis, including FGFs, WNTs, and retinoic acid (RA), and along the dorsal-ventral axis, including WNTs, BMPs, and sonic hedgehog (SHH). The regional identity of NPCs is crucial as it determines the type of neuron that they produce. Indeed, modifying the combination and concentration of these morphogens in hescs has allowed the generation of glutamatergic or GABAergic neurons from dorsal or ventral cortical progenitors, respectively (Li et al., 2009b), dopaminergic neurons from ventral midbrain progenitors (Perrier et al., 2004; Yan et al., 2005), and motor neurons from ventral spinal progenitors (Li et al., 2005). In addition to NPCs being spatially determined, they are also temporally determined (Miller and Gauthier, 2007). The nervous system is comprised of two main cell types, neurons and glia. Neurons are the main functional units of the nervous system and function by communicating with each other through synaptic connections. Structurally, neurons consist of a cell body, the soma, an axon, which typically conducts electrical impulses to distant neurons, and dendrites, which are processes emanating from the soma that receive electrical impulses from other neurons. Glia consist of non-neuronal cells that are important for the homeostasis of the nervous system. Two main glial cell types are astrocytes and oligodendrocytes. Astrocytes are the most abundant cell type in the nervous system with roles in synaptogenesis, removal of 19
36 excess neurotransmitters, and supplying energy metabolites. Oligodendrocytes insulate axons with myelin to form myelin sheaths, which are critical for efficient conduction of electrical impulses. During vertebrate development, these three cell types are born in a temporally determined order beginning with neurogenesis, followed by gliogenesis of astroglial cells, and lastly gliogenesis of oligodendroglial cells (Miller and Gauthier, 2007). Indeed, following this temporal schedule, hpscs have been demonstrated to first generate NPCs that generate neurons, followed by astroglial precursor cells that generate astrocytes, and lastly oligodendroglial precursor cells that generate oligodendrocytes (Hu et al., 2009; Hu et al., 2010; Krencik et al., 2011). Altogether, these observations highlight the importance of understanding the developmental principles in vivo to attempt to recapitulate them in vitro, such as modifying the combination and concentration of morphogens, to generate the desired cell type from hpscs HiPSCs in disease modeling One of the immediate applications for transcription factor-mediated reprogramming has been the generation of hipscs from patients harbouring specific diseases for disease modeling (Bellin et al., 2012; Grskovic et al., 2011; Han et al., 2011; Marchetto et al., 2011; Robinton and Daley, 2012; Tiscornia et al., 2011; Wu and Hochedlinger, 2011; Zhu et al., 2011). Indeed, the pace of patient-specific hipsc reports is staggering and it would be naïve to attempt to capture the present literature in a single document. For this reason, I tabulated some of the more impactful reports relating to the generation of patient-hipscs and their subsequent use in disease modeling and drug screens in Table 1.1. I highlight some of the key reports relating to the use of patient-specific hipscs for disease modeling in this section. In 2008, Daley and colleagues reported one of the first patient-specific hipscs from 10 individuals harbouring different diseases including neurological, pancreatic, lysosomal, and immunological (Park et al., 2008a). One to two hipsc lines were generated from each individual and were shown to be pluripotent and carried genetic mutations for their respective disease. In 2008, Eggan and colleagues demonstrated for the first time that differentiation protocols can be applied to hipscs to generate the cell type of interest (Dimos et al., 2008). The investigators generated hipscs from a patient affected with Amyotrophic Lateral Sclerosis (ALS). Using neuronal differentiation protocols previously established for hescs, they were able to differentiate ALS-hiPSCs into motor neurons, the cell type lost in ALS. These early observations demonstrated for the first time that hipscs could be generated from somatic cells of affected patients harbouring genetic 20
37 mutations and that they respond to differentiation protocols established for hescs. However, it was still unknown whether patient-specific hipscs could be used to model disease in vitro. In 2009, Svendsen and colleagues reported the isolation of hipscs from a patient affected with Spinal Muscular Atrophy (SMA) (Ebert et al., 2009), a neurodegerative disease affecting motor neurons. In their study, one SMA-hiPSC line from a patient with a mutation in survival motor neuron 1 (SMN1) gene was compared to one WT-hiPSC line from his unaffected mother. SMA-hiPSCs had a reduction in SMN1 transcript levels and were inefficient in differentiating into motor neurons. Phenotypically, SMA-neurons displayed a reduction in soma size and a reduction in SMN aggregates, known as gems, where the latter phenotype is known to inversely correlate with disease severity. Finally, the authors also demonstrated that two compounds known to increase SMN levels were able to increase the number of SMN aggregates in SMN-hiPSCs although not to WT levels and it was not shown whether the effect of these compounds also extended to neurons. These observations demonstrated for the first time that disease-specific phenotypes could be observed in patient-specific hipsc-derived cells in vitro thus validating the use of hipscs for disease modeling. Finally, it provided proof-of-principle results that compounds with known functions can be applied with the same effects in hipscs. Several reports have since demonstrated the use of patient-specific hipsc-derived cells for disease modeling in vitro and for validating small sets of drug candidates in those cells (Table 1.1). However, it was unknown whether hipsc-derived cells could be used to perform primary drug screens at a larger scale. In 2012, Studer and colleagues reported the first large-scale primary drug screen on hipscs generated from patients affected with Familial Dysautonomia (FD) (Lee et al., 2012), a neurodegenerative disorder affecting sensory and autonomic neurons. They previously reported the generation of FD-hiPSCs from patients, with mutations in I-k-B kinase complex-associated protein (IKBKAP), and identified multiple disease-specific phenotypes in FD-hiPSC derived neural crest (NC) precursors (Lee et al., 2009). These included low levels of WT IKBKAP transcripts, decreased expression of autonomic neuron markers, and reduced migratory propensity of FD-NC precursors. To perform drug screens, the authors first developed relevant conditions suitable for high-throughput screening (HTS) (Lee et al., 2012). This included largescale production of FD-NC precursors, which can be isolated using flow cytometry and plating at optimal densities for 384 well plates. Finally, the authors developed a method to measure WT IKBKAP transcript levels amenable to HTS as their disease-relevant readout. With a HTS assay established, 6,912 small molecules were screened and assayed to determine which compounds 21
38 rescued WT IKBKAP transcript levels in FD-NCs derived from one FD-hiPSC line in triplicate after a 48 hour treatment. From this primary screen, 43 hits were nominated as potential rescuers, but only 8 hits were followed up after validation by additional assays including doseresponse, cytotoxicity, and revalidation under standard 6 well plate conditions. Surprisingly, these eight hits showed heterogeneity in WT IKBKAP induction in different FD-hiPSC-derived cell types highlighting the importance of performing primary drug screens, and likely disease phenotyping, in the disease-relevant cell type. All eight compounds except for one had a rescue effect on WT IKBKAP transcript levels in FD-NCs derived from three FD-hiPSC lines from two FD patients, indicating the effects are generally not hipsc line or patient dependent. These eight hits were shown to increase both WT IKBKAP transcript and protein levels similar to those of WT-NCs derived from a single hesc or control hipsc line. However, despite a robust increase in WT IKBKAP expression by the eight hits, they did not rescue the decreased expression of autonomic markers seen in FD-NC precursors. Therefore, they treated the FD-NC precursors with the same eight hits, but with a longer treatment time of 28 days. With this protocol, significant increase in expression of autonomic markers was observed in FD-NC precursors; however, none of the eight hits were able to rescue the migratory defects observed in FD-NC precursors. The lack of rescue for this phenotype suggests that these hits may need to be further optimized in terms of concentration, length of treatment, and/or determining the critical window of differentiation at which treatment should be applied. Collectively, these results demonstrate the use of patient-specific hipsc-derived cells for large-scale primary drug screens by developing an assay amenable for HTS. The identification of hits via HTS needs to be thoroughly validated to demonstrate its potential therapeutic effect. This includes using the relevant cell type and optimizing different treatment parameters including length and concentration of the compounds. In summary, patient-specific hipscs can be derived from somatic cells derived from a wide range of affected individuals exhibiting a variety of diseases (Table 1.1). Patient-specific hipscs can be differentiated into the affected cell type in vitro and recapitulate known and uncover novel disease phenotypes in vitro. Proof-of-principle drug screens on small sets of drug candidates or large primary screens have demonstrated improvement of phenotypes in patientspecific hipsc-derived cell types which could lead to the identification of potential novel therapeutics. 22
39 Disease Genetic Defect Number of Patients (# of lines) Number of Controls - relationship (# of lines) Neuropsychiatric Schizophrenia Idiopathic 4 (1 each) 6 unrelated (1 each) Timothy Syndrome CACNA1C 2 (5 total) 3 unrelated (7 total) 1 22q11.2 deletion syndrome (1) 1 WT hesc (1) CACNA1C 2 (3 total) 2 unrelated (3 total) Fragile X FMR1 1 isogenic mutant via XCI (2) 1 isogenic control via XCI (2) Differentiated cell type (age) Mostly glutamatergic, GABAergic, with some dopaminergic neurons (1-3 months) Mixture of glutamatergic, GABAergic, and dopaminergic cortical neurons (21-22 days) Neurons (28-48 days) Glutamatergic neurons (4-5 weeks) 23 Disease-associated phenotypes neuronal connectivity, neurites, PSD95 protein, glutamate receptor expression Altered camp, WNT signaling Defects in calcium signaling, activitydependent gene expression, neuronal differentiation, tyrosine hydroxylase expression norepinephrine and dopamine Activitydependent dendritic retraction PSD95 protein, synaptic puncta, neurite length, amplitude/frequency of calcium transients, sustained Drug rescue (Y/N) Clozapine (N) Loxapine (Y) Olanzapine (N) Risperidone (N) Thioridazine (N) Nimodipine (N) Roscovitine (Y) N/A N/A Reference (Brennand et al., 2011) (Pasca et al., 2011) (Krey et al., 2012) (Liu et al., 2012b)
40 Disease Down Syndrome Genetic Defect Number of Patients (# of lines) Number of Controls - relationship (# of lines) Differentiated cell type (age) 24 Disease-associated phenotypes Drug rescue (Y/N) Reference glutamate-induced calcium elevation FMR1 3 (11 total) N/A N/A N/A N/A (Urbach et al., 2010) Chromosome 21 trisomy Neurodegenerative Frontotemporal GRN Dementia Sporadic Spinal Muscular Atrophy Machado- Joseph Disease Friedreich s Ataxia Familial Dysautonomia 1 (6) 1 isogenic control via chromosome loss (7) 2 (3 each) 1 unrelated (3 each) N/A Studied in hipscs Mostly glutamatergic with some GABAergic and dopaminergic neurons (2-4 weeks) SMN1 1 (1) 1 mother (1) Motor neurons (4-6 weeks) ATXN3 4 (2 each) 3 unrelated Mixture of (2 each) excitatory and 1 WT hesc inhibitory (1) neurons FXN 2 (8 total) 1 SMA patient (2) 1 WT hesc (1) IKBKAP 3 (2 each) 1 unrelated (2) (6-8 weeks) N/A Studied in hipscs NC precursors cell proliferation endothelial differentiation in vivo sensitivity to kinase inhibitors serine/threonine kinase motor neurons soma size L-glutamate induced SDSinsoluble ATXN3 containing aggregates Repeat instability mismatch repair enzymes occupying FXN WT IKBKAP neurogenic N/A N/A Genetic rescue by lentivirus Valporic Acid (Y) Tobramycin (Y) Calpain inhibitors - ALLN (Y) Calpeptin (Y) N/A Kinetin (Y) Epigallocatechin (Li et al., 2012) (Almeida et al., 2012) (Ebert et al., 2009) (Koch et al., 2011) (Ku et al., 2010) (Lee et al., 2009)
41 Disease Parkinson s Disease Genetic Defect Number of Patients (# of lines) Number of Controls - relationship (# of lines) IKBKAP 2 (3 total) 2 unrelated (1 each) 1 WT hesc (1) LRRK2 2 (1 each) 1 unrelated (1) LRRK2 1 (2) 1 unrelated (1) 1 WT hesc (1) LRRK2 Idiopathic 11 (11 total) PINK1 3 (5 total) 1 family member (2) Differentiated cell type (age) NC precursors NPCs Midbrain Dopaminergic neurons (35-60 days) 4 (4 total) Ventral Midbrain Dopaminergic neurons (75 days) Dopaminergic neurons 25 Disease-associated phenotypes differentiation, migration WT IKBKAP neurogenic differentiation, migration susceptibility to proteasomal stress nuclear envelope organization, clonal expansion, neuronal differentiation in passaged ( old ) NPCs oxidative stress response genes, α- synuclein protein, sensitivity to caspase-3 activation, stressinduced cell death neurites, arbourization autophagic vacuoles autophagosome clearance Parkin recruitment to mitochondria Drug rescue (Y/N) Gallate (N) Tocotrienol (N) Identified 8 hits out of 6,912 compounds LRRK2-In-1 (Y) Targeted correction by helper-adenoviral vectors Reference (Lee et al., 2012) (Liu et al., 2012a) Y (N) (Nguyen et al., 2011) N/A N/A Genetic rescue by (Sanchez- Danes et al., 2012) (Seibler et al., 2011)
42 Disease Alzheimer s Disease Genetic Defect Number of Patients (# of lines) Number of Controls - relationship (# of lines) α-synuclein 1 (1) 1 Targeted correction by zinc finger nuclease (1) Idiopathic 5 (13 total) 1 Dyskeratosis congenita carrier (2) 1 LNS carrier (2) LRRK2 APP Sporadic 2 (5 total) 1 mutation introduction into control hipsc by zinc finger nuclease (1) 4 unrelated (5 total) 2 Targeted correction by zinc finger nuclease (6 total) 4 (3 each) 2 - unrelated (3 each) Differentiated cell type (age) Disease-associated phenotypes Drug rescue (Y/N) Reference (42 days) mitochondria number, PGC-1α lentivirus Dopaminergic N/A N/A (Soldner neurons et al., (10 days) 2011) Dopaminergic neurons (8 days) Midbrain Dopaminergic neurons (30 days) Mixture of glutamatergic and GABAergic neurons (26-33 days) N/A N/A (Soldner et al., 2009) ERKphosphorylation, dopaminergic neurodegeneration Gene dysregulation amyloid-β(1-40), phospho-tau(thr 231), active glycogen synthase kinase-3β, RAB5 + early endosomes LRRK2-IN1 (Y) PD (Y) ϒ-secretase inhibitors CPD- E & DAPT) (N) β-secretase inhibitors βsi-ii & OM99-2) (Y) (Reinhardt et al., 2013) (Israel et al., 2012) 26
43 Disease Huntington s Disease Genetic Defect PS1 PS2 APP Sporadic Number of Patients (# of lines) Number of Controls - relationship (# of lines) 2 (2 each) 1 unrelated (1) 1 Parkinson s Disease patient (2) 4 (7 total) 3 unrelated (1 each) HTT 1 (1) 1 Targeted correction by homologous recombination (2) 1 unrelated (1) HTT 3 (5 total) 1 sister (1) 2 - unrelated (1 each) Differentiated cell type (age) Neurons (2 weeks) Cortical neurons (48 days) Astrocytes NPCs NPCs Inhibitory striatal neurons (14-72 days) Disease-associated phenotypes amyloid β42 secretion amyloid-β oligomers, endoplasmic reticulum and oxidative stress Altered Cadherin and TGF-β signaling cell death, caspase activity mitochondrial function Altered gene expression patterns spontaneous action potentials, cell metabolism, cell adhesion cell death, vulnerability to cellular stress, Drug rescue (Y/N) ϒ-secretase inhibitors CPD-E (Y) CPD-W (Y) Docosahexaenoic acid (Y) β-secretase inhibitors (Y) dibenzoylmethane (N) NSC23766 (N) N/A N/A Reference (Yagi et al., 2011) (Kondo et al., 2013) (An et al., 2012) (The Hd Ipsc, 2012) 27
44 Disease Genetic Defect Number of Patients (# of lines) Number of Controls - relationship (# of lines) HTT 3 (6 total) 2 unrelated (1 each) Differentiated cell type (age) Inhibitory striatal neurons (5-30 days) Disease-associated phenotypes Drug rescue (Y/N) Reference BDNF withdrawal lysosome activity N/A (Camnasio et al., 2012) Amyotrophic Lateral Sclerosis HTT 1 (1) 1 - unrelated (1) NPCs caspase activity N/A (Zhang et al., 2010) SOD1 1 (3) N/A Motor neurons N/A N/A (Dimos et (7-15 days) al., 2008) TDP43 3 (9 total) 5 unrelated Motor neurons (Egawa et (7 total) (38 days) al., 2012) insoluble mutant TDP43 cytosolic aggregates, RNA metabolism genes, oxidative stressinduced cell death neurites, cytoskeletal genes Trichostatin A (N) Spliceostatin (N) Anacardic acid (Y) Garcinol (N) Cardiac LEOPARD Syndrome VAPB 2 (1 each) 2 siblings (1 each) PTPN11 2 (2 each) 1 - unaffected brother of one of the patients (1) 1 - unrelated (1) 2 - WT hesc Motor neurons (3-4 weeks) 28 VAPB protein N/A (Mitne- Neto et al., 2011) Cardiomyocytes Cell size Sarcomeric organization Nuclear NFATC4 N/A (Carvajal- Vergara et al., 2010)
45 Disease Type II Long QT Syndrome Genetic Defect Number of Patients (# of lines) Number of Controls - relationship (# of lines) (1 each) KCNH2 1 (3) 2 - unrelated (1 each) Differentiated cell type (age) Disease-associated phenotypes Cardiomyocytes Cardiac potassium current Arrhythmogenicity Drug rescue (Y/N) Nifedipine (Y) Pinacidil (Y) Ranolazine (Y) Reference (Itzhaki et al., 2011) Arrhythmogenic right ventricular dysplasia Type I Long QT Syndrome Timothy Syndrome PKP2 2 (5 total) 2 unrelated (1 each) 1 - WT hesc (1) KCNQ1 1 (3 each) 1 unrelated (3 each) CACNA1C 2 (5 total) 2 unrelated (5 total) Cardiomyocytes Abnormal plakoglobin nuclear translocation β-catenin activity Lipogenesis and apoptosis Calcium-handling deficits Cardiomyocytes Potassium current Altered channel activation and deactivation properties Catecholamineinduced tachyarrhythmia Cardiomyocytes Irregular contraction, electrical activity, and calcium transients Ca 2+ influx Prolonged action potentials 29 N/A Genetic rescue by lentiviral vectors Propanolol (Y) Roscovitine (Y) (Kim et al., 2013) (Moretti et al., 2010) (Yazawa et al., 2011)
46 Disease DNA Repair Fanconi Anaemia Premature Aging Dyskeratosis Congenita Hutchison- Gilford Progeria Syndrome Genetic Defect FANCA FANCD2 DKC1 TERC TERT TCAB1 DKC1 Number of Patients (# of lines) 2 after genetic correction by lentivirus (6 total) 3 (4 lines total) 5 (9 lines total) Number of Controls - relationship (# of lines) Corrected hipscs 1 - unrelated (1) 1 - WT hesc (1) Genetic correction of DKC1 with TERT & TERC by retrovirus (1) 3 unrelated (1 line each) LMNA 1 (1) 1 unrelated (1) Differentiated cell type (age) Haematopoietic progenitors N/A Studied in hipscs N/A Studied in hipscs Smooth muscle cells 30 Disease-associated phenotypes N/A Confirmed corrected cells are disease free N/A Telomere elongation preserved N/A Telomere elongation disrupted progerin Premature senescence ( telomere length, cell proliferation, misshapen nuclei, senescence transcripts, senescence Drug rescue (Y/N) N/A N/A N/A N/A Reference (Raya et al., 2009) (Agarwal et al., 2010) (Batista et al., 2011) (Liu et al., 2011a)
47 Disease Genetic Defect Number of Patients (# of lines) Number of Controls - relationship (# of lines) Differentiated cell type (age) Disease-associated phenotypes associated β- galactosidase) Drug rescue (Y/N) Reference LMNA 1 (1) Targeted correction by helperdependent adenoviral vector. Smooth muscle cells progerin Premature senescence ( misshapen nuclei, senescence associated β- galactosidase) N/A (Liu et al., 2011b) LMNA 2 (2 each) 2 parents (2 each) Fibroblasts NPCs Endothelial Mesenchymal stem cells Smooth muscle cells progerin DNA damage, nuclear abnormalities, calponin-staining inclusion bodies, susceptibility to stress N/A (Zhang et al., 2011) Table 1.1 Summary of hipsc disease models A summary of representative hipsc disease models. The table summarizes: the number of patients and controls used for disease phenotyping (i.e. not just reprogrammed), including their relationship to the patient; the number of hipsc lines (in brackets) used for phenotyping (when applicable); the differentiated cell type in which phenotyping was performed and resultant phenotype and the age (for neurons only, post NPC stage) at which phenotyping was done; drug rescue (when applicable) and whether it was successful (Y) or not (N). 31
48 HiPSC disease models of RTT At the start of my graduate studies, patient-specific hipscs from RTT, or any, patients did not exist. I eventually became the first to report the generation of RTT-hiPSCs (Hotta et al., 2009a; Hotta et al., 2009b) (described in chapter two). However, the first report of disease modeling using RTT-hiPSC-derived neurons was reported by Muotri and colleagues (Marchetto et al., 2010) immediately prior to the report described in chapter two of this thesis (Cheung et al., 2011). For the purposes of the introduction, I will only discuss the report by Muotri and colleagues on disease modeling using RTT-hiPSCs (Marchetto et al., 2010). They generated one to three RTT-hiPSC lines from each of four RTT patients harbouring deletion, nonsense, or missense mutations in MECP2 and five unrelated individuals as controls. RTT-hiPSCs were differentiated into neurons containing a mixture of glutamatergic and GABAergic neurons. RTT-hiPSC-derived neurons exhibited neuronal maturation defects as they had fewer glutamatergic synapses, a reduction in dendritic spine density, and a smaller soma size. RTThiPSC-derived neurons also exhibited a decreased frequency of calcium oscillations and a decrease in percentage of neurons exhibiting calcium transients suggesting a deficiency in the neuronal network connectivity and activity dynamics. This deficiency in neuronal network was further corroborated by a decrease in frequency and amplitude of spontaneous excitatory and inhibitory postsynaptic currents (ExPSCs and InPSCs, respectively) in these neurons. Finally, phenotypes exhibited by RTT-hiPSC-derived neurons can be rescued by IGF1, which was previously shown to improve RTT symptoms in Mecp2 mouse models (Tropea et al., 2009), and by gentamicin, a compound that disrupts the proofreading ability of ribosomes allowing the production of full length MECP2 despite the presence of nonsense mutations (Marchetto et al., 2010). Altogether, this study provides proof-of-principle that RTT-hiPSCs can be differentiated into neurons in vitro where RTT can be modeled and validate small sets of drug candidates. Since this report, the generation of RTT-PSC models has been an area of intense interest epitomized by the results presented in this thesis (Cheung et al., 2011) (described in chapter two) and from others and will be further discussed in the discussion in chapter four (section 4.5). However, one other aspect of RTT-hiPSC that was investigated by Muotri and colleagues was the XCI status of RTT-hiPSCs (Marchetto et al., 2010). Surprisingly, the XCI status of the RTThiPSCs was inconsistent with a prior report (Tchieu et al., 2010) and will be discussed later in this chapter (section 1.4.6). 32
49 Issues relating to hipscs Transcription-factor mediated reprogramming is hailed as the holy grail of stem cell research as it allows the generation of personalized hpscs from somatic cells of individuals without the ethical issues surrounding the need for human embryos. However, there are also potential issues relating to the use of hipscs. Most of these issues surround the safety and potential use of hipscs in cell replacement therapy, namely the risk of tumourigenicity of hipscs (Ben-David and Benvenisty, 2011). For hipscs to be safe for future patient use, they must carry a stable genetic- and epigenetic-content as genomic- and epigenomic-instability are hallmarks of tumourigenesis (Hanahan and Weinberg, 2011; Lund et al., 2012). Disturbingly, the process of reprogramming often lends itself to the accumulation of genetic abnormalities in the genome including chromosomal aberration, copy number variations (CNVs), and coding mutations (Abyzov et al., 2012; Gore et al., 2011; Hussein et al., 2011; Laurent et al., 2011; Martins-Taylor et al., 2011; Mayshar et al., 2010; Taapken et al., 2011), as well as, aberrant epigenomic reprogramming resulting in variations in the epigenome of hipscs (Bar-Nur et al., 2011; Bock et al., 2011; Doi et al., 2009; Lister et al., 2011; Nazor et al., 2012; Ohi et al., 2011). Furthermore, differences observed in gene expression analysis between hipscs and hescs have also questioned their equivalence (Chin et al., 2009; Chin et al., 2010; Ghosh et al., 2010; Guenther et al., 2010; Marchetto et al., 2009; Newman and Cooper, 2010). The generation of hipscs is most often performed by transduction of pluripotencyassociated transcription factors, many of which are associated with oncogenesis (Ben-David and Benvenisty, 2011). Indeed, reactivation of c-myc has been associated with tumourigenicity in mipsc-derived chimeric mice (Okita et al., 2007). Furthermore, use of integrating viral vectors can dysregulate endogenous genes, such as proto-oncogenes, resulting in cancer (Hacein-Bey- Abina et al., 2003). Although, some transcription factors can be removed and/or substituted pharmacologically (Giorgetti et al., 2009; Huangfu et al., 2008; Kim et al., 2009b; Li et al., 2009a; Nakagawa et al., 2008; Zhu et al., 2010), a complete pharmacological-based reprogramming method has yet to be derived (Feng et al., 2009). An alternative method is to deliver the factors using non-integrating methods that do not disrupt the genome. To this end, non-integrating viral vectors (Fusaki et al., 2009; Seki et al., 2010; Zhou and Freed, 2009), episomal vectors (Okita et al., 2011; Yu et al., 2009), minicircle vectors (Jia et al., 2010), and/or mrna- (Warren et al., 2010), mirna- (Miyoshi et al., 2011), or protein- (Kim et al., 2009a) based reprogramming methods have been derived for hipscs although these methods are 33
50 generally inefficient and/or labour intensive. Finally, the pluripotent nature of hipscs lends itself to being tumourigenic as demonstrated by the formation of teratomas when injected into immunodeficient mice (Takahashi et al., 2007; Yu et al., 2007). Therefore, tumourigenicity is a considerable risk as directed differentiation protocols of hipscs are not completely efficient resulting in residual hipscs within mixed populations of differentiated cells. To circumvent this, it is possible to purge residual hpscs using biomarkers (Tang et al., 2011; Wang et al., 2011), suicide genes (Zhong et al., 2011), or hpsc-specific inhibitors (Ben-David et al., 2013). Collectively, these studies indicate that there are still many issues relating to the use of hipsc technology in the clinic including genomic and epigenomic abnormalities, effective methods to generate hipscs without permanent genomic alterations, effective directed differentiation protocols, and methods to remove residual hipscs. Surprisingly, the assumed immune-tolerance of hipscs for autologous cell transplantation has also been called into question as there are contradicting studies regarding mipscs ability to elicit an immune response when transplanted into syngeneic mice (Guha et al., 2013; Zhao et al., 2011). For these reasons, I propose that one of the immediate uses of hipscs is to serve as a source for generating human differentiated cells from affected patients for disease modeling. Indeed, the majority of patient-specific hipscs used for the purpose of disease modeling has been generated using the retroviral or lentiviral approach indicating that this method of reprogramming is suitable for disease modeling (Bellin et al., 2012) X-Chromosome Inactivation A complexity of the RTT story is that the MECP2 gene is located on the X-chromosome and is influenced by XCI. XCI is the mammalian strategy to equalize X-linked gene dosage between XX females and XY males and involves transcriptional silencing of the majority of genes on one X-chromosome in females (Escamilla-Del-Arenal et al., 2011; Lyon, 1961; Yang et al., 2011). This process initiates early in development in the embryo proper around the time of implantation. At its onset, XCI is random and either the maternally- or paternally-inherited X- chromosome is silenced in each cell. Subsequently, the chosen X-chromosome remains as the inactive X-chromosome (Xi) throughout all future cell divisions (Escamilla-Del-Arenal et al., 2011). 34
51 Mediators of XCI Regulation of XCI in both the human and mouse requires the presence in cis of XIST, a 17 kb non-coding RNA (ncrna) located in the X-inactivation centre (Xic) (Brockdorff et al., 1991; Brockdorff et al., 1992; Brown et al., 1991a; Brown et al., 1992; Brown et al., 1991b; Marahrens et al., 1997; Penny et al., 1996). XIST is only expressed from the Xi and its RNA product closely associates with or coats the chromosome (Brown et al., 1991a; Brown et al., 1992; Clemson et al., 1996). Therefore, a key developmental event is to upregulate Xist from the future Xi. Both cis and trans-acting factors have been identified in mouse through the use of transgenes and targeted deletions (Barakat et al., 2011; Donohoe et al., 2009). In cis Xist is positively and negatively regulated by adjacent sequences and transcripts that include at least four ncrnas (Augui et al., 2007; Barakat et al., 2011; Debrand et al., 1999; Lee et al., 1999; Ogawa and Lee, 2003; Tian et al., 2010; Zhao et al., 2008). Perhaps the best characterized negative regulator is Tsix, an ncrna antisense to Xist (Lee et al., 1999). While XIST is conserved between human and mouse, at least some events at the onset of XCI must differ between the species, as most ncrnas including TSIX are poorly conserved (Chureau et al., 2002; Migeon et al., 2002). Upon Xist upregulation, the Xi is heavily epigenetically remodeled, in many ways similar to other silenced genes throughout the genome. Epigenetic marks associated with the Xi include CpG island promoter DNA methylation (Hellman and Chess, 2007; Sharp et al., 2011), incorporation of histone variant MacroH2A (Costanzi and Pehrson, 1998), and modification of core histones (de Napoles et al., 2004; Keohane et al., 1996; Kohlmaier et al., 2004). An early event that follows XIST accumulation is the recruitment of the polycomb complex PRC2 and enhancer of zeste homolog 2 (EZH2) that induces histone H3 trimethylation at lysine 27 (H3K27me3) (Marks et al., 2009; Plath et al., 2003; Silva et al., 2003). Other epigenetic features, such as DNA methylation, accumulate later and are important in the maintenance of XCI. Altogether these many alterations function with XIST to create a silenced nuclear compartment (Chow et al., 2010) that is spatially sequestered to the periphery of the nucleus and is cytologically recognizable as the darkly staining Barr body (Barr and Bertram, 1949) XCI in the Mouse Pluripotent System To understand the relationship between XCI and pluripotent stem cells (PSCs), it is important to consider the XCI status of multiple PSC systems such as hipscs, hescs, mipscs, 35
52 and mescs, and how they compare to their in vivo counterparts (Fan and Tran, 2011; Minkovsky et al., 2011; van den Berg et al., 2011). At around e3.5 of mouse embryogenesis, preimplantation epiblast cells carry two active X-chromosomes (Xa) (Gardner and Lyon, 1971). Subsequently, random XCI ensues and is completed by around e5.5 in postimplantation epiblast cells (Gardner and Lyon, 1971; Rastan, 1982; Takagi et al., 1982). Xist RNA is expressed at low levels on both Xa until random XCI ensues in which the Xa represses Xist RNA expression while the Xi increases the stabilization of Xist RNA followed by upregulation of XCI markers such as H3K27me3 (Mak et al., 2004; Panning et al., 1997; Penny et al., 1996; Sheardown et al., 1997). Consistently, mescs isolated from the preimplantation epiblast cells of the blastocyst at e3.5 carry two Xa, expressing Xist RNA in a biallelic manner at low levels followed by random XCI upon differentiation with similar Xist RNA patterns described in vivo (Lee et al., 1999; Panning and Jaenisch, 1996; Penny et al., 1996; Sheardown et al., 1997). Similarly, the generation of mipscs is accompanied by X-chromosome reactivation (XCR) of the Xi in the founder somatic cell and hence mipscs carry two Xa followed by random XCI upon differentiation (Farra et al., 2012; Maherali et al., 2007; Stadtfeld et al., 2008). This indicates that the generation of mipscs involves the complete erasure of XCI. Finally, PSCs known as mepiscs have been isolated from the postimplantation epiblast at around e5.5 (Brons et al., 2007; Tesar et al., 2007). MEpiSCs carry an Xi similar to their in vivo counterpart in which random XCI has already ensued (Guo et al., 2009) XCI in the Human Pluripotent System in vivo Studies of XCI in human embryos are much more limited than in mouse, but intriguingly suggest differences in XCI timing and XIST RNA expression (Okamoto et al., 2011; van den Berg et al., 2009). Unlike mouse, XIST RNA is upregulated in preimplantation blastocysts (Okamoto et al., 2011; van den Berg et al., 2009). The role of XIST RNA association in XCI at this early time point is not yet clear as two studies have shown different results; female preimplantation blastocysts had monoallelic XIST RNA upregulation and XCI hallmarks in one study (van den Berg et al., 2009), whereas another reported XIST RNA accumulation from all X- chromosomes, males and females, without gene silencing (Okamoto et al., 2011). Whether such heterogeneity exists between different human embryos or variability is introduced upon culturing, it appears that human XIST RNA coating and XCI are not strictly coupled. 36
53 XCI in the Human Pluripotent System in vitro HESCs are isolated from the preimplantation epiblast cells of the human blastocysts (Reubinoff et al., 2000; Thomson et al., 1998) and similar to the variability in XCI status observed in vivo, the XCI status of hescs is also highly variable (Adewumi et al., 2007; Dhara and Benvenisty, 2004; Diaz Perez et al., 2012; Dvash et al., 2010; Enver et al., 2005; Hall et al., 2008; Hoffman et al., 2005; Liu and Sun, 2009; Shen et al., 2008; Silva et al., 2008; Vallot et al., 2013). The XCI status of hescs and can be categorized into three classes as proposed by Lee and colleagues (Silva et al., 2008). Class I hescs are in a pre-xci state, express X-linked genes in a biallelic fashion, lack XCI marks such as XIST RNA and H3K27me3, and initiate XCI upon differentiation accompanied by upregulation of the same marks (Dhara and Benvenisty, 2004; Diaz Perez et al., 2012; Dvash et al., 2010; Hall et al., 2008; Silva et al., 2008). The most defining feature of class I hescs is initiation of random XCI upon differentiation, resulting in random monoallelic expression of X-linked genes (Dhara and Benvenisty, 2004). To date, few class I hescs have been isolated using conventional hesc conditions in atmospheric oxygen concentrations (20% O 2 ) and basic fibroblast growth factor (bfgf) and knockout serum replacement (KOSR) (Dhara and Benvenisty, 2004; Diaz Perez et al., 2012; Dvash et al., 2010; Hall et al., 2008; Silva et al., 2008). Most hescs have initiated XCI and thus are in a post-xci state that can be subdivided according to the presence (class II) or absence (class III) of XCI marks such as XIST RNA and H3K27me3 (Diaz Perez et al., 2012; Dvash et al., 2010; Hall et al., 2008; Hoffman et al., 2005; Liu and Sun, 2009; Shen et al., 2008; Silva et al., 2008). Class II hescs carry an Xi with a nonrandom skewing pattern resulting in nonrandom monoallelic expression of X-linked genes (Hall et al., 2008; Hoffman et al., 2005; Liu and Sun, 2009; Shen et al., 2008; Silva et al., 2008). This is likely due to clonal expansion of cells with one of the parental X-chromosomes inactivated (Liu and Sun, 2009). Class III hescs can also retain an Xi despite the absence of such XCI marks which highlights that XCI marks are not an accurate evaluation of XCI status in hescs (Diaz Perez et al., 2012; Shen et al., 2008; Silva et al., 2008). The uncoupling of XCI marks and the XCI status of hescs could be explained by the fact that some of these marks, such as XIST and H3K27me3, are required only during the initiation, but not the maintenance, of XCI (Brown and Willard, 1994; Csankovszki et al., 1999; Plath et al., 2003; Silva et al., 2003; Wutz and Jaenisch, 2000). Mechanistically, the Xi is maintained transcriptionally silent by redundant mechanisms 37
54 such as DNA methylation in the absence of XCI marks such as Xist (Csankovszki et al., 2001). Although most genes stay silenced in class III hescs, previously silenced X-linked genes may reactivate on a small scale accompanied by DNA hypomethylation of their promoters (Dvash et al., 2010; Shen et al., 2008). However, reactivation may also occur on a much larger scale with entire regions of the X-chromosome arms being reactivated resulting in partial-xci (Bruck and Benvenisty, 2011). A defining feature of class III hescs is that they have already initiated XCI despite having lost the XCI marks. Therefore, they cannot initiate XCI again and do not upregulate XCI marks upon differentiation (Diaz Perez et al., 2012; Dvash et al., 2010; Shen et al., 2008; Silva et al., 2008). HESCs with these three classes of XCI are hypothesized to be in a continuum and interrelated (Diaz Perez et al., 2012; Silva et al., 2008). It is thought that class I hescs represent the most pristine PSCs present in the human blastocysts which contains two Xa (Okamoto et al., 2011). However, the culturing of class I hescs can result in a spontaneous transition into class II hescs in which XCI initiates and upregulates XCI marks (Silva et al., 2008). Class II hescs, upon culture and/or cellular stresses, such as freeze/thaw cycles, can also lose XCI marks, such as XIST RNA and repressive chromatin marks, and thus transition into class III hescs (Diaz Perez et al., 2012; Dvash et al., 2010; Hall et al., 2008; Shen et al., 2008; Silva et al., 2008). Altogether, these results suggest that the XCI status of hescs is subjected to extensive epigenetic fluidity with respect to XCI. For the purpose of this thesis, I opt to categorize hpscs as either pre-xci or post-xci except when describing literature that specifically uses the class I, II, III nomenclature. Pre-XCI hpscs are identical to Class I hpscs and carry two Xa without any signs of XCI initiation. Upon differentiation, pre-xci hpscs will initiate XCI and upregulate XCI marks in a random pattern resulting in random monoallelic expression of X-linked genes. Post-XCI hpscs encompass both class II and III hpscs in that they have already initiated the process of XCI and carry an Xi regardless of the presence (class II) or absence (class III) of XCI marks. Differentiation of post-xci hpscs will yield a nonrandom XCI skewing pattern resulting in a nonrandom monoallelic expression of X-linked genes. The largely post-xci state of hescs may be explained by the fact that they are thought to represent a cell type that is developmentally later than mescs (Nichols and Smith, 2009; Rossant, 2008; Silva and Smith, 2008). It is thought that although hescs are isolated from the preimplantation epiblast of the blastocyst, where there could be two Xa (Okamoto et al., 2011), they may in fact represent cells of the postimplantation epiblast where XCI has likely ensued as 38
55 in the murine postimplantation epiblast (Rastan, 1982; Takagi et al., 1982). This is supported by the fact that hescs are more similar to the murine in vitro counterpart of the postimplantation epiblast, mepiscs, than the murine in vitro counterpart of the preimplantation epiblast, mescs. The pluripotent state of mescs is maintained by cytokines including leukemia inhibitory factor (LIF) and BMP4 (Rossant, 2008). On the other hand, hescs, similar to mepiscs, are maintained by FGF and activin/nodal signaling. Furthermore, gene expression profiling reveals similarities between hescs and mepiscs, but distinct from mescs (Tesar et al., 2007). Therefore it is not surprising that hescs are mostly in a post-xci state similar to mepiscs (Guo et al., 2009) Conversion of mpscs and hpscs to the naïve state To explain why hescs isolated from the preimplantation epiblast would more closely resemble cells isolated from the postimplantation epiblast, it is important to consider that upon isolation, they are not frozen in developmental time in culture (Nichols and Smith, 2009). Indeed, it may be unnatural for hescs (or mescs) to expand in a pre-xci state as this does not occur in development (Hall et al., 2008). Therefore, hescs may preferentially undergo XCI during derivation and expansion. On the other hand, female mescs appear to utilize a different strategy to accommodate for two Xa by frequently losing one X-chromosome (Zvetkova et al., 2005). Therefore, although hescs may have a pre-xci status during their isolation, they may continue to progress into the postimplantation epiblast stage (representative of mepiscs) and become post-xci. To distinguish these two pluripotent stages, mescs are classified to be in a naïve state, whereas mepiscs (and likely hescs) are classified to be in a primed state (Nichols and Smith, 2009; Silva and Smith, 2008). Further evidence that these two stages are biologically relevant comes from experiments that show mescs and mepiscs are distinct states that can be converted between one another. When cultured in conditions consisting of small molecules (known as the 2i cocktail) that inhibit FGF stimulation of mitogen-activated protein kinases Erk1/2 and constitutive activity of glycogen synthase kinase-3, mescs are maintained in the most pristine naïve state of pluripotency (Ying et al., 2008). On the other hand, mescs can be differentiated into mepiscs when placed in the culture conditions of the latter resulting in XCI while introduction of a Klf4 transgene and growth in 2i conditions can convert mepiscs back to a naïve state reminiscent of mescs resulting in XCR (Guo et al., 2009). Altogether, these 39
56 studies suggest that the external milieu to which PSCs are exposed has a significant impact on their pluripotent state and their XCI status. Since the identification of optimal conditions for naïve pluripotency for mescs and the hypothesis that hescs may be more similar to mepiscs, attempts have been made to define conditions to isolate hescs in a more naïve state of pluripotency in order to derive hescs equivalent to mescs. One approach that was examined was the isolation of hescs under physiological oxygen concentrations (5% O 2 ) (Lengner et al., 2010). It was proposed that the atmospheric oxygen concentration (20% O 2 ), in which conventional propagation of hescs is performed is hyperoxic in comparison to the blastocyst in vivo, and may represent a suboptimal culture condition for hescs. Indeed, pre- and post-xci hescs were derived from embryos in 5% and 20% O 2, respectively. Pre-XCI hescs were capable of initiating random XCI while post-xci hescs exhibited a nonrandom monoallelic expression pattern. Most interestingly, pre- XCI hescs readily initiated XCI when exposed to 20% O 2 or cellular stress (such as freeze/thaw) suggesting that conventional hesc culture conditions (i.e. 20% O 2 ) and other cellular stresses are detrimental for capturing and maintaining hescs in a pre-xci state. However, this approach is impractical as it requires the isolation of new hesc lines since culturing established post-xci hescs, normally cultured in 20% O 2, back in 5% O 2 did not result in XCR. To that end, it was found that primed hescs can be converted to naïve hescs by, 1) continuous expression of reprogramming transgenes with defined conditions including 2i and LIF (Buecker et al., 2010; Hanna et al., 2010) or, 2) treatment with small molecules such as, Forskolin, a protein kinase A pathway agonist which induces the expression of KLF4 and KLF2 (Hanna et al., 2010), or Sodium Butyrate (SB), an HDAC inhibitor, and/or 3-deazaneplanocin A (DZNep), an EZH2 inhibitor (Diaz Perez et al., 2012; Ware et al., 2009). The converted naïve hescs had a pre-xci status but reverted back to a primed state when placed back in conventional hesc conditions, demonstrating that the naïve and primed states are interchangeable in hescs when given the correct environmental cues (Diaz Perez et al., 2012; Hanna et al., 2010). In summary, these results suggest that pre-xci hescs can be isolated directly from embryos or by converting from primed hescs. However, suboptimal culture conditions prevent facile maintenance of naïve hescs in a pre-xci state (Diaz Perez et al., 2012; Hanna et al., 2010; Lengner et al., 2010). Hence, hescs continue to progress along the developmental timeline to stabilize in a primed state as post-xci hescs (Nichols and Smith, 2009). 40
57 Early studies of XCI in hipscs At the start of my graduate studies, the XCI status of female hipscs was unknown. The first report to investigate the XCI status of female hipscs was by Plath and colleagues (Tchieu et al., 2010). They found that most female hipscs in their study were post-xci as indicated by the presence of XIST RNA and enrichment of the polycomb repressive complex EZH2 detected by immunocytochemistry (ICC), which mediates enrichment of H3K27me3, and depletion of active histone marks, histone H3 acetylation at lysine 18 (H3K18ac) and histone H3 trimethylation at lysine 4 (H3K4me3), from the Xi. Furthermore, post-xci hipscs expressed the X-linked genes XIST, ATRX, and PDHA1 in a nonrandom monoallelic fashion revealed by allele-specific SNP analysis. This suggests that during reprogramming, hipscs inherit the Xi from the founder somatic cell. Post-XCI hipscs were prone to losing XCI marks such as XIST RNA, EZH2, macroh2a1, and histone H4 monomethylation at lysine 20 (H4K20me1) upon extended passaging. However, these hipscs retained a transcriptionally silent Xi. This reiterates that evaluation of XCI marks such as XIST RNA and chromatin marks and their mediators is not sufficient to determine XCI status in hpscs (Diaz Perez et al., 2012; Lengner et al., 2010; Shen et al., 2008; Silva et al., 2008). Finally, these data suggest that the nonrandom XCI nature of female hipscs can be exploited to generate mutant (expressing mutant protein) and isogenic control (expressing WT protein) hipscs from the same individual carrying heterozygous mutations in X-linked genes. Indeed, the authors isolated isogenic control and mutant hipscs from Duchenne Muscular Dystrophy (DMD) carriers with a heterozygous mutation in the X- linked DYSTROPHIN gene (Tchieu et al., 2010). The second report to investigate XCI status of female hipscs was by Muotri and colleagues who investigated the XCI status of RTT-hiPSCs due to the X-linked nature of MECP2 (Marchetto et al., 2010). To evaluate the XCI status of RTT-hiPSCs, they performed XIST RNA-FISH and H3K27me3 ICC. They reported both pre- and post-xci RTT-hiPSCs based on the absence or presence of these XCI marks, respectively, in which the former was the focus for the rest of their study. Their pre-xci RTT-hiPSCs initiated XCI upon differentiation into neurons as they induced the expression of XIST RNA and H3K27me3. To determine whether there was random XCI, the authors focused on RTT-hiPSCs from a patient carrying an 1155del32 mutation which results in a truncated MECP2 protein. By using a C-terminus MECP2 antibody, they could distinguish between the WT and mutant protein via ICC. The pre- XCI RTT-hiPSCs were homogeneously MECP2 positive, suggesting biallelic expression of 41
58 MECP2 as expected for two Xa. When pre-xci RTT-hiPSCs were differentiated into neurons, there was a mosaic expression of MECP2-positive and -negative neurons. Furthermore, western blot analysis of pre-xci RTT-hiPSC-derived neurons showed a reduction in MECP2 protein levels. Based on these findings, the authors concluded that pre-xci RTT-hiPSCs initiate random XCI upon differentiation. However, analysis of XCI skewing patterns by the androgen receptor (AR) assay revealed that the pre-xci RTT-hiPSC-derived neurons showed extreme skewing (96:4 to 98:2) which I interpret to be inconsistent with random XCI. Thus, the neurons preferentially inactivated the AR gene on one parental X-chromosome but not randomly as would be expected. In summary, these early studies have set up a seemingly contradictory stance in the field regarding the XCI status of female hipscs. One reports female hipscs inherit the Xi present in the donor fibroblasts and are post-xci (Tchieu et al., 2010) while the other reports reprogramming is accompanied by XCR such that some resultant female hipscs can be pre-xci (Marchetto et al., 2010). Since these early reports, the status of XCI in female hipscs has been an intensive area of research including the results presented in this thesis (Cheung et al., 2011) (described in chapter two) and others and will be further discussed in the discussion chapter (section 4.3). 42
59 1.5. Outline, Rationale, and Hypothesis of Thesis At the start of my graduate studies, RTT and Mecp2 function were most widely studied using Mecp2 mutant mouse models (Chen et al., 2001; Guy et al., 2001; Shahbazian et al., 2002a). Although, Mecp2 mutant mouse models recapitulate key characteristics associated with RTT patients including an initial phase of apparently normal development followed by severe neurodevelopmental dysfunction, there is evidence that mouse models are an underrepresentation of the human condition. Mecp2 -/y mice are viable whereas the equivalent mutation in human males is associated with severe congenital encephalopathy and early death (Hardwick et al., 2007; Schanen and Francke, 1998; Schanen et al., 1998; Schule et al., 2008; Villard et al., 2000; Wan et al., 1999; Zeev et al., 2002). Disease onset in Mecp2 +/- female RTT mouse models is during adulthood whereas disease onset in female RTT patients carrying heterozygous MECP2 mutations is during childhood. This could be due to the fact that RTT mouse models exhibit unbalanced XCI favouring the expression of WT Mecp2 whereas in RTT patients, balanced XCI is the norm (Amir et al., 2000; Shahbazian et al., 2002c; Young and Zoghbi, 2004). Postmortem brain tissues from RTT patients have also been used for understanding the pathogenesis of RTT (Armstrong, 2005). However, the small number of samples limits these studies and does not allow the study of RTT during the asymptomatic stages. Furthermore, access to these tissues for research is severely limited. For these reasons, a method that will allow the generation of large numbers of affected neurons directly from RTT patients will be advantageous to further understand the pathogenesis of RTT and the role of MECP2 and its isoforms in human neurons. In this thesis, I propose to establish a novel human in vitro model of RTT by taking advantage of hipsc technology (Figure 1.4). The working hypothesis is: RTT can be characterized by reprogramming patient fibroblasts into hipscs for in vitro phenotyping of differentiated neurons. In chapter two, I investigated whether hipscs can be generated from RTT patients, and if so, whether they can be differentiated into neurons in vitro for disease modeling and hence establish a novel in vitro model of RTT. This was significant as at the beginning of my graduate studies, there were no evidence to demonstrate that hipscs can be generated from patients affected by a disease with (or without) a genetic defect. Furthermore, application of hipscs in disease modeling was unknown. In the latter part of chapter two, I investigated the XCI status of RTT-hiPSCs. This was critical as the XCI status of female hipscs was inconsistent at the time (and remains so to date) as two prior studies reported 43
60 contradictory results (Marchetto et al., 2010; Tchieu et al., 2010). The X-linked nature of MECP2 in RTT-hiPSCs and the inconsistency in the field prompted me to investigate the XCI status in the RTT-hiPSCs. In chapter three, I aimed to study isoform-specific functions of MECP2, specifically, whether lack of the MECP2e1 isoform alone is sufficient for a RTT cellular phenotype. To achieve this, I took advantage of RTT-hiPSCs generated from a RTT patient with a mutation specifically affecting MECP2e1 but not MECP2e2. In summary, this thesis provides proof-of-principle and demonstrates that RTT-hiPSCs can serve as an alternative and novel human in vitro model to study RTT and the function of MECP2 and its isoforms in human neurons. Serendipitously, the RTT-hiPSCs reported in this thesis also offered critical insights into the XCI status of female hipscs. 44

61 Figure 1.4 RTT can be characterized by reprogramming patient fibroblasts into hipscs for in vitro phenotyping of differentiated neurons In this thesis, I propose to establish a novel human in vitro model of RTT by taking advantage of hipsc technology. I will reprogram RTT-fibroblasts acquired from RTT patients carrying heterozygous mutations in MECP2. RTT-hiPSCs will be generated by retroviral transduction of OCT4, SOX2, KLF4, and c-myc into RTT-fibroblasts. RTT-hiPSCs will then be differentiated into neurons where disease phenotyping can be performed. 45
62 Chapter 2 2. Isolation of MECP2-null Rett Syndrome patient hipscs and isogenic control through X-chromosome inactivation The data described in this chapter is published in the following primary articles: Hotta A, Cheung AYL, Farra N, Vijayaragavan K, Séguin CA, Draper JS, Pasceri P, Maksakova IA, Mager DL, Rossant J, Bhatia M, Ellis J. Isolation of human ips cells using EOS lentiviral vectors to select for pluripotency. Nature Methods 6 (5), (2009). Hotta A, Cheung AYL, Farra N, Garcha K, Chang WY, Pasceri P, Stanford WL, Ellis J. EOS lentiviral vector selection system for human induced pluripotent stem cells. Nature Protocols 4 (12), (2009). Cheung AYL, Horvath LM, Grafodatskaya D, Pasceri P, Weksberg R, Hotta A, Carrel L, Ellis J. Isolation of MECP2-null Rett Syndrome patient hips cells and isogenic controls through X- chromosome inactivation. Human Molecular Genetics 20 (11), (2011). Author contributions: A.Y.L.C performed the following experiments: genotyping of MECP2 mutation in RTTfibroblasts and hipscs (Figure 2.1, 2.3); generation and characterization of RTT-hiPSCs (Figure , 2.11); XCI analysis of RTT-fibroblasts, -hipscs, and neurons (Figure 2.13, , 2.21); differentiation of RTT-hiPSCs into neurons and subsequent phenotyping (Figure 2.19, 2.20, 2.22). A.Y.L.C wrote and finalized the manuscript in Cheung et al., (2010). A.Y.L.C provided data and edited the manuscript in Hotta et al., (2009a, 2009b). The following were aided by the following members: expansion of Δ3-4-fibroblasts from skin punch biopsy (Tadeo Thompson, Technician, Dr James Ellis lab), potential genetic mechanism underlying the Δ3-4 MECP2 mutation and DNA fingerprinting of RTT-hiPSCs (Figure 2.2, Dr. Akitsu Hotta, Postdoctoral Fellow, Dr. James Ellis lab), in vivo pluripotency assay of RTT-hiPSCs (Figure Peter Pasceri, Technician, Dr. James Ellis lab), 46
63 XIST RNA-FISH and X-centromere DNA-FISH of RTT-hiPSCs (Figure 2.12, Lindsay M. Horvath, Graduate Student, Dr. Laura Carrel lab; Reagan Ching, Graduate Student, Dr. David Bazett Jones lab). 47
64 2.1. Abstract RTT is a neurodevelopmental disorder that affects girls due primarily to mutations in the gene encoding MECP2. The majority of RTT patients carry missense and nonsense mutations leading to a hypomorphic MECP2 while null mutations leading to the complete absence of a functional protein are rare. MECP2 is an X-linked gene subject to random XCI resulting in mosaic expression of mutant MECP2. The lack of human brain tissue motivates the need for alternative human cellular models to study RTT. Here I report the characterization of a MECP2 mutation in a classic female RTT patient involving rearrangements that remove exons 3 and 4 creating a functionally null mutation. To generate human neuron models of RTT, I isolated hipscs from RTT patient fibroblasts. RTT-hiPSCs retained the MECP2 mutation, are pluripotent and fully reprogrammed, and retained an Xi in a nonrandom pattern. Taking advantage of the latter characteristic, I obtained a pair of isogenic mutant and WT MECP2- expressing RTT-hiPSC lines that retained this MECP2 expression pattern upon differentiation into neurons. Phenotypic analysis of mutant RTT-hiPSC-derived neurons demonstrated a reduction in soma-size compared to the isogenic control RTT-hiPSC-derived neurons from the same RTT patient. Analysis of mutant and isogenic control hipsc-derived neurons represents a promising source for understanding the pathogenesis of RTT and the role of MECP2 in human neurons. 48
65 2.2. Brief Introduction and Rationale RTT is a neurodevelopmental disorder affecting roughly 1 in 10,000 live female births (Chahrour and Zoghbi, 2007). RTT girls develop normally until 6-18 months of age when they enter a stage of developmental arrest. Clinical features include microcephaly, characteristic hand wringing, autistic features, loss of language, and mental retardation (Hagberg et al., 1983). Genetically, over 95% of classic RTT patients harbour a loss-of-function mutation in the X- linked gene encoding MECP2 (Amir et al., 1999). MECP2 functions as a transcriptional regulator, both as an activator and repressor, by binding to methylated CpG dinucleotides of target genes via its MBD and recruiting chromatin remodeling proteins via its TRD (Ben- Shachar et al., 2009; Chahrour et al., 2008; Nan et al., 1997; Nan et al., 1993; Nan et al., 1998). Most mutations in MECP2 are de novo from the paternal germline involving a C to T mutation at CpG hotspots (Trappe et al., 2001; Wan et al., 1999). In North America, approximately 39% and 35% of RTT patients are due to missense and nonsense mutations in MECP2, respectively (Percy et al., 2007). Large deletions are relatively rare (~6%) (Percy et al., 2007), but associated with a more clinical severe form of RTT compared to other mutation types (Bebbington et al., 2012; Neul et al., 2008; Scala et al., 2007). Furthermore, as MECP2 is X- linked, it is subject to the effect of XCI in female cells. XCI occurs during female development when one of the two X-chromosomes is randomly inactivated such that approximately half the cells inactivate the maternally derived X-chromosome and the other half inactivate the paternally derived X-chromosome (Amos-Landgraf et al., 2006). Therefore, RTT patients are mosaic where half of their cells express WT MECP2 while the other half express mutant MECP2. However, although XCI is random in most cases, it can occasionally be nonrandom which could lead to phenotypic variability in RTT patients depending on the extent of favourable XCI skewing (Amir et al., 2000; Archer et al., 2007; Huppke et al., 2006; Shahbazian et al., 2002c). Most of our understanding of RTT and MECP2 has been attributed to the study of Mecp2 mutant mouse models as access to patient neurons, such as postmortem tissues, is severely limited and may not accurately reflect early pathogenesis of RTT (Armstrong, 2005). Although, Mecp2 mutant mouse models recapitulate key characteristics associated with RTT patients including an initial phase of apparently normal development followed by severe neurodevelopmental dysfunction, there is evidence that mouse models are an underrepresentation of the human condition (Chen et al., 2001; Guy et al., 2001; Shahbazian et 49
66 al., 2002a). Mecp2 -/y mice are viable whereas the equivalent mutation in human males is associated with severe congenital encephalopathy and early death (Schule et al., 2008). Disease onset in RTT mouse models is during adulthood whereas disease onset in RTT patients is during childhood (Hagberg et al., 1983). This could be due to the fact that RTT mouse models exhibit unbalanced XCI favouring the expression of WT Mecp2 whereas in RTT patients, balanced XCI is the norm (Amir et al., 2000; Shahbazian et al., 2002c; Young and Zoghbi, 2004). For these reasons, a method that will allow for the generation of large numbers of affected neurons directly from RTT patients will be advantageous to further understand the role of MECP2 and pathogenesis of RTT in human neurons. HiPSCs, which are similar to hescs molecularly and functionally, can be derived from adult somatic cell types via the introduction of defined transcription factors (Park et al., 2008b; Takahashi et al., 2007; Yu et al., 2007). The generation of patient-specific hipscs has major implications for translational medicine such as disease phenotyping, drug screens, and cell therapy. Indeed, hipscs have been generated from a variety of diseases, including many with a neurological basis, where specific phenotypes have been observed in vitro and proof-ofprinciple drug screens have been performed (Table 1.1). More recently, it has been observed that female hipscs retain an Xi in a nonrandom pattern (Tchieu et al., 2010), in contrast to their mouse counterparts which reactivate the Xi thus carrying two Xa and exhibit random XCI upon differentiation (Maherali et al., 2007). This pattern of XCI in female hipscs provide prospects to isolate mutant and isogenic control hipsc lines for heterozygous X-linked diseases, such as RTT. Here I report the characterization of a functionally null mutation in MECP2 attributable to rearrangements removing exons 3 and 4 (Δ3-4) in a classic RTT patient. I generated hipscs from this patient, predicted to carry a severe mutation, and demonstrate that these hipscs are pluripotent and fully reprogrammed. Taking advantage of the fact that female hipscs retain an Xi in a nonrandom pattern, I obtained hipsc lines with alternative parental X-chromosomes inactivated. Directed differentiation of hipscs into neurons demonstrated that MECP2 expression follows the XCI pattern, allowing the generation of a pair of experimental (expressing mutant MECP2) and isogenic control (expressing WT MECP2) hipsc lines which have important prospects for downstream applications. 50
67 2.3. Results Characterization of the Δ3-4 MECP2 mutation The majority of RTT patients carry missense and nonsense mutations in the MECP2 gene leading to a hypomorphic protein with partial function while null mutations leading to the complete absence of a functional protein are relatively rare (Ballestar et al., 2005; Ballestar et al., 2000; Shahbazian et al., 2002a; Yusufzai and Wolffe, 2000). Preliminary screening, at Ottawa Children s Hospital (Ottawa, ON, Canada), for mutations in a 6 year old classic RTT patient using multiplex ligation-dependent probe amplification indicated that she carries a deletion involving exons 3 and 4 of MECP2 (verbal communication, Dr. Berge Minassian). She has growth and developmental delay, inability to walk without assistance, ataxia, nonverbal, has no hand use and constant repetitive hand motions, some tremor, has had epileptic seizures and significant abnormal electroencephalogram, teeth grinding, some sleep difficulties, and breath holding and hyperventilation (verbal communication, Dr. Berge Minassian, Dr. Peter Humphreys). To precisely map the Δ3-4 MECP2 mutation of this RTT patient, I harvested DNA from fibroblasts expanded from her skin punch biopsy. I performed quantitative polymerase chain reaction (qpcr) with primers spanning the MECP2 locus to determine CNVs (Figure 2.1a-b). The region of the breakpoints was identified, allowing primers to be designed that span the Δ3-4 MECP2 mutation and amplify the mutant Δ3-4 MECP2 allele (Figure 2.1c). I sequenced the mutant Δ3-4 MECP2 allele which revealed a pair of deletions, g.61340_67032delinsagttgtgccac and g.67072_67200del, where the larger deletion was also associated with an 11 bp insertion, ultimately removing the entire exon 3 and the 5 end of exon 4, including the MBD and TRD (Figure 2.1a). Further analysis of the Δ3-4 MECP2 mutation revealed genetic features associated with genomic copy number variations (Figure 2.2a). We detected an AluSx element spanning the 5 end of the larger deletion (g.61340_67032delinsagttgtgccac) (Figure 2.2b), which could potentially trigger Alu recombination-mediated deletions (de Smith et al., 2008; Kidd et al., 2010; Sen et al., 2006). We were not able to determine the origin of the insertion associated with the larger deletion as an 11 bp motif is insufficient to accurately perform a genome search (Figure 2.2c). However, the cooccurrence of an insertion with a deletion has been observed previously and the insertion is thought to originate from an inversion of the local genomic sequence (Conrad et al., 2010; Kidd 51
68 et al., 2010). On the other hand, we detected a 3 bp microhomology sequence flanking the smaller deletion (g.67072_67200del) (Figure 2.2d), which could potentially trigger microhomology-mediated processes such as microhomology-mediated end joining or microhomology-mediated break-induced replication (Conrad et al., 2010; de Smith et al., 2008; Kidd et al., 2010). Therefore, it appears that the two deletions may have been caused by two separate mechanisms. Altogether, these results demonstrate the identification of a complex mutation comprising a pair of deletions, where the larger deletion is also associated with an insertion, within the MECP2 gene, removing the two important domains, in a classic RTT patient. 52
69 Figure 2.1. Mapping of the Δ3-4 MECP2 mutation (A) Schematic of the MECP2 locus. Primers used for analysis of copy number variations and their approximate amplifying regions are indicated, where applicable, with orange bars. Primers in italics belong to intron 2. Primers in dark blue were used for amplification of WT (KR6-Fwd & KR16-Rev) and mutant Δ3-4 (AC7-Fwd & KR16-Rev) MECP2 alleles in (C) and their approximate location are indicated with dark blue arrows. The two alleles of MECP2 are 53
70 indicated with red bars. There are two deletions that comprise the Δ3-4 MECP2 mutation, g.61340_67032delinsagttgtgccac and g.67072_67200del. The pair of deletions is indicated by the absence of one of the red bars indicative of the deletion of one of the two alleles creating a heterozygous deletion. The insertion associated with the larger deletion is indicated with a light blue bar. The nomenclature of the mutations relate to the genomic DNA sequence with position 1 defined as the first nucleotide of NG_ (NCBI: Reference Sequence). The approximate location of the p.t158m and p.r306c mutation is indicated. MBD, Methyl- CpG Binding Domain. TRD, Transcriptional Repression Domain. UTR, Untranslated Region. (B) qpcr analysis of copy number variations along the MECP2 locus. Data are expressed as mean ± SEM. (C) PCR using WT and mutant specific primers to amplify the WT and Δ3-4 MECP2 allele, respectively. 54

71 Figure 2.2. Sequence analysis of the Δ3-4 MECP2 mutation (A) Overview of the Δ3-4 MECP2 mutation. There are two deletions that comprise the Δ3-4 MECP2 mutation, g.61340_67032delinsagttgtgccac and g.67072_67200del. The larger deletion (g.61340_67032delinsagttgtgccac) contains an AluSx element on the 5 end of the deletion in intron 2 and the smaller deletion (g.67072_67200del) is flanked by 55
72 microhomology sequences in exon 4. The two alleles of MECP2 are indicated with red bars. The pair of deletions is indicated by the absence of one of the red bars indicative of the deletion of one of the two alleles creating a heterozygous deletion. The insertion associated with the larger deletion is indicated with a light blue bar. MBD, Methyl-CpG Binding Domain. TRD, Transcriptional Repression Domain. UTR, Untranslated Region. (B) A portion of the MECP2 sequence of intron 2 is shown (g.60960_61389). An AluSx element (reverse orientation) (underlined nucleotides) is found spanning the 5 end of the larger deletion (g.61340_67032delinsagttgtgccac) (red nucleotides) in intron 2. Green nucleotides, AC7- Fwd primer used for sequencing the Δ3-4 mutation. (C) Sequencing of the Δ3-4 MECP2 mutation is shown. Regions aligning to MECP2 is indicated with nucleotides in dark blue (aligned to intron 2), green (aligned to exon 4, intervening sequence which separates the pair of deletions), and purple (aligned to exon 4). The 3 end of the primers (AC7-Fwd & KR16-Rev) used for sequencing the Δ3-4 MECP2 allele is indicated with arrows. Nucleotides in red indicate an 11 bp insertion associated with the larger deletion (g.61340_67032delinsagttgtgccac) from an unidentifiable origin in the genome. (D) A portion of the MECP2 sequence of exon 4 is shown (g.67033_67232). A 3 bp microhomology (underlined nucleotides) is found flanking the smaller deletion (g.67072_67200del) (red nucleotides) in exon 4 of MECP2. 56
73 Additional RTT-fibroblasts In addition to Δ3-4-fibroblasts, I acquired two additional primary RTT-fibroblasts from the Coriell Cell Repository which carried common RTT-associated mutations, p.t158m and p.r306c. p.t158m and p.r306c are a result of a heterozygous C to T point mutation resulting in a missense mutation in the MBD and TRD, respectively (Figure 2.1a). p.t158m and p.r306c represents the most (11.9%) and fifth most (6.9%) common mutation associated with RTT in North America, respectively (Percy et al., 2007). Furthermore, p.t158m and p.r306c is the most common mutation affecting the MBD and TRD, respectively, in North America. I confirmed the genotype of T158M- and R306C-fibroblasts by sequencing fibroblast DNA (Figure 2.3). Altogether, I have acquired RTT-fibroblasts from three RTT patients carrying a range of MECP2 mutations associated with RTT and affecting different regions of MECP2 (Table 2.1). 57
74 Figure 2.3. Sequencing of T158M- and R306C-hiPSCs (A) Sequencing of T158M-hiPSCs indicate that they carry a heterozygous p.t158m point mutation in MECP2 similar to parental T158M-fibroblasts. (B) Sequencing of R306C-hiPSCs indicate that they carry a heterozygous p.r306c point mutation in MECP2 similar to parental R306C-fibroblasts. 58
75 Fibroblast Phenotype Mutation hipsc lines DNA Protein generated and characterized Δ3-4 RTT Exons 3-4indel MBD & TRD 3 T158M RTT C473T T158M (MBD) 3 R306C RTT C916T R306C (TRD) 3 Table 2.1. Summary of RTT-fibroblasts reprogrammed 59
76 Generation and characterization of RTT-hiPSCs The predicted severity of the Δ3-4 MECP2 mutation prompted me to generate hipscs from this patient in addition to the T158M- and R306C-fibroblasts (Table 2.1). I transduced RTT-fibroblasts with OCT4, SOX2, KLF4, and c-myc retroviral vectors and the EOS lentiviral vector that reports pluripotency as previously described (Hotta et al., 2009a; Hotta et al., 2009b). I isolated three RTT-hiPSC lines per RTT patient which propagated robustly under puromycin selection driven by the EOS-pluripotent reporter and subjected them to further characterization. I demonstrated that RTT-hiPSCs were pluripotent as they expressed pluripotencyassociated markers (Figure 2.4), including bona fide hipsc markers REX1, ABCG2, DNMT3B, and TRA1-60 (Figure 2.5) (Chan et al., 2009). Their ability to differentiate into the three germ layers was shown in vitro via EB formation (Figure 2.6) and in vivo via teratoma formation by injection into immunodeficient mice (Figure 2.7). I demonstrated that RTT-hiPSCs were fully reprogrammed as retroviral transgenes were largely silenced with the exception of one factor in some RTT-hiPSC lines (Figure 2.8) and have simultaneously reactivated the endogenous loci of the reprogramming factors (Figure 2.9) similar to previously published patient-specific hipscs (Dimos et al., 2008; Ebert et al., 2009; Park et al., 2008a). Finally, I performed genetic analyses on RTT-hiPSCs. DNA fingerprinting by short tandem repeat analysis indicated that all RTT-hiPSCs came from their fibroblast of origin and not from contaminating hescs within the laboratory (Figure 2.10). The majority of RTThiPSCs (seven out of nine RTT-hiPSC lines characterized) maintained a normal female karyotype (Figure 2.11, Table 2.2). Furthermore, I confirmed that RTT-hiPSCs carried a heterozygous MECP2 mutation present in the parental fibroblasts (Figure 2.1b-c, 2.3). Of note, although silencing of viral transgenes is associated with bona fide hipscs (Chan et al., 2009), variations in karyotype and viral transgene expression have been demonstrated to have no significant effect in the directed differentiation of hipscs into neurons (Boulting et al., 2011). However, the use of such RTT-hiPSC lines will be deprioritized as it is unknown how these variations may affect downstream applications of hipscs such as disease modeling. Altogether, I reprogrammed RTT-fibroblasts into RTT-hiPSCs from three RTT patients carrying differentiation MECP2 mutations (Table 2.1). I isolated three independent RTT-hiPSC lines per RTT patient and demonstrated with multiple assays that RTT-hiPSCs are pluripotent and fully reprogrammed. 60
 Δ3-4-, (B) T158M-, and (C) R306C-hiPSCs")
77 Figure 2.4. RTT-hiPSCs express pluripotency markers (A) Δ3-4-, (B) T158M-, and (C) R306C-hiPSCs express pluripotency markers as detected by ICC. Scale bars, 100 µm. 61
78 Figure 2.5. RTT-hiPSCs express bona fide pluripotency markers (A) Δ3-4-, (B) T158M-, and (C) R306C-hiPSCs express bona fide hipsc markers as detected by qrt-pcr. Data are expressed as mean ± SEM. 62
 Δ3-4-, (B) T158M-, and (C) R306C-hiPSCs differentiate into the three germ layers, ectoderm (TUJ1, NESTIN),")
79 Figure 2.6. RTT-hiPSCs are pluripotent in vitro (A) Δ3-4-, (B) T158M-, and (C) R306C-hiPSCs differentiate into the three germ layers, ectoderm (TUJ1, NESTIN), mesoderm (ACTININ [α-actinin], MYOSIN, SMA [SMOOTH MUSCLE ACTIN]), and endoderm (GATA4, SOX17), in vitro via EB formation. Scale bars, 50 µm. 63
 Δ3-4-, (B) T158M-, and (C) R306C-hiPSCs differentiate into the three germ layers, ectoderm (pigmented epithelium),")
80 Figure 2.7. RTT-hiPSCs are pluripotent in vivo (A) Δ3-4-, (B) T158M-, and (C) R306C-hiPSCs differentiate into the three germ layers, ectoderm (pigmented epithelium), mesoderm (cartilage, adipocytes), and endoderm (gut epithelium), in vivo via teratoma formation by injection into immunodeficient mice. Scale bars, 50 µm. 64
81 Figure 2.8. RTT-hiPSCs have largely silenced the reprogramming factors (A) Δ3-4-, (B) T158M-, and (C) R306C-hiPSCs have largely silenced the reprogramming factors in comparison to IMR90-4F+RFP as detected by qrt-pcr. Data are expressed as mean ± SEM. 65
 Δ3-4-, (B) T158M-, and (C) R306C-hiPSCs reactivated the")
82 Figure 2.9. RTT-hiPSCs have reactivated the endogenous loci of reprogramming factors (A) Δ3-4-, (B) T158M-, and (C) R306C-hiPSCs reactivated the endogenous loci of reprogramming factors similar to H9 hescs as detected by qrt-pcr. Data are expressed as mean ± SEM. 66
 Δ3-4-, (B) T158M-, and (C) R306C-hiPSCs carry identical short")
83 Figure RTT-hiPSCs carry an identical genetic profile as their parental fibroblast of origin (A) Δ3-4-, (B) T158M-, and (C) R306C-hiPSCs carry identical short tandem repeat profiles as their respective parental fibroblast of origin and are distinct from (D) CA1 hescs in the laboratory. Fib., fibroblasts. 67
84 Figure Karyotype of RTT-hiPSCs Karyotyping of (A) Δ3-4-, (B) T158M-, and (C) R306C-hiPSCs. Δ3-4- and T158M-hiPSCs and R306C-hiPSC #15 carry a normal female karyotype as detected by G-banding analysis. R306ChiPSC #4 and #13 carry an abnormal female karyotype as detected by G-banding analysis. 68
85 HiPSC Passage Karyotype Δ3-4-hiPSC #6 P32 46, XX Δ3-4-hiPSC #20 P32 46, XX Δ3-4-hiPSC #37 P14 46, XX T158M-hiPSC #5 P14 46, XX T158M-hiPSC #29 P28 46, XX T158M-hiPSC #31 P33 46, XX R306C-hiPSC #4 P16 46,XX,del(3)(p26) R306C-hiPSC #13 P16 46,XX,t(6;17)(q22~23;q22~24) R306C-hiPSC #15 P31 46, XX Table 2.2. Karyotype of RTT-hiPSCs Karyotype results of RTT-hiPSCs at the indicated passage. 69
86 RTT-hiPSCs retain an Xi in a nonrandom pattern It has been recently demonstrated that female hipscs retain an Xi (Tchieu et al., 2010). Furthermore, individual female hipsc lines exhibit a nonrandom pattern of XCI as they reflect the XCI status of the single fibroblast from which they were derived (Tchieu et al., 2010). This is advantageous for the study of heterozygous X-linked diseases, such as RTT, as it allows the generation of hipsc lines that express either the mutant or WT form of the protein depending on the pattern of XCI, ultimately allowing the generation of experimental (expressing mutant MECP2) and isogenic control (expressing WT MECP2) hipsc lines, respectively. Therefore, I sought to determine whether RTT-hiPSCs retain an Xi, and if so, whether it exhibits a nonrandom pattern of XCI. To investigate the XCI status of Δ3-4-hiPSCs, we probed for the expression of XIST RNA, a key molecule transcribed from the Xi during the initiation of XCI (Marahrens et al., 1997; Penny et al., 1996), by RNA-FISH. We observed a single XIST RNA signal in 67% to 100% of Δ3-4-hiPSC colonies (Figure 2.12a). We note that of the 73% Δ3-4-hiPSC #6 colonies where a single XIST RNA signal was detectable, 38% of the colonies (categorized as mix) were below the threshold for a positive colony (> 90% of cells per colony). I further assessed the XCI status of Δ3-4-hiPSCs by ICC for H3K27me3, a repressive chromatin mark which accumulates on the Xi during the initiation of XCI (Plath et al., 2003). Similar to XIST RNA, I observed a single H3K27me3 signal in 55% to 100% of the Δ3-4-hiPSC colonies (Figure 2.13a). Similar results were observed in additional T158M- and R306C-hiPSCs. T158M-hiPSCs expressed a single XIST RNA and H3K27me3 signal in 60% to 77% and 56% to 75% of the hipsc colonies, respectively (Figure 2.12b, 2.13b). R306C-hiPSCs expressed a single H3K27me3 signal in 0% to 61% of the hipsc colonies (Figure 2.13c). The accumulation of a single XIST RNA and H3K27me3 signal, combined with a skewed XCI pattern (see below), in the RTT-hiPSCs suggests they retain an Xi. The lack of a single XIST RNA and H3K27me3 signal in some of the RTT-hiPSCs could be interpreted as: 1) the loss of an X-chromosome (i.e. 45, XO), 2) the reactivation of the Xi, or 3) an Xi that has lost XIST RNA and H3K27me3 but remains transcriptionally suppressed. We excluded the possibility for the loss of an X-chromosome as Δ3-4-hiPSC #37 possess two X-chromosomes as observed by X-centromere DNA-FISH (Figure 2.14), consistent with a normal female karyotype, with respect to the number of X-chromosomes, found in the RTT-hiPSCs (Figure 2.11, Table 2.2). I also excluded the possibility that RTT-hiPSCs carry two Xa as neuronal 70
87 derivatives of RTT-hiPSCs do not exhibit random XCI as would have been expected (see below). Therefore, I favour the final possibility as it has been previously demonstrated that female hipscs and hescs can be subject to the loss of XIST RNA and other repressive chromatin marks (including H3K27me3) during in vitro culture (Shen et al., 2008; Silva et al., 2008; Tchieu et al., 2010). However, the Xi in the female hipscs and hescs is maintained in an inactive state where X-linked genes (i.e. MECP2) retain a monoallelic expression pattern (Shen et al., 2008; Silva et al., 2008; Tchieu et al., 2010). To that end, I confirmed the retention of an Xi in RTT-hiPSCs by allele-specific expression analysis of MECP2 (see below). To investigate the pattern of XCI in Δ3-4-hiPSCs, I used the AR assay which has been used previously for investigating XCI patterns in RTT-patient brains (Shahbazian et al., 2002c). The AR assay detects the heterozygous trinucleotide repeat polymorphism in the first exon of the X-linked AR gene by PCR to distinguish between the paternal and maternal X-chromosome. Genomic DNA is digested with methylation-sensitive enzymes prior to PCR to allow detection of the (methylated) Xi. The XCI skewing can then be calculated based on the relative abundance of paternal and maternal Xi. The AR assay revealed that Δ3-4-fibroblasts exhibited a random pattern of XCI (69:31) as shown by the detection of two different-sized amplicons of the AR gene after digestion with methylation-sensitive enzymes (Figure 2.15a, Table 2.3). On the other hand, all Δ3-4-hiPSC lines exhibited an extreme XCI skewing pattern (96:4 to 99:1). Furthermore, Δ3-4-hiPSC #6 and #37 skewed towards the same parental X-chromosome being inactivated while Δ3-4-hiPSC #20 skewed towards the alternative parental X-chromosome being inactivated. Male BJ-fibroblasts were used as a positive control for the complete digestion of the (unmethylated) Xa resulting in the lack of an AR signal (Figure 2.16). When the AR assay was performed on T158M-hiPSCs, all T158M-hiPSC lines showed an extreme XCI skewing pattern (91:9 to 99:1) towards the same parental X-chromosome being inactivated while T158M-fibroblasts exhibited a random pattern of XCI (53:47) (Figure 2.15b, Table 2.3). Similarly, all R306C-hiPSC lines showed a highly skewed pattern of XCI (81:19 to 84:16) towards the same parental X-chromosome being inactivated while R306C-fibroblasts exhibited a random pattern of XCI (68:32) (Figure 2.15c, Table 2.3). The relatively lesser degree of skewing observed in R306C-hiPSCs is potentially attributed to the smaller AR amplicon (171 bp) including the stutter peak of the larger AR amplicon (174 bp) and hence overestimates the former (see Materials and Methods [section ]). The extreme XCI skewing pattern observed in the RTT-hiPSCs is similar to previous findings that female hipscs exhibit a nonrandom XCI pattern (Tchieu et al., 2010). Altogether, these results suggest that 71
88 RTT-hiPSCs retain an Xi in a nonrandom pattern. Interestingly, Δ3-4-hiPSC lines appear to have alternative parental X-chromosomes inactivated, but the T158M- and R306C-hiPSC lines examined here appear to have the same parental X-chromosome inactivated. 72
 colonies indicate > 90% of the cells observed within the colony were positive for the signal.")
89 Figure Female RTT-hiPSCs express XIST RNA indicative of an Xi (A) Δ3-4- and (B) T158M-hiPSCs were assessed by RNA-FISH for XIST RNA. Graph depicts the percentage of colonies with a single XIST RNA signal. Positive (+ve) colonies indicate > 90% of the cells observed within the colony were positive for the signal. Examples of positive colonies are shown on the left panels. Negative (-ve) colonies indicate no cells within the colony were positive for the signal. Mix colonies indicate colonies where a single XIST RNA signal was detectable, but were below the threshold for a positive colony. The number of colonies analysed is indicated within each bar. Passage number of analysis is indicated in brackets. P, passage. Scale bars, 10 µm. 73
 colonies indicate > 90% of the cells observed within the colony were positive for the signal.")
90 Figure Female RTT-hiPSCs exhibit H3K27me3 signal indicative of an Xi (A) Δ3-4-, (B) T158M-, and (C) R306C-hiPSCs were assessed by ICC for H3K27me3. Graph depicts the percentage of colonies with a single H3K27me3 signal. Positive (+ve) colonies indicate > 90% of the cells observed within the colony were positive for the signal. Examples of positive colonies are shown on the left panels (except for R306C-hiPSC #15). Negative (-ve) colonies indicate no cells within the colony were positive for the signal. The number of colonies analysed is indicated within each bar. Passage number of analysis is indicated in brackets. P, passage. Scale bars, 10 µm. 74

91 Figure Δ3-4-hiPSC #37 carry two X-chromosomes DNA-FISH for the X-centromere was performed on Δ3-4-hiPSC #37. Two X-centromere signals were observed in > 90% of the cells scored from 26 out of 26 colonies analysed indicating that Δ3-4-hiPSC #37 carry two X-chromosomes. Passage number of analysis is indicated in brackets. P, passage. Scale bars, 10 µm. 75
92 Figure XCI is nonrandom in female RTT-hiPSCs RTT-fibroblasts and hipscs were assessed for XCI patterns via the AR assay. (A) Δ3-4-, (B) T158M-, and (C) R306C-fibroblasts exhibited a random XCI pattern as shown by the presence of two different-sized amplicons, 174 bp & 180 bp, 168 bp & 177 bp, and 171 bp & 174 bp, respectively, after digestion with methylation-sensitive enzymes. (A) Δ3-4-, (B) T158M-, and (C) R306C-hiPSCs exhibited an extreme XCI skewing pattern as shown by the preferential detection of a single-sized peak after digestion with methylation-sensitive enzymes. The corrected XCI ratio (see Materials and Methods) is indicated on the top left of the digested graph. 76
93 Figure AR Assay of BJ-fibroblasts AR assay revealed male BJ-fibroblasts which only carry one (unmethylated) Xa was completely digested by methylation-sensitive enzymes. 77
94 ± HpaII & HhaI Sample Peak Area Corrected Peak Area XCI Ratio Allele 1 Allele 2 Allele 1 Allele 2 Allele 1 Allele 2 Undigested Δ3-4-fibroblasts Undigested Δ3-4-hiPSC # Undigested Δ3-4-hiPSC # Undigested Δ3-4-hiPSC # Digested Δ3-4-fibroblasts Digested Δ3-4-hiPSC # Digested Δ3-4-hiPSC # Digested Δ3-4-hiPSC # Undigested T158M-fibroblasts Undigested T158M-hiPSC # Undigested T158M-hiPSC # Undigested T158M-hiPSC # Digested T158M-fibroblasts Digested T158M-hiPSC # Digested T158M-hiPSC # Digested T158M-hiPSC # Undigested R306C-fibroblasts Undigested R306C-hiPSC # Undigested R306C-hiPSC # Undigested R306C-hiPSC # Digested R306C-fibroblasts Digested R306C-hiPSC # Digested R306C-hiPSC # Digested R306C-hiPSC # Undigested Δ3-4-hiPSC #20 - neurons Undigested Δ3-4-hiPSC #37 - neurons Digested Δ3-4-hiPSC #20 - neurons Digested Δ3-4-hiPSC #37 - neurons
95 Table 2.3. Quantification of AR assay in RTT-hiPSCs Peak area values of the AR assays in Figures 2.15, 2.16 and The corrected peak area was calculated and the XCI skewing ratio was determined (see Materials and Methods). 79
96 MECP2 expression follows the pattern of XCI in RTT-hiPSCs and their neuronal derivatives The importance of the XCI pattern with respect to RTT is the expression pattern of the WT or mutant MECP2 in neurons. In addition, to further assess whether RTT-hiPSCs retain an Xi despite the loss of XIST RNA and H3K27me3 in some cells and whether the extreme XCI skewing pattern represents a nonrandom XCI pattern, I performed allele-specific expression analysis of MECP2. By taking advantage of MECP2 expression in hipscs, I performed reverse transcription polymerase chain reaction (RT-PCR) and quantitative (q)rt-pcr in Δ3-4-hiPSCs using primers that specifically detect the WT MECP2 transcript and not the mutant Δ3-4 MECP2 transcript. RT-PCR and qrt-pcr detected the expression of WT MECP2 transcripts exclusively in Δ3-4-hiPSC #6 and #37 but not in Δ3-4-hiPSC #20, suggesting that Δ3-4-hiPSC #20 expresses the mutant Δ3-4 MECP2 transcript (Figure 2.17a-b). This is in agreement with the AR assay data that Δ3-4-hiPSC #6 and #37 have the same parental X-chromosome inactivated while Δ3-4-hiPSC #20 has the alternative parental X-chromosome inactivated. It is worth noting that when qrt-pcr was performed using primers upstream of the Δ3-4 MECP2 mutation (and hence detect both the WT and mutant Δ3-4 MECP2 transcripts), transcripts were detected from Δ3-4-hiPSC #20 (Figure 2.17c). This suggests that mutant Δ3-4 MECP2 transcripts are expressed in Δ3-4-hiPSC #20, at least upstream of the Δ3-4 MECP2 mutation. To determine the pattern of MECP2 expression in T158M- and R306C-hiPSCs, I performed sequencing of the cdna to detect either the expression of the WT nucleotide (C) or the mutant nucleotide (T) of the p.t158m and p.r306c mutations, respectively. Sequencing revealed that T158M- and R306C-fibroblasts have a heterogeneous pattern of XCI and expressed both the WT and mutant transcripts of MECP2 consistent with a random XCI status (Figure 2.18a-b). On the other hand, all T158M-hiPSC lines expressed the WT MECP2 transcript (Figure 2.18a), while all R306C-hiPSC lines expressed the mutant MECP2 transcript (Figure 2.18b). This is in agreement with the AR assay that all T158M- and R306C-hiPSC lines had the same parental X-chromosome inactivated. Therefore, the R306C-hiPSCs express mutant MECP2 transcripts but the T158M-hiPSCs express the WT MECP2 transcripts. Altogether, the nonrandom monoallelic expression pattern of MECP2 transcripts in RTT-hiPSCs confirms that RTT-hiPSCs retain an Xi in a nonrandom pattern despite the loss of XIST RNA and H3K27me3 in some cells. 80
97 Finally, I sought to determine whether the pattern of WT and mutant-specific expression of MECP2 seen in the different Δ3-4-hiPSC lines is maintained upon differentiation. Since RTT is primarily a neurodevelopmental disorder, I performed directed differentiation of Δ3-4-hiPSC #20 and #37 into neurons using a previously published protocol for hescs (Figure 2.19) (Li et al., 2009b). In brief, RTT-hiPSCs were resuspended to form cellular aggregates (CAs) in the presence of Fibroblast Growth Factor 2 (FGF2) for 1 week. CAs were then seeded in an adhesive manner to form NE for 11 days. NE cells were then manually harvested and grown in suspension for 5 days to form NE clusters. NE clusters were then seeded in the presence of neurotrophic factors including BDNF, glial cell line-derived neurotrophic factor (GDNF), and IGF1 to induce neuronal differentiation and matured over the next 6 to 7 weeks (9 to 10 weeks total) (Johnson et al., 2007; Li et al., 2009b). I chose to focus on Δ3-4-hiPSC #20 and #37 because they have alternative parental X-chromosomes inactivated. Furthermore, the nature of the predicted null mutation (compared to missense mutations in p.t158m and p.r306c) allows for direct visualization of the WT MECP2 but not the mutant Δ3-4 MECP2 at the protein level via ICC using an antibody raised against the C-terminus of MECP2. Δ3-4-hiPSCs were able to differentiate into abundant MAP2-positive neurons in 9 to 10 weeks (Figure 2.20a). Co-labeling for MECP2 detected WT MECP2 protein expression exclusively in the nuclei of Δ3-4-hiPSC #37-derived neurons but not in Δ3-4-hiPSC #20-derived neurons (Figure 2.20a). This was further confirmed by qrt-pcr as WT MECP2 transcripts were detected exclusively in Δ3-4- hipsc #37-derived neurons but not in Δ3-4-hiPSC #20-derived neurons (Figure 2.20b). This is in agreement with the RT-PCR and qrt-pcr results for WT MECP2 transcripts in the Δ3-4- hipscs and suggests that the Δ3-4 MECP2 mutation results in the complete absence of full length MECP2 protein and is functionally a null mutation. Similarly, qrt-pcr using primers upstream of the Δ3-4 MECP2 mutation detected transcripts from the Δ3-4-hiPSC #20-derived neurons, suggesting the mutant Δ3-4 MECP2 transcript is expressed in these neurons, at least upstream of the Δ3-4 MECP2 mutation (Figure 2.20c). Finally, I performed the AR assay on Δ3-4-hiPSC #20 and #37-derived neurons and observed an extreme XCI skewing pattern similar to the parental hipsc lines (Figure 2.21, Table 2.3), excluding the possibility that XIST RNAand H3K27me3-negative Δ3-4-hiPSCs carry two Xa which would have otherwise resulted in random XCI. Altogether, I conclude that the nonrandom monoallelic expression of MECP2 in Δ3-4-hiPSCs is maintained upon neuronal differentiation and that Δ3-4-hiPSC #37 is an isogenic control of the mutant Δ3-4-hiPSC #20. 81
98 To demonstrate the utility of the mutant and isogenic control Δ3-4-hiPSCs, I performed phenotyping of soma size in Δ3-4-hiPSC-derived neurons, a well-established phenotype associated with RTT (Bauman et al., 1995a, b; Kishi and Macklis, 2004). I observed that mutant Δ3-4-hiPSC #20-derived neurons exhibited significant reduction in soma size compared to isogenic control Δ3-4-hiPSC #37-derived neurons (Figure 2.22), consistent with previous findings in Mecp2 -/y mice and postmortem tissues from RTT patients (Bauman et al., 1995a, b; Chen et al., 2001; Kishi and Macklis, 2004). Altogether, I conclude that MECP2 expression is monoallelic in a nonrandom pattern from a single Xa in RTT-hiPSCs and their neuronal derivatives, and that isogenic Δ3-4-hiPSC lines have been generated that express either the WT or mutant MECP2 after directed differentiation into neuronal lineages. Finally, I provide a proof-of-principle experiment to demonstrate the utility of the isogenic Δ3-4-hiPSC-derived neurons for elucidating the pathogenesis of RTT in vitro. 82
99 Figure MECP2 expression follows the pattern of XCI in Δ3-4-hiPSCs (A) RT- and (B) qrt-pcr using primers located within the Δ3-4 MECP2 mutation and hence only detects WT MECP2 transcripts (WT MECP2), indicates that Δ3-4-hiPSC #6 and #37 express the WT MECP2 transcript. The lack of detection of WT MECP2 transcripts in Δ3-4- hipsc #20 indicates that they express the Δ3-4 mutant MECP2 transcript. (C) QRT-PCR of Δ3-4-hiPSCs using primers upstream of the Δ3-4 MECP2 mutation, detecting both the WT and mutant Δ3-4 MECP2 transcript (WT/Mut MECP2), indicates that Δ3-4-hiPSC #20 expresses the Δ3-4 mutant MECP2 transcript. Diff. fnscs, differentiated fetal NSCs. Fib., fibroblasts. Data are expressed as mean ± SEM in (B) & (C). 83
 T158M- and (B) R306C-fibroblast cdna revealed that the fibroblasts express a mixture of WT and mutant MECP2")
100 Figure MECP2 expression follows the pattern of XCI in T158M- and R306C-hiPSCs Sequencing of (A) T158M- and (B) R306C-fibroblast cdna revealed that the fibroblasts express a mixture of WT and mutant MECP2 transcripts as indicated by the C and T nucleotide peaks, respectively. Sequencing of T158M (A) and R306C (B)-hiPSCs revealed that they only express the WT and mutant MECP2 transcript, respectively. Mut, Mutant. 84
101 Figure Schematic of directed differentiation of RTT-hiPSCs into neurons To differentiate RTT-hiPSCs into neurons, RTT-hiPSCs were resuspended to form CAs in the presence of FGF2 for 1 week. CAs were then seeded in an adhesive manner to form NE cells for 11 days. NE cells were then manually harvested and grown in suspension for 5 days to form NE clusters. NE clusters were then seeded in the presence of BDNF, GDNF, and IGF1 to induce neuronal differentiation and mature over the next 6 to 7 weeks (9 to 10 weeks total). 85
 and qrt-pcr (B) and was detected in Δ3-4-hiPSC #37- derived neurons but not in Δ3-4-hiPSC #20-derived neurons. Scale bars, 39 µm (A).")
102 Figure MECP2 expression follows the pattern of XCI in Δ3-4-hiPSC-derived neurons Δ3-4-hiPSC #20 and #37 were differentiated into neurons for 9 to 10 weeks. WT MECP2 expression was assessed by ICC (A) and qrt-pcr (B) and was detected in Δ3-4-hiPSC #37- derived neurons but not in Δ3-4-hiPSC #20-derived neurons. Scale bars, 39 µm (A). (C) qrt- PCR of Δ3-4-hiPSC-derived after 10 weeks of differentiation using primers (WT/Mut MECP2) upstream of the Δ3-4 MECP2 mutation, detecting both the WT and mutant Δ3-4 MECP2 transcript, indicates that Δ3-4-hiPSC-derived neurons #20 express the Δ3-4 mutant MECP2 transcript. Diff. fnscs, differentiated fetal NSCs. Data are expressed as mean ± SEM (B) & (C). 86
103 Figure Δ3-4-hiPSC-derived neurons inherit the Xi from their parental hipscs Δ3-4-hiPSC #20 and #37 were differentiated into neurons for 7 weeks. The AR assay revealed an extreme XCI skewing pattern similar to their respective parental Δ3-4-hiPSC lines consistent with Δ3-4-hiPSCs retaining an Xi. The corrected XCI ratio (see Materials and Methods) is indicated on the top left of the digested graph. 87
.")
104 Figure Mutant Δ3-4-hiPSC-derived neurons exhibit a soma size defect compared to isogenic control Δ3-4-hiPSC-derived neurons Δ3-4-hiPSC #20 and #37 were differentiated into neurons for 9 weeks. Δ3-4-hiPSC #20-derived neurons exhibited significant reduction in soma size compared to Δ3-4-hiPSC #37-derived neurons (*, P < , Student s t-test). Total number of neurons (n) analysed per hipsc line from two independent biological replicates is indicated at the bottom of each bar. Data are expressed as mean ± SEM. 88
105 2.4. Brief Summary and Discussion In this chapter, I established isogenic RTT-hiPSC lines that express either the WT or mutant MECP2 allele. I mapped a functionally null mutation in MECP2 for a classic RTT patient that consisted of a pair of deletions, one of which is also associated with an insertion, that removes exon 3 and the 5 end of exon 4. This mutation ultimately removes the entire MBD and TRD from the MECP2 coding region. The pair of deletions seem to be caused by two different mechanisms with the larger deletion potentially caused by Alu recombination-mediated deletion and is associated with an insertion, while the smaller deletion is potentially caused by microhomology-mediated processes (Conrad et al., 2010; de Smith et al., 2008; Kidd et al., 2010; Sen et al., 2006). I established Δ3-4-hiPSC lines from this patient and from fibroblasts carrying other RTT-associated point mutations in MECP2 including p.t158m and p.r306c. Three RTT-hiPSC lines were isolated from each of the three RTT-fibroblasts and were shown to be pluripotent and fully reprogrammed and carried the appropriate mutation in MECP2. Consistent with recent findings (Tchieu et al., 2010), female RTT-hiPSCs retained an Xi as suggested by the expression of a single XIST RNA and H3K27me3 signal in the RTT-hiPSC colonies. Furthermore, the pattern of XCI is nonrandom as suggested by the extreme XCI skewing pattern detected by the AR assay. Most interestingly, I obtained Δ3-4-hiPSC lines that have alternative parental X-chromosomes inactivated with Δ3-4-hiPSC #6 and #37 inactivating one of the parental X-chromosomes while Δ3-4-hiPSC #20 inactivated the alternative parental X-chromosome. This XCI pattern raised the prospect of isolating a pair of experimental and isogenic control Δ3-4-hiPSC lines. Indeed, Δ3-4-hiPSC #6 and #37, but not Δ3-4-hiPSC #20, specifically expressed WT MECP2 transcripts. Furthermore, when directed differentiation was performed towards the neuronal lineage on Δ3-4-hiPSC #20 and #37, the primary cell type affected in RTT (Chen et al., 2001), WT MECP2 transcripts and protein were detected only in neuronal derivatives of Δ3-4-hiPSC #37 but not in Δ3-4-hiPSC #20. This indicates that the Δ3-4 MECP2 mutation results in the complete absence of full length MECP2 protein and is functionally a null mutation. Altogether, I conclude that Δ3-4-hiPSC #37 is an isogenic control for the mutant Δ3-4-hiPSC #20. In contrast to Δ3-4-hiPSCs, I was not able to isolate T158M and R306C-hiPSC lines that had alternative parental X-chromosomes inactivated. This is unlikely to be due to differences in reprogramming efficiencies of fibroblasts expressing WT or mutant MECP2 as both alleles of MECP2 expression were obtained, where all the T158M-hiPSC lines expressed WT MECP2 89
106 transcript while all R306C-hiPSC lines expressed mutant MECP2 transcript. It is also unlikely to be due to a skewed XCI pattern in the parental fibroblasts as they had a random XCI pattern and expressed both the WT and mutant MECP2 transcripts. Therefore, I propose that the distribution of MECP2 allele expression in T158M- and R306C-hiPSC lines was due to chance, and it is crucial to screen a larger cohort of hipsc lines for heterozygous X-linked disorders compared to autosomal disorders to ensure the generation of isogenic control and experimental hipsc lines. I recommend screening for hipsc lines carrying alternative parental X- chromosomes inactivated using the AR assay followed by confirmation of WT or mutant RNA or protein expression directly in hipscs or the differentiated cell type of interest prior to performing extensive pluripotency characterization. While the manuscript for this chapter was being completed, Muotri and colleagues published elegant work demonstrating the utility of RTT-hiPSCs for understanding RTT (Marchetto et al., 2010). Interestingly however, and distinct from our study, their described RTT-hiPSCs possessed two Xa with a random pattern of XCI upon differentiation into neuronal derivatives and hence their phenotyping relied on comparisons to control hipscs generated from unrelated healthy individuals. The generation of female RTT-hiPSCs retaining an Xi with a nonrandom XCI pattern in the present study is consistent with the first report investigating XCI in female hipscs described by Plath and colleagues (Tchieu et al., 2010), but not with the female RTT-hiPSCs described by Muotri and colleagues (Marchetto et al., 2010). These inconsistencies will be further discussed in the discussion chapter (section 4.3). The generation of isogenic RTT-hiPSC lines is advantageous for several reasons. For disease phenotyping, appropriate healthy control hipscs are essential and isogenic cells from the same patient eliminate the diversity of genetic backgrounds that exist between individuals. Previous studies of disease phenotyping in patient-specific hipscs have predominantly used unaffected family members, unrelated healthy individuals, and hescs as controls (Table 1.1). Although disease-associated phenotypes in affected hipscs have been observed, confounding effects due to differences in genetic background and modifier genes cannot be entirely excluded. Furthermore, isogenic Δ3-4-hiPSC lines may respond to directed differentiation cues in a more uniform manner compared to hpsc lines generated from different individuals (Bock et al., 2011; Boulting et al., 2011; Hu et al., 2010; Osafune et al., 2008). For these reasons, I hypothesize that future downstream applications with Δ3-4-hiPSC lines will be able to identify phenotypes that are specific to the MECP2 mutation. Finally, it would be of interest to mix the mutant and isogenic control Δ3-4-hiPSCs in different relative proportions prior to neuronal 90
107 differentiation to recapitulate the mosaic mutant and WT MECP2 expression pattern that exists in RTT girls for downstream applications. The Δ3-4 MECP2 mutation mapped in this study presents several advantages over the common missense and nonsense point mutations for studying RTT in vitro (Percy et al., 2007). The complete absence of full length MECP2 protein with the two functional domains, MBD and TRD, in this mutation will likely lead to more pronounced phenotypes for downstream applications compared to hypomorphic missense p.t158m and p.r306c alleles and nonsense Mecp2 308 (truncation mutation at amino acid 308) alleles that retain partial function (Ballestar et al., 2005; Ballestar et al., 2000; Shahbazian et al., 2002a; Yusufzai and Wolffe, 2000). Indeed, it has been reported that RTT patients with large deletions in MECP2 present with a higher severity score than non-deleted patients (Bebbington et al., 2012; Scala et al., 2007). The Δ3-4 MECP2 mutation is also more amenable to rescue experiments using transgenes as there is no residual functional full length MECP2. In contrast, rescue of the p.t158m and p.r306c point mutation will require targeted correction of the expressing allele, or transgenes that simultaneously knockdown the hypomorphic mutant MECP2 and express WT MECP2 at normal levels. Finally, the generation of Δ3-4-hiPSC derived-neurons allow the study of MECP2 function in human neurons and for disease modeling which has traditionally been difficult due to lack of human brain tissues from RTT patients for research purposes. To this end, I provided proof-of-principle evidence to demonstrate the utility of the isogenic RTT-hiPSCs as mutant Δ3-4-hiPSC #20-derived neurons exhibited significant reduction in soma size compared to isogenic control Δ3-4-hiPSC #37-derived neurons, consistent with previous findings suggesting neuronal maturation is affected in RTT (Bauman et al., 1995a, b; Chen et al., 2001; Kishi and Macklis, 2004). With the identification of RTT-associated phenotypes in Δ3-4-hiPSC derived neurons, it may be possible to use these neurons for drug screens. This is of particular interest as drug targets will act on pathways that compensate for the complete loss of functional MECP2 in the Δ3-4 MECP2 mutant. This is in contrast to p.t158m and p.r306c point mutations where drug targets may act on increasing the hypomorphic MECP2 function or reversing the effect of specific mutations, such as conformation changes of the protein. In conclusion, to the best of my knowledge, this was the first report where a large complex genetic mutation has been mapped, patient fibroblasts successfully reprogrammed, and a disease-specific phenotype observed in cell types differentiated from experimental hipsc lines compared to those from isogenic control hipsc lines generated from the same patient (Figure 91
108 2.23). I confirmed recent findings that female hipscs retain an Xi in a nonrandom XCI pattern and can be exploited to generate isogenic control and experimental hipscs from heterozygous X-linked diseases (Tchieu et al., 2010). The isogenic Δ3-4-hiPSCs reported in the present study will have important implications for determining the pathogenesis of RTT and the role of MECP2 in human neurons. 92
109 Figure Summary of chapter two In chapter two, I proposed to establish a novel human in vitro model of RTT. To achieve this, I generated RTT-hiPSCs from RTT-patients harbouring a heterozygous mutation in MECP2. RTT-hiPSCs retained an Xi in a nonrandom pattern allowing the isolation of mutant and isogenic control RTT-hiPSCs. Directed differentiation of RTT-hiPSCs into neurons revealed that mutant RTT-hiPSC-derive neurons exhibited a defect in soma size compared to isogenic control RTT-hiPSC-derived neurons. Altogether, these results provide proof-of-principle that mutant and isogenic control RTT-hiPSCs can serve as a human in vitro model of RTT. 93
110 2.5. Materials and Methods MECP2 Genotyping To map the Δ3-4 MECP2 mutation, the region of the deletion was first determined via qpcr using primers (Table 2.4), some of which were previously described (Hardwick et al., 2007), spanning the MECP2 locus to determine copy number variations. Genomic DNA was isolated using phenol/chloroform extraction. QPCR was performed with 50 ng of DNA using SYBR Green PCR Master Mix on a 7900 HT Fast Real Time PCR System (all from Applied Biosystems) as per instructions of manufacturer. All reactions were done in triplicates with the average used for subsequent analysis. Standard curves were generated for each primer set and product specificity was assessed using melting curve analysis. The MECP2 amplicon of interest and the FOXP2 reference amplicon (Table 2.4) were amplified for the Δ3-4-fibroblasts and - hipscs, normal male BJ-fibroblasts were used as a reference for one copy, and normal female IMR90-fibroblasts were used as a positive control for two copies. The copy number of MECP2 was normalized to that of FOXP2 to normalize for differences in DNA input. The delta-delta C t method was used to determine copy number. Data are expressed as mean ± Standard Error of the Mean (SEM). To map the precise breakpoints of the Δ3-4 MECP2 mutation, WT MECP2 allele was amplified using KR6-Fwd and KR16-Rev primers, and the Δ3-4 MECP2 allele was amplified using AC7-Fwd and KR16-Rev primers (Table 2.4). The Δ3-4 MECP2 mutant amplicon was gel purified using NucleoSpin Extract II (Macherey-Nagel) as per instructions of manufacturer and sequenced (The Centre for Applied Genomics [TCAG], The Hospital for Sick Children, Canada) using the same primers for amplification. Breakpoints and insertions were determined by aligning with the MECP2 genomic DNA sequence (NCBI Reference Sequence: NG_ ). AluSx elements were found using RepeatMasker Open-3.0 ( The precise position of the g.67072_67200del was determined by identifying the 3 bp homology upstream of the breakpoint as the breakpoint occurs 3 to the microhomology (Conrad et al., 2010). Sequencing of the p.t158m and p.r306c mutation was performed by amplifying DNA with RTT primers (Table 2.4). The amplicon was gel purified and sequenced using the same primers for amplification. 94
111 Primer Forward (5 à 3 ) Reverse (5 à 3 ) VV3 CTGGGAAAAAGGTCGTGCAG GGAATCCTGTTGGAGCTGGTC KR43 GGTGCTCTGCCCATCTATGC CCACAGCTGACTCCCATTCC SH8 CCCTTCATGTTGGTTCCTATATTC AATGTTACCCCAGTAAGAATCAGC KR14 CGAGGTTGCAGTGAGGTGTG CACTGGAATTTTGGGGGACA KR26 ACCTGCTCCCTCACCACTCA GCATTCTTCAGGCACCTTGG AC1 GGCACTGGTTGCCTGTATTT CCAGGGAGCAAGAGAGAATG AC4 GCTGTCTCCTCACGGTAAGC ACAAGCTGGCAAGAAAGGAA AC7 TTTTCATTCAGGCCCAACTC GAGCAACACCCACAGAGACA SH3 ATGGGCCCTCCCTGTTTTTCTC TGCTCTGCAAACCTGTAGTGGGAC VV4 GAGGCAGGCAAAGCAGAGAC CTTCCGTGTCCAGCCTTCAG MECP2Ex4 ACACATCCCTGGACCCTAATGA TGGGCTTCTTAGGTGGTTTCTG KR6 CCAAGAAGGAGCACCACCAC AGCCTCCTCTGGGCATCTTC KR16 ACGGCCGCAGAAAAGTACAA GCAATCCGCTCCGTGTAAAG FOXP2 TGCTAGAGGAGTGGGACAAGTA GAAGCAGGACTCTAAGTGCAGA RTT CGCTCTGCCCTATCTCTGAC AGTCCTTTCCCGCTCTTCTC ACTB TGAAGTGTGACGTGGACATC GGAGGAGCAATGATCTTGAT REX1 TCGCTGAGCTGAAACAAATG CCCTTCTTGAAGGTTTACAC ABCG2 TACCTGTATAGTGTACTTCAT GGTCATGAGAAGTGTTGCTA DNMT3B ATAAGTCGAAGGTGCGTCGT GGCAACATCTGAAGCCATTT Endo-OCT4 TGTCTCCGTCACCACTCTGG GTTCCCAATTCCTTCCTTAGTG Endo-SOX2 GTCAAGTCCGAGGCCAGC TACTCTCCTCTTTTGCACCCC Endo-KLF4 CGCCCGTTCCAGTGCCA GAAGATCCAGTCACAGACCC Endo-c-MYC GGAAAACAATGAAAAGGCCC GTTGCATTTGATCATGCATTTG pmxs-oct4 TGTCTCCGTCACCACTCTGG TCCCCCCTTTTTCTGGAGAC pmxs-sox2 CATGTCCCAGCACTACCAGA TCCCCCCTTTTTCTGGAGAC pmxs-klf4 GTTCCAGTGCCAAAAATGC TCCCCCCTTTTTCTGGAGAC pmxs-c-myc GCTCATTTCTGAAGAGGACTTG TCCCCCCTTTTTCTGGAGAC MBD CTGAAGGCTGGACACGGAAG WT MECP2 GAAGATGCCCAGAGGAGGCT TTGTACTTTTCTGCGGCCGT WT/Mut MECP2 CGCGCGCTCCCTCCTCTC TTCCGGACGGCTTTTACCACAGC AR FAM-CGTGCGCGAAGTGATCCAGA GTTTCTTTGCTGCTGCCTGGGGCTAGT 95
112 Table 2.4. Primers List of primers used in chapter 2 96
113 RTT-fibroblast cell culture Δ3-4-fibroblasts were expanded from a skin punch biopsy obtained from a classic RTTpatient at The Hospital for Sick Children, Canada, under the approval of the SickKids Research Ethics Board. T158M (GM17880)- and R306C (GM11270)-fibroblasts were acquired from the Coriell Cell Repository. Human male BJ-fibroblasts (CRL-2522) and female IMR90-fibroblasts (CCL-186) were obtained from American Type Culture Collection (ATCC). Fibroblasts from ATCC and the Δ3-4 RTT-patient, and Coriell, were maintained in fibroblast medium: Dulbecco s Modified Eagle Medium (DMEM) and Minimum Essential Medium (MEM), respectively, containing 10% volume per volume (vol/vol) fetal bovine serum, and 50 U ml -1 Penicillin and 50 mg ml -1 Streptomycin (all from Invitrogen) Generation of RTT-hiPSCs and cell culture of hpscs HiPSC generation from fibroblasts and culture was performed as previously described (Hotta et al., 2009a; Hotta et al., 2009b). In brief, RTT-fibroblasts were transduced with two lentiviral vectors (described in detail in section 2.5.4) prior to reprogramming. Plenti6/ubc/mSlc7a1, which encodes the receptor for ecotropic retrovirus, allows the subsequent transduction of pmxs retroviral vectors to deliver the reprogramming retroviral vectors. PL- EOS-C(3+)-EGFP-IRES-PURO r, a pluripotency reporter that expresses EGFP and puromycin resistance specifically in the pluripotent state to facilitate the isolation of hipscs. To perform reprogramming, RTT-fibroblasts were transduced twice with pmxs retroviral vectors (described in detail in section 2.5.4) encoding the reprogramming vectors, OCT4, SOX2, KLF4, and c- MYC, in addition to pmxs-mrfp1 to monitor infectivity and retroviral silencing. Transduced RTT-fibroblasts were cultured in fibroblast medium for one week. One week post-transduction, RTT-fibroblasts were transferred on to mitomycin C-inactivated mouse embryonic fibroblasts which served as feeders and cultured in hpsc medium: KnockOut DMEM containing 15% (vol/vol) KnockOut Serum Replacement, 2mM GlutaMAX, 50 U ml -1 Penicillin and 50 mg ml -1 Streptomycin, 0.1mM MEM Non-Essential Amino Acids (NEAA), 0.5mM 2-mercatoethanol (all from Invitrogen), and 10 ng ml -1 recombinant human bfgf (PeproTech). During reprogramming, hpsc medium were supplemented with 1 µg ml -1 puromycin (Sigma) when hipsc colonies began to emerge at approximately two weeks post-transduction to facilitate subsequent hipsc isolation. HiPSC colonies appeared approximately four weeks post- 97
114 transduction and were manually isolated to establish hipsc lines. Established hipscs were maintained on feeders with hpsc medium. CA1 and H9 hescs were obtained from A. Nagy (Mount Sinai Hospital, Toronto, Canada) and The WiCell Research Institute (Wisconsin, USA), respectively, and cultured under the approval of the Canadian Institutes of Health Research Stem Cell Oversight Committee. Culture conditions for hescs are identical to those for hipscs (Hotta et al., 2009a; Hotta et al., 2009b). HPSCs were occasionally maintained in feeder free conditions consisting of surfaces coated with Matrigel (BD Biosciences) with mtesr medium (STEMCELL Technologies) as previously described (Ludwig et al., 2006). R306C-hiPSCs has passed stringent quality control standards by the Coriell Cell Repository and is available for distribution to the scientific community (Catalog ID: GM23298) Generation and transduction of lentivirus and retrovirus The generation and transduction of lentivirus and retrovirus was performed as previously described (Hotta et al., 2009a; Hotta et al., 2009b). In brief, plasmids containing cdna of interest were transfected into Plat-E cells, for retroviruses, or 293T cells, for lentivirus, using Lipofectamine 2000 (Invitrogen). The supernatant containing virus was collected 48 hours posttransfection and passed through a 0.45 µm filter (Nalgene) to remove cellular debris. Lentiviruses were concentrated by ultracentrifugation at 4 C, two hours, 30,000 rounds per minute with a T-865 rotor (Sorvall). The viral pellet was soaked in 40 µl Hank s Balanced Salt Solution (Invitrogen) overnight at 4 C and resuspended. Transduction of cells was performed in the presence of 8 µg ml -1 Hexadimethrine bromide (Sigma). Plat-E and 293T cells were maintained in virus production medium: DMEM containing 10% fetal bovine serum (vol/vol), 0.1mM MEM NEAA, and 50 U ml -1 Penicillin and 50 mg ml -1 Streptomycin (all from Invitrogen) Immunocytochemistry Cells were rinsed with 2x Phosphate-Buffered Saline (1X) (PBS) (Invitrogen) washes, fixed with 4% (vol/vol) formaldehyde (EMD Biosciences) diluted in PBS for 10 min at room temperature, rinsed with 3x PBS washes for 5 min at room temperature, permeabilized with 0.1% (vol/vol) Nonidet P-40 (Sigma) diluted in PBS for 10 min at room temperature, and rinsed with 3x PBST (0.1% (vol/vol) Tween-20 [Sigma] diluted in PBS) washes for 10 min at room 98
115 temperature. Cells were blocked overnight at 4 C in block solution: 10% (vol/vol) serum of host species (Normal Donkey Serum [Millipore], Normal Goat Serum [Cedarlane], Normal Rabbit Serum [Jackson Immunoresearch]) of secondary antibody and 1% weight per volume (wt/vol) bovine serum albumin (Sigma) diluted in PBST. Cells were then incubated with primary antibodies (Table 2.5) diluted in block solution overnight at 4 C. Cells were rinsed with 3x PBST washes for 10 min at room temperature and incubated with appropriate Alexa Fluor secondary antibodies (Invitrogen) diluted (1:500) in block solution for one hour at room temperature, followed by 3x PBST washes for 10 min at room temperature. Nuclei were stained with 0.5 µg ml -1 4,6-diamidino-2-phenylindole dihydrochloride (DAPI) (Sigma) diluted in PBS for 10 min at room temperature followed by 2x PBS washes. Neurons grown on coverslips (Bellco) were processed in an identical manner except that it was mounted on slides with 0.5 µg ml -1 DAPI diluted in fluorescent mounting medium (Dako). Images were captured using a Leica DMI4000B microscope equipped with Leica DFC340FX camera and Leica Application Suite software or Zeiss Axiovert 200M microscope equipped with a Hamamatsu C EMCCD camera and Improvision Volocity software. Soma size analysis of neurons was performed manually using Improvision Volocity software on 40X images from 50 randomly selected fields from 26 coverslips over two independent biological replicates of neuronal differentiation per hipsc line and blinded to the observer. 99
116 Antibody Company Catalogue Number Dilution Goat IgG NANOG R&D Systems AF1997 1:20 Rat IgM SSEA3 Invitrogen :100 Mouse IgG SSEA4 Invitrogen :100 Mouse IgM TRA1-60 Invitrogen :100 Mouse IgM TRA1-81 Invitrogen :100 Mouse IgG TUJ1 Chemicon MAB1637 1:200 Rabbit NESTIN Chemicon AB5922 1:200 Mouse IgG SMA Invitrogen :200 Mouse IgG MYOSIN Sigma M7786 1:200 Mouse IgG α-actinin Santa Cruz SC :200 Mouse IgG SOX17 R&D Systems MAB1924 1:100 Rabbit GATA4 Santa Cruz SC :200 Rabbit MAP2 Millipore AB5622 1:1000 Mouse IgG MECP2 Sigma M6818 1:1000 Rabbit H3K27me3 Upstate :300 Table 2.5. Antibodies List of antibodies used in chapter 2 100
117 RNA isolation and qpcr analysis Total RNA was isolated using TRIzol Reagent (Invitrogen) as per instructions of manufacturer. CDNA was generated from 1 µg of DNase I (Invitrogen)-treated total RNA using SuperScript II (Invitrogen) as per instructions of manufacturer. RT-PCR and qrt-pcr were performed using specific primer sequences (Table 2.4). QRT-PCR was performed as described for qpcr in MECP2 Genotyping (section 2.5.1). The housekeeping gene, ACTB (BETA- ACTIN), was used to normalize for differences in cdna input. For exogenous reprogramming factors, IMR90-fibroblasts freshly infected with OCT4, SOX2, KLF4, c-myc, and mrfp1 retroviral vectors (IMR90-4F+RFP) were used as a positive control; for endogenous pluripotency loci, H9 hescs were used as a positive control. Sequencing of p.t158m and p.r306c from cdna was performed by amplifying cdna with MBD-Fwd and MECP2 Ex4- Rev primers or MECP2 Ex4-Fwd and RTT-Rev primers, respectively (Table 2.4). Amplicons were purified using a QIAquick PCR Purification Kit (QIAGEN) as per instructions of manufacturer and sequenced using the same primers for amplification. Differentiated fetal neural stem cells (Diff. fnscs) which differentiate into 10-20% neurons (astrocytes make up the remaining percentage) were used as a positive control for RT-PCR and qrt-pcr for MECP2 (kind gift from P. Dirks). RT-PCR and qrt-pcr for WT MECP2 was performed using WT MECP2 and MECP2Ex4 primers, respectively (Table 2.4). Fetal neural stem cells were isolated from tissues obtained under the approval of the SickKids Research Ethics Board In vitro and in vivo differentiation For in vitro differentiation, hipscs were detached and grown in suspension on low attachment surfaces (Corning) in hpsc medium without bfgf for eight days to form EBs with medium changes every other day. EBs were adhered on to plastic surfaces and allowed to further differentiate for eight days with medium changes every other day. Cells were then analysed via ICC for markers representative of the three germ layers (Table 2.5). For in vivo differentiation, one 10 cm dish of hipscs were detached and resuspended in a mixture of KnockOut DMEM (Invitrogen), Matrigel (BD Biosciences), Collagen (STEMCELL Technologies) (ratio 2:1:2 vol/vol), supplemented with 10 µm ROCK Inhibitor (Sigma) and injected intramuscularly into immunodeficient mice. Tumours were harvested 9 to 12 weeks after injection. Fixed tumours were embedded in paraffin, sectioned, and stained with hematoxylin and eosin for pathological analysis. All procedures using animals were approved 101
118 by the SickKids Animal Care Committee under the auspices of The Canadian Council on Animal Care, and conducted with the approval of the Canadian Institutes of Health Research Stem Cell Oversight Committee Karyotyping and DNA fingerprinting Standard G-banding chromosome analysis with a banding resolution was performed at TCAG. DNA fingerprinting was performed using the GenomeLab Human STR Primer Set and analysed by the GenomeLab GeXP Genetic Analysis System (all from Beckman Coulter) as per instructions of manufacturer RNA-FISH and DNA-FISH XIST RNA-Fluorescent in situ hybridization (FISH) and/or X-centromere DNA-FISH was performed using probes and protocols as previously described (Chadwick and Willard, 2001; Li and Carrel, 2008). Probes were directly labeled using Nick Translation and Ares Alexa Fluor DNA labelling kits (Invitrogen). Slides were viewed on Nikon TE2000-U microscope with a Roper Scientific CCD camera and NIS elements software package. At least 12 colonies were scored for each line. Results within a colony are based on scoring cells from three independent fields of vision at 60X magnification (> 75 cells scored per colony). XIST RNA positive colonies had a large accumulation of XIST RNA in more than 90% of the cells in each observed region. Colonies that were scored as XIST RNA negative had no observable XIST RNA. Occasionally, colonies exhibit a mixture of XIST RNA positive and negative cells. For DNA-FISH, the same criteria were used to classify colonies as diploid or aneuploid for the X chromosome Androgen Receptor assay To analyse XCI patterns, 200 ng of DNA was digested for two hours at 37 C with methylation-sensitive enzymes HpaII and HhaI (Invitrogen) simultaneously to obtain the (methylated) Xi only. To differentiate between the two parental X-chromosomes, 20 ng of digested and undigested DNA was amplified with primers (Table 2.4) designed against the polymorphic trinucleotide (CAG) repeat in the first exon of the AR gene for 32 cycles. The 5 end of the forward primer is labeled with FAM fluorescein (Invitrogen). PCR products were analysed at TCAG. In brief, PCR products were separated on an ABI3100 Genetic Analyser 102
119 with 500 LIZ size standard and analysed by Peak Scanner software (all from Applied Biosystems). XCI ratio was calculated as previously described (Marchetto et al., 2010). In brief, a correction factor was calculated using peak areas of the undigested samples to normalize for preferential amplification of one of the two AR alleles. The XCI ratio was then calculated using the corrected peak area in the digested samples. Male BJ-fibroblasts were used as a positive control for complete digestion of the (unmethylated) Xa. For R306C-fibroblasts and -hipscs, the 171 bp allele will include the stutter peak of the 174 bp allele. Therefore, the signal of the 171 bp allele will be an overestimate. Stutter peak is defined as a 3 bp smaller peak due to polymerase slippage over trinucleotide repeat sequences Directed differentiation of hipscs into neurons Neuronal differentiation was performed as previously described with slight modifications (Figure 2.19) (Li et al., 2009b). In brief, hipscs day (d) 0 were detached and resuspended in hpsc medium for 3 days with medium changes every day. CAs were then cultured for 3 days with medium changes every other day in neuronal medium: DMEM/F-12 containing N2 (100X), 0.1 mm MEM NEAA (all from Invitrogen), and 2 µg ml -1 Heparin (Sigma). Suspended CAs (d7) were then adhered on to a plastic surface coated with 20 µg ml -1 Laminin (Roche) for 11 days in neuronal medium to generate NE cells with medium changes every other day. NE cells (d17) were manually detached and cultured as NE clusters for five days in neuronal medium with medium changes every other day. For neuronal differentiation, NE clusters (d21) were adhered on to 0.1 mg ml -1 Poly-L-Ornithine (Sigma) and 20 µg ml -1 Laminin-coated coverslips in neuronal differentiation medium: Neurobasal containing N2 (100X), 0.1 mm MEM NEAA, B27 without Vitamin A (50X), 50 U ml -1 Penicillin and 50 mg ml -1 Streptomycin (all from Invitrogen), BDNF, GDNF, IGF1 (all from Peprotech at 10 ng ml - 1 ), 1 µm N6,2 -O-dibutyryladenosine 3,5 -cyclic monophosphate sodium salt (camp), 200 ng ml -1 Ascorbic Acid (all from Sigma), and 1 µg ml -1 Laminin. Neuronal differentiation medium was changed every other day as neurons differentiate from the NE clusters and mature up to 9 to 10 weeks (i.e. an additional 6 ~ 7 weeks) (Johnson et al., 2007; Li et al., 2009b). 103
120 Chapter 3 3. Disruption of MECP2e1 isoform alone is sufficient for a Rett Syndrome phenotype in hipsc-derived neurons The data described in this chapter are in preparation or published in the following manuscripts: Rastegar M, Hotta A, Pasceri P, Makarem M, Cheung AYL, Elliott S, Park KJ, Adachi M, Jones FS, Clarke ID, Dirks P, Ellis J. MECP2 Isoform-Specific Vectors with Regulated Expression for Rett Syndrome Gene Therapy. PLoS One 4 (8), e6810 (2009). Cheung AYL*, Djuric U*, Zhang W*, Piekna A, Hendry JA, Ross PJ, Pasceri P, Kim DS, Salter MW, Ellis J. The E1 isoform of MECP2 controls neuronal form and function in Rett syndrome. Submitted. *These authors contributed equally to this work Author contributions: A.Y.L.C performed the following experiments: directed differentiation, culture, maintenance of RTTe1-hiPSCs into NPCs and neurons including its distribution and use by collaborators (Figure 3.6, 3.7); generation and transduction of RTTe1-NPCs with MECP2e1 vectors (Figure 3.8, 3.9); neuronal phenotyping (Figure ); Characterization and XCI analysis of RTTe1-hiPSCs (Figure 3.2). A.Y.L.C wrote the manuscript in Djuric, Cheung, Zhang et al., (in prep). A.Y.L.C generated MECP2-isoform specific lentiviral vectors and edited the manuscript in Rastegar et al., (2009). The following were aided by the following members: Generation and characterization of RTTe1-hiPSCs (Figure Alina Piekna, Technician, Dr. James Ellis lab), XCI analysis of RTTe1-hiPSCs (Figure Ugljesa Djuric, Graduate Student, Dr. James Ellis lab), Single cell Fluidigm array (Figure Ugljesa Djuric, Graduate Student, Dr. James Ellis lab; Jason A. Hendry, Summer Student, Dr. James Ellis lab), neuronal differentiation of RTTe1- and Δ3-4- hipscs (Figure P. Joel Ross, Postdoctoral Fellow, Dr. James Ellis lab; Alina Piekna, Technician, Dr. James Ellis lab). 104
121 3.1. Abstract RTT is a neurodevelopmental disorder that affects girls due primarily to mutations in the X-linked gene encoding MECP2. MECP2 encodes four exons that are alternatively spliced into two isoforms referred to as MECP2e1 and MECP2e2. MECP2 isoform-specific functions are unknown, but due to its higher abundance in the brain and reports of MECP2e1-specific mutations associated with RTT, MECP2e1 is hypothesized to be the functional isoform in the brain. We report the generation of hipscs from a RTT patient (RTTe1) carrying a mutation that specifically disrupts MECP2e1 while MECP2e2 remains intact. RTTe1-hiPSCs were fully reprogrammed and pluripotent. RTTe1-hiPSCs retain an Xi in a nonrandom pattern where most RTTe1-hiPSCs expressed the mutant MECP2e1 allele. RTTe1-hiPSC-derived neurons exhibited a soma size defect that can be rescued by MECP2e1 vectors in a cell autonomous manner. In conclusion, disruption of MECP2e1 alone is sufficient for a RTT phenotype at the cellular level. The RTTe1-hiPSCs reported here represent an invaluable tool to further elucidate the role of MECP2 isoforms in human neurons. 105
122 3.2. Brief Introduction and Rationale RTT is a neurodevelopmental disorder affecting roughly 1 in 10,000 live female births (Chahrour and Zoghbi, 2007). Genetically, over 95% of classic RTT patients harbour a loss-offunction mutation in the X-linked gene encoding MECP2 (Amir et al., 1999). In addition, gainof-function mutations, such as duplication, of MECP2 are also reported to result in severe neurological symptoms highlighting the tight regulation of MECP2 levels that is required for the well-being of an individual (Ariani et al., 2004; Friez et al., 2006; Meins et al., 2005; Van Esch et al., 2005). MECP2 functions as a transcriptional regulator by tracking methylated DNA genome-wide and recruiting chromatin-remodeling proteins (Ben-Shachar et al., 2009; Chahrour et al., 2008; Skene et al., 2010). MECP2 encodes four exons and is alternatively spliced into two isoforms that differ at the N-termini referred to as MECP2e1 and MECP2e2 (Figure 1.3) (Kriaucionis and Bird, 2004; Mnatzakanian et al., 2004). MECP2e1 includes exons one, three and four, while MECP2e2 encodes all four exons, although the start codon of the latter is situated in exon two. The relative importance and isoform-specific functions of MECP2e1 and MECP2e2 are poorly understood. MECP2e1 is thought to be the predominant isoform given its higher expression in the mouse brain and human neurons (Dragich et al., 2007; Kriaucionis and Bird, 2004; Mnatzakanian et al., 2004). The relatively higher expression of Mecp2e1 compared to Mecp2e2 is thought to be due to translation interference and/or competition with the upstream start codon in exon 1 (Kriaucionis and Bird, 2004). Furthermore, MECP2 mutations in RTT patients that specifically disrupt MECP2e1 but not MECP2e2 have been identified (Amir et al., 2005; Bartholdi et al., 2006; Chunshu et al., 2006; Fichou et al., 2009; Mnatzakanian et al., 2004; Quenard et al., 2006; Ravn et al., 2005; Saunders et al., 2009). However, Mecp2e2 interacts with Foxg1 and regulates apoptosis in mouse neurons (Dastidar et al., 2012). Mecp2e2-isoform specific mutant mice have no neurological phenotypes associated with RTT but instead exhibit placental defects leading to reduced embryo viability when the Mecp2e2-null allele is from the maternal origin (Itoh et al., 2012). Together with the abundant expression of Mecp2e2 in the mouse placenta, it likely plays a role in placental development. These studies suggest isoform-specific functions of MECP2e1 and MECP2e2. However, although there is debate, it has been suggested that mutations affecting MECP2e1 genetically can interfere with MECP2e2 translation resulting in complete loss of MECP2 protein (Fichou et al., 2009; Gianakopoulos et al., 2012; Saxena et al., 2006). Furthermore, Mecp2-null mice phenotypes can also be improved by either Mecp2e1 or Mecp2e2 106
123 transgenes when expressed at appropriate levels (Alvarez-Saavedra et al., 2007; Giacometti et al., 2007; Jugloff et al., 2008; Kerr et al., 2012; Luikenhuis et al., 2004), suggesting that it is total Mecp2 expression, contributed by the two isoforms, which is the deterministic factor for the well-being of the animal. Most studies performed to date elucidating MECP2 isoform function have been conducted in mice while studies in human neurons are scarce due to their inaccessibility. For these reasons, a method that will allow for the generation of large numbers of affected neurons directly from RTT patients will be advantageous to further understand the role of MECP2 and pathogenesis of RTT in human neurons. HiPSCs, which are similar to hescs molecularly and functionally, can be derived from adult somatic cell types via the introduction of defined transcription factors (Park et al., 2008b; Takahashi et al., 2007; Yu et al., 2007). The generation of patient-specific hipscs has major implications as disease phenotyping, drug screens, and cell therapy. Indeed, hipscs have been generated from a variety of diseases, including many with a neurological basis, where specific phenotypes have been observed in vitro and proof-ofprinciple drug screens have been performed (Table 1.1). In chapter two, I described the generation of RTT-hiPSCs that carry mutations that affect both MECP2 isoforms (Cheung et al., 2011). These RTT-hiPSC-derived neurons were demonstrated to exhibit a neuronal maturation phenotype reminiscent to those seen in RTT patients and mouse models. Furthermore, RTT-hiPSC-derived neurons are amenable to rescue by introduction of exogenous MECP2 or drugs similar to mouse models (Marchetto et al., 2010). Finally, in chapter two, I demonstrated that female hipscs retaining an Xi can be isolated allowing the generation of mutant and isogenic control hipscs from a single female individual carrying a heterozygous X-linked disease such as RTT (Cheung et al., 2011). These data suggests that hipsc technology can be used to model RTT and decipher MECP2 function in human neurons. To further elucidate the role of MECP2 isoforms, we report the generation of hipscs from a RTT patient with a mutation resulting in specific disruption of MECP2e1 (Mnatzakanian et al., 2004). RTTe1-hiPSCs were pluripotent and fully reprogrammed and retained an Xi such that all RTT-hiPSC lines expressed the mutant MECP2e1 allele. RTTe1-hiPSCs were differentiated into NPCs and subsequently into neurons. Using single cell Fluidigm arrays, we demonstrated that RTTe1-hiPSCs efficiently differentiated into neurons. RTTe1-hiPSC-derived neurons exhibited a soma size defect that can be rescued by exogenous expression MECP2e1 isoform-specific vector (Rastegar et al., 2009). In summary, disruption of the MECP2e1 isoform 107
124 alone is sufficient for cellular RTT phenotypes and RTTe1-hiPSCs will serve as an invaluable tool for further elucidating the function of the MECP2 isoforms in human neurons Results Isolation of mutant RTTe1-hiPSCs through XCI To begin elucidating the role of MECP2 isoforms, fibroblasts were acquired from a RTT patient who has been previously characterized to carry an 11 bp deletion in the first exon of MECP2 (Mnatzakanian et al., 2004). This mutation causes a frame shift in MECP2e1 resulting in the use of a pretermination codon in exon three upstream of the MBD (Figure 3.1) (Gianakopoulos et al., 2012). MECP2e2 remains intact as the start codon is downstream of the deletion. To generate RTTe1-hiPSCs, RTTe1-fibroblasts were transduced with retroviral vectors encoding OCT4, SOX2, KLF4, and c-myc as described in chapter two (Hotta et al., 2009a; Hotta et al., 2009b). Overall, 22 RTTe1-hiPSC lines were isolated. In chapter two, I demonstrated that female hipscs maintaining an Xi in a nonrandom pattern can be isolated allowing the isolation of mutant and isogenic control hipscs from a single female patient harbouring a heterozygous X-linked disease (Cheung et al., 2011). To prioritize which RTTe1-hiPSC lines to focus on, we first screened for the XCI status of RTTe1- hipscs. To determine the XCI pattern of RTTe1-hiPSCs, we investigated the AR locus as described in chapter two. We observed a random XCI pattern in RTTe1-fibroblasts (67:33) while all RTTe1-hiPSCs exhibited a profile consistent with nonrandom XCI skewing (80:20 ~ 100:0) (Figure 3.2a, Table 3.1). Interestingly, all RTTe1-hiPSC lines skewed towards the same parental X-chromosome inactivated. Given that all RTTe1-hiPSCs skewed towards the same parental X-chromosome being inactivated, we chose four RTTe1-hiPSC lines to further characterize (Table 3.2). To determine which MECP2 allele is expressed in the RTTe1-hiPSCs, we took advantage of the low expression of MECP2 in hipscs and sequenced the cdna with primers spanning the 11 bp deletion in exon one of MECP2. We observed that all the RTTe1-hiPSCs expressed the mutant MECP2 transcript (Figure 3.2b). RTTe1-hiPSCs were demonstrated to be fully reprogrammed as they largely silenced the retroviral vectors used for reprogramming (Figure 3.3a) and reactivated the endogenous counterparts in addition to the bona fide hipsc markers REX1, ABCG2, and DNMT3B (Figure 3.3b) (Chan et al., 2009). RTTe1-hiPSCs were pluripotent as demonstrated by the ability to generate the three germ layers in vitro via EB 108
125 formation (Figure 3.4). Genetically, RTTe1-hiPSCs maintained a normal karyotype (Figure 3.5). Finally, we wanted to ensure that the mutant RTTe1-hiPSCs retain this MECP2 expression pattern upon differentiation. We performed AR assay and cdna sequencing in RTTe1-hiPSC-derived neurons (see below) and observed that they retained the same parental X- chromosome inactivated and continued to express the mutant MECP2e1 allele (Figure 3.2c-d, Table 3.1). In summary, these data demonstrate the generation of hipscs from a RTTe1 patient carrying a mutation that disrupts MECP2e1 while leaving MECP2e2 intact. RTTe1-hiPSCs are pluripotent and fully reprogrammed and retained an Xi in a nonrandom pattern where the hipsc lines expressed the mutant MECP2 allele. 109
126 Figure 3.1. Schematic of the RTTe1 MECP2 mutation The RTTe1 MECP2 mutation consists of an 11 bp deletion (g.104_115del [red bar]) in the first exon of MECP2. This mutation causes a frame shift in MECP2e1 resulting in the use of a pretermination codon in exon three upstream of the methyl-cpg binding domain while leaving MECP2e2 intact as the start codon of the latter is downstream of the deletion. ATG, start codon. PTC, pretermination codon. 110
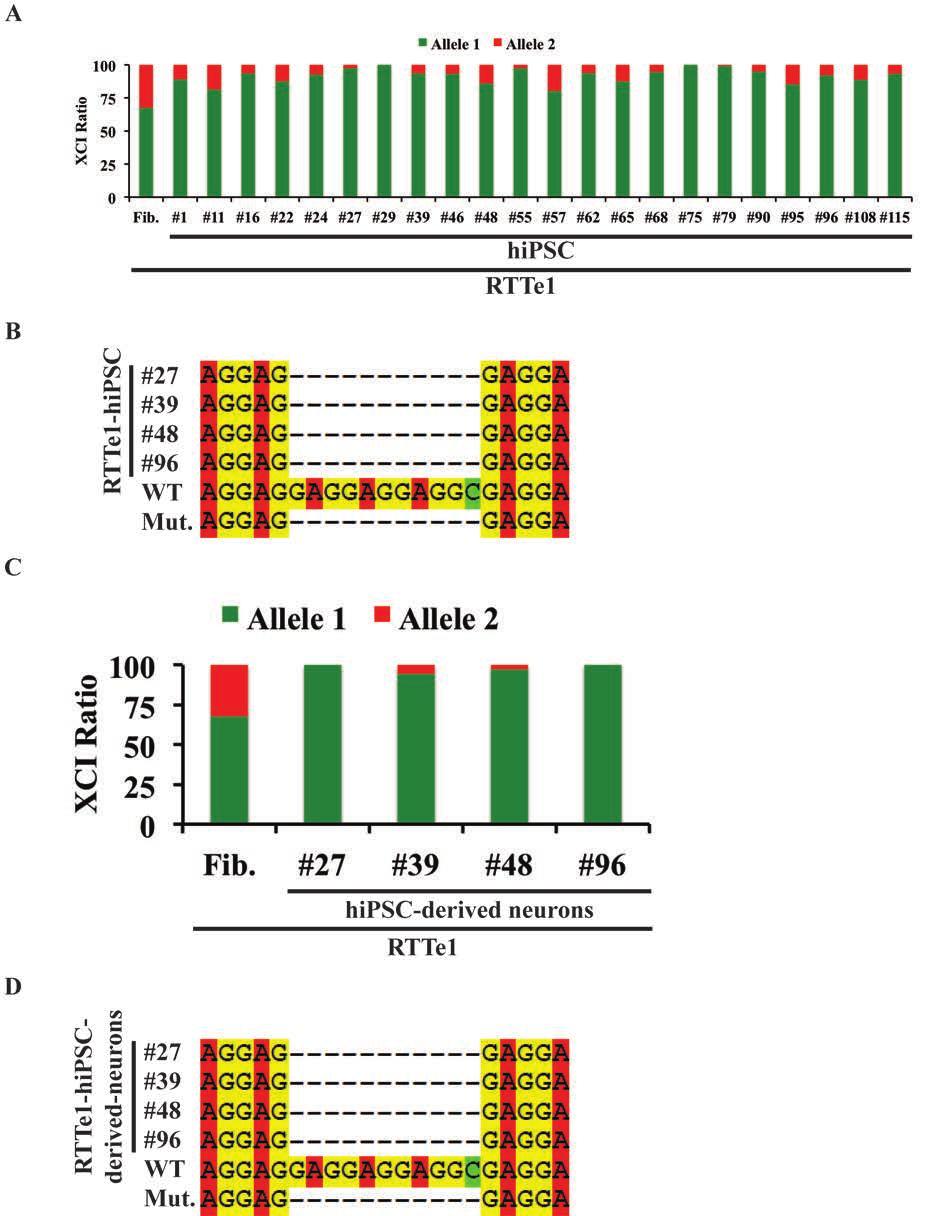
127 111
128 Figure 3.2. XCI analysis of RTTe1-hiPSCs and -neurons (A) Multiple RTTe1-hiPSC lines were screened via the AR assay. The XCI ratio was calculated and depicted by the bar graph. All RTTe1-hiPSCs had the same parental X-chromosome inactivated. Fib., fibroblasts. (B) To determine which MECP2 allele was expressed in RTTe1-hiPSCs, sequencing was performed on cdna of RTTe1-hiPSCs using primers spanning the 11 bp deletion in exon 1 of MECP2. The WT and mutant RTTe1 sequences are shown. All RTTe1-hiPSC lines expressed the mutant MECP2 transcript. Mut., mutant RTTe1 sequence. (C) AR assay was performed on RTTe1-hiPSC-derived neurons. The XCI ratio was calculated and depicted in the bar graph. RTTe1-hiPSC-derived neurons maintained the same Xi as parental RTT-hiPSCs. Fib., fibroblasts. (D) To determine which MECP2 allele was expressed in RTTe1-neurons, sequencing was performed on cdna of RTTe1-hiPSCs using primers spanning the 11 bp deletion in exon 1 of MECP2. The WT and mutant RTTe1 sequences are shown. All RTTe1-hiPSC-derived neurons expressed the mutant MECP2 transcript. Mut., mutant RTTe1 sequence. 112
129 Figure 3.3. RTTe1-hiPSCs expressed bona fide pluripotency markers and silenced the reprogramming factors (A) RTTe1-hiPSCs have largely silenced the reprogramming factors in comparison to IMR90-4F+RFP as detected by qrt-pcr. Data are expressed as mean ± SEM. (B) RTTe1-hiPSCs expressed bona fide hipsc markers and reactivated endogenous pluripotency-associated genes similar to H9 hescs as detected by qrt-pcr. Data are expressed as mean ± SEM. 113
,")
130 Figure 3.4. RTTe1-hiPSCs are pluripotent in vitro RTTe1-hiPSCs differentiate into the three germ layers, ectoderm (TUJ1), mesoderm (SMA [SMOOTH MUSCLE ACTIN]), and endoderm (GATA4), in vitro via EB formation. Scale bars, 50 µm. 114

131 Figure 3.5. Karyotype of RTTe1-hiPSCs RTTe1-hiPSCs carry a normal female karyotype as detected by G-banding analysis. Passage number of analysis is indicated in brackets. P, passage. 115
132 ± HpaII & HhaI Sample Peak Area Corrected Peak Area XCI Ratio Allele 1 Allele 2 Allele 1 Allele 2 Allele 1 Allele 2 Undigested RTTe1-Fibroblasts Undigested RTTe1-hiPSC # Undigested RTTe1-hiPSC # Undigested RTTe1-hiPSC # Undigested RTTe1-hiPSC # Undigested RTTe1-hiPSC # Undigested RTTe1-hiPSC # Undigested RTTe1-hiPSC # Undigested RTTe1-hiPSC # Undigested RTTe1-hiPSC # Undigested RTTe1-hiPSC # Undigested RTTe1-hiPSC # Undigested RTTe1-hiPSC # Undigested RTTe1-hiPSC # Undigested RTTe1-hiPSC # Undigested RTTe1-hiPSC # Undigested RTTe1-hiPSC # Undigested RTTe1-hiPSC # Undigested RTTe1-hiPSC # Undigested RTTe1-hiPSC # Undigested RTTe1-hiPSC # Undigested RTTe1-hiPSC # Undigested RTTe1-hiPSC # Undigested RTTe1-hiPSC #27 derived neurons Undigested RTTe1-hiPSC #39 derived neurons Undigested RTTe1-hiPSC #48 derived neurons Undigested RTTe1-hiPSC #96 derived neurons Digested RTTe1-Fibroblasts Digested RTTe1-hiPSC #
133 ± HpaII & HhaI Sample Peak Area Corrected Peak Area XCI Ratio Allele 1 Allele 2 Allele 1 Allele 2 Allele 1 Allele 2 Digested RTTe1-hiPSC # Digested RTTe1-hiPSC # Digested RTTe1-hiPSC # Digested RTTe1-hiPSC # Digested RTTe1-hiPSC # Digested RTTe1-hiPSC # Digested RTTe1-hiPSC # Digested RTTe1-hiPSC # Digested RTTe1-hiPSC # Digested RTTe1-hiPSC # Digested RTTe1-hiPSC # Digested RTTe1-hiPSC # Digested RTTe1-hiPSC # Digested RTTe1-hiPSC # Digested RTTe1-hiPSC # Digested RTTe1-hiPSC # Digested RTTe1-hiPSC # Digested RTTe1-hiPSC # Digested RTTe1-hiPSC # Digested RTTe1-hiPSC # Digested RTTe1-hiPSC # Digested RTTe1-hiPSC #27 derived neurons Digested RTTe1-hiPSC #39 derived neurons Digested RTTe1-hiPSC #48 derived neurons Digested RTTe1-hiPSC #96 derived neurons
134 Table 3.1. Quantification of AR assay in RTT-hiPSCs Peak area values of the AR assays in Figure 3.2. The corrected peak area was calculated and the XCI skewing ratio was determined (see Materials and Methods). 118
135 RTTe1-hiPSC #27 #39 #48 #96 MECP2 cdna hipscs Mutant Mutant Mutant Mutant sequencing Neurons Mutant Mutant Mutant Mutant AR Assay hipscs Neurons Pluripotency pmxs gene expression Endo Functional In vitro Pluripotency In vivo IPR IPR IPR IPR Karyotype Neuronal Differentiation B D J D Fluidigm Soma Size Neurons Rescued-neurons N/A N/A N/A Table 3.2. Summary of RTTe1-hiPSCs studied Four RTTe1-hiPSC lines were extensively studied in this chapter. Shown are the experiments that were performed on each RTTe1-hiPSC line. N/A, experiment not performed. IPR, in progress. 119
136 Directed differentiation of RTTe1-hiPSCs into neurons To determine whether the lack of MECP2e1 alone is sufficient for a RTT-associated phenotype and if so, whether exogenous expression of MECP2e1 alone can rescue these phenotypes, RTTe1-hiPSCs were differentiated into neurons. To that end, optimization of three neuronal differentiation protocols (known as B, D, and J) that differed slightly was required for each RTTe1-hiPSC line (Table 3.2). All three neuronal differentiation protocols are based on previously described protocols for hpscs (Brennand et al., 2011; Chambers et al., 2009; Kim et al., 2012). The general outlines of the three neuronal differentiation protocols are the following. To initiate neural induction, RTTe1-hiPSCs were resuspended to form CAs in the presence of dual SMAD inhibition and FGF2 for up to one week (Figure 3.6). CAs were then seeded in an adhesive manner to form one to two rounds of NE cells up to two weeks. NE cells were then manually harvested to establish NPC lines. NPC lines can self renew in the presence of FGF2 or be induced to differentiate into neurons by seeding in the presence of neurotrophic factors including BDNF, GDNF, and IGF1 with or without DAPT and matured for two weeks prior to neuronal phenotyping. The requirement of the different neuronal differentiation protocols for the different RTTe1-hiPSC lines is not surprising. It has been previously reported that there are variations in the differentiation propensity of independent hpsc lines (Bock et al., 2011; Boulting et al., 2011; Hu et al., 2010; Osafune et al., 2008). These differences in differentiation propensity in hipsc lines can be overcome by optimizing differentiation protocols for each hipsc line (Boulting et al., 2011; Hu et al., 2010). The process in which we optimized the neuronal differentiation protocol was the following. Initially, the B-protocol was used on RTTe1-hiPSC #27 with great success but the other three RTTe1-hiPSC lines exhibited excessive proliferation of NPCs during neuronal differentiation. Addition of DAPT to the neuronal differentiation media (J-protocol) was able to reduce this effect in RTTe1-hiPSC #48, but not the other two RTTe1-hiPSC lines. Finally, to increase the purity of NPCs from lines RTTe1-hiPSC #39 and #96, we employed an alternative method (D-protocol) in isolating neural rosettes by altering how the neural rosettes were manually isolated and the substrate on which the NPC s grew on (See Materials and Methods for details on the different neuronal differentiation protocols). The analysis of RTTe1-hiPSC-derived neurons using different neuronal differentiation protocols were compared to Δ3-4-hiPSC #37-derived neurons, a previously described control RTT-hiPSC expressing WT MECP2 that I generated in chapter two (Cheung et al., 2011), generated in 120
137 parallel with the same protocol. Δ3-4-hiPSCs were used as a control hipsc line as I was not able to isolate isogenic control RTTe1-hiPSCs. Given the heterogeneous nature of directed differentiation protocols from hpscs (Bock et al., 2011; Boulting et al., 2011; Hu et al., 2010; Osafune et al., 2008), we analysed the RTTe1-hiPSC-derived neurons using single cell Fluidigm arrays designed to investigate neuronal identity as previously described for hipsc-derived neurons from Timothy Syndrome (TS) (Pasca et al., 2011). The single cell Fluidigm array was designed to measure the expression of markers representing the type of cells being generated (i.e. NPCs, neurons, neural crest, glia), regional identity (anterior-posterior, dorsal-ventral), and neuronal subtype (i.e. glutamatergic, GABAergic, dopaminergic, serotonergic). A high proportion (50 ~ 70%) of RTTe1-hiPSCderived neurons expressed neuronal markers, DCX, NCAM, MAP2 (Figure 3.7). The remaining cells are likely to be NPC (30 ~ 40%) in nature as shown by the expression of NPC marker, NESTIN, and neural rosette markers, PLZF and ZO1, and a very small minority (~ 5%) of undifferentiated RTTe1-hiPSCs as shown by the pluripotency marker, NANOG. The regional identity of the neurons was heterogeneous in nature with a roughly equal distribution of markers representative of the forebrain and midbrain. Furthermore, majority of RTTe1-neurons expressed cortical markers that were representative of both lower (FOXP1, ETV1) and upper layers (SATB2, CTIP2, CUX1, REELIN). Interestingly, some RTTe1-hiPSC-derived neurons showed promiscuous expression of some NPC markers similar to that observed in TS-hiPSCderived neurons (Pasca et al., 2011). Finally, there was a similar proportion of glutamatergic and GABAergic neurons generated (~ 20% each) and small amount of dopaminergic neurons (~ 10%). In summary, these results describe the generation of neurons from RTTe1-hiPSCs. 121
138 Figure 3.6. Schematic of directed differentiation of RTTe1-hiPSCs into NPCs and neurons Three neuronal differentiation protocols were used to differentiate RTTe1-hiPSCs into NPCs and neurons. In general, RTTe1-hiPSCs were resuspended to form CAs in the presence of dual SMAD inhibition and FGF2 for up to one week. CAs were then seeded in an adhesive manner to form one to two rounds of NE cells over up to two weeks. NE cells were then manually harvested to establish NPC lines. NPC lines can self renew in the presence of FGF2 or be induced to differentiate into neurons by seeding in the presence of BDNF, GDNF, and IGF1 with or without DAPT and mature over the next two weeks prior to neuronal phenotyping. SMADi, SMAD inhibition. 122
. Top, proportion of cells that expressed a cell-specific marker. Bottom, gene expression profiles of single neurons.")
139 Figure 3.7. Single cell Fluidigm array of RTTe1-hiPSC-derived neurons RTTe1-hiPSC-derived NPCs were differentiated into neurons for six weeks. Single cell Fluidigm array was performed on RTTe1-hiPSC-derived neurons (n = 301). Top, proportion of cells that expressed a cell-specific marker. Bottom, gene expression profiles of single neurons. Fb., Forebrain. Mb., Midbrain. N. Crest, Neural Crest. Glut., Glutamatergic. GABA., GABAergic. Dopa., Dopaminergic. Sero., Serotonergic. CB., Cerebellum. C. Layers, Cortical Layers. Pluri., Pluripotency. 123
140 Transduction of MECP2e1 vectors into RTTe1-NPCs I previously reported the generation of lentiviral vectors expressing MYC-taggedhuman-MECP2e1 under the control of its endogenous mouse Mecp2 (MeP)- or the ubiquitous human EF1α-promoter (Figure 3.8) (Rastegar et al., 2009). If RTTe1-hiPSC-derived neurons result in a RTT phenotype, the expression of exogenous MECP2e1 should rescue this phenotype. I transduced RTTe1-hiPSC-derived NPCs with EGFP and MECP2e1 vectors at a multiplicity of infection (MOI) of one in attempt to recapitulate endogenous MECP2e1 levels. To confirm transduction of RTTe1-hiPSC-derived NPCs with lentiviral vectors, I transduced RTTe1-hiPSC-derived NPCs with control EGFP vectors. RTTe1-hiPSC-derived NPCs did not express significant levels of EGFP from the MeP promoter, but did express from the EF1α promoter (Figure 3.9a). I then transduced RTTe1-hiPSC-derived NPCs with MECP2e1 vectors. RTTe1-hiPSC-derived NPCs did not express significant levels of MeP-MECP2e1 from the vector as determined by the absence of MYC expression (Figure 3.9b). In contrast, EF1α- MECP2e1 showed expression of MYC. These results demonstrate the successful transduction of RTTe1-hiPSC-derived NPCs with MECP2e1 vectors. Next, I differentiated MeP-MECP2e1-transduced RTTe1-hiPSC-derived NPCs for two weeks into MAP2-positive neurons (Figure 3.10a). Co-labeling with an MECP2 antibody revealed continuous MECP2 expression from EF1α-MECP2e1-transduced RTTe1-hiPSCderived NPCs and neurons (Figure 3.9b, 3.10a). In contrast, differentiation of MeP-MECP2e1- transduced RTTe1-hiPSC-derived NPCs into neurons was accompanied by an upregulation of MECP2 (Figure 3.10a). The upregulation of MECP2 is from the MeP-MECP2e1 vector as revealed by MYC expression (Figure 3.10b). These results demonstrate the tight temporal regulation of the MeP-MECP2e1 vectors as MECP2 expression is highest in mature neurons (Shahbazian et al., 2002b; Skene et al., 2010). In summary, these data demonstrate the successful transduction of RTTe1-hiPSC-derived NPCs with MeP-MECP2e1 vectors which drove the expression of MECP2e1 in neurons but not in NPCs. 124

141 Figure 3.8. MECP2 isoform-specific lentivirus vectors MECP2 isoform-specific lentivirus vectors encoding EGFP or MECP2e1 are driven by the ubiquitous EF1α promoter or the endogenous Mecp2 promoter (MeP). Each MECP2 isoform is fused with a MYC tag allowing the detection of exogenous MECP2. 125
 Phase contrast and EGFP images of RTTe1-hiPSC-derived NPCs transduced with")
142 Figure 3.9. Transduction of MECP2e1 lentivirus into RTTe1-hiPSC-derived NPCs (A) Phase contrast and EGFP images of RTTe1-hiPSC-derived NPCs transduced with EGFP lentivirus. Scale bars, 100 µm. (B) ICC of RTTe1-hiPSC-derived NPCs transduced with MECP2e1 lentivirus. Scale bars, 44 µm. 126

143 Figure Differentiation of MECP2e1-transduced RTTe1-hiPSC-derived NPCs into neurons MECP2e1-transduced RTTe1-hiPSC-derived NPCs were differentiated into neurons for two weeks. ICC for (A) MAP2 and MECP2 or (B) MECP2 and MYC are shown. Scale bars, 44 µm. 127
144 RTTe1-hiPSC derived-neurons exhibit a soma size defect that is rescued by exogenous MECP2e1 in a cell autonomous manner RTT is hypothesized to be a neurodevelopmental disorder with defects in neuronal maturation (Kishi and Macklis, 2004). I determined whether the lack of MECP2e1 alone results in a well-characterized neuronal phenotype by measuring soma size (Bauman et al., 1995a, b; Chen et al., 2001; Kishi and Macklis, 2004). I first scored soma size in RTTe1-hiPSC-derived neurons compared to Δ3-4-hiPSC #37-derived neurons. RTTe1-hiPSCs and Δ3-4-hiPSCs were differentiated into NPCs and subsequently differentiated for two additional weeks into MAP2- positive neurons (Figure 3.11). Co-staining for MECP2 showed Δ3-4-hiPSC #37-derived neurons expressed MECP2 while RTTe1-hiPSC-derived neurons expressed negligible MECP2, likely indicative of MECP2e2. Furthermore, neuronal phenotyping revealed that RTTe1-hiPSCderived neurons exhibited a significant decrease in soma size compared to Δ3-4-hiPSC #37- derived neurons (Figure 3.12b). These results indicate that the lack of MECP2e1 alone is sufficient to cause a cellular RTT phenotype. To confirm that the soma size defect observed in RTTe1-hiPSC-derived neurons was due to a lack of MECP2e1, I scored MECP2e1-transduced RTTe1-hiPSC-derived neurons. Interestingly, co-labeling for MAP2 and MYC revealed that the transduction was heterogeneous where some neurons received exogenous MECP2e1 (MYC positive) while other neurons did not (MYC negative) (Figure 3.12a). Therefore, I scored soma size by categorizing neurons into MYC-positive or negative (Figure 3.12b). First, I observed that RTTe1-hiPSC-derived neurons that received MECP2e1 (MYC-positive) driven by either EF1α- or MeP-promoter displayed a soma size increase. However, MeP-MECP2e1-transduced RTTe1-hiPSC-derived neurons showed a soma size increase to levels similar to that of Δ3-4-hiPSC #37-derived neurons while EF1α-MECP2e1-transduced RTTe1-hiPSC-derived neurons only displayed a minor, albeit significant, increase in soma size that remained similar to RTTe1-hiPSC-derived neurons. It is likely that the EF1α promoter is overexpressing MECP2e1 at non-physiological levels, reminiscent of MECP2 gain-of-function mutations seen in patients (Ariani et al., 2004; Friez et al., 2006; Meins et al., 2005; Van Esch et al., 2005). On the other hand, RTTe1-hiPSCderived neurons transduced with MECP2e1 driven by either EF1α- or MeP-promoter but did not receive the vector (MYC-negative) had a soma size similar to RTTe1-hiPSC-derived neurons that were mock transduced. 128
145 In summary, these results suggest that the rescued neighbouring cells, in the case of MeP-MECP2e1-transduced RTTe1-neurons, have no non-cell autonomous effect on surrounding mutant RTTe1-hiPSC-derived neurons. In fact, the soma size defect was only rescued in a cell autonomous manner in RTTe1-hiPSC-derived neurons that received the MeP- MECP2e1 vectors. Altogether, these results demonstrate that lack of MECP2e1 alone in RTTe1- hipsc-derived neurons results in a soma size defect. This soma size defect can be rescued in a cell autonomous manner by exogenous expression of MECP2e1 at physiological levels from the MeP promoter. 129

146 Figure Differentiation of RTTe1-hiPSCs into neurons ICC for MAP2 and MECP2 revealed that Δ3-4-hiPSC #37-derived neurons expressed MECP2 while RTTe1-hiPSC-derived neurons expressed MECP2 at negligible levels, likely representing the MECP2e2 isoform. Scale bars, 44 µm. 130

147 Figure RTTe1-hiPSC-derived neurons exhibit a soma size defect that is rescued by MECP2e1 in a cell autonomous manner MECP2e1-transduced RTTe1-hiPSC- and Δ3-4-hiPSC #37-derived NPCs were differentiated into neurons for two weeks. (A) ICC for MAP2 and MYC revealed that MECP2e1 transduction was heterogeneous as depicted by MYC-positive (arrows) and MYC-negative (arrowheads) MAP2-positive neurons. Scale bars, 44 µm for large image, 10 µm for inset. (B) RTTe1-hiPSCderived neurons exhibited a decrease in soma size compared to Δ3-4-hiPSC-derived neurons. 131
148 MYC-positive, MECP2e1-transduced, RTTe1-hiPSC-derived neurons exhibited an increase in soma size compared to MYC-negative, uninfected, RTTe1-hiPSC-derived neurons. Furthermore, MECP2e1 driven by the MeP, but not EF1α, promoter increased soma size comparable to that of Δ3-4-hiPSC #37-derived neurons (**, P < ; *, P < 0.00`; Student s t-test; n = independent differentiations indicated at the bottom of each bar). Data are expressed as mean ± SEM. 132
149 3.4. Brief Summary and Discussion In this chapter, we generated RTTe1-hiPSCs from a RTT patient with a mutation that specifically disrupts MECP2e1 but not MECP2e2 and represents the first MECP2e1-specific mutant model. RTTe1-hiPSCs were demonstrated to be pluripotent and fully reprogrammed. Furthermore, we demonstrated that RTTe1-hiPSCs retained an Xi in a nonrandom pattern, even upon differentiation into neurons, similar to previous findings and those presented in chapter two (Cheung et al., 2011; Tchieu et al., 2010). By screening multiple RTTe1-hiPSCs, we observed that all RTTe1-hiPSCs expressed the mutant MECP2 allele. TS-hiPSC-derived neurons have been previously studied using single cell Fluidigm arrays (Pasca et al., 2011). We used the same approach to probe the heterogeneous nature of RTTe1-hiPSC-derived neurons. We were able to differentiate RTTe1-hiPSCs into neurons with a high efficiency of over 50 ~ 70% as marked by DCX, NCAM, and MAP2. RTTe1-hiPSCderived neurons were predominantly forebrain and midbrain in nature with prominent expression of markers representative of the cortical layers. RTTe1-hiPSC-derived neurons had roughly equal proportion of glutamatergic and GABAergic neurons with a minority of dopaminergic neurons. We also observed neurons with promiscuous expression of NPCassociated genes, similar to that observed in TS-hiPSC-derived neurons (Pasca et al., 2011). Altogether, differentiation of hipscs into neurons is associated with heterogeneity, highlighting the need to continue to optimize directed differentiation protocols towards a particular cell type. To determine whether lack of MECP2e1 alone is sufficient for a RTT phenotype, I scored for soma size in RTTe1-hiPSC-derived neurons. Consistent with disruption of MECP2e1 isoform alone being sufficient for RTT phenotypes, RTTe1-hiPSC-derived neurons displayed a soma size defect compared to Δ3-4-hiPSC #37-derived neurons. This phenotype was confirmed to be due to the lack of MECP2e1 alone as the soma size defect of RTTe1-hiPSC-derived neurons was rescued by transduction with the MeP-MECP2e1 vectors. Interestingly, this rescue effect was cell autonomous as only RTTe1-hiPSC-derived neurons that received the vector exhibited a rescue in some size while neighbouring neurons that did not receive the vector retained a soma size defect. Consistently, others have reported that RTT-mESC-derived neurons also exhibit a nuclear size defect which can be rescued by exogenous Mecp2 in a cell autonomous manner (Yazdani et al., 2012). EF1α-MECP2e1-transduced RTTe1-hiPSC-derived neurons which received the vector only exhibited a minor increase in soma size indicating incomplete rescue. This is likely attributed to the higher, non-physiological, expression of 133
150 MECP2e1 being driven from the ubiquitous EF1α promoter. This is consistent with the neurological symptoms observed in patients with MECP2 duplication disorders further highlighting that tight regulation of MECP2 is required for the well-being of an individual (Friez et al., 2006; Lugtenberg et al., 2006; Meins et al., 2005; Van Esch et al., 2005). In summary, these results suggest that lack of MECP2e1 alone is sufficient for a RTT phenotype at the cellular level and highlights MECP2e1 as the predominant isoform in human neurons. In conclusion, to the best of our knowledge, this is the first report of any model carrying a MECP2 mutation that specifically disrupts MECP2e1 but not MECP2e2 (Figure 3.13). RTTe1-hiPSCs retained an Xi and expressed the mutant MECP2e1 allele exclusively. Lack of MECP2e1 was sufficient to induce a soma size highlighting the importance of the MECP2e1 isoform in human neurons. The RTTe1-hiPSCs and isoform-specific MECP2 vectors reported in this chapter will have important applications to further elucidate the roles of MECP2 isoforms in human neurons. 134
151 Figure Summary of chapter three In chapter three, I proposed to investigate the roles of MECP2e1. To achieve this, I took advantage of mutant RTTe1-hiPSCs generated from a RTT patient harbouring the RTTe1 mutation that specifically disrupts MECP2e1 but not MECP2e2. Directed differentiation of mutant RTTe1-hiPSCs into neurons exhibited a defect in soma size compared to WT-hiPSCderived neurons. Furthermore, this soma size defect was amenable to rescue by exogenous expression of MECP2e1 in a cell autonomous manner. Altogether, these results suggest that MECP2e1 is sufficient for a RTT phenotype at the cellular level. 135
152 3.5. Materials and Methods RTTe1-fibroblast cell culture RTTe1-fibroblasts were obtained from Dr. Patrick Macleod at the Victoria General Hospital, Victoria, BC, Canada. Culture conditions for RTTe1-fibroblasts are identical to those described for Δ3-4-fibroblasts in section Generation and cell culture of RTTe1-hiPSCs Generation and cell culture of RTTe1-hiPSCs was performed as described in sections and Immunocytochemistry ICC was performed as described in section with appropriate primary antibodies (Table 3.3). Image acquisition of RTTe1-NPCs and neurons was performed as described in section Soma size analysis of neurons was performed manually using Improvision Volocity software on 40X images. Soma size analysis relating to RTTe1-hiPSC-derived neurons were analysed from four RTTe1-hiPSC lines in multiple independent neuronal differentiations (Table 3.4). All soma size analyses were performed blinded to the observer In vitro and in vivo differentiation In vitro differentiation of RTTe1-hiPSCs was performed as described in section Analysis of in vitro differentiated cell types from RTTe1-hiPSCs were performed with appropriate primary antibodies (Table 3.3) RNA isolation and qpcr analysis RNA isolation and qpcr analysis was performed as described in section with appropriate primers (Table 3.5) Karyotyping Karyotyping was performed as described section
153 Antibody Company Catalogue Number Dilution Mouse IgG TUJ1 Chemicon MAB1637 1:200 Mouse IgG SMA Invitrogen :200 Rabbit GATA4 Santa Cruz SC :200 Mouse IgG MECP2 Sigma M6818 1:1000 Rabbit c-myc Santa Cruz Sc-789 1:200 Rabbit MAP2 Millipore AB5622 1:1000 Mouse IgG MAP2 Sigma MI406 1:3000 Table 3.3. Antibodies List of antibodies used in chapter
154 RTTe1-neurons Lines analysed Ee1 (MAP2+) Me1 (MAP2+) Mock (MAP2+) Coverslips Fields Protocol (MYC+) n* (MYC-) n* (MYC+) n* (MYC-) n* (MYC+) n* (MYC-) n* Expt. # B Expt. # B Expt. # B Independent differentiations (n) Lines analysed RTTe1-neurons n* Δ3-4-#37 n* Coverslips Fields Protocol Expt. # B Expt. # B Expt. # B Expt. # D Expt. # J Independent differentiations (n) 6 5 Table 3.4. Summary of neurons scored in soma size analysis Summary of total number of neurons (n*) scored per independent differentiation performed as represented in Figure Total number of fields (images) from total number of coverslips are also indicated. n*, statistical analyses were performed with total number of independent differentiations as n and not the total number of neurons. Ee1, EF1α-MECP2e1. Me1, MeP-MECP2e1. 138
155 Primer Forward (5 à 3 ) Reverse (5 à 3 ) V1 GTAAAAGCCGTCCGGAAAAT GCTTAAGCTTCCGTGTCCAG NES GGCGCACCTCAAGATGTCC CTTGGGGTCCTGAAAGCTG PLZF GGGACTTTGTGCGATGTGGT ATTGCGGTGGAAGAGGATCTC ZO1 AGTCCCTTACCTTTCGCCTGA TCTCTTAGCATTATGTGAGCTGC FOXG1 GCCACAATCTGTCCCTCAACA CGGGTCCAGCATCCAGTAG OTX2 CAACCGCCTTACGCAGTCAA GGGGTGCAGCAAGTCCATAC ZIC1 GTTCGGAGCACTATGCTGC TTGCACGACTTTTTGGGGTTG PAX6 ATGTGTGAGTAAAATTCTGGGCA GCTTACAACTTCTGGAGTCGCTA TBR2 CCGGGCACCTATCAGTACAG GGTTGCACAGGTAGACGTG ASCL1 TCTTCGCCCGAACTGATGC CAAAGCCCAGGTTGACCAACT DLX1 CCATGCCAGAAAGTCTCAACA GGCCCAAACTCCATAAACACC NKX2.1 AGCACACGACTCCGTTCTC GCCCACTTTCTTGTAGCTTTCC LHX6 TGAGAGTCAGGTACAGTGCG GCCCATCCATATCGGCTTTGA EN1 GAGCGCAGGGCACCAAATA AATAACGTGTGCAGTACACCC MSX2 CACCCTGAGGAAACACAAGAC AACTCTGCACGCTCTGCAAT NURR1 TGTGTTCAGGCGCAGTATGG TCCCGAAGAGTGGTAACTGTAG HNK1 CCTGGCGTGGTCTACTTCG GCAGGTTGACGGCAAATCC DCX CCTTGGCTAGCAGCAACAGT CCACTGCGGATGATGGTAA NCAM ACATCACCTGCTACTTCCTGA CTTGGACTCATCTTTCGAGAAGG MAP2 CTGCTTTACAGGGTAGCACAA TTGAGTATGGCAAACGGTCTG CAMK2 AAACTGAAGGGAGCCATTCTCA GAGGATTCCATTAACTGAACGCT VGLUT1 CGACGACAGCCTTTTGTGGT GCCGTAGACGTAGAAAACAGAG VGLUT2 GGGAGACAATCGAGCTGACG CAGCGGATACCGAAGGAGATG VGLUT3 AAACCGGAAATTCAGACAGCA CCAAAGACCCTGTTAGCAGCA GAD67 GCCAGACAAGCAGTATGATGT CCAGTTCCAGGCATTTGTTGAT VGAT CCGAGTGGTGAACGTAGCG GTGGCGATAATGGACCAGGAC TH GCCCTACCAAGACCAGACGTA CGTGAGGCATAGCTCCTGA 5HT2-2C TCTTAATGTCCCTAGCCATTGCT TACCGATCCAGCGATATAGCG FOXP1 AGACAAAAAGTAACGGTTCAGCC CGCACTCTAGTAAGTGGTTGC ETV1 CTGGATGACCCGGCAAATTCT CCTCTTCAGGCTCAATCAGTTT SATB2 TCTCCCCCTCAGTTATGTGAC AGGCAAGTCTTCCAACTTTGAA CTIP2 TGGGTGCCTGCTATGACAAG GGCTCGGACACTTTCCTGAG CUX1 GCTCTCATCGGCCAATCACT TCTATGGCCTGCTCCACGT REELIN TCCGGGACAAGAATACCATGT CCAAATCCGAAAGCACTGGAA PCP2 AGAGGCCAGCAGAAAAGTGACT GTGGCTCAGCAGATTGAAGAA OLIG2 GGACAAGCTAGGAGGCAGTG ATGGCGATGTTGAGGTCGTG MECP2e1 AGGAGAGACTGGAAGAAAAGTC CTTGAGGGGTTTGTCCTTGA MECP2e2 CTCACCAGTTCCTGCTTTGATGT CTTGAGGGGTTTGTCCTTGA MECP2 ACACATCCCTGGACCCTAATGA TGGGCTTCTTAGGTGGTTTCTG NANOG TGAACCTCAGCTACAAACAG TGGTGGTAGGAAGAGTAAAG 18S GATGGGCGGCGGAAAATAG GCGTGGATTCTGCATAATGGT GAPDH CATGAGAAGTATGACAACAGCCT AGTCCTTCCACGATACCAAAGT Table 3.5. Primers List of primers used in chapter 3 139
156 Androgen Receptor assay AR assay was performed as described in section Sequencing of RTTe1-hiPSC cdna CDNA was generated as described in section To sequence RTTe1-hiPSC cdna, RT-PCR was performed using V1 primers (Table 3.5). The MECP2e1 amplicon (382 bp or 371 bp for WT or mutant allele, respectively) was gel purified from the MECP2e2 amplicon (506 bp) using a QIAquick PCR Purification Kit as per instructions of manufacturer and sequenced using the same primers for amplification Directed differentiation of RTTe1-hiPSCs into NPCs and neurons The differentiation of RTTe1-hiPSCs into NPCs and neurons was based on protocols previously described for hpscs with slight modifications (Figure 3.6) (Brennand et al., 2011; Chambers et al., 2009; Kim et al., 2012). Three protocols known as B, D, and J, were employed in this chapter. The B-protocol was performed as previously described with slight modifications (Brennand et al., 2011; Chambers et al., 2009). In brief, RTTe1-hiPSCs (d0) were detached and resuspended in N2 medium supplemented with 2 µm Dorsomorphin (Sigma) and 10 µm SB (Stemgent) with medium changes everyday for one week to form CAs. N2 medium: DMEM/F-12 containing N2 (100X), 0.1 mm MEM NEAA, 50 U ml -1 Penicillin and 50 mg ml -1 Streptomycin, 2 µg ml -1 Heparin, and 10 ng ml -1 FGF2 (R&D Systems). Suspended CAs (d7) were then adhered on to a plastic surface coated with 0.1 mg ml -1 Poly-L-Ornithine and 20 µg ml -1 Laminin for one week in N2 medium supplemented with 1 µg ml -1 Laminin to generate NE cells (primary neural rosettes [1NR]) with medium changes every other day. 1NR (d14) were manually detached and adhered on to a plastic surface coated with 0.1 mg ml -1 Poly-L-Ornithine and 20 µg ml -1 Laminin for one week in NPC medium to generate a second round of NE cells (secondary neural rosettes [2NR]) with medium changes every other day. NPC medium: DMEM/F-12 containing N2 (100X), 0.1 mm MEM NEAA, 50 U ml -1 Penicillin and 50 mg ml -1 Streptomycin, B27 without Vitamin A (50X), 2 µg ml -1 Heparin, 1 µg ml -1 Laminin, and 10 ng ml -1 FGF2. 2NR (d21) were manually harvested and enzymatically dissociated using Accutase (Innovative Cell Technologies) into single cells and seeded on to a plastic surface coated with 0.1 mg ml -1 Poly-L-Ornithine and 20 µg ml -1 Laminin to establish NPC lines. NPCs were maintained in NPC medium with medium changes every other day and passaged using Accutase 140
157 with a seeding density of 1 x 10 6 cells per well of a six well-plate (Nunc) coated with 0.1 mg ml - 1 Poly-L-Ornithine and 20 µg ml -1 Laminin. For neuronal differentiation, NPCs were adhered with a seeding density of 5 x 10 4 per well of a 24 well-plate (Nunc) with 0.1 mg ml -1 Poly-L- Ornithine and 20 µg ml -1 Laminin-coated coverslips in neuronal differentiation medium as described in section Neuronal differentiation medium was changed every other day as neurons differentiated from the NPCs and matured for an additional two weeks for soma size and six weeks for single cell Fluidigm analysis. The J-protocol was identical to the B-protocol except the neuronal differentiation medium was supplemented with 2.5 µm DAPT (N-[N-(3,5- Difluorophenacetyl)-L-alanyl]-S-phenylglycine t-butyl ester [Sigma]). The D-protocol was performed as previously described with slight modifications (Kim et al., 2012). In brief, RTTe1-hiPSCs were detached and resuspended in CA medium supplemented with 5 µm Dorsomorphin and 10 µm SB for 3 days to generate CAs. CA medium: DMEM/F12 containing 20% knockout-serum replacement, MEM NEAA, 0.1 mm beta-mercaptoethanol, Penicillin and Streptomycin (100X) (all from Invitrogen). CAs were cultured on Matrigel-coated plates (BD Biosciences) for an additional 5 days in N2 medium to form neural rosettes. Neural rosettes were isolated using pulled glass pipettes, gently dissociated mechanically, and seeded on Matrigel-coated plates in NPC medium to generate NPC lines. NPC lines were maintained similar to the B-protocol. Neuronal differentiation of NPCs was performed as described in the B-protocol except the neuronal differentiation medium was supplemented with 2.5 µm DAPT Construction of isoform-specific MECP2 lentiviral vectors Isoform-specific MECP2 lentiviral vectors were generated by conventional cloning methods using restriction enzymes and ligases with available plasmids in the laboratory as previously described (Rastegar et al., 2009). In brief, the MeP-EGFP lentiviral vector was obtained by ligating the MeP fragment (from the MeP-EGFP retroviral vector; NcoI, BglII) and the EGFP fragment (from the EF1α-EGFP lentiviral vector; EcoRI, NcoI) into the lentiviral backbone (from the EF1α-EGFP lentiviral vector; EcoRI, BamHI). EF1α-MECP2e1 lentiviral vectors were obtained by ligating the MECP2e1 fragments (from the EF1α-MECP2e1 retroviral vectors; NdeI treated with Klenow and subsequently XhoI) into the lentiviral backbone (from the EF1α-EGFP lentiviral vector; NruI, XhoI). MeP-MECP2e1 lentiviral vectors were obtained by ligating the MeP fragment (from the MeP-EGFP retroviral vector; NcoI, BglII) and the 141
158 MECP2e1 fragment (from the EF1α-MECP2e1 lentiviral vectors; EcoRI, NcoI) into the lentiviral backbone (from the EF1α-EGFP lentiviral vector; EcoRI, BamHI) Generation and transduction of lentivirus MECP2-isoform specific and control-egfp lentiviruses were generated as described in section Titration of lentiviruses was performed as previously described (Hotta et al., 2009a). In brief, 293T cells were transduced with EF1α-EGFP. Titer (infectious units, IU) of lentivirus was calculated with the following formula: Viral titer (IU ml -1 ) = [Infected cell number] x [EGFP + %/100]/[Amount of virus used (ml)]. Transduction of NPCs was performed in the presence of 0.6 µg ml -1 Hexadimethrine bromide (Sigma) for six hours with a MOI of one calculated using 293T cells Single cell Fluidigm array To prepare NPCs or neurons for single cell Fluidigm arrays, cells were washed 1x with Hanks Balanced Salt Solution (Invitrogen), dissociated with Accutase for 10 min at room temperature (Innovative Cell Technologies), passed through a cell strainer (BD Biosciences), and resuspended in Neurobasal medium (Invitrogen). Live cells were stained by propidium iodide (ebioscience) and sorted into a 96 well plate, with preamplification mix, by The Flow Cytometry Facility at The Hospital for Sick Children (Toronto, Ontario, Canada) using MoFlo cell sorter (Beckman Coulter). The preamplification mix contains 40 nm of appropriate primers (Table 3.5) and CellsDirect One-Step qrt-pcr Kit (Invitrogen), which contains SuperScript III reverse transcriptase/platinum Taq Mix and 2X reaction mix. After sorting, samples were reverse transcribed and pre-amplified for 18 cycles. Briefly, we mixed the sample with 20X DNA Binding Dye Sample Loading Reagent (Fluidigm Corp.), 20X EvaGreen (Biotium), TE buffer (10mM tris-hcl, 0.1mM EDTA, ph8.0 [TEKnova]) and 2X TaqMan Gene Expression Master Mix (Applied Biosystems). Assays were mixed with 2X Assay loading reagent (Fluidigm Corp.) and TE buffer (10mM tris-hcl, 0.1mM EDTA, ph8.0) to a final concentration of 5 µm. We primed the Fluidigm Dynamic Arrays (Fluidigm Corp.) and loaded on an IFC Controller HX (Fluidigm Corp.), and ran the GE 48X48 PCR + melt V1 protocol for the qrt-pcr experiments on a Biomark HD System for Genetic Analysis (Fluidigm Corp.). 142
159 Chapter 4 The discussion pertaining to XCI described in this chapter is published in part in the following review: Cheung AYL, Horvath LM, Carrel L, Ellis J. X-chromosome inactivation in Rett Syndrome human induced pluripotent stem cells. Frontiers in Psychiatry 3, 24 (2012). 4. Discussion 4.1. Summary of Principal Findings The results reported in this thesis represent significant advances in the establishment of a novel human in vitro model of RTT by taking advantage of hipsc technology, demonstration that female hipscs retain an Xi in a nonrandom pattern, and providing evidence that lack of MECP2e1 alone is sufficient for a RTT cellular phenotype in vitro. In chapter two, I began by generating RTT-hiPSCs from a RTT patient carrying the p.r306c mutation in MECP2 and demonstrating their pluripotency. The generation of R306C-hiPSCs was novel and significant as it was the first report of RTT-hiPSCs and the first report to demonstrate that hipscs can be generated from patients harbouring a neurodevelopmental disorder (Hotta et al., 2009a; Hotta et al., 2009b). Since the initial publication of R306C-hiPSCs, I expanded the cohort of RTThiPSCs to include two additional RTT patients carrying distinct MECP2 mutations, Δ3-4 and p.t158m. I investigated in detail and demonstrated that RTT-hiPSCs retained an Xi in a nonrandom pattern. This allowed the isolation of mutant and isogenic control Δ3-4-hiPSC lines, which expressed mutant and WT MECP2, respectively. Furthermore, this MECP2 expression pattern was maintained upon directed differentiation into neurons. Finally, I demonstrated that mutant Δ3-4-hiPSC-derived neurons exhibited a soma size defect compared to isogenic control Δ3-4-hiPSC-derived neurons, validating RTT-hiPSCs as a novel human in vitro model of RTT. The generation of isogenic RTT-hiPSC lines was novel and significant as it was the first report to demonstrate the isolation of mutant and isogenic control RTT-hiPSCs and their application in disease modeling (Cheung et al., 2011). More importantly, the XCI status of female hipscs was controversial at the time of publication and remains so to date after intense research in the area 143
160 (Cheung et al., 2012). Therefore, the analysis of XCI status in RTT-hiPSCs was also significant as it was the second report to confirm that female hipscs retain an Xi in a nonrandom pattern (Cheung et al., 2011). Altogether, in chapter two, I established a novel human in vitro model of RTT by generating mutant and isogenic control RTT-hiPSCs which could be differentiated into neurons and recapitulate a RTT phenotype. Furthermore, I confirmed that female hipscs retained an Xi in a nonrandom pattern. In chapter three, we generated RTTe1-hiPSCs lacking MECP2e1 but not MECP2e2 to investigate the function of MECP2 isoforms, specifically MECP2e1. We demonstrated that RTTe1-hiPSCs retained an Xi in a nonrandom pattern, confirming the findings in chapter two. Furthermore, RTTe1-hiPSC-derived neurons exhibited a soma size defect which could be rescued by MECP2e1 vectors in a cell autonomous manner. The phenotyping of RTTe1-hiPSCderived neurons is novel and significant as it is the first, and only, in vitro model of RTT with a MECP2e1-isoform specific mutation to date. Altogether, these results indicate that lack of MECP2e1 alone is sufficient for a RTT phenotype at the cellular level and that MECP2e2 alone is not sufficient to prevent this phenotype in neurons Outline of discussion During the completion of my graduate studies, the field has also advanced, often in parallel, probing questions similar to those this thesis had set out to investigate. However, the findings were not always consistent. In this chapter, I aim to discuss the results of this thesis in the context of other reports investigating questions similar to those proposed in this thesis. Since the initial publication of RTT-hiPSCs described in this thesis (Cheung et al., 2011; Hotta et al., 2009a; Hotta et al., 2009b) and by Muotri and colleagues (Marchetto et al., 2010), RTT-hiPSCs and -mipscs have been generated from a total of seven independent laboratories (Amenduni et al., 2011; Ananiev et al., 2011; Farra et al., 2012; Kim et al., 2011; Pomp et al., 2011; Ricciardi et al., 2012). RTT-hiPSCs harbour pathogenic mutations in MECP2 or CDKL5 and are pluripotent and fully reprogrammed. Furthermore, RTT-hiPSC-derived neurons exhibit neuronal maturation and electrophysiological phenotypes in vitro highlighting their potential as a novel human in vitro model of RTT (Ananiev et al., 2011; Cheung et al., 2011; Kim et al., 2011; Marchetto et al., 2010; Ricciardi et al., 2012). However, a key difference amongst these reports is the description of the XCI status of RTT-hiPSCs as some report the generation of post-xci RTT-hiPSCs (Amenduni et al., 2011; Ananiev et al., 2011; Cheung et al., 2011; Pomp et al., 144
161 2011; Ricciardi et al., 2012) while others report the generation of pre-xci RTT-hiPSCs (Kim et al., 2011; Marchetto et al., 2010). Similarly, since the initial reports of female hipscs retaining an Xi described by Plath and colleagues (Tchieu et al., 2010) and the results described in this thesis (Cheung et al., 2011), the XCI status of female hipscs has continued to be an area of intense research by several groups (Anguera et al., 2012; Liu et al., 2012b; Mekhoubad et al., 2012; Nazor et al., 2012; Teichroeb et al., 2011; Tomoda et al., 2012). Some of these reports conclude that female hipscs are post-xci (Anguera et al., 2012; Liu et al., 2012b; Mekhoubad et al., 2012; Nazor et al., 2012; Tchieu et al., 2010; Teichroeb et al., 2011) while others conclude that female hipscs are pre-xci (Tomoda et al., 2012). Therefore, I begin the discussion by attempting to interpret the inconsistencies observed in XCI status in RTT-hiPSCs reported to date. Next, I discuss the relative function of the two MECP2 isoforms. More specifically, to discuss whether the two isoforms are functionally redundant or do they each have isoform-specific roles as there are evidences for both. Finally, I end the discussion by considering the validity of RTT-hiPSCs as a source of bona fide human neurons. Specifically, whether RTT-hiPSC-derived neurons can be accurately used as a novel human in vitro model for elucidating the pathogenesis of RTT and understanding the function of MECP2 and its isoforms XCI and RTT-hiPSCs Most hipscs retain an Xi in a nonrandom pattern The XCI status of female hipscs has been a major focus of recent research (Anguera et al., 2012; Liu et al., 2012b; Mekhoubad et al., 2012; Nazor et al., 2012; Tchieu et al., 2010; Teichroeb et al., 2011; Tomoda et al., 2012). Most female hipscs studied to date were post-xci as indicated by enrichment of XIST RNA, H3K27me3, and EZH2, depletion of active histone marks H3K18ac and H3K4me3, and DNA hypermethylation on the Xi (Liu et al., 2012b; Mekhoubad et al., 2012; Nazor et al., 2012; Tchieu et al., 2010). Post-XCI hipscs expressed the X-linked genes XIST, ATRX, and PDHA1 in a nonrandom monoallelic fashion revealed by allele-specific SNP analysis (Tchieu et al., 2010). Therefore, most female hipscs inherit the Xi from the founder somatic cell. Furthermore, female hipscs do not go through a transient XCR followed by XCI, as no female hipscs that switch the parental Xi inherited from the parental fibroblasts have been observed (Mekhoubad et al., 2012; Tchieu et al., 2010). In summary, these 145
162 observations along with the XCI analysis performed on the RTT-hiPSCs in this thesis (Cheung et al., 2011) demonstrate that most female hipscs retain an Xi in a nonrandom pattern Post-XCI hipscs allows the generation of isogenic hipscs from X- linked diseases The nonrandom XCI nature of female hipscs can be exploited to generate mutant (expressing mutant protein) and isogenic control (expressing WT protein) hipscs from the same individual carrying heterozygous mutations in X-linked genes. Indeed, isogenic control and mutant hipscs have been generated from DMD-, Lesch-Nyhan Syndrome (LNS)-, and Fragile X (FX)-female carriers with a heterozygous mutation in the X-linked DYSTROPHIN, HPRT, and FMR1 gene, respectively (Liu et al., 2012b; Mekhoubad et al., 2012; Tchieu et al., 2010). HPRT +/- fibroblasts present unprecedented opportunities to studying XCI in hipscs (Mekhoubad et al., 2012). HPRT +/- fibroblasts with a known XCI status can be selected for, as cells expressing functional HPRT are resistant to hypoxanthine, aminopterin, and thymidine (HAT)-containing medium, while cells that lack functional HPRT are resistant to the toxic nucleotide analog 6-thio-guanine (6TG). Therefore, mutant and isogenic control LNS-hiPSCs can be generated from 6TG and HAT-resistant fibroblasts, respectively (Mekhoubad et al., 2012). Indeed, LNS-hiPSCs generated from 6TG or HAT-resistant fibroblasts were resistant to the same drug indicating they expressed mutant and WT HPRT, respectively, during early passages. Furthermore, neurons derived from mutant-6tg-resistant-hipscs exhibited a neuronal differentiation and maturation defect compared to neurons derived from isogenic control-hatresistant-hipscs. Collectively, these observations along with the mutant and isogenic control RTT-hiPSCs generated in this thesis (Cheung et al., 2011) demonstrate the value of post-xci hipscs for isolating mutant and isogenic control hipscs and its subsequent use for disease modeling Post-XCI hipscs are prone to X-chromosome erosion Although most post-xci hipscs retain an Xi in a nonrandom pattern and are invaluable for generating mutant and isogenic control hipscs for disease modeling purposes, they are prone to losing XCI marks such as XIST RNA, H3K27me3, EZH2, macroh2a1, H4K20me1, and DNA methylation upon extended passaging (Anguera et al., 2012; Mekhoubad et al., 2012; Nazor et al., 2012; Tchieu et al., 2010; Teichroeb et al., 2011). One study demonstrated that the 146
163 loss of XCI marks in hipscs retained a transcriptionally Xi (Tchieu et al., 2010). However, other studies observed loss of XCI markers resulted in derepression of the Xi which could have profound implications in disease modeling (Mekhoubad et al., 2012; Nazor et al., 2012; Teichroeb et al., 2011). For example, female hipscs generated from 6TG-resistant fibroblasts, hence lacked functional HPRT due to mutant HPRT on the Xi, were also 6TG resistant during early passages (Mekhoubad et al., 2012). However, upon further passaging, originally homogeneous 6TG-resistant female hipscs became HAT-resistant female hipscs, indicating that the WT HPRT allele on the Xi had reactivated due to loss of XCI marks. In fact, not only was the HPRT gene affected, but there was a chromosome-wide demethylation in promoter regions of X-linked genes and a chromosome-wide increase in expression of X-linked genes. This phenomenon where the Xi loses its XCI marks resulting in transcriptional derepression is known as erosion of dosage compensation (referred to as Xe, eroded X-chromosome). The process of erosion cannot be restored upon differentiation or further reprogramming as XCI cannot reinitiate. X-chromosome erosion (XCE) has significant impact in the use of female hipscs, such as disease modeling, as although neurons generated from early passage 6TGresistant hipscs exhibited a neuronal defect, neurons from later passage of the same hipsc line did not exhibit the same neuronal defect (Mekhoubad et al., 2012). Therefore, it is crucial to analyse the XCI status of female hipscs continuously, especially upon extended passaging, to ensure XCE is not occurring. Indeed, in this thesis, although we did not confirm the XCI status of RTT-hiPSCs over time, we confirmed that mutant and isogenic control RTT-hiPSC-derived neurons used for phenotyping continued to express the mutant and WT allele, respectively (Cheung et al., 2011). In summary, although most female hipscs retain an Xi in a nonrandom pattern, the XCI status of female hipscs are subject to epigenetic fluidity where the Xi can be epigenetically remodeled due to XCE upon in vitro culture and must be carefully monitored A minority of hipscs undergo XCR and are pre-xci Although most female hipscs are post-xci (Mekhoubad et al., 2012; Tchieu et al., 2010), it was found that within a culture of hipscs from a single line, there is, in fact, a huge heterogeneity in XCI status (Anguera et al., 2012). Lee and colleagues observed that female hipscs were a mixture of the same three classes of cells, as proposed for hescs (Silva et al., 2008), based on XIST RNA and COT1 RNA expression (Anguera et al., 2012). COT1 RNA- FISH highlight areas of actively transcribed heterogeneous nuclear RNA (hnrna). COT1 147
164 RNA-FISH can be coupled with X-chromosome DNA-FISH to determine whether both X- chromosomes are actively transcribing. Within a single culture of female hipscs, the majority of cells were class II, carrying a single X-chromosome that was XIST RNA positive and COT1 RNA negative indicative of a post-xci status. This was followed by class III cells that carried two X-chromosomes that were XIST RNA negative but COT1 RNA negative on one of the two X-chromosomes, indicative of post-xci hipscs that had lost XCI marks but remained transcriptionally inactive. The least common were class I cells that carried two X-chromosomes that were XIST RNA negative but COT1 RNA positive indicative of a pre-xci status. These findings hint that XCR can occur during reprogramming but only in very rare occurrences. Disturbingly, class II predominant hipscs (which have a mixture of all three classes of hipscs) tend to transition into homogeneous class III hipscs during in vitro culture (Anguera et al., 2012), similar to that observed in hescs (Silva et al., 2008). Interestingly, although oxygen levels (Lengner et al., 2010) and HDAC inhibitors (Diaz Perez et al., 2012) have been shown to promote isolation of class I hescs, the same effect was not observed in female hipscs (Anguera et al., 2012). Although both class II and III female hipscs are post-xci, they exhibit a distinct gene expression profile. Most upregulated genes in class III hipscs are concentrated on the X-chromosome implying derepression of X-linked genes due to loss of XIST RNA. Disturbingly, most of the upregulated X-linked genes were oncogenes. Conversely, genes encoding some tumour suppressors that are not on the X-chromosome were also downregulated. Furthermore, class III hipscs had accelerated growth in vitro and a poorer differentiation potential in vivo compared to class II hipscs indicating a functional impact of dysregulated gene expression. Collectively, these results reiterate that although XCR can occur at rare occurrences during reprogramming resulting in pre-xci hipscs, female hipscs are predominantly post-xci. Furthermore, the epigenetic fluidity that exists in female hipscs, most likely due to XCE, can result in predominantly class II hipscs with a post-xci status that transition into class III hipscs where XCI marks are lost resulting in dysregulation of cancerassociated genes. These findings further highlight the need to carefully monitor the XCI status of female hipscs. Finally, similar to hescs (Diaz Perez et al., 2012; Hanna et al., 2010; Lengner et al., 2010), it was found that pre-xci hipscs can be isolated by modifying the external milieu. For example, it was found that hipscs reprogrammed from SNL, which expresses exogenous LIF, or non-snl feeders, both showed a post-xci status during early passages (Tomoda et al., 2012). However, upon further passage, female hipscs maintained on SNL, but not on non-snl 148
165 feeders, converted to a pre-xci status as indicated by an increase in X-chromosome to autosome expression (X/A) ratio and were capable of initiating XCI upon differentiation. However, it is important to note that upon differentiation, although there was allele-specific expression of the X-linked PGK gene and a decrease in X/A ratio comparable to somatic cells, there was no upregulation of XCI marks. The inability to upregulate XCI marks during differentiation is a typical characteristic of post-xci hipscs that have lost XCI marks (class III). Therefore, whether these hipscs are in a bona fide pre-xci state warrants further investigation (i.e. by methods discussed in section ). However, it reiterates the notion that culture conditions have a significant impact on the XCI status of hpscs (Diaz Perez et al., 2012; Hanna et al., 2010; Lengner et al., 2010) XCI in RTT-hiPSCs Several groups have generated hipscs from RTT patients (Amenduni et al., 2011; Ananiev et al., 2011; Cheung et al., 2011; Kim et al., 2011; Marchetto et al., 2010; Pomp et al., 2011; Ricciardi et al., 2012). The heterozygous mutation of the X-linked gene MECP2 in RTThiPSCs has prompted extensive analysis of their XCI status as it directly affects the expression status of MECP2 in RTT-hiPSC-derived neurons (Figure 4.1). Post-XCI RTT-hiPSCs with nonrandom XCI will yield isogenic WT or mutant MECP2-expressing RTT-hiPSCs. Differentiation of post-xci RTT-hiPSCs will yield cultures that maintain this nonrandom monoallelic expression pattern allowing the direct comparison of WT and mutant neurons (Figure 4.1a). Conversely, pre-xci RTT-hiPSCs will carry two Xa and upon differentiation would yield a mosaic culture of WT or mutant MECP2-expressing neurons similar to RTT patients (Figure 4.1b). 149
 or pre-xci state (B).")
166 Figure 4.1. Generation of post- and pre-xci RTT-hiPSCs RTT-hiPSCs have been generated from RTT-fibroblasts isolated from RTT patients who carry a heterozygous mutation in MECP2. The reprogramming of RTT-fibroblasts have yielded RTThiPSCs that are in a post-xci (A) or pre-xci state (B). Post-XCI RTT-hiPSCs retains an Xi from the founder somatic cell and express MECP2 in a nonrandom monoallelic manner. This results in the generation of mutant and isogenic control RTT-hiPSCs depending on whether the Xi harbours the WT or mutant MECP2. The differentiation of post-xci RTT-hiPSCs retains this XCI pattern allowing homogeneous cultures of neurons that express WT or mutant MECP2. Pre-XCI RTT-hiPSCs carry two Xa and express the WT and mutant MECP2 in a biallelic fashion. The differentiation of RTT-hiPSCs initiates random XCI resulting in a mosaic culture of neurons that either express WT or mutant MECP2. Mut, mutant. 150
Is Intrinsic Hyperexcitability in CA3 the Culprit for Seizures in Rett Syndrome?
 Current Literature In Basic Science Is Intrinsic Hyperexcitability in CA3 the Culprit for Seizures in Rett Syndrome? Network Hyperexcitability in Hippocampal Slices From Mecp2 Mutant Mice Revealed by Voltage-Sensitive
Transcriptional repression of Xi
 Transcriptional repression of Xi Xist Transcription of Xist Xist RNA Spreading of Xist Recruitment of repression factors. Stable repression Translocated Xic cannot efficiently silence autosome regions.
University of Siena. Ph.D in Medical Genetics. Mariangela Amenduni. Supervisor: Prof. Alessandra Renieri. Doctoral school in Oncology and Genetics
 University of Siena Ph.D in Medical Genetics Establishment and validation of a human cellular model for CDKL5-related disorders Mariangela Amenduni Supervisor: Prof. Alessandra Renieri Doctoral school
Objectives. Genetics and Rett syndrome: As easy as apple pie! Chromosome to gene to protein
 Genetics and Rett syndrome: As easy as apple pie! Victoria Mok Siu M.D., FRCPC, FCCMG ORSA conference Ottawa April 24, 2016 Objectives Review chromosomes and genes Understand s Explore the reasons behind
Today. Genomic Imprinting & X-Inactivation
 Today 1. Quiz (~12 min) 2. Genomic imprinting in mammals 3. X-chromosome inactivation in mammals Note that readings on Dosage Compensation and Genomic Imprinting in Mammals are on our web site. Genomic
Global Reactivation and Targeted Preservation of MeCP2 Expression in a Mouse Model of Rett Syndrome
 Global Reactivation and Targeted Preservation of MeCP2 Expression in a Mouse Model of Rett Syndrome By Min Lang A thesis submitted in conformity with the requirements for the degree of Master of Science
SUPPLEMENTARY INFORMATION
 SUPPLEMENTARY INFORMATION doi:10.1038/nature19357 Figure 1a Chd8 +/+ Chd8 +/ΔSL Chd8 +/+ Chd8 +/ΔL E10.5_Whole brain E10.5_Whole brain E10.5_Whole brain E14.5_Whole brain E14.5_Whole brain E14.5_Whole
Genetics and Genomics in Medicine Chapter 6 Questions
 Genetics and Genomics in Medicine Chapter 6 Questions Multiple Choice Questions Question 6.1 With respect to the interconversion between open and condensed chromatin shown below: Which of the directions
Overview: Conducting the Genetic Orchestra Prokaryotes and eukaryotes alter gene expression in response to their changing environment
 Overview: Conducting the Genetic Orchestra Prokaryotes and eukaryotes alter gene expression in response to their changing environment In multicellular eukaryotes, gene expression regulates development
Interrogating Rett Syndrome: developing ideas for research that matters. Angus Clarke, Clinical Genetics, Prifysgol Caerdydd, Cymru
 Interrogating Rett Syndrome: developing ideas for research that matters Angus Clarke, Clinical Genetics, Prifysgol Caerdydd, Cymru Research into Rett Syndrome Four Factors: Unique clinical entity Biology
Muscular Dystrophy. Biol 405 Molecular Medicine
 Muscular Dystrophy Biol 405 Molecular Medicine Duchenne muscular dystrophy Duchenne muscular dystrophy is a neuromuscular disease that occurs in ~ 1/3,500 male births. The disease causes developmental
Corporate Medical Policy
 Corporate Medical Policy File Name: Origination: Last CAP Review: Next CAP Review: Last Review: genetic_testing_for_rett_syndrome 7/2012 3/2017 3/2018 5/2017 Description of Procedure or Service Rett syndrome
An Unexpected Function of the Prader-Willi Syndrome Imprinting Center in Maternal Imprinting in Mice
 An Unexpected Function of the Prader-Willi Syndrome Imprinting Center in Maternal Imprinting in Mice Mei-Yi Wu 1 *, Ming Jiang 1, Xiaodong Zhai 2, Arthur L. Beaudet 2, Ray-Chang Wu 1 * 1 Department of
Alpha thalassemia mental retardation X-linked. Acquired alpha-thalassemia myelodysplastic syndrome
 Alpha thalassemia mental retardation X-linked Acquired alpha-thalassemia myelodysplastic syndrome (Alpha thalassemia mental retardation X-linked) Acquired alpha-thalassemia myelodysplastic syndrome Schematic
Eukaryotic Gene Regulation
 Eukaryotic Gene Regulation Chapter 19: Control of Eukaryotic Genome The BIG Questions How are genes turned on & off in eukaryotes? How do cells with the same genes differentiate to perform completely different,
PHARMACOLOGICAL RESCUE OF NONSENSE MUTATIONS IN RETT SYNDROME
 PHARMACOLOGICAL RESCUE OF NONSENSE MUTATIONS IN RETT SYNDROME by Andreea Cristina Popescu A thesis submitted in conformity with the requirements for the degree of Master of Science Graduate Department
Epigenetics. Lyle Armstrong. UJ Taylor & Francis Group. f'ci Garland Science NEW YORK AND LONDON
 ... Epigenetics Lyle Armstrong f'ci Garland Science UJ Taylor & Francis Group NEW YORK AND LONDON Contents CHAPTER 1 INTRODUCTION TO 3.2 CHROMATIN ARCHITECTURE 21 THE STUDY OF EPIGENETICS 1.1 THE CORE
Reversing the Effects of Fragile X Syndrome
 CLINICAL IMPLICATIONS OF BASIC RESEARCH Paul J. Lombroso, M.D., Marilee P. Ogren, Ph.D. Assistant Editors Reversing the Effects of Fragile X Syndrome MARILEE P. OGREN, PH.D., AND PAUL J. LOMBROSO, M.D.
Veronika Borbélyová, MSc., PhD.
 Veronika Borbélyová, MSc., PhD. borbelyova.veronika88@gmail.com History Eugen Bleuler autism (from the Greek words autos = self, ismus = orientation, status) the patient reduces the contact with the outside
Ch. 18 Regulation of Gene Expression
 Ch. 18 Regulation of Gene Expression 1 Human genome has around 23,688 genes (Scientific American 2/2006) Essential Questions: How is transcription regulated? How are genes expressed? 2 Bacteria regulate
Stem Cell Epigenetics
 Stem Cell Epigenetics Philippe Collas University of Oslo Institute of Basic Medical Sciences Norwegian Center for Stem Cell Research www.collaslab.com Source of stem cells in the body Somatic ( adult )
Cancer. October is National Breast Cancer Awareness Month
 Cancer October is National Breast Cancer Awareness Month Objectives 1: Gene regulation Explain how cells in all the different parts of your body develop such different characteristics and functions. Contrast
SUPPLEMENTARY INFORMATION. Rett Syndrome Mutation MeCP2 T158A Disrupts DNA Binding, Protein Stability and ERP Responses
 SUPPLEMENTARY INFORMATION Rett Syndrome Mutation T158A Disrupts DNA Binding, Protein Stability and ERP Responses Darren Goffin, Megan Allen, Le Zhang, Maria Amorim, I-Ting Judy Wang, Arith-Ruth S. Reyes,
Non-Mendelian inheritance
 Non-Mendelian inheritance Focus on Human Disorders Peter K. Rogan, Ph.D. Laboratory of Human Molecular Genetics Children s Mercy Hospital Schools of Medicine & Computer Science and Engineering University
Transcriptional and Epigenetic Mechanisms of Addiction
 Transcriptional and Epigenetic Mechanisms of Addiction Eric J. Nestler Mount Sinai School of Medicine New York, NY Dr. Ray Fuller There is every reason to be optimistic that in the future we will find
BIOL212 Biochemistry of Disease. Metabolic Disorders - Obesity
 BIOL212 Biochemistry of Disease Metabolic Disorders - Obesity Obesity Approx. 23% of adults are obese in the U.K. The number of obese children has tripled in 20 years. 10% of six year olds are obese, rising
OVERVIEW OF EPIGENETICS
 OVERVIEW OF EIENETICS Date: * Time: 9:00 am - 9:50 am * Room: Berryhill 103 Lecturer: Terry Magnuson 4312 MBRB trm4@med.unc.edu 843-6475 *lease consult the online schedule for this course for the definitive
Problem Set 5 KEY
 2006 7.012 Problem Set 5 KEY ** Due before 5 PM on THURSDAY, November 9, 2006. ** Turn answers in to the box outside of 68-120. PLEASE WRITE YOUR ANSWERS ON THIS PRINTOUT. 1. You are studying the development
Neurodevelopment II Structure Formation. Reading: BCP Chapter 23
 Neurodevelopment II Structure Formation Reading: BCP Chapter 23 Phases of Development Ovum + Sperm = Zygote Cell division (multiplication) Neurogenesis Induction of the neural plate Neural proliferation
Imprinting. Joyce Ohm Cancer Genetics and Genomics CGP-L2-319 x8821
 Imprinting Joyce Ohm Cancer Genetics and Genomics CGP-L2-319 x8821 Learning Objectives 1. To understand the basic concepts of genomic imprinting Genomic imprinting is an epigenetic phenomenon that causes
Fragile X Syndrome. Genetics, Epigenetics & the Role of Unprogrammed Events in the expression of a Phenotype
 Fragile X Syndrome Genetics, Epigenetics & the Role of Unprogrammed Events in the expression of a Phenotype A loss of function of the FMR-1 gene results in severe learning problems, intellectual disability
EXAMINATION OF NMDA RECEPTOR SUBUNIT PREVALENCE AND DISTRIBUTION IN CRUDE SYNAPTIC MEMBRANES PURIFIED FROM A MOUSE MODEL OF RETT SYNDROME.
 EXAMINATION OF NMDA RECEPTOR SUBUNIT PREVALENCE AND DISTRIBUTION IN CRUDE SYNAPTIC MEMBRANES PURIFIED FROM A MOUSE MODEL OF RETT SYNDROME. by Ewelina Maliszewska-Cyna A thesis submitted in conformity with
NNZ-2566 in Rett Syndrome and Autism Spectrum Disorders Role and Update
 NNZ-2566 in Rett Syndrome and Autism Spectrum Disorders Role and Update 1 Overview The natural growth factor IGF-1 is broken down in the body to IGF-1[1-3] NNZ-2566 is an analogue of IGF-1[1-3] developed
A Genetic Program for Embryonic Development
 Concept 18.4: A program of differential gene expression leads to the different cell types in a multicellular organism During embryonic development, a fertilized egg gives rise to many different cell types
Epigenetics and Human Disease
 Epigenetics and Human Disease May 28, 2014 1 Angelman Syndrome & Prader-Willi Syndrome Sister Syndromes Angelman Syndrome ~1/20,000 births happy disposition smile often bouts of laughter minimal verbal
General Biology 1004 Chapter 11 Lecture Handout, Summer 2005 Dr. Frisby
 Slide 1 CHAPTER 11 Gene Regulation PowerPoint Lecture Slides for Essential Biology, Second Edition & Essential Biology with Physiology Presentation prepared by Chris C. Romero Neil Campbell, Jane Reece,
RSRT Awards $10 Million to Preeminent Researchers in Pursuit of Curing Devastating Neurological Disorder
 P R E S S R E L E A S E RSRT Awards $10 Million to Preeminent Researchers in Pursuit of Curing Devastating Neurological Disorder September 25, 2018 Media Contacts: Monica Coenraads Executive Director,
Regulation of Gene Expression in Eukaryotes
 Ch. 19 Regulation of Gene Expression in Eukaryotes BIOL 222 Differential Gene Expression in Eukaryotes Signal Cells in a multicellular eukaryotic organism genetically identical differential gene expression
Not IN Our Genes - A Different Kind of Inheritance.! Christopher Phiel, Ph.D. University of Colorado Denver Mini-STEM School February 4, 2014
 Not IN Our Genes - A Different Kind of Inheritance! Christopher Phiel, Ph.D. University of Colorado Denver Mini-STEM School February 4, 2014 Epigenetics in Mainstream Media Epigenetics *Current definition:
Gene Regulation Part 2
 Michael Cummings Chapter 9 Gene Regulation Part 2 David Reisman University of South Carolina Other topics in Chp 9 Part 2 Protein folding diseases Most diseases are caused by mutations in the DNA that
CHANTALE T. GUY, M5C. A Thesis. for the Degree. Doctor of Philosophy. McMaster University. (c) Copyright by Chantale T.
 Copyright by Chantale T.") ROLE AND MECHANISM OF ACTION OF TYROSINE KINASES IN MAMMARY TUMORIGENESIS By CHANTALE T. GUY, M5C. A Thesis Submitted to the School of Graduate Studies in Partial Fulfilment of the Requirements for the
ROLE AND MECHANISM OF ACTION OF TYROSINE KINASES IN MAMMARY TUMORIGENESIS By CHANTALE T. GUY, M5C. A Thesis Submitted to the School of Graduate Studies in Partial Fulfilment of the Requirements for the
Stem Cells and the Study of Neurodegeneration. Tracy Young-Pearse, PhD September 12, 2014!
 Stem Cells and the Study of Neurodegeneration Tracy Young-Pearse, PhD September 12, 2014! Techniques for studying mechanisms of neurological disease Animal models Human subjects Postmortem analyses, imaging
TITLE: A Mouse Model to Investigate the Role of DBC2 in Breast Cancer
 AD Award Number: W81XWH-04-1-0325 TITLE: A Mouse Model to Investigate the Role of DBC2 in Breast Cancer PRINCIPAL INVESTIGATOR: Valerie Boka CONTRACTING ORGANIZATION: University of Texas Health Science
Introduction to Genetics
 Introduction to Genetics Table of contents Chromosome DNA Protein synthesis Mutation Genetic disorder Relationship between genes and cancer Genetic testing Technical concern 2 All living organisms consist
variant led to a premature stop codon p.k316* which resulted in nonsense-mediated mrna decay. Although the exact function of the C19L1 is still
 157 Neurological disorders primarily affect and impair the functioning of the brain and/or neurological system. Structural, electrical or metabolic abnormalities in the brain or neurological system can
Are you the way you are because of the
 EPIGENETICS Are you the way you are because of the It s my fault!! Nurture Genes you inherited from your parents? Nature Experiences during your life? Similar DNA Asthma, Autism, TWINS Bipolar Disorders
1 in 68 in US. Autism Update: New research, evidence-based intervention. 1 in 45 in NJ. Selected New References. Autism Prevalence CDC 2014
 Autism Update: New research, evidence-based intervention Martha S. Burns, Ph.D. Joint Appointment Professor Northwestern University. 1 Selected New References Bourgeron, Thomas (2015) From the genetic
Medical Advisory Council: Verified
 What is White Sutton Syndrome? White Sutton Syndrome (WHSUS) is a condition characterized by autism and developmental delay and/or intellectual disability, as well as a characteristic facial profile. Children
SUPPLEMENTARY INFORMATION
 DOI: 10.1038/ncb2566 Figure S1 CDKL5 protein expression pattern and localization in mouse brain. (a) Multiple-tissue western blot from a postnatal day (P) 21 mouse probed with an antibody against CDKL5.
MeCP2 mutations in children with and without the phenotype of Rett syndrome
 MeCP2 mutations in children with and without the phenotype of Rett syndrome K. Hoffbuhr, PhD; J.M. Devaney, PhD; B. LaFleur, PhD, MPH; N. Sirianni, MS; C. Scacheri, MS; J. Giron, BS; J. Schuette, MS; J.
MeCP2 and psychostimulantinduced behavioral adaptations. Anne E. West, M.D., Ph.D. Department of Neurobiology Duke University Medical Center
 MeCP2 and psychostimulantinduced behavioral adaptations Anne E. West, M.D., Ph.D. Department of Neurobiology Duke University Medical Center Psychostimulants and antidepressants slowly change behavior Psychostimulants
SUPPLEMENTARY FIGURES
 SUPPLEMENTARY FIGURES 1 Supplementary Figure 1, Adult hippocampal QNPs and TAPs uniformly express REST a-b) Confocal images of adult hippocampal mouse sections showing GFAP (green), Sox2 (red), and REST
The Biology and Genetics of Cells and Organisms The Biology of Cancer
 The Biology and Genetics of Cells and Organisms The Biology of Cancer Mendel and Genetics How many distinct genes are present in the genomes of mammals? - 21,000 for human. - Genetic information is carried
Chapter 11 How Genes Are Controlled
 Chapter 11 How Genes Are Controlled PowerPoint Lectures for Biology: Concepts & Connections, Sixth Edition Campbell, Reece, Taylor, Simon, and Dickey Copyright 2009 Pearson Education, Inc. Lecture by Mary
Meeting Report. From December 8 to 11, 2012 at Atlanta, GA, U.S.A
 Meeting Report Affiliation Department of Transfusion Medicine and Cell Therapy Name Hisayuki Yao Name of the meeting Period and venue Type of your presentation Title of your presentation The 54 th Annual
Learning From Patients: The Science of Medicine (2003) Lecture Four The Strength of Families: Solving Rett Syndrome Huda Y. Zoghbi, M.D.
 Lecture Four The Strength of Families: Solving Rett Syndrome Huda Y. Zoghbi, M.D.") Learning From Patients: The Science of Medicine (2003) Lecture Four The Strength of Families: Solving Rett Syndrome Huda Y. Zoghbi, M.D. 1. Start of Lecture 4 (00:11) From the Howard Hughes Medical Institute
Learning From Patients: The Science of Medicine (2003) Lecture Four The Strength of Families: Solving Rett Syndrome Huda Y. Zoghbi, M.D. 1. Start of Lecture 4 (00:11) From the Howard Hughes Medical Institute
Rare Monogenic Disorders. Function. Pathophysiology
 Rare Monogenic Disorders Function Pathophysiology Protein Gene Episodic Nervous System Diseases Migraine Epilepsy Periodic Paralysis LQTS Episodic Ataxia Paroxysmal Dyskinesias Phenotypes Muscle diseases
Fayth K. Yoshimura, Ph.D. September 7, of 7 HIV - BASIC PROPERTIES
 1 of 7 I. Viral Origin. A. Retrovirus - animal lentiviruses. HIV - BASIC PROPERTIES 1. HIV is a member of the Retrovirus family and more specifically it is a member of the Lentivirus genus of this family.
Supporting Online Material for
 www.sciencemag.org/cgi/content/full/1171320/dc1 Supporting Online Material for A Frazzled/DCC-Dependent Transcriptional Switch Regulates Midline Axon Guidance Long Yang, David S. Garbe, Greg J. Bashaw*
BIOL2005 WORKSHEET 2008
 BIOL2005 WORKSHEET 2008 Answer all 6 questions in the space provided using additional sheets where necessary. Hand your completed answers in to the Biology office by 3 p.m. Friday 8th February. 1. Your
Epigenetic Principles and Mechanisms Underlying Nervous System Function in Health and Disease Mark F. Mehler MD, FAAN
 Epigenetic Principles and Mechanisms Underlying Nervous System Function in Health and Disease Mark F. Mehler MD, FAAN Institute for Brain Disorders and Neural Regeneration F.M. Kirby Program in Neural
Brain Development III
 Brain Development III Neural Development In the developing nervous system there must be: 1. The formation of different regions of the brain. 2. The ability of a neuron to differentiate. 3. The ability
Gene Expression DNA RNA. Protein. Metabolites, stress, environment
 Gene Expression DNA RNA Protein Metabolites, stress, environment 1 EPIGENETICS The study of alterations in gene function that cannot be explained by changes in DNA sequence. Epigenetic gene regulatory
Molecular Biology (BIOL 4320) Exam #2 May 3, 2004
 Exam #2 May 3, 2004") Molecular Biology (BIOL 4320) Exam #2 May 3, 2004 Name SS# This exam is worth a total of 100 points. The number of points each question is worth is shown in parentheses after the question number. Good
Molecular Biology (BIOL 4320) Exam #2 May 3, 2004 Name SS# This exam is worth a total of 100 points. The number of points each question is worth is shown in parentheses after the question number. Good
Epigenetics DNA methylation. Biosciences 741: Genomics Fall, 2013 Week 13. DNA Methylation
 Epigenetics DNA methylation Biosciences 741: Genomics Fall, 2013 Week 13 DNA Methylation Most methylated cytosines are found in the dinucleotide sequence CG, denoted mcpg. The restriction enzyme HpaII
The Chromosomal Basis of Inheritance
 Chapter 15 The Chromosomal Basis of Inheritance PowerPoint Lectures for Biology, Seventh Edition Neil Campbell and Jane Reece Lectures by Chris Romero Overview: Locating Genes on Chromosomes A century
Allelic reprogramming of the histone modification H3K4me3 in early mammalian development
 Allelic reprogramming of the histone modification H3K4me3 in early mammalian development 张戈 Method and material STAR ChIP seq (small-scale TELP-assisted rapid ChIP seq) 200 mouse embryonic stem cells PWK/PhJ
Are there foreseeable applications of genomic medicine for the management of neuropsychiatric conditions?
 Are there foreseeable applications of genomic medicine for the management of neuropsychiatric conditions? Angus Clarke, Medical Genetics, Cardiff University, Wales Are there foreseeable applications of
Comparison of open chromatin regions between dentate granule cells and other tissues and neural cell types.
 Supplementary Figure 1 Comparison of open chromatin regions between dentate granule cells and other tissues and neural cell types. (a) Pearson correlation heatmap among open chromatin profiles of different
Clinical and Regulatory Challenges in Developing New Treatments for Rare Diseases
 Clinical and Regulatory Challenges in Developing New Treatments for Rare Diseases R. Anand, M.D. APC AG, Switzerland ISCTM, Washington DC February 20 th, 2018 Conflict of Interests A - Z Too many to mention
BIO360 Fall 2013 Quiz 1
 BIO360 Fall 2013 Quiz 1 1. Examine the diagram below. There are two homologous copies of chromosome one and the allele of YFG carried on the light gray chromosome has undergone a loss-of-function mutation.
Glial cell development in the vertebrate central nervous system
 Glial cell development in the vertebrate central nervous system Thesis by Qiao Zhou In Partial Fulfillment of the Requirements for the Degree of Doctor of Philosophy in Biology California Institute of
Doctor of Philosophy
 Regulation of Gene Expression of the 25-Hydroxyvitamin D la-hydroxylase (CYP27BI) Promoter: Study of A Transgenic Mouse Model Ivanka Hendrix School of Molecular and Biomedical Science The University of
SUPPLEMENTARY INFORMATION
 doi:10.1038/nature12652 Supplementary Figure 1. PRDM16 interacts with endogenous EHMT1 in brown adipocytes. Immunoprecipitation of PRDM16 complex by flag antibody (M2) followed by Western blot analysis
Histones modifications and variants
 Histones modifications and variants Dr. Institute of Molecular Biology, Johannes Gutenberg University, Mainz www.imb.de Lecture Objectives 1. Chromatin structure and function Chromatin and cell state Nucleosome
Potential Treatment and Current Research in Phelan-McDermid Syndrome. 11/16/2016 Frambu Center for Rare Disorders
 Potential Treatment and Current Research in Phelan-McDermid Syndrome 11/16/2016 Frambu Center for Rare Disorders Genetics is Complicated! Deletion 22q13: Therapies Under Investigation Intranasal insulin
Genesis of cerebellar interneurons and the prevention of neural DNA damage require XRCC1.
 Genesis of cerebellar interneurons and the prevention of neural DNA damage require XRCC1. Youngsoo Lee, Sachin Katyal, Yang Li, Sherif F. El-Khamisy, Helen R. Russell, Keith W. Caldecott and Peter J. McKinnon.
Where Splicing Joins Chromatin And Transcription. 9/11/2012 Dario Balestra
 Where Splicing Joins Chromatin And Transcription 9/11/2012 Dario Balestra Splicing process overview Splicing process overview Sequence context RNA secondary structure Tissue-specific Proteins Development
CURRENT GENETIC TESTING TOOLS IN NEONATAL MEDICINE. Dr. Bahar Naghavi
 2 CURRENT GENETIC TESTING TOOLS IN NEONATAL MEDICINE Dr. Bahar Naghavi Assistant professor of Basic Science Department, Shahid Beheshti University of Medical Sciences, Tehran,Iran 3 Introduction Over 4000
SALSA MLPA KIT P060-B2 SMA
 SALSA MLPA KIT P6-B2 SMA Lot 111, 511: As compared to the previous version B1 (lot 11), the 88 and 96 nt DNA Denaturation control fragments have been replaced (QDX2). Please note that, in contrast to the
Epigenetics Armstrong_Prelims.indd 1 04/11/2013 3:28 pm
 Epigenetics Epigenetics Lyle Armstrong vi Online resources Accessible from www.garlandscience.com, the Student and Instructor Resource Websites provide learning and teaching tools created for Epigenetics.
MECP2 disorders: from the clinic to mice and back
 MECP2 disorders: from the clinic to mice and back Laura Marie Lombardi,, Steven Andrew Baker, Huda Yahya Zoghbi J Clin Invest. 2015;125(8):2914-2923. https://doi.org/10.1172/jci78167. Two severe, progressive
A CASE OF GIANT AXONAL NEUROPATHY HEMANANTH T SECOND YEAR POST GRADUATE IN PAEDIATRICS INSTITUTE OF SOCIAL PAEDIATRICS GOVERNMENT STANLEY HOSPITAL
 A CASE OF GIANT AXONAL NEUROPATHY HEMANANTH T SECOND YEAR POST GRADUATE IN PAEDIATRICS INSTITUTE OF SOCIAL PAEDIATRICS GOVERNMENT STANLEY HOSPITAL CASE HISTORY Nine year old male child Second born Born
REVIEWS. Molecular genetics of Rett syndrome: when DNA methylation goes unrecognized
 Molecular genetics of Rett syndrome: when DNA methylation goes unrecognized Thierry Bienvenu & Jamel Chelly Abstract The discovery that Rett syndrome is caused by mutations that affect the methyl- CpG-binding
RAS Genes. The ras superfamily of genes encodes small GTP binding proteins that are responsible for the regulation of many cellular processes.
 ۱ RAS Genes The ras superfamily of genes encodes small GTP binding proteins that are responsible for the regulation of many cellular processes. Oncogenic ras genes in human cells include H ras, N ras,
Rett Syndrome RTT. Nordic Conference on Rare Diseases. Friðrik Friðriksson, father of a girl with RTT rettenglar.yolasite.com
 Rett Syndrome RTT Nordic Conference on Rare Diseases Friðrik Friðriksson, father of a girl with RTT rettenglar.yolasite.com 1 Guðrún Sædal This is a picture of our girl a few weeks after she was born.
Single Gene (Monogenic) Disorders. Mendelian Inheritance: Definitions. Mendelian Inheritance: Definitions
 Disorders. Mendelian Inheritance: Definitions. Mendelian Inheritance: Definitions") Single Gene (Monogenic) Disorders Mendelian Inheritance: Definitions A genetic locus is a specific position or location on a chromosome. Frequently, locus is used to refer to a specific gene. Alleles are
Single Gene (Monogenic) Disorders Mendelian Inheritance: Definitions A genetic locus is a specific position or location on a chromosome. Frequently, locus is used to refer to a specific gene. Alleles are
Rett Syndrome Research Trust Awards $6.2 Million in 2017 to Speed a Cure for Rett Syndrome
 PRESS RELEASE: Rett Syndrome Research Trust Awards $6.2 Million in 2017 to January 30, 2018 Media Contacts: Monica Coenraads Executive Director, RSRT 203.445.0041 monica@rsrt.org TRUMBULL, CT The Rett
The Role of Smoking in Cocaine. Addiction
 The Role of Smoking in Cocaine Addiction Luca Colnaghi Eric Kandel Laboratory Columbia University in the City of New York Department of Neuroscience Index 1- The Brain, memory, metaplasticity 2- Cocaine
George R. Honig Junius G. Adams III. Human Hemoglobin. Genetics. Springer-Verlag Wien New York
 George R. Honig Junius G. Adams III Human Hemoglobin Genetics Springer-Verlag Wien New York George R. Honig, M.D., Ph.D. Professor and Head Department of Pediatrics, College of Medicine University of Illinois
The Chromosomal Basis Of Inheritance
 The Chromosomal Basis Of Inheritance Chapter 15 Objectives Explain the chromosomal theory of inheritance and its discovery. Explain why sex-linked diseases are more common in human males than females.
FEP Medical Policy Manual
 FEP Medical Policy Manual Effective Date: October 15, 2018 Related Policies: None Genetic Testing for Rett Syndrome Description Rett syndrome (RTT), a neurodevelopmental disorder, is usually caused by
Chapter 11: Inherited Disorders of Human Memory Mental Retardation Syndromes. From Mechanisms of Memory, second edition By J. David Sweatt, Ph.D.
 Chapter 11: Inherited Disorders of Human Memory Mental Retardation Syndromes From Mechanisms of Memory, second edition By J. David Sweatt, Ph.D. Chapter 11: Mental Retardation Syndromes Table I: Mouse
Rett Syndrome What you should know
 Rett Syndrome What you should know Alan K. Percy University of Alabama at Birmingham June 25, 2016 Bengt Hagberg Andreas Rett CLINICAL DIAGNOSIS Rett Syndrome A Neurodevelopmental Disorder of Young Females
REVIEWS 1. Clinical and biological progress over 50 years in Rett syndrome
 RARE DISEASES Clinical and biological progress over 5 years in Rett syndrome Helen Leonard 1, Stuart Cobb 2 and Jenny Downs 1 Abstract In the 5 years since Andreas Rett first described the syndrome that
A novel fragile X syndrome mutation reveals a conserved role for the carboxy-terminus in FMRP localization and function
 A novel fragile X syndrome mutation reveals a conserved role for the carboxy-terminus in FMRP localization and function Zeynep Okray, Celine E.F. de Esch, Hilde Van Esch, Koen Devriendt, Annelies Claeys,
INTERACTION DRUG BODY
 INTERACTION DRUG BODY What the drug does to the body What the body does to the drug Receptors - intracellular receptors - membrane receptors - Channel receptors - G protein-coupled receptors - Tyrosine-kinase
The functional investigation of the interaction between TATA-associated factor 3 (TAF3) and p53 protein
 and p53 protein") THESIS BOOK The functional investigation of the interaction between TATA-associated factor 3 (TAF3) and p53 protein Orsolya Buzás-Bereczki Supervisors: Dr. Éva Bálint Dr. Imre Miklós Boros University of
THESIS BOOK The functional investigation of the interaction between TATA-associated factor 3 (TAF3) and p53 protein Orsolya Buzás-Bereczki Supervisors: Dr. Éva Bálint Dr. Imre Miklós Boros University of
Breeding and maintenance of an Mecp2-deficient mouse model of Rett syndrome
 Journal of Neuroscience Methods 154 (2006) 89 95 Breeding and maintenance of an Mecp2-deficient mouse model of Rett syndrome Denis G.M. Jugloff a,b, Richard Logan a, James H. Eubanks a,b,c,d, a Division
Biology 2C03 Term Test #3
 Biology 2C03 Term Test #3 Instructors: Dr. Kimberley Dej, Ray Procwat Date: Monday March 22, 2010 Time: 10:30 am to 11:20 am Instructions: 1) This midterm test consists of 9 pages. Please ensure that all