RAW264.7 cells stably expressing control shrna (Con) or GSK3b-specific shrna (sh-
|
|
|
- Lesley Wilson
- 5 years ago
- Views:
Transcription
1 1 a b Supplementary Figure 1. Effects of GSK3b knockdown on poly I:C-induced cytokine production. RAW264.7 cells stably expressing control shrna (Con) or GSK3b-specific shrna (sh- GSK3b) were stimulated with 10 mg/ml poly I:C for 20 h. Levels of IL-6, TNF-a (a), and IL-10 (b) in culture supernatants were determined by ELISA. Data are presented as means ±SD from at least three independent experiments. Statistical analyses were calculated with Student s t-test ( ** P < 0.01). 1
2 2 Supplementary Figure 2. Effects of GSK3b deficiency on poly I:C-induced cytokine production. Gsk3b +/+ and Gsk3b -/- MEFs were stimulated with 10 mg/ml poly I:C for 20 h. Levels of IL-6, TNF-a, and IL-10 in culture supernatants were determined by ELISA. Data are presented as means ±SD from at least three independent experiments. Statistical analyses were calculated with Student s t-test ( ** P < 0.01). 2
3 3 a b c 3
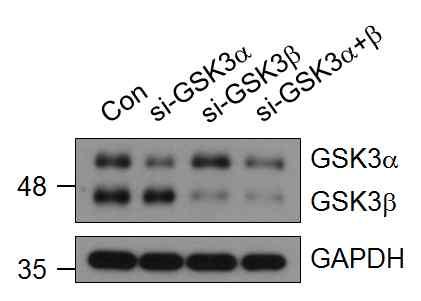
4 4 Supplementary Figure 3. Effects of GSK3a or GSK3b knockdown on poly I:C-induced cytokine production in BMDMs. BMDMs were transfected with 20 nm control sirna (Con) or specific sirnas targeting GSK3a (si-gsk3a) and GSK3b (si-gsk3b), respectively, or both GSK3a and GSK3b (si- GSK3a+b) for 36 h. (a) Expression levels of GSK3a or GSK3b were confirmed by Western blotting with an anti-gsk3a/b antibody. (b) Transfected cells were stimulated with 10 mg/ml poly I:C for 1 h, and the levels of IL-6, TNF-a, and IL-10 were determined by real-time PCR. (c) Transfected cells were stimulated with 10 mg/ml poly I:C for 20 h, and levels of IL-6, TNFa, and IL-10 in culture supernatants were determined by ELISA. Data are presented as means ±SD from at least three independent experiments. Statistical analyses were calculated with Student s t-test ( ** P < 0.01; NS: not significant). 4


5 5 a b c d e f 5
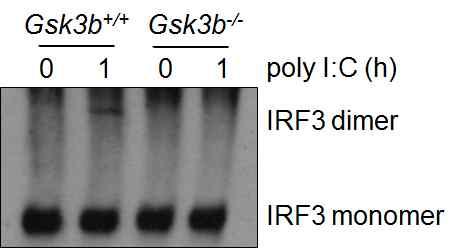
6 6 Supplementary Figure 4. Effects of GSK3b on poly I:C-induced antiviral response. (a) Western blotting of TBK1 and IRF3 phosphorylation in Gsk3b +/+ and Gsk3b -/- MEFs stimulated with 10 mg/ml poly I:C for 1 h. (b) Western blotting of cytosolic and nuclear IRF3 in Gsk3b +/+ and Gsk3b -/- MEFs stimulated with 10 mg/ml poly I:C for 1 h. (c) Western blotting of IRF3 dimerization in Gsk3b +/+ and Gsk3b -/- MEFs stimulated with 10 mg/ml poly I:C for 1 h. (d) Real-time PCR analysis of IFN-b mrna expression in RAW264.7 cells stably expressing control shrna (Con) or GSK3b-specific shrna (sh-gsk3b) and Gsk3b +/+ and Gsk3b -/- MEFs stimulated with 10 mg/ml poly I:C for 1 h. (e) Real-time PCR analysis of IFN-b mrna expression in BMDMs transfected with 20 nm control sirna (Con) or specific sirna targeting GSK3a (si-gsk3a) or GSK3b (si-gsk3b) for 36 h and stimulated with 10 mg/ml poly I:C for 1 h. (f) Real-time PCR analysis of IFN-b mrna expression in BMDMs preincubated with DMSO or 5-20 mm SB for 1 h and stimulated with 10 mg/ml poly I:C for 1 h. Data are presented as means ±SD from at least three independent experiments. Statistical analyses were calculated with Student s t-test ( ** P < 0.01; NS: not significant). 6
 or specific sirnas targeting either GSK3a (si-gsk3a) or GSK3b (si-gsk3b) or sirnas targeting both GSK3a and GSK3b (si- GSK3a+b) for 36 h.")
7 7 Supplementary Figure 5. Effects of GSK3b knockdown on poly I:C-induced MAPK activation in BMDMs. BMDMs were transfected with 20 nm control sirna (Con) or specific sirnas targeting either GSK3a (si-gsk3a) or GSK3b (si-gsk3b) or sirnas targeting both GSK3a and GSK3b (si- GSK3a+b) for 36 h. Cells were stimulated with 10 mg/ml poly I:C for indicated time points, and the phosphorylation levels of ERK, p38, and JNK were determined by Western blotting. Data are representative of three independent experiments. 7
 Western blotting of IKKa/b, IkB-a, and NF-kB p65 phosphorylation and IkB-a degradation in Gsk3b +/+ and Gsk3b -/- MEFs stimulated with 10 mg/ml poly I:C for 20 min.")
8 8 a b c Supplementary Figure 6. Effects of GSK3b deficiency on poly I:C-induced NF-kB activation. (a) Western blotting of IKKa/b, IkB-a, and NF-kB p65 phosphorylation and IkB-a degradation in Gsk3b +/+ and Gsk3b -/- MEFs stimulated with 10 mg/ml poly I:C for 20 min. (b) Relative luciferase activity in RAW264.7 cells, stably expressing control shrna (Con) or GSK3bspecific shrna (sh-gsk3b), transiently transfected with control or NF-kB-reporter plasmids and stimulated with 10 mg/ml poly I:C for 4 h. NF-kB-reporter activities was determined, and the values were normalized to renilla luciferase activity. (c) Relative luciferase activity in HEK293-null or HEK293-TLR3 cells transiently transfected with NF-kB-reporter along with GFP or GSK3b plasmids and stimulated with 10 mg/ml poly I:C for 4 h. Data are presented as means ±SD from at least three independent experiments. Statistical analyses were calculated with Student s t-test (NS: not significant). 8
 or GSK3b-specific shrna (sh-gsk3b) stimulated with 10 mg/ml poly I:C for 90 min.")
9 9 Supplementary Figure 7. Effects of GSK3b knockdown on nuclear levels of c-fos. Western blotting of nuclear c-fos in RAW264.7 cells stably expressing control shrna (Con) or GSK3b-specific shrna (sh-gsk3b) stimulated with 10 mg/ml poly I:C for 90 min. Data are representative of three independent experiments. 9
10 10 Supplementary Figure 8. Effects of GSK3a or GSK3b overexpression on c-fos gene expression. HEK293-TLR3 cells were transfected with V5-GSK3a or HA-GSK3b plasmids, and the levels of c-fos mrna were determined by real-time PCR. Data are presented as means ±SD from at least three independent experiments. Statistical analyses were calculated with Student s t-test ( ** P < 0.01). 10

11 11 Supplementary Figure 9. Effects of c-fos sirna on cytokine gene expression. RAW264.7 cells were transfected with 10 nm control sirna (Con) or c-fos-specific sirna (si-c-fos) for 36 h. Levels of IL-6 and TNF-a mrna were determined by real-time PCR. Knockdown of c-fos was confirmed by Western blotting. Data are presented as means ±SD from at least three independent experiments. Statistical analyses were calculated with Student s t-test ( ** P < 0.01). 11
 or GSK3b-specific shrna (sh- GSK3b) were stimulated with 10 mg/ml poly I:C for 10 min and subjected to immunoprecipitation with an anti-tlr3 antibody.")
12 12 a b Supplementary Figure 10. GSK3b is required for the recruitment of the TRAF6-TAK1- TAB1-TAB2 complex to TLR3. (a) RAW264.7 cells stably expressing control shrna (Con) or GSK3b-specific shrna (sh- GSK3b) were stimulated with 10 mg/ml poly I:C for 10 min and subjected to immunoprecipitation with an anti-tlr3 antibody. TRIF, RIP1, TRAF6, TAK1, TAB1, TAB2, and GSK3b protein levels from whole cell lysates (WCL) and TLR3 immunocomplexes (IP: a- TLR3) were determined by Western blotting. (b) As in a, except that BMDMs were preincubated with 10 mm SB for 1 h and then stimulated with poly I:C followed by immunoprecipitation. Data are representative of two independent experiments. 12
 or with anti-myc (b) antibodies followed by Western blotting with the indicated antibodies.")
13 13 a b Supplementary Figure 11. GSK3b forms a ternary complex with TRAF6 and TAK1. HEK293T cells were transfected with the indicated combinations of expression plasmids. Coimunoprecipitations were performed with anti-ha (a) or with anti-myc (b) antibodies followed by Western blotting with the indicated antibodies. Data are representative of three independent experiments. 13
 HEK293T cells transfected with HA-GSK3b and Myc-RIP1 plasmids were subjected to immunoprecipitation with an anti-ha antibody followed by")
 BMDMs were stimulated with 10 mg/ml poly I:C for 10 min and subjected to immunoprecipitation with an anti-gsk3b antibody.")
14 14 a b Supplementary Figure 12. GSK3b does not interact with RIP1. (a) HEK293T cells transfected with HA-GSK3b and Myc-RIP1 plasmids were subjected to immunoprecipitation with an anti-ha antibody followed by Western blotting with an anti-myc antibody. (b) BMDMs were stimulated with 10 mg/ml poly I:C for 10 min and subjected to immunoprecipitation with an anti-gsk3b antibody. RIP1 protein levels from whole cell lysates (WCL) and GSK3b immunocomplexes (IP: a-gsk3b) were determined by Western blotting. Data are representative of three independent experiments. 14
 The interaction between full-length GSK3b and TRAF6 deletion mutants.")
 The interaction between full-length TRAF6 and GSK3b deletion mutants.")
15 15 a b Supplementary Figure 13. The N-terminal region of GSK3b spanning amino acids is required for interaction with TRAF6. (a) The interaction between full-length GSK3b and TRAF6 deletion mutants. HEK293T cells transfected with the indicated plasmids were subjected to GST pull-down followed by Western blotting with the indicated antibodies. (b) The interaction between full-length TRAF6 and GSK3b deletion mutants. These experiments were performed as described in a. Data are representative of three independent experiments. 15
] or K63-linked ubiquitin [HA-Ub (K63)] along with TRAF6 plasmid were subjected to")
16 16 Supplementary Figure 14. TRAF6-mediated GSK3b ubiquitination occurs through K63 linkage. HEK293T cells transfected with GFP-GSK3b and plasmid encoding HA-tagged K48-linked ubiquitin [HA-Ub (K48)] or K63-linked ubiquitin [HA-Ub (K63)] along with TRAF6 plasmid were subjected to immunoprecipitation with an anti-ha antibody followed by Western blotting with the indicated antibodies. Data are representative of three independent experiments. 16
 plasmids along with His- NEDD4-1, Flag-TRAF6, or Flag-TRAF3 plasmids were subjected to immunoprecipitation with an anti-ub antibody")
17 17 Supplementary Figure 15. TRAF6, but not NEDD4-1 or TRAF3, ubiquitinates GSK3b. HEK293T cells transfected with HA-GSK3b and ubiquitin (Ub) plasmids along with His- NEDD4-1, Flag-TRAF6, or Flag-TRAF3 plasmids were subjected to immunoprecipitation with an anti-ub antibody followed by Western blotting with an indicated antibodies. Data are representative of three independent experiments. 17

18 18 a b c 18
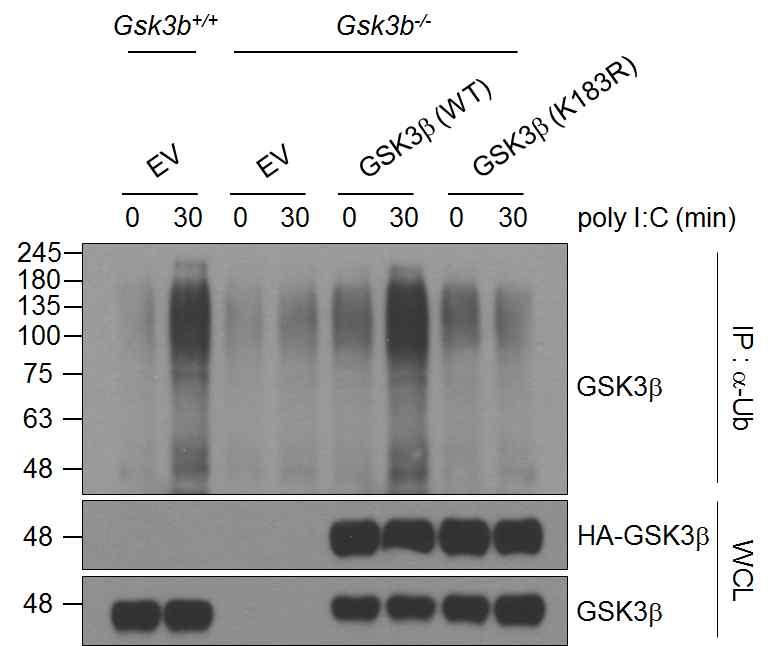
19 19 Supplementary Figure 16. Effects of GSK3b reconstitution on cytokine gene expression and ubiquitination in Gsk3b -/- MEFs. (a) Levels of IL-6, TNF-a, IL-10, and c-fos mrna in Gsk3b -/- MEFs reconstituted with HA- GSK3b (WT) or HA-GSK3b (K183R) plasmids were determined by real-time PCR analysis. Data are presented as means ±SD from at least three independent experiments. Statistical analyses were calculated with Student s t-test ( ** P < 0.01; NS: not significant). (b) The expression levels of the transfected plasmids were confirmed by Western blotting. (c) Gsk3b -/- MEFs were transiently transfected with HA-GSK3b (WT) or HA-GSK3b (K183R) plasmids, and cells stimulated with 10 mg/ml poly I:C for 30 min were subjected to immunoprecipitation with an anti-ub antibody followed by Western blotting with an anti-gsk3b antibody. 19
 or GST-GSK3b (1-120) and along with Flag-TRAF6 plasmids were subjected to immunoprecipitation with an anti-ub antibody followed by")
20 20 Supplementary Figure 17. TRAF6 fails to promote ubiquitination of GSK3b (1-120) mutant. HEK293T cells transfected with HA-Ub and GST-GSK3b (WT) or GST-GSK3b (1-120) and along with Flag-TRAF6 plasmids were subjected to immunoprecipitation with an anti-ub antibody followed by Western blotting with indicated antibodies. Data are representative of three independent experiments. 20
 or GSK3b (1-120) plasmid.")
.")
21 21 Supplementary Figure 18. Effects of GSK3b (1-120) overexpression on IL-6, TNF-a and c- Fos mrna expression. HEK293-TLR3 cells were transiently transfected with GSK3b (WT) or GSK3b (1-120) plasmid. The levels of IL-6, TNF-a, and c-fos mrna were determined by real-time PCR analysis (top). GSK3b expression levels were confirmed by Western blotting with an anti-gst antibody (bottom). Data are presented as the mean ±SD from at least three independent experiments. Statistical analyses were calculated with Student s t-test ( ** P < 0.01). 21
22 22 Supplementary Figure 19. Effects of GSK3b (K183R) overexpression on the formation of TRAF6-GSK3b-TAK1 complex. HEK293T cells transfected with Flag-TRAF6 and Myc-TAK1 plasmids along with HA-GSK3b (WT) or HA-GSK3b (K183R) plasmid were subjected to immunoprecipitation with an anti-ha antibody followed by Western blotting with the indicated antibodies. Data are representative of three independent experiments. 22
 HEK293T cells transfected with the indicated combinations of expression plasmids were subjected to GST pull-down")

23 23 a b Supplementary Figure 20. GSK3b associates with TRIF, TRAF3, and TBK1. (a,b) HEK293T cells transfected with the indicated combinations of expression plasmids were subjected to GST pull-down (a) or immunoprecipitation with anti-ha antibody (b) followed by Western blotting with the indicated antibodies. The expression levels of the transfected plasmids were confirmed by immunoblotting of whole cell lysates. Data are representative of three independent experiments. 23
 or GSK3b-specific shrna (sh- GSK3b) were stimulated with 10 mg/ml poly I:C for 15 min and subjected to immunoprecipitation with an anti-traf6 antibody")
24 24 Supplementary Figure 21. Effects of GSK3b on serine/threonine phosphorylation of TRAF6. RAW264.7 cells stably expressing control shrna (Con) or GSK3b-specific shrna (sh- GSK3b) were stimulated with 10 mg/ml poly I:C for 15 min and subjected to immunoprecipitation with an anti-traf6 antibody followed by Western blotting with an antiphospho-ser/thr antibody. Data are representative of three independent experiments. 24

25 25 Supplementary Figure 22. Full scans of blots and gels (continued). 25

26 26 Supplementary Figure 22. Full scans of blots and gels (continued). 26

27 27 Supplementary Figure 22. Full scans of blots and gels (continued). 27

28 28 Supplementary Figure 22. Full scans of blots and gels (continued). 28

29 29 Supplementary Figure 22. Full scans of blots and gels (continued). 29

30 30 Supplementary Figure 22. Full scans of blots and gels (continued). 30

31 31 Supplementary Figure 22. Full scans of blots and gels (continued). 31

32 32 Supplementary Figure 22. Full scans of blots and gels (continued). 32

33 33 Supplementary Figure 22. Full scans of blots and gels (continued). 33

34 34 Supplementary Figure 22. Full scans of blots and gels (continued). 34

35 35 Supplementary Figure 22. Full scans of blots and gels (continued). 35

36 36 Supplementary Figure 22. Full scans of blots and gels (continued). 36

37 37 Supplementary Figure 22. Full scans of blots and gels (continued). 37

38 38 Supplementary Figure 22. Full scans of blots and gels (continued). 38

39 39 Supplementary Figure 22. Full scans of blots and gels (continued). 39

40 40 Supplementary Figure 22. Full scans of blots and gels (continued). 40

41 41 Supplementary Figure 22. Full scans of blots and gels (continued). 41
42 42 Supplementary Tables Supplementary Table 1. List of ubiquitin modification sites in GSK3b by mass spectrometry 42

43 43 Supplementary Table 2. Primers used for real-time PCR 43
S1a S1b S1c. S1d. S1f S1g S1h SUPPLEMENTARY FIGURE 1. - si sc Il17rd Il17ra bp. rig/s IL-17RD (ng) -100 IL-17RD
 -100 IL-17RD") SUPPLEMENTARY FIGURE 1 0 20 50 80 100 IL-17RD (ng) S1a S1b S1c IL-17RD β-actin kda S1d - si sc Il17rd Il17ra rig/s15-574 - 458-361 bp S1f S1g S1h S1i S1j Supplementary Figure 1. Knockdown of IL-17RD enhances
SUPPLEMENTARY FIGURE 1 0 20 50 80 100 IL-17RD (ng) S1a S1b S1c IL-17RD β-actin kda S1d - si sc Il17rd Il17ra rig/s15-574 - 458-361 bp S1f S1g S1h S1i S1j Supplementary Figure 1. Knockdown of IL-17RD enhances
Supplementary Figure 1
 Supplementary Figure 1 YAP negatively regulates IFN- signaling. (a) Immunoblot analysis of Yap knockdown efficiency with sh-yap (#1 to #4 independent constructs) in Raw264.7 cells. (b) IFN- -Luc and PRDs
SUPPLEMENTAL FIGURE LEGENDS
 SUPPLEMENTAL FIGURE LEGENDS Supplemental Figure S1: Endogenous interaction between RNF2 and H2AX: Whole cell extracts from 293T were subjected to immunoprecipitation with anti-rnf2 or anti-γ-h2ax antibodies
Supplementary Information
 Supplementary Information mediates STAT3 activation at retromer-positive structures to promote colitis and colitis-associated carcinogenesis Zhang et al. a b d e g h Rel. Luc. Act. Rel. mrna Rel. mrna
SUPPLEMENTARY INFORMATION
 doi: 10.1038/nature05732 SUPPLEMENTARY INFORMATION Supplemental Data Supplement Figure Legends Figure S1. RIG-I 2CARD undergo robust ubiquitination a, (top) At 48 h posttransfection with a GST, GST-RIG-I-2CARD
Supplementary Figure 1.TRIM33 binds β-catenin in the nucleus. a & b, Co-IP of endogenous TRIM33 with β-catenin in HT-29 cells (a) and HEK 293T cells
 and HEK 293T cells") Supplementary Figure 1.TRIM33 binds β-catenin in the nucleus. a & b, Co-IP of endogenous TRIM33 with β-catenin in HT-29 cells (a) and HEK 293T cells (b). TRIM33 was immunoprecipitated, and the amount of
Supplementary Figure 1.TRIM33 binds β-catenin in the nucleus. a & b, Co-IP of endogenous TRIM33 with β-catenin in HT-29 cells (a) and HEK 293T cells (b). TRIM33 was immunoprecipitated, and the amount of
Intracellular MHC class II molecules promote TLR-triggered innate. immune responses by maintaining Btk activation
 Intracellular MHC class II molecules promote TLR-triggered innate immune responses by maintaining Btk activation Xingguang Liu, Zhenzhen Zhan, Dong Li, Li Xu, Feng Ma, Peng Zhang, Hangping Yao and Xuetao
Supplementary Materials for
 www.sciencesignaling.org/cgi/content/full/9/439/ra78/dc1 Supplementary Materials for Small heterodimer partner mediates liver X receptor (LXR) dependent suppression of inflammatory signaling by promoting
Supplementary Figure 1. PD-L1 is glycosylated in cancer cells. (a) Western blot analysis of PD-L1 in breast cancer cells. (b) Western blot analysis
 Western blot analysis of PD-L1 in breast cancer cells. (b) Western blot analysis") Supplementary Figure 1. PD-L1 is glycosylated in cancer cells. (a) Western blot analysis of PD-L1 in breast cancer cells. (b) Western blot analysis of PD-L1 in ovarian cancer cells. (c) Western blot analysis
Supplementary Figure 1. PD-L1 is glycosylated in cancer cells. (a) Western blot analysis of PD-L1 in breast cancer cells. (b) Western blot analysis of PD-L1 in ovarian cancer cells. (c) Western blot analysis
T H E J O U R N A L O F C E L L B I O L O G Y
 Supplemental material Chairoungdua et al., http://www.jcb.org/cgi/content/full/jcb.201002049/dc1 T H E J O U R N A L O F C E L L B I O L O G Y Figure S1. Expression of CD9 and CD82 inhibits Wnt/ -catenin
Nature Immunology: doi: /ni Supplementary Figure 1. IC261 inhibits a virus-induced type I interferon response.
 Supplementary Figure 1 IC261 inhibits a virus-induced type I interferon response. (a) HEK293T cells were cultured in 384 wells and transiently transfected with 50 ng of the IFN-β promoter-luc construct
Supplementary Figure 1. Normal T lymphocyte populations in Dapk -/- mice. (a) Normal thymic development in Dapk -/- mice. Thymocytes from WT and Dapk
 Normal thymic development in Dapk -/- mice. Thymocytes from WT and Dapk") Supplementary Figure 1. Normal T lymphocyte populations in Dapk -/- mice. (a) Normal thymic development in Dapk -/- mice. Thymocytes from WT and Dapk -/- mice were stained for expression of CD4 and CD8.
Supplementary Figure 1. Normal T lymphocyte populations in Dapk -/- mice. (a) Normal thymic development in Dapk -/- mice. Thymocytes from WT and Dapk -/- mice were stained for expression of CD4 and CD8.
SUPPLEMENTARY INFORMATION
 SUPPLEMENTARY INFORMATION doi:1.138/nature9814 a A SHARPIN FL B SHARPIN ΔNZF C SHARPIN T38L, F39V b His-SHARPIN FL -1xUb -2xUb -4xUb α-his c Linear 4xUb -SHARPIN FL -SHARPIN TF_LV -SHARPINΔNZF -SHARPIN
Supplementary Figure S1 Supplementary Figure S2
 Supplementary Figure S A) The blots shown in Figure B were qualified by using Gel-Pro analyzer software (Rockville, MD, USA). The ratio of LC3II/LC3I to actin was then calculated. The data are represented
Tbk1-TKO! DN cells (%)! 15! 10!
! 15! 10!") a! T Cells! TKO! B Cells! TKO! b! CD4! 8.9 85.2 3.4 2.88 CD8! Tbk1-TKO! 1.1 84.8 2.51 2.54 c! DN cells (%)! 4 3 2 1 DP cells (%)! 9 8 7 6 CD4 + SP cells (%)! 5 4 3 2 1 5 TKO! TKO! TKO! TKO! 15 1 5 CD8
a! T Cells! TKO! B Cells! TKO! b! CD4! 8.9 85.2 3.4 2.88 CD8! Tbk1-TKO! 1.1 84.8 2.51 2.54 c! DN cells (%)! 4 3 2 1 DP cells (%)! 9 8 7 6 CD4 + SP cells (%)! 5 4 3 2 1 5 TKO! TKO! TKO! TKO! 15 1 5 CD8
Reviewers' comments: Reviewer #1 (Remarks to the Author):
:") Reviewers' comments: Reviewer #1 (Remarks to the Author): In this manuscript, Song et al. identified FBXW7 as a new positive regulator for RIG-Itriggered type I IFN signaling pathway. The authors observed
Reviewers' comments: Reviewer #1 (Remarks to the Author): In this manuscript, Song et al. identified FBXW7 as a new positive regulator for RIG-Itriggered type I IFN signaling pathway. The authors observed
Supplementary Figure 1. MAT IIα is Acetylated at Lysine 81.
 IP: Flag a Mascot PTM Modified Mass Error Position Gene Names Score Score Sequence m/z [ppm] 81 MAT2A;AMS2;MATA2 35.6 137.28 _AAVDYQK(ac)VVR_ 595.83-2.28 b Pre-immu After-immu Flag- WT K81R WT K81R / Flag
NLRC5 Negatively Regulates the NF-kB and Type I Interferon Signaling Pathways
 NLRC5 Negatively Regulates the NF-kB and Type I Interferon Signaling Pathways Jun Cui, 1,2,5 Liang Zhu, 1,3,5 Xiaojun Xia, 1,5 Helen Y. Wang, 1 Xavier Legras, 1 Jun Hong, 1 Jiabing Ji, 1 Pingping Shen,
Supplementary Materials
 Supplementary Materials Supplementary Figure S1 Regulation of Ubl4A stability by its assembly partner A, The translation rate of Ubl4A is not affected in the absence of Bag6. Control, Bag6 and Ubl4A CRISPR
(A) SW480, DLD1, RKO and HCT116 cells were treated with DMSO or XAV939 (5 µm)
 SW480, DLD1, RKO and HCT116 cells were treated with DMSO or XAV939 (5 µm)") Supplementary Figure Legends Figure S1. Tankyrase inhibition suppresses cell proliferation in an axin/β-catenin independent manner. (A) SW480, DLD1, RKO and HCT116 cells were treated with DMSO or XAV939
Supplementary Figure Legends Figure S1. Tankyrase inhibition suppresses cell proliferation in an axin/β-catenin independent manner. (A) SW480, DLD1, RKO and HCT116 cells were treated with DMSO or XAV939
A. List of selected proteins with high SILAC (H/L) ratios identified in mass
 ratios identified in mass") Supplementary material Figure S1. Interaction between UBL5 and FANCI A. List of selected proteins with high SILAC (H/L) ratios identified in mass spectrometry (MS)-based analysis of UBL5-interacting proteins,
Supplementary material Figure S1. Interaction between UBL5 and FANCI A. List of selected proteins with high SILAC (H/L) ratios identified in mass spectrometry (MS)-based analysis of UBL5-interacting proteins,
supplementary information
 DOI: 10.1038/ncb1875 Figure S1 (a) The 79 surgical specimens from NSCLC patients were analysed by immunohistochemistry with an anti-p53 antibody and control serum (data not shown). The normal bronchi served
Pro-apoptotic signalling through Toll-like receptor 3 involves TRIF-dependent
 Pro-apoptotic signalling through Toll-like receptor 3 involves TRIF-dependent activation of caspase-8 and is under the control of inhibitor of apoptosis proteins in melanoma cells Arnim Weber, Zofia Kirejczyk,
Supplementary Figure 1
 Supplementary Figure 1 a γ-h2ax MDC1 RNF8 FK2 BRCA1 U2OS Cells sgrna-1 ** 60 sgrna 40 20 0 % positive Cells (>5 foci per cell) b ** 80 sgrna sgrna γ-h2ax MDC1 γ-h2ax RNF8 FK2 MDC1 BRCA1 RNF8 FK2 BRCA1
Supplementary Figure 1
 Supplementary Figure 1 Constitutive EGFR signaling does not activate canonical EGFR signals (a) U251EGFRInd cells with or without tetracycline exposure (24h, 1µg/ml) were treated with EGF for 15 minutes
Title of file for HTML: Supplementary Information Description: Supplementary Figures and Supplementary Table
 Title of file for HTML: Supplementary Information Description: Supplementary Figures and Supplementary Table Title of file for HTML: Peer Review File Description: Innate Scavenger Receptor-A regulates
p47 negatively regulates IKK activation by inducing the lysosomal degradation of polyubiquitinated NEMO
 Supplementary Information p47 negatively regulates IKK activation by inducing the lysosomal degradation of polyubiquitinated NEMO Yuri Shibata, Masaaki Oyama, Hiroko Kozuka-Hata, Xiao Han, Yuetsu Tanaka,
Supplemental Figure 1. Western blot analysis indicated that MIF was detected in the fractions of
 Supplemental Figure Legends Supplemental Figure 1. Western blot analysis indicated that was detected in the fractions of plasma membrane and cytosol but not in nuclear fraction isolated from Pkd1 null
Predictive PP1Ca binding region in BIG3 : 1,228 1,232aa (-KAVSF-) HEK293T cells *** *** *** KPL-3C cells - E E2 treatment time (h)
 HEK293T cells *** *** *** KPL-3C cells - E E2 treatment time (h)") Relative expression ERE-luciferase activity activity (pmole/min) activity (pmole/min) activity (pmole/min) activity (pmole/min) MCF-7 KPL-3C ZR--1 BT-474 T47D HCC15 KPL-1 HBC4 activity (pmole/min) a d
Relative expression ERE-luciferase activity activity (pmole/min) activity (pmole/min) activity (pmole/min) activity (pmole/min) MCF-7 KPL-3C ZR--1 BT-474 T47D HCC15 KPL-1 HBC4 activity (pmole/min) a d
condition. Left panel, the HCT-116 cells were lysed with RIPA buffer containing 0.1%
 FIGURE LEGENDS Supplementary Fig 1 (A) sumoylation pattern detected under denaturing condition. Left panel, the HCT-116 cells were lysed with RIPA buffer containing 0.1% SDS in the presence and absence
Nature Immunology doi: /ni.3268
 Supplementary Figure 1 Loss of Mst1 and Mst2 increases susceptibility to bacterial sepsis. (a) H&E staining of colon and kidney sections from wild type and Mst1 -/- Mst2 fl/fl Vav-Cre mice. Scale bar,
Supplementary Information
 Supplementary Information An orally available, small-molecule interferon inhibits viral replication Hideyuki Konishi 1, Koichi Okamoto 1, Yusuke Ohmori 1, Hitoshi Yoshino 2, Hiroshi Ohmori 1, Motooki Ashihara
Supplementary Figure 1. PAQR3 knockdown inhibits SREBP-2 processing in CHO-7 cells CHO-7 cells were transfected with control sirna or a sirna
 Supplementary Figure 1. PAQR3 knockdown inhibits SREBP-2 processing in CHO-7 cells CHO-7 cells were transfected with control sirna or a sirna targeted for hamster PAQR3. At 24 h after the transfection,
Appendix. Table of Contents
 Appendix Table of Contents Appendix Figures Figure S1: Gp78 is not required for the degradation of mcherry-cl1 in Hela Cells. Figure S2: Indel formation in the MARCH6 sgrna targeted HeLa clones. Figure
Supplementary Figure 1
 Supplementary Figure 1 Supplementary Figure 1. Neither the activation nor suppression of the MAPK pathway affects the ASK1/Vif interaction. (a, b) HEK293 cells were cotransfected with plasmids encoding
TNFα- and IKKβ-mediated TANK/I-TRAF phosphorylation: implications for interaction with NEMO/IKKγ and NF-κB activation
 Biochem. J. (2006) 394, 593 603 (Printed in Great Britain) doi:10.1042/bj20051659 593 TNFα- and IKKβ-mediated TANK/I-TRAF phosphorylation: implications for interaction with NEMO/IKKγ and NF-κB activation
SUPPLEMENTARY INFORMATION
 DOI: 10.1038/ncb2566 Figure S1 CDKL5 protein expression pattern and localization in mouse brain. (a) Multiple-tissue western blot from a postnatal day (P) 21 mouse probed with an antibody against CDKL5.
Lysine methyltransferase SMYD2 promotes cyst growth in autosomal dominant polycystic kidney disease
 Lysine methyltransferase SMYD2 promotes cyst growth in autosomal dominant polycystic kidney disease Linda Xiaoyan Li,, Julien Sage, Xiaogang Li J Clin Invest. 2017;127(7):2751-2764. https://doi.org/10.1172/jci90921.
293T cells were transfected with indicated expression vectors and the whole-cell extracts were subjected
 SUPPLEMENTARY INFORMATION Supplementary Figure 1. Formation of a complex between Slo1 and CRL4A CRBN E3 ligase. (a) HEK 293T cells were transfected with indicated expression vectors and the whole-cell
William C. Comb, Jessica E. Hutti, Patricia Cogswell, Lewis C. Cantley, and Albert S. Baldwin
 Molecular Cell, Volume 45 Supplemental Information p85 SH2 Domain Phosphorylation by IKK Promotes Feedback Inhibition of PI3K and Akt in Response to Cellular Starvation William C. Comb, Jessica E. Hutti,
Supplementary Materials for
 www.sciencesignaling.org/cgi/content/full/8/364/ra18/dc1 Supplementary Materials for The tyrosine phosphatase (Pez) inhibits metastasis by altering protein trafficking Leila Belle, Naveid Ali, Ana Lonic,
SUPPLEMENTARY INFORMATION
 DOI:.38/ncb2822 a MTC02 FAO cells EEA1 b +/+ MEFs /DAPI -/- MEFs /DAPI -/- MEFs //DAPI c HEK 293 cells WCE N M C P AKT TBC1D7 Lamin A/C EEA1 VDAC d HeLa cells WCE N M C P AKT Lamin A/C EEA1 VDAC Figure
FIG S1 Examination of eif4b expression after virus infection. (A) A549 cells
 A549 cells") Supplementary Figure Legends FIG S1 Examination of expression after virus infection. () 549 cells were infected with herpes simplex virus (HSV) (MOI = 1), and harvested at the indicated times, followed
Supplementary Figure Legends FIG S1 Examination of expression after virus infection. () 549 cells were infected with herpes simplex virus (HSV) (MOI = 1), and harvested at the indicated times, followed
ACC ELOVL MCAD. CPT1α 1.5 *** 0.5. Reverbα *** *** 0.5. Fasted. Refed
 Supplementary Figure A 8 SREBPc 6 5 FASN ELOVL6.5.5.5 ACC.5.5 CLOCK.5.5 CRY.5.5 PPARα.5.5 ACSL CPTα.5.5.5.5 MCAD.5.5 PEPCK.5.5 G6Pase 5.5.5.5 BMAL.5.5 Reverbα.5.5 Reverbβ.5.5 PER.5.5 PER B Fasted Refed
NOD1 contributes to mouse host defense against Helicobacter pylori via induction of type I IFN and activation of the ISGF3 signaling pathway
 Research article NOD1 contributes to mouse host defense against Helicobacter pylori via induction of type I IFN and activation of the ISGF3 signaling pathway Tomohiro Watanabe, 1,2 Naoki Asano, 1 Stefan
Integrin CD11b negatively regulates TLR-triggered inflammatory responses by. activating Syk and promoting MyD88 and TRIF degradation via cbl-b
 Integrin CD11b negatively regulates TLR-triggered inflammatory responses by activating Syk and promoting MyD88 and TRIF degradation via cbl-b Chaofeng Han, Jing Jin, Sheng Xu, Haibo Liu, Nan Li, and Xuetao
Received 28 September 2010/Returned for modification 19 October 2010/Accepted 27 April 2011
 MOLECULAR AND CELLULAR BIOLOGY, July 2011, p. 2774 2786 Vol. 31, No. 14 0270-7306/11/$12.00 doi:10.1128/mcb.01139-10 Copyright 2011, American Society for Microbiology. All Rights Reserved. A Cytosolic
Type of file: PDF Title of file for HTML: Supplementary Information Description: Supplementary Figures
 Type of file: PDF Title of file for HTML: Supplementary Information Description: Supplementary Figures Type of file: MOV Title of file for HTML: Supplementary Movie 1 Description: NLRP3 is moving along
Supplementary Fig. 1. GPRC5A post-transcriptionally down-regulates EGFR expression. (a) Plot of the changes in steady state mrna levels versus
 Plot of the changes in steady state mrna levels versus") Supplementary Fig. 1. GPRC5A post-transcriptionally down-regulates EGFR expression. (a) Plot of the changes in steady state mrna levels versus changes in corresponding proteins between wild type and Gprc5a-/-
Supplementary Fig. 1. GPRC5A post-transcriptionally down-regulates EGFR expression. (a) Plot of the changes in steady state mrna levels versus changes in corresponding proteins between wild type and Gprc5a-/-
SUPPLEMENTARY INFORMATION
 DOI: 10.1038/ncb3076 Supplementary Figure 1 btrcp targets Cep68 for degradation during mitosis. a) Cep68 immunofluorescence in interphase and metaphase. U-2OS cells were transfected with control sirna
Table S1. Primer sequences used for qrt-pcr. CACCATTGGCAATGAGCGGTTC AGGTCTTTGCGGATGTCCACGT ACTB AAGTCCATGTGCTGGCAGCACT ATCACCACTCCGAAGTCCGTCT LCOR
 Table S1. Primer sequences used for qrt-pcr. ACTB LCOR KLF6 CTBP1 CDKN1A CDH1 ATF3 PLAU MMP9 TFPI2 CACCATTGGCAATGAGCGGTTC AGGTCTTTGCGGATGTCCACGT AAGTCCATGTGCTGGCAGCACT ATCACCACTCCGAAGTCCGTCT CGGCTGCAGGAAAGTTTACA
SUPPLEMENTARY INFORMATION
 doi:10.1038/nature11700 Figure 1: RIP3 as a potential Sirt2 interacting protein. Transfected Flag-tagged Sirt2 was immunoprecipitated from cells and eluted from the Sepharose beads using Flag peptide.
Study of different types of ubiquitination
 Study of different types of ubiquitination Rudi Beyaert (rudi.beyaert@irc.vib-ugent.be) VIB UGent Center for Inflammation Research Ghent, Belgium VIB Training Novel Proteomics Tools: Identifying PTMs October
SUPPLEMENTARY INFORMATION
 DOI: 10.1038/ncb2988 Supplementary Figure 1 Kif7 L130P encodes a stable protein that does not localize to cilia tips. (a) Immunoblot with KIF7 antibody in cell lysates of wild-type, Kif7 L130P and Kif7
Identified proteins interacting with TMBIM1 by mass spectrometry
 Supplementary Information Journal: Nature Medicine Article Title: Corresponding Author: A novel multivesicular body regulator TMBIM1 protects against non-alcoholic fatty liver disease in mice and monkeys
Schwarz et al. Activity-Dependent Ubiquitination of GluA1 Mediates a Distinct AMPAR Endocytosis
 Schwarz et al Activity-Dependent Ubiquitination of GluA1 Mediates a Distinct AMPAR Endocytosis and Sorting Pathway Supplemental Data Supplemental Fie 1: AMPARs undergo activity-mediated ubiquitination
Supplementary Figure 1 Induction of cellular senescence and isolation of exosome. a to c, Pre-senescent primary normal human diploid fibroblasts
 Supplementary Figure 1 Induction of cellular senescence and isolation of exosome. a to c, Pre-senescent primary normal human diploid fibroblasts (TIG-3 cells) were rendered senescent by either serial passage
Supplements. Figure S1. B Phalloidin Alexa488
 Supplements A, DMSO, PP2, PP3 Crk-myc Figure S1. (A) Src kinase activity is necessary for recruitment of Crk to Nephrin cytoplasmic domain. Human podocytes expressing /7-NephrinCD () were treated with
SUPPLEMENTARY INFORMATION
 Supplementary Table 1. Cell sphingolipids and S1P bound to endogenous TRAF2. Sphingolipid Cell pmol/mg TRAF2 immunoprecipitate pmol/mg Sphingomyelin 4200 ± 250 Not detected Monohexosylceramide 311 ± 18
Supplementary Figure 1 CD4 + T cells from PKC-θ null mice are defective in NF-κB activation during T cell receptor signaling. CD4 + T cells were
 Supplementary Figure 1 CD4 + T cells from PKC-θ null mice are defective in NF-κB activation during T cell receptor signaling. CD4 + T cells were isolated from wild type (PKC-θ- WT) or PKC-θ null (PKC-θ-KO)
Supplementary Figure 1. SC35M polymerase activity in the presence of Bat or SC35M NP encoded from the phw2000 rescue plasmid.
 1 2 3 4 5 6 7 8 9 10 11 12 13 14 15 16 17 18 19 20 21 22 23 24 25 26 27 Supplementary Figure 1. SC35M polymerase activity in the presence of Bat or SC35M NP encoded from the phw2000 rescue plasmid. HEK293T
File Name: Supplementary Information Description: Supplementary Figures and Supplementary Tables. File Name: Peer Review File Description:
 File Name: Supplementary Information Description: Supplementary Figures and Supplementary Tables File Name: Peer Review File Description: Primer Name Sequence (5'-3') AT ( C) RT-PCR USP21 F 5'-TTCCCATGGCTCCTTCCACATGAT-3'
(a) Significant biological processes (upper panel) and disease biomarkers (lower panel)
 Significant biological processes (upper panel) and disease biomarkers (lower panel)") Supplementary Figure 1. Functional enrichment analyses of secretomic proteins. (a) Significant biological processes (upper panel) and disease biomarkers (lower panel) 2 involved by hrab37-mediated secretory
Supplementary Figure 1. Functional enrichment analyses of secretomic proteins. (a) Significant biological processes (upper panel) and disease biomarkers (lower panel) 2 involved by hrab37-mediated secretory
SUPPLEMENTARY FIGURES
 SUPPLEMENTARY FIGURES Supplementary Figure 1. (A) Left, western blot analysis of ISGylated proteins in Jurkat T cells treated with 1000U ml -1 IFN for 16h (IFN) or left untreated (CONT); right, western
SUPPLEMENTARY INFORMATION
 SUPPLEMENTARY INFORMATION doi:10.1038/nature11429 S1a 6 7 8 9 Nlrc4 allele S1b Nlrc4 +/+ Nlrc4 +/F Nlrc4 F/F 9 Targeting construct 422 bp 273 bp FRT-neo-gb-PGK-FRT 3x.STOP S1c Nlrc4 +/+ Nlrc4 F/F casp1
Supplementary Table 1. Metabolic parameters in GFP and OGT-treated mice
 Supplementary Table 1. Metabolic parameters in GFP and OGT-treated mice Fasted Refed GFP OGT GFP OGT Liver G6P (mmol/g) 0.03±0.01 0.04±0.02 0.60±0.04 0.42±0.10 A TGs (mg/g of liver) 20.08±5.17 16.29±0.8
Supplementary Figure S1: Defective heterochromatin repair in HGPS progeroid cells
 Supplementary Figure S1: Defective heterochromatin repair in HGPS progeroid cells Immunofluorescence staining of H3K9me3 and 53BP1 in PH and HGADFN003 (HG003) cells at 24 h after γ-irradiation. Scale bar,
SUPPLEMENTARY INFORMATION
 sirna pool: Control Tetherin -HA-GFP HA-Tetherin -Tubulin Supplementary Figure S1. Knockdown of HA-tagged tetherin expression by tetherin specific sirnas. HeLa cells were cotransfected with plasmids expressing
Peli1 negatively regulates T-cell activation and prevents autoimmunity
 Peli1 negatively regulates T-cell activation and prevents autoimmunity Mikyoung Chang 1,*, Wei Jin 1,5,*, Jae-Hoon Chang 1, Yi-chuan Xiao 1, George Brittain 1, Jiayi Yu 1, Xiaofei Zhou 1, Yi-Hong Wang
Ubiquitination and deubiquitination of NP protein regulates influenza A virus RNA replication
 Manuscript EMBO-2010-74756 Ubiquitination and deubiquitination of NP protein regulates influenza A virus RNA replication Tsai-Ling Liao, Chung-Yi Wu, Wen-Chi Su, King-Song Jeng and Michael Lai Corresponding
Supplementary Figure 1
 Supplementary Figure 1 Supplementary Figure 1 Schematic depiction of the tandem Fc GDF15. Supplementary Figure 2 Supplementary Figure 2 Gfral mrna levels in the brains of both wild-type and knockout Gfral
CYLD Negatively Regulates Transforming Growth Factor-β Signaling via Deubiquitinating Akt
 Supplementary Information CYLD Negatively Regulates Transforming Growth Factor-β Signaling via Deubiquitinating Akt Jae Hyang Lim, Hirofumi Jono, Kensei Komatsu, Chang-Hoon Woo, Jiyun Lee, Masanori Miyata,
Title: Cytosolic DNA-mediated, STING-dependent pro-inflammatory gene. Fig. S1. STING ligands-mediated signaling response in MEFs. (A) Primary MEFs (1
 Primary MEFs (1") 1 Supporting Information 2 3 4 Title: Cytosolic DNA-mediated, STING-dependent pro-inflammatory gene induction necessitates canonical NF-κB activation through TBK1 5 6 Authors: Abe et al. 7 8 9 Supporting
1 Supporting Information 2 3 4 Title: Cytosolic DNA-mediated, STING-dependent pro-inflammatory gene induction necessitates canonical NF-κB activation through TBK1 5 6 Authors: Abe et al. 7 8 9 Supporting
Xiao-Wen Lin, Wei-Cheng Xu 3, Jian-Gang Luo 2, Xue-Jiao Guo 2, Tao Sun 2, Xu-Li Zhao 2, Zhi-Jian Fu 2 * Abstract. Introduction
 WW Domain Containing E3 Ubiquitin Protein Ligase 1 (WWP1) Negatively Regulates TLR4-Mediated TNF-a and IL-6 Production by Proteasomal Degradation of TNF Receptor Associated Factor 6 (TRAF6) 1,2 Xiao-Wen
Positive Regulation of TRAF6-Dependent Innate Immune Responses by Protein Phosphatase PP1-c
 Positive Regulation of TRAF6-Dependent Innate Immune Responses by Protein Phosphatase PP1-c Amanda M. Opaluch 1., Monika Schneider 1., Chih-yuan Chiang 1, Quy T. Nguyen 1, Ana M. Maestre 2, Lubbertus C.
Supplementary Figure 1. Prevalence of U539C and G540A nucleotide and E172K amino acid substitutions among H9N2 viruses. Full-length H9N2 NS
 Supplementary Figure 1. Prevalence of U539C and G540A nucleotide and E172K amino acid substitutions among H9N2 viruses. Full-length H9N2 NS nucleotide sequences (a, b) or amino acid sequences (c) from
Supplementary Fig. 1 p38 MAPK negatively regulates DC differentiation. (a) Western blot analysis of p38 isoform expression in BM cells, immature DCs
 Western blot analysis of p38 isoform expression in BM cells, immature DCs") Supplementary Fig. 1 p38 MAPK negatively regulates DC differentiation. (a) Western blot analysis of p38 isoform expression in BM cells, immature DCs (idcs) and mature DCs (mdcs). A myeloma cell line expressing
Supplementary Fig. 1 p38 MAPK negatively regulates DC differentiation. (a) Western blot analysis of p38 isoform expression in BM cells, immature DCs (idcs) and mature DCs (mdcs). A myeloma cell line expressing
Supplementary Figure 1. The CagA-dependent wound healing or transwell migration of gastric cancer cell. AGS cells transfected with vector control or
 Supplementary Figure 1. The CagA-dependent wound healing or transwell migration of gastric cancer cell. AGS cells transfected with vector control or 3xflag-CagA expression vector were wounded using a pipette
TRAF6 ubiquitinates TGFβ type I receptor to promote its cleavage and nuclear translocation in cancer
 Supplementary Information TRAF6 ubiquitinates TGFβ type I receptor to promote its cleavage and nuclear translocation in cancer Yabing Mu, Reshma Sundar, Noopur Thakur, Maria Ekman, Shyam Kumar Gudey, Mariya
Supporting Information
 Supporting Information Natural small molecule FMHM inhibits lipopolysaccharide-induced inflammatory response by promoting TRAF6 degradation via K48-linked polyubiquitination Ke-Wu Zeng 1, Li-Xi Liao 1,
SUPPLEMENTARY INFORMATION
 Figure S1. Silver staining and immunoblotting of the purified TAK1 kinase complex. The TAK1 kinase complex was purified through tandem affinity methods (Protein A and FLAG), and aliquots of the purified
NLRX1 Negatively Regulates TLR-Induced NF-kB Signaling by Targeting TRAF6 and IKK
 Article NLRX1 Negatively Regulates TLR-Induced NF-kB Signaling by Targeting TRAF6 and IKK Xiaojun Xia, 1,5 Jun Cui, 1,5 Helen Y. Wang, 1 Liang Zhu, 1 Satoko Matsueda, 1 Qinfu Wang, 1 Xiaoang Yang, 1 Jun
Supplementary Materials for
 www.sciencesignaling.org/cgi/content/full/6/283/ra57/dc1 Supplementary Materials for JNK3 Couples the Neuronal Stress Response to Inhibition of Secretory Trafficking Guang Yang,* Xun Zhou, Jingyan Zhu,
Brd4 Coactivates Transcriptional Activation of NF- B via Specific Binding to Acetylated RelA
 MOLECULAR AND CELLULAR BIOLOGY, Mar. 2009, p. 1375 1387 Vol. 29, No. 5 0270-7306/09/$08.00 0 doi:10.1128/mcb.01365-08 Copyright 2009, American Society for Microbiology. All Rights Reserved. Brd4 Coactivates
Supplementary Figures
 Supplementary Figures Supplementary Figure 1 DOT1L regulates the expression of epithelial and mesenchymal markers. (a) The expression levels and cellular localizations of EMT markers were confirmed by
Nature Structural and Molecular Biology: doi: /nsmb Supplementary Figure 1
 Supplementary Figure 1 Mutational analysis of the SA2-Scc1 interaction in vitro and in human cells. (a) Autoradiograph (top) and Coomassie stained gel (bottom) of 35 S-labeled Myc-SA2 proteins (input)
Supplementary Material
 Supplementary Material accompanying the manuscript Interleukin 37 is a fundamental inhibitor of innate immunity Marcel F Nold, Claudia A Nold-Petry, Jarod A Zepp, Brent E Palmer, Philip Bufler & Charles
Supplementary information. MARCH8 inhibits HIV-1 infection by reducing virion incorporation of envelope glycoproteins
 Supplementary information inhibits HIV-1 infection by reducing virion incorporation of envelope glycoproteins Takuya Tada, Yanzhao Zhang, Takayoshi Koyama, Minoru Tobiume, Yasuko Tsunetsugu-Yokota, Shoji
Supplement Figure S1. Real Time PCR analysis of mrna levels of C/EBPα and PU.1 in wild type (WT) and NQO1-null (NQO1-/-) mice.
 and NQO1-null (NQO1-/-) mice.") competes with 20S proteasome for binding with C/EBP leading to its stabilization and Relative mrna levels Supplement Figure S1. Real Time PCR analysis of mrna levels of C/EBPα and PU.1 in wild type (WT)
competes with 20S proteasome for binding with C/EBP leading to its stabilization and Relative mrna levels Supplement Figure S1. Real Time PCR analysis of mrna levels of C/EBPα and PU.1 in wild type (WT)
Live cell imaging of trafficking of the chaperone complex vaccine to the ER. BMDCs were incubated with ER-Tracker Red (1 M) in staining solution for
 in staining solution for") Live cell imaging of trafficking of the chaperone complex vaccine to the ER. BMDCs were incubated with ER-Tracker Red (1 M) in staining solution for 15 min at 37 C and replaced with fresh complete medium.
Live cell imaging of trafficking of the chaperone complex vaccine to the ER. BMDCs were incubated with ER-Tracker Red (1 M) in staining solution for 15 min at 37 C and replaced with fresh complete medium.
T H E J O U R N A L O F C E L L B I O L O G Y
 T H E J O U R N A L O F C E L L B I O L O G Y Supplemental material Krenn et al., http://www.jcb.org/cgi/content/full/jcb.201110013/dc1 Figure S1. Levels of expressed proteins and demonstration that C-terminal
supplementary information
 DOI: 1.138/ncb1 Control Atg7 / NAC 1 1 1 1 (mm) Control Atg7 / NAC 1 1 1 1 (mm) Lamin B Gstm1 Figure S1 Neither the translocation of into the nucleus nor the induction of antioxidant proteins in autophagydeficient
Supplementary Figure 1: si-craf but not si-braf sensitizes tumor cells to radiation.
 Supplementary Figure 1: si-craf but not si-braf sensitizes tumor cells to radiation. (a) Embryonic fibroblasts isolated from wildtype (WT), BRAF -/-, or CRAF -/- mice were irradiated (6 Gy) and DNA damage
The IKK-related kinase TBK1 activates mtorc1 directly in response to growth factors and innate immune agonists
 Article The IKK-related kinase TBK1 activates mtorc1 directly in response to growth factors and innate immune agonists Cagri Bodur 1, Dubek Kazyken 1,, Kezhen Huang 1,, Bilgen Ekim Ustunel 1, Kate A Siroky
Supplemental Information. NRF2 Is a Major Target of ARF. in p53-independent Tumor Suppression
 Molecular Cell, Volume 68 Supplemental Information NRF2 Is a Major Target of ARF in p53-independent Tumor Suppression Delin Chen, Omid Tavana, Bo Chu, Luke Erber, Yue Chen, Richard Baer, and Wei Gu Figure
WT Xid (h) poly(da:dt) Alum. Poly(dA:dT) 0.05
 poly(da:dt) Alum. Poly(dA:dT) 0.05") IL1 (ng/ml) (1 x 1 3 cells) DMSO LFMA13 R46 IL1 (ng/ml) Control shrna TNFa (ng/ml) Alum Nigericin ATP IL1 (ng/ml) IL1 (ng/ml) IL1 (ng/ml) a c f 3 2 1 1 8 6 4 2 Sup 1 8 6 4 DMSO Alum/DMSO Alum/LFMA13 ***
IL1 (ng/ml) (1 x 1 3 cells) DMSO LFMA13 R46 IL1 (ng/ml) Control shrna TNFa (ng/ml) Alum Nigericin ATP IL1 (ng/ml) IL1 (ng/ml) IL1 (ng/ml) a c f 3 2 1 1 8 6 4 2 Sup 1 8 6 4 DMSO Alum/DMSO Alum/LFMA13 ***
The Ubiquitin E3 Ligase RAUL Negatively Regulates Type I Interferon through Ubiquitination of the Transcription Factors IRF7 and IRF3
 Article The Ubiquitin E3 Ligase Negatively Regulates Type I Interferon through Ubiquitination of the Transcription Factors and Yanxing Yu 1,2, * and Gary S. Hayward 1, * 1 Viral Oncology Program, The Sidney
Nature Structural & Molecular Biology: doi: /nsmb Supplementary Figure 1. Differential expression of mirnas from the pri-mir-17-92a locus.
 Supplementary Figure 1 Differential expression of mirnas from the pri-mir-17-92a locus. (a) The mir-17-92a expression unit in the third intron of the host mir-17hg transcript. (b,c) Impact of knockdown
Expanded View Figures
 MO reports PR3 dephosphorylates TZ Xian-o Lv et al xpanded View igures igure V1. PR3 dephosphorylates and inactivates YP/TZ., Overexpression of tight junction proteins Pals1 () or LIN7 () has no effect
CHARACTERIZATION OF BIOLOGICAL FUNCTION OF INTERACTION BETWEEN TLR4 AND PLIC-1. Nabanita Biswas. BSc, Calcutta University. MSc, Calcutta University
 CHARACTERIZATION OF BIOLOGICAL FUNCTION OF INTERACTION BETWEEN TLR4 AND PLIC-1 by Nabanita Biswas BSc, Calcutta University MSc, Calcutta University Submitted to the Graduate Faculty of Graduate School