Suicide Facts. Deaths and intentional self-harm hospitalisations
|
|
|
- Shanon Gilmore
- 6 years ago
- Views:
Transcription
1 Suicide Facts Deaths and intentional self-harm hospitalisations 2012
 HP 6165 This document is available")
2 Citation: Ministry of Health Suicide Facts: Deaths and intentional self-harm hospitalisations Wellington: Ministry of Health. Published in May 2015 by the Ministry of Health PO Box 5013, Wellington 6145, New Zealand ISBN: (online) HP 6165 This document is available at
3 Contents Key points Suicide 2012 Intentional self-harm hospitalisations 2012 vii vii viii Introduction 1 Overview 1 Suicide deaths 2 Intentional self-harm hospitalisations 3 Data presentation 4 Suicide deaths in Age 8 Ethnicity 15 Deprivation 22 Urban and rural suicide rates 24 District health board region 26 Methods of suicide 29 International comparisons 34 Intentional self-harm hospitalisations in Overview 36 Sex 37 Age 38 Ethnicity 41 Deprivation 48 District health board regions 50 References 54 Appendices 55 Appendix 1: Technical notes 55 Appendix 2: Definitions 57 Appendix 3: Further tables 62 Further information 64 Suicide Facts: Deaths and intentional self-harm hospitalisations 2012 iii
4 List of Tables Table 1: Suicide deaths and age-standardised rates, by sex, Table 2: Suicide deaths, age-specific rates and suicides as a percentage of all deaths, by five-year age group and sex, Table 3: Age-specific suicide rates, by life-stage age group, Table 4: Youth suicide age-specific rates, ages years, by sex, Table 5: Suicide deaths, by ethnicity, life-stage group and sex, Table 6: Suicide deaths and age-standardised rates, Māori and non-māori, by sex, Table 7: Youth suicide deaths and age-specific rates, Māori and non-māori, by sex, Table 8: Suicide deaths and age-standardised rates, by deprivation quintile and sex, Table 9: Suicide deaths and rates, by urban/rural profile, life-stage age group and sex, Table 10: Suicide age-standardised deaths, by DHB regions, Table 11: Methods used for suicide deaths, Table 12: Intentional self-harm hospitalisation numbers and age-standardised rates, by sex, Table 13: Intentional self-harm hospitalisation numbers and rates, by sex and five-year age group, Table 14: Youth intentional self-harm hospitalisation numbers and age-specific rates, by sex, Table 15: Intentional self-harm hospitalisation numbers and rates, by ethnicity and sex, Table 16: Intentional self-harm hospitalisations, by ethnicity, life-stage age group and sex, Table 17: Youth intentional self-harm hospitalisation numbers and age-specific rates, Māori and non-māori, by sex, Table 18: Intentional self-harm hospitalisation numbers and age-standardised rates, by deprivation quintile and sex, Table 19: Intentional self-harm hospitalisation age-standardised rates, by DHB of domicile and sex, Table A1: Intentional self-harm categories and ICD-10-AM codes 57 Table A2: The WHO World Standard Population 58 Table A3: Intentional self-harm short-stay emergency department hospitalisations, by DHB of domicile, Table A4: Intentional self-harm hospitalisations within two days of a previous intentional self-harm hospitalisation, by DHB of domicile, iv Suicide Facts: Deaths and intentional self-harm hospitalisations 2012
5 List of Figures Figure 1: Suicide age-standardised rates, Figure 2: Suicide age-standardised rates, by sex, Figure 3: Suicide as a percentage of all deaths, by age group and sex, Figure 4: Age-specific suicide rates, by five-year age group and sex, Figure 5: Age-specific suicide rates, by life-stage age group, Figure 6: Age-specific suicide rates for youth, ages years, by sex, Figure 7: Age-specific suicide rates, ages years, by sex, Figure 8: Age-specific suicide rates, ages years, by sex, Figure 9: Age-specific suicide rates, ages 65 years and over, by sex, Figure 10: Suicide rates, by ethnic group, Figure 11: Age-standardised suicide rates, Māori and non-māori, Figure 12: Age-standardised suicide rates, Māori and non-māori, by sex, Figure 13: Youth age-specific suicide rates, by ethnic group, Figure 14: Youth age-specific suicide rates, by ethnic group and sex, Figure 15: Age-standardised suicide rates, by deprivation quintile, Figure 16: Age-standardised suicide rates, by deprivation quintile and sex, Figure 17: Suicides by deprivation quintile and life-stage age group, Figure 18: Suicide rates, by urban/rural profile and sex, Figure 19: Suicide rates, by urban/rural profile and life-stage age group, Figure 20: Age-standardised suicide rates, by DHB regions, Figure 21: Youth age-specific suicide rates, by DHB regions, Figure 22: Comparison of DHB region suicide rates with the national rate, Figure 23: Methods used for suicide deaths, by sex, Figure 24: Methods used for suicide deaths, Figure 25: Methods used for suicide deaths, by sex and life-stage age group, Figure 26: Suicide age-standardised rates for OECD countries, by sex 34 Figure 27: Youth (15 24 years) suicide age-specific rates for OECD countries, by sex 35 Figure 28: Intentional self-harm hospitalisation age-standardised rates, Figure 29: Intentional self-harm hospitalisation age-standardised rates, by sex, Figure 30: Intentional self-harm hospitalisation age-specific rates, by age group and sex, Figure 31: Youth (15 24 years) intentional self-harm hospitalisation age-specific rates, by sex, Figure 32: Intentional self-harm hospitalisation age-standardised rates, by ethnic group, Figure 33: Intentional self-harm hospitalisation age-standardised rates, Māori and non- Māori, Suicide Facts: Deaths and intentional self-harm hospitalisations 2012 v
6 Figure 34: Intentional self-harm hospitalisation age-standardised rates for Māori and non-māori, by sex, Figure 35: Youth intentional self-harm hospitalisation age-specific rates, by ethnic group, Figure 36: Youth intentional self-harm hospitalisation age-specific rates, by ethnic group and sex, Figure 37: Intentional self-harm hospitalisation age-standardised rates, by deprivation quintile and sex, Figure 38: Intentional self-harm hospitalisation age-standardised rates, by DHB, Figure 39: Comparison of DHB region intentional self-harm hospitalisation rates with national rate, Figure 40: Intentional self-harm hospitalisation age-standardised rates for males, by DHB and ethnic group, (aggregated data) 52 Figure 41: Intentional self-harm hospitalisation age-standardised rates for females, by DHB and ethnic group, (aggregated data) 53 vi Suicide Facts: Deaths and intentional self-harm hospitalisations 2012
7 Key points Suicide 2012 Overview A total of 549 people died by suicide in New Zealand in Almost 75% of these suicides were male. The age-standardised suicide rate decreased by 19.5% from the peak rate of 15.1 deaths per 100,000 population in 1998 to 12.2 deaths per 100,000 population in Sex There were 404 male suicides (18.1 per 100,000 males) and 145 female suicides (6.4 per 100,000 females) in For every female suicide, there were 2.8 male suicides. Since 1948, the suicide rate for females has remained relatively stable. The male suicide rate for 2012 was 24.3% lower than its highest rate in Age The highest rate of suicide in 2012 was in the youth age group (15 24 years) at 23.4 per 100,000 youths. Suicide rates decreased with age: the suicide rate for adults aged years was 15.8 per 100,000 adults in that age group; the rate decreased to 12.9 per 100,000 adults aged years. Adults aged 65 years and over had the lowest suicide rate (9.3 per 100,000 adults aged 65+ years). Youth (15 24 years) In 2012, there were 107 male and 43 female youth suicides (32.3 and 13.8 per 100,000 males and females respectively). The Māori youth suicide rate was 2.8 times the non-māori youth rate (48.0 per 100,000 Māori youths compared with 17.3 per 100,000 non-māori youths). Over the 10 years from 2003 to 2012, Māori youth suicide rates have been at least 1.7 times the non-māori youth suicide rates. Ethnicity There were 120 Māori and 429 non-māori suicide deaths in Māori had an age-standardised suicide rate of 17.8 per 100,000 Māori, compared with the non-māori rate of 10.6 per 100,000 non-māori. There were 30 suicide deaths among Pacific people and 23 among Asian people. Over the 10 years from 2003 to 2012, Māori suicide rates have been at least 1.2 times non- Māori suicide rates. Suicide Facts: Deaths and intentional self-harm hospitalisations 2012 vii
8 Deprivation In 2012, the suicide rate was highest among those who resided in deprivation quintile 4 and lowest in quintile 1 (14.0 per 100,000 quintile 4 population compared with 6.6 per 100,000 quintile 1 population). Suicide rates in both quintile 1 and 2 were significantly lower than suicide rates for those residing in quintiles 3 5. Urban/rural profile The suicide rate was 14.6 per 100,000 population in rural areas and 12.0 per 100,000 population in urban areas. District health board (DHB) region Based on aggregated data for the five-year period , Bay of Plenty, South Canterbury and Southern DHBs had significantly higher suicide rates than the national rate. Waitemata, Auckland and Capital & Coast DHB regions had significantly lower suicide rates than the national rate. Intentional self-harm hospitalisations 2012 Overview There were 3031 intentional self-harm hospitalisations in New Zealand in Two-thirds of these were female. Over the 10-year period , the rate of self-harm hospitalisations decreased by 11.5% from 80.3 per 100,000 population in 2003 to 71.0 per 100,000 population in Sex In 2012, the female rate of intentional self-harm hospitalisation was more than twice the male rate (96.1 per 100,000 females compared with 46.4 per 100,000 males). Between 2003 and 2012, the female rate of intentional self-harm hospitalisation remained at least 1.7 times the male rate. Age In 2012, the highest rate of intentional self-harm hospitalisations for both males and females was in the years age group (103.1 per 100, years males and per 100, years females). Female rates were significantly higher than male rates for all five-year age groups except in those aged 75+ years, where they were significantly lower. Youth (15 24 years) Youth accounted for 34.7% (1052) of all intentional self-harm hospitalisations in The female rate of intentional self-harm hospitalisations was 2.4 times the male rate (233.7 per 100,000 females and 98.4 per 100,000 males). Ethnicity In 2012, Māori accounted for nearly 20% (563) of all intentional self-harm hospitalisations. viii Suicide Facts: Deaths and intentional self-harm hospitalisations 2012
9 The age-standardised rate for Māori was 85.0 per 100,000 Māori compared with 68.0 per 100,000 non-māori. There were 101 intentional self-harm hospitalisations of Pacific people and 97 of Asian people. Deprivation In 2012, intentional self-harm hospitalisation rates generally increased with deprivation; the highest rate was in those residing in deprivation quintile 4 and the lowest in quintile 1 (90.9 per 100,000 quintile 4 population compared with 49.6 per 100,000 quintile 1 population). For both males and females, rates in the least deprived quintile (1) were significantly lower than rates in more deprived quintiles (3 5). District health board (DHB) region Based on aggregated data from , eight DHBS had significantly higher rates of intentional self-harm hospitalisations than the national rate in Wairarapa DHB region had the highest age-standardised rate of intentional self-harm hospitalisations (169.0 per 100,000 population). Auckland, Counties Manukau, Hawke s Bay and MidCentral DHB regions had significantly lower rates of intentional self-harm hospitalisations than the national rate. Suicide Facts: Deaths and intentional self-harm hospitalisations 2012 ix
10
11 Introduction Suicide and suicidal behaviours continue to be a major public health issue in New Zealand. Every year more than 500 New Zealanders take their lives and there are over 2,500 admissions 1 to hospital for serious self-harm. These are not just numbers; they may be our friends, our neighbours, our work colleagues or our family members. Every suicide or act of intentional selfharm is an indication of profound emotional distress. The impact on family, friends and communities can be devastating, far reaching and long lasting. But suicide is preventable. The purpose of this report is to present numbers, trends and demographic profiles of people who die by suicide or seriously harm themselves. Understanding this data is important for policy makers, clinicians and others who work to prevent suicide and intentional self-harm. It is important to recognise that the motivation for intentional self-harm varies, and therefore hospitalisation data for self-harm is not a measure of suicide attempts. Although this report provides statistical suicide and intentional self-harm hospitalisation data, it does not attempt to explain causes of suicidal behaviour or causes of changes to suicide or intentional self-harm hospitalisation rates. Nor does it discuss measures to reduce suicide or intentional self-harm. Numerous factors influence a person s decision to take their own life or to self-harm. The number of suicides and self-harm hospitalisations can also vary considerably from year to year. It is therefore difficult to quantify the precise effect that programmes such as suicide prevention-related initiatives and significant events, for instance the 2010 and 2011 earthquakes in the Canterbury region, have on suicide and suicidal behaviour. Suicide prevention in New Zealand is guided by the New Zealand Suicide Prevention Strategy (Associate Minister of Health 2006) and the New Zealand Suicide Prevention Action Plan (Ministry of Health 2013). Suicide Facts and other annual data updates assist in monitoring and evaluating the progress and success of implementing the strategy and action plan. Overview This report presents suicide data by sex, age (including in specific regard to youth aged years), ethnicity, deprivation quintile, district health board (DHB) region of domicile and urban/rural profile. It also provides some international comparisons. Intentional self-harm hospitalisation data is presented by sex, age (including in specific regard to youth aged years), ethnicity, deprivation quintile and DHB region of domicile. Definitions of these terms are provided in Appendix 2: Definitions. The online tables that accompany this report provide the underlying data for some graphs presented in the report as well as time-series data. 1 See Appendix 2: Definitions for an explanation of the term admission. Suicide Facts: Deaths and intentional self-harm hospitalisations
12 Suicide deaths Data sources All New Zealand suicide data in this report was extracted from the Ministry of Health s Mortality Collection (MORT) on 1 October The data for other Organisation for Economic Co-operation and Development (OECD) countries was sourced from the OECD. MORT contains data on all deaths registered in New Zealand. Death and stillbirth registration data is sent electronically to MORT monthly from Births, Deaths, Marriages and Citizenship. In addition, the Ministry receives medical certificates of causes of death (completed by certifying doctors) from funeral directors, as well as coronial findings relating to deaths from Coronial Services of New Zealand (Ministry of Justice). Each death is then assigned an underlying cause of death code by the Ministry of Health, using the International Statistical Classification of Diseases and Related Health Problems, 10th Revision, Australian Modification (ICD-10-AM), sixth Edition (National Centre for Classification in Health 2008). Classification of a suicide death In New Zealand, a death is only officially classified as suicide by the coroner on completion of the coroner s inquiry. In some cases, an inquest may be heard several years after the death, particularly if there are factors relating to the death that need to be investigated first (for example, a death in custody). Consequently, a provisional suicide classification may be made before the coroner reaches a verdict. The 2012 suicide data used in this report is provisional. There were 14 deaths registered in 2012 that were still subject to coroners findings with no provisional cause of death assigned to them at the time of data extraction (1 October 2014). Although these deaths are not included in this report, some may later be classified as suicide. For this reason, the number of provisionally classified deaths from suicide in 2012 presented in this report may differ slightly from the number, for the same year, presented in future reports, when the data has been finalised. The Ministry will release the final data in the publication Mortality and Demographic Data The suicide data in this report is based on deaths that were registered in 2012 with Births, Deaths, Marriages and Citizenship. While most deaths are registered in the year in which the death occurred, a few deaths (approximately 2%) are registered in later years. Comparisons with other statistical publications on suicide The number of suicide deaths in this report differs from the number released by the Chief Coroner. The Chief Coroner s data includes all deaths initially identified at the coroner s office as self-inflicted. However, only those deaths determined as intentional after investigation will receive a final verdict of suicide. Some deaths provisionally coded as suicide may later be determined not to be suicide. The Ministry reports on those deaths determined to be suicide after a completed coronial process or those provisionally coded as intentionally self-inflicted deaths before the final coroner s verdict. Furthermore, the Chief Coroner s data relates to years ending 30 June rather than the calendar years used in this report. 2 Suicide Facts: Deaths and intentional self-harm hospitalisations 2012
13 The Office of the Director of Mental Health releases an annual report that contains some statistics on suicide that are not included in this report: The data-filtering methods used in this report mean that the hospital data in this publication cannot be compared with versions of this series preceding the 2006 report. Intentional self-harm hospitalisations Data source Intentional self-harm hospitalisation data presented in this report was extracted from the Ministry s National Minimum Dataset (NMDS) on 1 October The NMDS is a national collection of public and private hospital discharge information, including clinical information, for inpatients and day patients. The NMDS is used for policy formation, performance monitoring, research and review. It provides statistical information, reports and analyses of trends in delivering hospital inpatient and day patient health services both nationally and on a provider basis. It is also used for funding purposes. Data has been submitted electronically in an agreed format by public hospitals since Data exclusions For data comparability purposes, the total number of self-harm hospitalisations excludes two categories of patients: 1. Patients discharged from an emergency department after a length of stay of one day or less (Appendix 3, Table A3). It is evident from Table A3 that these events were reported very differently across the individual DHBs between 2003 and Patients admitted for an intentional self-harm incident within two days of a previous intentional self-harm hospitalisation (Appendix 3, Table A4). It is not unusual for patients to be transferred between hospitals after an intentional self-harm event. DHBs record these transfers as new admissions. Such admissions usually occur within two days of a previous hospitalisation discharge, thereby artificially inflating the numbers of recorded admissions. These exclusions allow the best possible identification of real trends in intentional self-harm behaviour within the New Zealand population, as well as optimal regional comparisons given that DHBs differ in admission practices, which results in differences in the data reported. The Ministry is endeavouring to address inconsistencies in data collection; however, filtering cannot completely eliminate differences caused by different methods of managing patients and keeping records. Therefore the intentional self-harm hospitalisations data in this report does not represent the total number of people receiving hospital treatment for intentional self-harm or treatment events. Even once consistency issues between DHBs have been addressed, the total extent of intentional self-harm will still be difficult to capture because many people who intentionally self-harm do not seek hospital treatment. Suicide Facts: Deaths and intentional self-harm hospitalisations
14 It is important to note that hospitalisations for intentional self-harm represent individual events of self-harm rather than individual people; that is, a single person can contribute multiple unique intentional self-harm events to the data set or be hospitalised more than once for the same self-harm event. Data presentation Numbers and rates Data is presented primarily as numbers and rates. Two rates are presented: age-specific and age-standardised. Age-specific rates are calculated to measure the frequency of suicide or selfharm hospitalisation for specific age groups (eg, five-year age group and life-stage age group). Age-standardised rates are calculated to measure the frequency of suicide or self-harm hospitalisations in a group and are adjusted to take account of differences in age distribution of the population over time or between groups. Rates for specific groups (eg, Māori, residents of quintile 3, females, and populations in DHB regions) are calculated using the best available population for that specific group. More information about populations used in this report can be found in Appendix 1: Technical notes. All percentage calculations comparing numbers or rates between years have been undertaken using the raw data. Due to rounding, this may mean the resultant information is slightly different to any calculations based on tabular data supplied in this report. Time trends Publication Suicide data is presented either from 1948 to 2012 (comparable data first became available in 1948) or from 2003 to 2012 (to provide a 10-year time trend). Where Asian age-standardised rates are presented, the data is restricted to 2008 to Intentional self-harm hospitalisation data is presented from 2003 to 2012 to provide a 10-year time trend. Online tables The accompanying suicide tables include data from 1948 to 2012 for major breakdowns and from 1996 to 2012 for Māori and non-māori breakdowns. Intentional self-harm hospitalisation data is presented from 1996 to Hospitalisation data can only be compared consistently back to 1996 because of changes in the recording and reporting of ethnicity data from July District health board region Age-standardised rates were calculated for each district health board (DHB) region of domicile. The suicide data for DHB regions was aggregated over five years ( ), and the intentional self-harm hospitalisation data was aggregated over three years ( ) since rates can vary considerably from year to year for each DHB. When interpreting regional differences in hospitalisation rates for intentional self-harm among DHBs, it should be noted that DHBs differ in their reporting and patient management practices. 4 Suicide Facts: Deaths and intentional self-harm hospitalisations 2012
15 The figures also provide 99% confidence intervals to aid interpretation. Where a DHB region s confidence interval crosses the national rate, this means that the DHB region s suicide or intentional self-harm hospitalisation rate was not statistically significantly different from the national rate. Previous versions of Suicide Facts presented information on Southland and Otago DHBs. In 2010, these merged to form Southern DHB, therefore Suicide Facts 2012 presents information for Southern DHB. Suicide Facts: Deaths and intentional self-harm hospitalisations
16 Suicide deaths in 2012 A total of 549 people died in New Zealand by suicide in This equates to an agestandardised rate of 12.2 suicide deaths per 100,000 population (Table 1). Comparable data first became available in Since then, the suicide rate for the whole population reached its highest in The rate generally declined between 1998 and 2012, decreasing overall by 19.5% (Figure 1). Sex In 2012, a total of 404 males and 145 females died by suicide, which equates to rates of 18.1 deaths per 100,000 male population and 6.4 deaths per 100,000 female population. Since records began in 1948, the female rate has remained relatively unchanged, but the male rate has fluctuated. In 2012, the male rate was 24.3% lower than its highest rate in Over time, the male suicide rate has been consistently higher than the female suicide rate; in 2012, there were 2.8 male suicides for every female suicide (Table 1, Figure 2). Groups with high suicide rates In 2012 markedly higher rates of suicide were recorded in males, particularly youth (aged years) and those aged years, and Māori (compared with non-māori). Māori males and Māori youth showed especially high suicide rates. Further data for these groups is presented in later sections of this report. Table 1: Suicide deaths and age-standardised rates, by sex, Year Male Female Total Sex rate ratio (Male:Female) Number Rate Number Rate Number Rate Source: New Zealand Mortality Collection Note: rates are expressed per 100,000 population and age-standardised to the World Health Organization (WHO) World Standard population. 1 Provisional (see Appendix 2: Definitions). 6 Suicide Facts: Deaths and intentional self-harm hospitalisations 2012

17 Figure 1: Suicide age-standardised rates, Source: New Zealand Mortality Collection Note: rates are expressed per 100,000 population and age-standardised to the WHO World Standard population. Figure 2: Suicide age-standardised rates, by sex, Source: New Zealand Mortality Collection Note: rates are expressed per 100,000 population and age-standardised to the WHO World Standard population. Suicide Facts: Deaths and intentional self-harm hospitalisations
.")
18 Age This section focuses on suicides by five-year age groups for 2012 and broader life-stage age groups to show trends over time. Suicide accounted for 1.8% of all deaths in Suicide was the cause of death for about 45% of males and females aged years. Approximately one in three deaths in males and females aged 5 24 years were due to suicide in 2012 (Figure 3). Figure 3: Suicide as a percentage of all deaths, by age group and sex, 2012 Source: New Zealand Mortality Collection 8 Suicide Facts: Deaths and intentional self-harm hospitalisations 2012
.")
19 Suicide by five-year age group Males had higher rates of suicide than females for every age group. The highest rates for males were for those aged and years. The highest rate for females was in those aged years (Figure 4, Table 2). Figure 4: Age-specific suicide rates, by five-year age group and sex, 2012 Source: New Zealand Mortality Collection Notes: Rates are expressed as deaths per 100,000 population. 95% confidence intervals. Suicide Facts: Deaths and intentional self-harm hospitalisations
20 Table 2: Suicide deaths, age-specific rates and suicides as a percentage of all deaths, by five-year age group and sex, 2012 Age group (years) Number Male Female Total Rate % of all deaths Number Rate % of all deaths Number Rate % of all deaths Total Source: New Zealand Mortality Collection Notes: Rates are expressed as deaths per 100,000 population. Percentages are calculated using provisional 2012 mortality data. Suicide by life-stage age group This section focuses on suicide deaths by four life-stage age groups: years (youth), years, years and 65 years and over. In 2012, the suicide rate decreased with age. Youth (15 24 years) had the highest suicide rate of 23.4 per 100,000 population, and those aged 65 years and over had the lowest suicide rate represented at 9.3 per 100,000 population (Table 3). New Zealand s suicide rates by life-stage group have varied over time. In 1948, the differences between the four life-stage age groups were distinct, with the suicide rate increasing with age. By the early 1990s, this trend had almost reversed, with youth showing the highest rates of suicide and those aged 65 years and over having the lowest rates. In more recent years, those aged 65 years and over have continued to show the lowest rates, while rates for those aged between 25 and 64 years have started to converge (Figure 5). 10 Suicide Facts: Deaths and intentional self-harm hospitalisations 2012
21 Table 3: Age-specific suicide rates, by life-stage age group, 2012 Age group (years) Male Female Total Number Rate Number Rate Number Rate Source: New Zealand Mortality Collection Note: rates are expressed as deaths per 100,000 population. Figure 5: Age-specific suicide rates, by life-stage age group, Source: New Zealand Mortality Collection Notes: Rates are expressed as deaths per 100,000 population. Rates have not been provided for the 0 4 and 5 14 years age groups because the small number of deaths by suicide in these age groups makes it difficult to draw meaningful conclusions about changes over time. Youth aged years In 2012, the youth suicide rate was 23.4 deaths per 100,000 population aged years (Table 3). Rates were significantly higher among male youth than female youth; in 2012, the male youth suicide rate was nearly 2.3 times that of the female youth suicide rate (32.3 per 100,000 males compared with 13.8 per 100,000 females) (Table 4). Suicide was the most common cause of death for youth (150 deaths), accounting for over onethird of all youth deaths in 2012 (37.4% of all male youth deaths and 31.9% of female youth deaths). 2 The next most common cause of death for this age group was motor vehicle accidents (70 deaths). This equates to youth mortality rates of 23.4 per 100,000 for suicide and 10.9 per 100,000 for motor vehicle accidents. 2 These percentages have been calculated from unpublished provisional New Zealand Mortality Collection 2012 data. Suicide Facts: Deaths and intentional self-harm hospitalisations

22 The youth suicide rate has decreased since its peak in In 2012, the youth rate was 18.6% lower than in 1995 (Figure 5). Male youth suicide rates began to rise noticeably in the early 1970s, then rose sharply from the mid-1980s, reaching a peak of 44.1 suicides per 100,000 population in Since then, the rate has trended downwards; the 2012 rate was 26.7% lower than the peak in Female youth suicide rates also showed a general increase over time and peaked in The rates have remained variable since then (Figure 6). Table 4: Youth suicide age-specific rates, ages years, by sex, Year Male Female Total Number Rate Number Rate Number Rate Source: New Zealand Mortality Collection Notes: rates are expressed as deaths per 100,000 population. 1 Provisional (see Appendix 2: Definitions). Figure 6: Age-specific suicide rates for youth, ages years, by sex, Source: New Zealand Mortality Collection Note: rates are expressed as deaths per 100,000 population. 12 Suicide Facts: Deaths and intentional self-harm hospitalisations 2012
. Since the peak in 1997, suicide rates for males aged 25 44 years have fallen by 29.3%.")
23 Adults aged years In 2012, the suicide rate for adults aged years was 15.8 per 100,000 population in this age group. The male rate was 25.0 per 100,000 males in this age group, which was 3.5 times the female rate of 7.1 per 100,000 (Table 3). Since the peak in 1997, suicide rates for males aged years have fallen by 29.3%. In contrast, the female rate has remained relatively constant since official records began in 1948 (Figure 7). Figure 7: Age-specific suicide rates, ages years, by sex, Source: New Zealand Mortality Collection Note: rates are expressed as deaths per 100,000 population. Adults aged years In 2012, the suicide rate for adults aged years was 12.9 per 100,000 population in this age group. The male and female rates were 19.3 and 6.8 per 100,000 population in this age group respectively (Table 3). Over time, suicide rates for males aged years have remained variable, although an overall downward trend is evident with a decrease of 35.4% between 1948 and Female rates for this age group were variable between 1948 and 1994, after which rates were more stable (Figure 8). Suicide Facts: Deaths and intentional self-harm hospitalisations
.")

24 Figure 8: Age-specific suicide rates, ages years, by sex, Source: New Zealand Mortality Collection Note: rates are expressed as deaths per 100,000 population. Adults aged 65 years and over In 2012, the suicide rate for those aged 65 years and over was the lowest of the four life-stage age groups, with 9.3 per 100,000 population in this age group (Table 3). The rate has decreased by 67.9% since its highest rate in 1950 (Figure 5). The 2012 male and female rates were 15.0 and 4.5 per 100,000 population in this age group respectively (Table 3). The male rate was variable between 1948 and 2012, although a substantial downward trend was evident with a decrease of 71.3% from the peak rate in The female rate also showed a downward trend, falling by 75.5% between 1967 (when it peaked) and 2012 (Figure 9). Figure 9: Age-specific suicide rates, ages 65 years and over, by sex, Source: New Zealand Mortality Collection Note: rates are expressed as deaths per 100,000 population. 14 Suicide Facts: Deaths and intentional self-harm hospitalisations 2012
25 Ethnicity Overview There were 120 Māori suicides in 2012, accounting for 21.9% of all suicide deaths (17.8 per 100,000 population). There were 429 non-māori suicide deaths (10.6 per 100,000 population). Non-Māori suicides comprised 30 Pacific people, 23 Asian and 376 European & Other (Table 5). There were 287 European & Other male suicides and 89 female suicides in There were 20 male and 10 female suicide deaths among Pacific people and 14 male and 9 female suicide deaths among Asian people in It is difficult to draw conclusions about changes in suicide rates over time for different ethnic groups; not only are the numbers of suicides in certain ethnic groups small, but also the population of Asian people in New Zealand increased markedly between 1996 and Age-standardised rates for the ethnic group breakdown of Māori, Pacific peoples, Asian and European & Other were calculated for the five years The small number of Pacific peoples and Asian suicides means rates are variable, and any trends should be interpreted cautiously (Figure 10). Table 5: Suicide deaths, by ethnicity, life-stage group and sex, 2012 Ethnicity Sex Life-stage age group Rate < Total Māori Male Female Total Pacific peoples Male Female Total Asian Male Female Total European & Other Male Female Total All ethnicities Male Female Total Source: New Zealand Mortality Collection Note: rates are expressed per 100,000 population and are age-standardised to the WHO World Standard population. Suicide Facts: Deaths and intentional self-harm hospitalisations

26 Figure 10: Suicide rates, by ethnic group, Source: New Zealand Mortality Collection Note: rates are expressed per 100,000 population and are age-standardised to the WHO World Standard population. Māori and non-māori comparison In 2012, the age-standardised suicide rate for Māori was 1.7 times higher than that for non- Māori (17.8 per 100,000 Māori population compared with 10.6 per 100,000 non-māori population) (Table 6). Over the 10-year period from 2003 to 2012, Māori suicide rates were variable but were at least 1.2 times the suicide rate for non-māori. The non-māori suicide rates were generally stable over the same period (Figure 11). Sex The rate of suicide for Māori males was 25.6 per 100,000 population in 2012, compared with 16.3 per 100,000 for non-māori males. The rate ratio of Māori male suicides to non-māori male suicides was 1.6 to 1. Māori females had double the suicide rate for non-māori females in 2012 (10.5 per 100,000 compared with 5.2 per 100,000) (Table 6). Between 2003 and 2012, Māori male suicide rates were highly variable, while Māori female suicide rates trended upward slightly. Non-Māori male and female suicide rates were relatively stable (Figure 12). 16 Suicide Facts: Deaths and intentional self-harm hospitalisations 2012
27 Table 6: Suicide deaths and age-standardised rates, Māori and non-māori, by sex, Year Māori Non-Māori Rate ratio Male Female Total Male Female Total Māori:non-Māori Number Rate Number Rate Number Rate Number Rate Number Rate Number Rate Male Female Total Source: New Zealand Mortality Collection Notes: rates are expressed per 100,000 population and are age-standardised to the WHO World Standard population. 1 Provisional Suicide Facts: Deaths and intentional self-harm hospitalisations


28 Figure 11: Age-standardised suicide rates, Māori and non-māori, Source: New Zealand Mortality Collection Note: rates are expressed per 100,000 population and are age-standardised to the WHO World Standard population. Figure 12: Age-standardised suicide rates, Māori and non-māori, by sex, Source: New Zealand Mortality Collection Note: rates are expressed per 100,000 population and are age-standardised to the WHO World Standard population. 18 Suicide Facts: Deaths and intentional self-harm hospitalisations 2012
29 Māori and non-māori comparison among youth (15 24 years) In 2012, the Māori youth suicide rate was 2.8 times the rate for non-māori youth (48.0 per 100,000 Māori youth population compared with 17.3 per 100,000 non-māori youth population) (Table 7). This is the greatest difference between Māori and non-māori youth in the 10 years from Over those 10 years, total Māori youth suicide rates were consistently higher (at least 1.7 times) than total non-māori youth suicide rates (Figure 13). By sex, Māori male and female suicide rates were also consistently higher than non-māori male and female suicide rates respectively over the same period (Figure 14). Suicide Facts: Deaths and intentional self-harm hospitalisations
30 Table 7: Youth suicide deaths and age-specific rates, Māori and non-māori, by sex, Year Māori Non-Māori Rate ratio Male Female Total Male Female Total Māori:non-Māori Number Rate Number Rate Number Rate Number Rate Number Rate Number Rate Male Female Total Source: New Zealand Mortality Collection Notes: rates are expressed as deaths per 100,000 population. 1 Provisional 20 Suicide Facts: Deaths and intentional self-harm hospitalisations 2012


31 Figure 13: Youth age-specific suicide rates, by ethnic group, Source: New Zealand Mortality Collection Note: rates are expressed as deaths per 100,000 population. Figure 14: Youth age-specific suicide rates, by ethnic group and sex, Source: New Zealand Mortality Collection Note: rates are expressed as deaths per 100,000 population. Suicide Facts: Deaths and intentional self-harm hospitalisations
32 Deprivation Deprivation quintiles are used to represent the level of deprivation of the area of residence. Deprivation quintile 1 represents the least deprived and quintile 5 represents the most deprived, according to the New Zealand Deprivation Index 2006 (NZDep 2006). In 2012, the suicide rate was highest among those who resided in deprivation quintile 4 (16.2 per 100,000), followed by quintile 3 (15.0 per 100,000). The lowest suicide rate was seen among those who resided in the least deprived quintile, quintile 1 (6.6 per 100,000) (Table 8). Suicide rates in both quintiles 1 and 2 were significantly lower than suicide rates in quintiles 3 5 (Figure 15). When separated by sex for each deprivation quintile, female suicide rates increased with the level of deprivation. Male suicide rates were the highest in quintiles 3 and 4, which were both significantly higher than the male suicide rates in quintiles 1 and 2 (Figure 16). The relationship between deprivation level and suicide is more apparent in the youth population when suicides by life-stage age group are presented by deprivation quintile. For youth aged years, there were at least 3.5 times the number of suicides in deprivation quintiles 3 5 compared with quintiles 1 and 2. The same trend was not seen in older age groups (Figure 17). Table 8: Suicide deaths and age-standardised rates, by deprivation quintile and sex, 2012 Deprivation quintile Male Female Total Number Rate Number Rate Number Rate 1 (least deprived) (most deprived) Source: New Zealand Mortality Collection Notes: Rates are expressed per 100,000 population and are age-standardised to the WHO World Standard population. There were two suicide deaths unable to be assigned a deprivation score. 22 Suicide Facts: Deaths and intentional self-harm hospitalisations 2012


33 Figure 15: Age-standardised suicide rates, by deprivation quintile, 2012 Source: New Zealand Mortality Collection Note: rates are expressed per 100,000 population and age-standardised to the WHO World Standard population. Figure 16: Age-standardised suicide rates, by deprivation quintile and sex, 2012 Source: New Zealand Mortality Collection Note: rates are expressed per 100,000 population and age-standardised to the WHO World Standard population. Suicide Facts: Deaths and intentional self-harm hospitalisations


.")
34 Figure 17: Suicides by deprivation quintile and life-stage age group, 2012 Source: New Zealand Mortality Collection Note: rates are expressed per 100,000 population and age-standardised to the WHO World Standard population. Urban and rural suicide rates The suicide rate for those residing in rural areas was 14.6 per 100,000 population compared with 12.0 per 100,000 population for those living in urban areas. This difference was not statistically significant. In all, 15.8% of people who died by suicide lived in rural areas. Sex In both rural and urban areas, males had a significantly higher rate of suicide than females. For males and females, the suicide rate was higher in rural areas than urban areas. Neither of these differences was statistically significant (Figure 18). Figure 18: Suicide rates, by urban/rural profile and sex, 2012 Source: New Zealand Mortality Collection Note: rates are expressed per 100,000 population and age-standardised to the WHO World Standard population. 24 Suicide Facts: Deaths and intentional self-harm hospitalisations 2012
.")
, although this was not significantly different from any of the male rural rates for other age groups, or from the urban rate for males aged 15 24 years (Table 9).")
35 Life-stage age group The highest rate of suicide was seen in the years life-stage age group in both rural and urban areas. The rural rates of suicide were higher than the urban rates for all life-stage age groups except for those aged 65 years and over (Figure 19). The life-stage age group with the highest rural rate of suicide was males aged years (29.1 per 100,000), although this was not significantly different from any of the male rural rates for other age groups, or from the urban rate for males aged years (Table 9). Figure 19: Suicide rates, by urban/rural profile and life-stage age group, 2012 Source: New Zealand Mortality Collection Note: rates are expressed per 100,000 population and age-standardised to the WHO World Standard population. Table 9: Suicide deaths and rates, by urban/rural profile, life-stage age group and sex, 2012 Number Life-stage age group Rate Life-stage age group Total Total Urban Male Female Total Rural Male Female Total Total Source: New Zealand Mortality Collection Notes: There were three suicide deaths whose meshblock was unable to be assigned an urban/rural classification. Rates are age-specific, expressed as deaths per 100,000 population. The total suicide rate is expressed per 100,000 population and age-standardised to the WHO World Standard population. Suicide Facts: Deaths and intentional self-harm hospitalisations
36 District health board region This section presents the rates of suicide, aggregated over a five-year period ( ), for each DHB. Rates have been aggregated as some DHBs have a very small number of suicide deaths each year. Raw numbers are not presented as the size of the population varies widely across DHBs and comparing raw numbers of suicide deaths across DHBs can be misleading. The average number of suicides per DHB over the period can be found in the online tables that accompany this report. All ages For this period, the national suicide rate was 11.6 deaths per 100,000 population (Table 10). Three DHB regions had significantly higher suicide rates than the national suicide rate: Bay of Plenty, South Canterbury and Southern, and three had significantly lower suicide rates than the national rate: Waitemata, Auckland and Capital & Coast DHB regions (Figures 20 and 22). Youth (15 24 years) The national youth suicide rate was 19.8 suicides per 100,000 youth population (Table 10). South Canterbury DHB was the only DHB region with a significantly higher youth suicide rate than the national youth suicide rate. Waitemata and Capital & Coast DHBs had significantly lower suicide rates than the national youth suicide rate (Figures 21 and 22). 26 Suicide Facts: Deaths and intentional self-harm hospitalisations 2012
37 Table 10: Suicide age-standardised deaths, by DHB regions, DHB region Total rate 1 CI Youth rate 2 CI Northland 13.7 ( ) 29.8 ( ) Waitemata 9.4 ( ) 13.7 ( ) Auckland 8.9 ( ) 14.6 ( ) Counties Manukau 10.2 ( ) 22.2 ( ) Waikato 11.6 ( ) 19.3 ( ) Lakes 16.1 ( ) 27.6 ( ) Bay of Plenty 14.9 ( ) 30.1 ( ) Tairawhiti 17.7 ( ) 40.3 ( ) Hawke s Bay 14.8 ( ) 26.0 ( ) Taranaki 13.4 ( ) 15.5 ( ) MidCentral 14.8 ( ) 26.4 ( ) Whanganui 15.3 ( ) 18.6 ( ) Capital & Coast 7.8 ( ) 12.2 ( ) Hutt Valley 10.8 ( ) 18.6 ( ) Wairarapa 20.0 ( ) 38.9 ( ) Nelson Marlborough 11.0 ( ) 14.9 ( ) West Coast 11.6 ( ) 0.0 Canterbury 11.8 ( ) 17.3 ( ) South Canterbury 20.6 ( ) 60.8 ( ) Southern 14.3 ( ) 21.2 ( ) National 11.6 ( ) 19.8 ( ) Source: New Zealand Mortality Collection Notes: Rates were calculated based on the total number of suicides between 2008 and The denominator population for the national suicide rate is the aggregated estimated national resident population for Confidence intervals (CI) are for 99% confidence. 1 Rates are expressed per 100,000 population and age-standardised to the WHO World Standard population. 2 Rates are age-specific, expressed as deaths per 100,000 population. Suicide Facts: Deaths and intentional self-harm hospitalisations


38 Figure 20: Age-standardised suicide rates, by DHB regions, Source: New Zealand Mortality Collection Notes: Rates are expressed per 100,000 population and age-standardised to the WHO World Standard population. Confidence intervals are for 99% confidence. If a DHB region s confidence interval does not cross the national suicide rate, the DHB rate is either statistically significantly higher or lower than the national rate. Figure 21: Youth age-specific suicide rates, by DHB regions, Source: New Zealand Mortality Collection Notes: Rates are age-specific, expressed as deaths per 100,000 population. Confidence intervals are for 99% confidence. If a DHB region s confidence interval does not cross the national suicide rate, the DHB rate is either statistically significantly higher or lower than the national rate. 28 Suicide Facts: Deaths and intentional self-harm hospitalisations 2012
39 Figure 22: Comparison of DHB region suicide rates with the national rate, Waitemata All ages Waitemata Youth Auckland Bay of Plenty Capital & Coast Capital & Coast South Canterbury South Canterbury Southern Difference from the national rate of suicide significantly lower not significantly different significantly higher Source: New Zealand Mortality Collection Notes: Suicide rates for all ages are expressed per 100,000 population and age-standardised to the WHO World Standard population. Youth rates are age-specific, expressed as deaths per 100,000 population. Methods of suicide In 2012, hanging, strangulation and suffocation as a group was the most common method 3 of suicide, being used in 62.8% of all suicide deaths. Poisoning by solids and liquids was the second most common method, which was used in 10.6% of suicides, followed by poisoning by firearms and explosives (8.4%) and gases and vapours (8.2%) (Table 11). Hanging, strangulation and suffocation was the most common method of suicide for both males and females (63.4% and 61.4% respectively). The second most common method of suicide was firearms and explosives for males (10.9%) and poisoning by solids and liquids for females (22.8%) (Figure 23). Between 2003 and 2012, there was an increase in the proportion of suicide deaths by hanging, strangulation and suffocation from 47.8% in 2003 to 62.8% in Over the same period, suicides from poisoning by gases and vapours decreased from 20.1% to 8.2%. The use of all other methods of suicide remained relatively stable over this time period (Table 11, Figure 24). 3 See Table A1 in Appendix 2: Definitions for the ICD-10-AM codes linked to each method. There is possibly some ambiguity as to the codes used to distinguish between poisoning methods. Suicide Facts: Deaths and intentional self-harm hospitalisations
40 Table 11: Methods used for suicide deaths, Year Poisoning solids and liquids Poisoning gases and vapours Hanging, strangulation and suffocation Submersion (drowning) Firearms and explosives Number % Number % Number % Number % Number % Number % Number % Other 2 Total Source: New Zealand Mortality Collection Notes: 1 Provisional data. 2 See Appendix 2: Definitions for information about the methods included in the Other category. 30 Suicide Facts: Deaths and intentional self-harm hospitalisations 2012

41 Figure 23: Methods used for suicide deaths, by sex, 2012 Source: New Zealand Mortality Collection Note: see Appendix 2: Definitions for information about the methods included in the Other category. Figure 24: Methods used for suicide deaths, Source: New Zealand Mortality Collection Note: see Appendix 2: Definitions for information about the methods included in the Other category. Suicide Facts: Deaths and intentional self-harm hospitalisations
42 Methods of suicide by life-stage age group Hanging, strangulation and suffocation collectively was the predominant method used for suicide by both male and females in all life-stage age groups in 2012 (Figure 25). Youth were more likely to die by hanging, strangulation and suffocation than older people use of these suicide methods decreased with age for both sexes, especially for females (Figure 25). Poisonings generally increased with age, particularly for female suicides. With increasing age, the proportion of females who used poisoning by solid and liquids to commit suicide increased to nearly the same proportion as hanging, strangulation and suffocation (Figure 25). A greater proportion of males aged 45 years and over used firearms and explosives compared with those aged less than 45 years. Males were generally more likely to employ firearms and explosives than females (Figure 25). 32 Suicide Facts: Deaths and intentional self-harm hospitalisations 2012
43 Figure 25: Methods used for suicide deaths, by sex and life-stage age group, 2012 Source: New Zealand Mortality Collection Note: see Appendix 2: Definitions for information about the methods included in the Other category. Suicide Facts: Deaths and intentional self-harm hospitalisations


44 International comparisons This section compares New Zealand suicide rates with those from other countries in the Organisation for Economic Co-operation and Development (OECD). The countries presented in this report were members of the OECD in In general, OECD countries are considered to produce reliable data collections and have similar economic statuses to New Zealand, and so their health and social statistics are often used for comparison with New Zealand s health and social statistics. A cautious approach is recommended when comparing international suicide statistics because many factors affect the recording and classification of suicide in different countries, including the level of proof required for a verdict of suicide; the stigma associated with suicide; the religion, social class or occupation of suicide victims; and confidentiality (Andriessen 2006). As a result, deaths classified as suicide in some countries may be classified as accidental or of undetermined intent in others. The international figures cited here (except New Zealand) are the latest available from the OECD and cover various years. Therefore New Zealand rates for 2012 are compared with data from earlier years for some countries in which different social and/or economic conditions may have applied. Sex New Zealand suicide rates for both the male and female populations are slightly above the median for the OECD countries presented. All OECD countries had higher suicide rates for males than females (Figure 26). Figure 26: Suicide age-standardised rates for OECD countries, by sex Source: OECD (nd) Note: rates are expressed per 100,000 population and age standardised to the WHO World Standard population. Youth aged years New Zealand male and female suicide rates were the highest of the OECD countries covered in this report. The New Zealand male youth suicide rate (2012) was 32.3 per 100,000 male youth 34 Suicide Facts: Deaths and intentional self-harm hospitalisations 2012
 with 11.0 per 100,000 population (Figure 27).")
45 population, followed by Finland (2011) with 26.4 suicides per 100,000 population (Figure 27). New Zealand s female youth suicide rate (2012) was 13.8 suicides per 100,000 female youth population, followed by the Republic of Korea (2011) with 11.0 per 100,000 population (Figure 27). Figure 27: Youth (15 24 years) suicide age-specific rates for OECD countries, by sex Source: OECD (nd) Note: rates are age-specific, expressed as deaths per 100,000 population. Suicide Facts: Deaths and intentional self-harm hospitalisations
46 Intentional self-harm hospitalisations in 2012 This section presents data on intentional self-harm hospitalisations by sex, age, ethnicity, deprivation and DHB region of domicile. The motivation for intentional self-harm varies; note that data on hospitalisations for intentional self-harm does not provide a measure of suicide attempts. To allow the best possible identification of trends, approximately 60% of all 2012 self-harm hospitalisations data has been excluded from this analysis (due to inconsistencies in the way DHBs report data). For more information about the exclusions, see the Introduction and tables A3 and A4 in Appendix 3: Further tables. Overview Over the 10-year period , the rate of intentional self-harm hospitalisations decreased by 11.5% from 80.3 per 100,000 in 2003 to 71.0 per 100,000 population in 2012 (Figure 28, Table 12). The actual number of self-harm hospitalisations decreased from 3141 in 2003 to 3031 in 2012 (Table 12). Caution is advised when interpreting the decline in self-harm hospitalisations as this decline could have been caused by changes in clinical practices and administration instead of real change in behaviour. Figure 28: Intentional self-harm hospitalisation age-standardised rates, Source: New Zealand National Minimum Dataset Note: rates are expressed per 100,000 population and age-standardised to the WHO World Standard population. 36 Suicide Facts: Deaths and intentional self-harm hospitalisations 2012

47 Sex In 2012, the female rate of hospitalisation for intentional self-harm was more than twice the male rate (96.1 per 100,000 females compared with 46.4 per 100,000 males) (Table 12). Over the 10 years from 2003 to 2012, the female rate of intentional self-harm hospitalisation was more variable than the male rate but remained at least 1.7 times greater than the male rate (Figure 29). It is well documented that females are more likely to be hospitalised for intentional self-harm than males (Berry and Harrison 2006). Table 12: Intentional self-harm hospitalisation numbers and age-standardised rates, by sex, Year Male Female Total Sex rate ratio (F:M) Number Rate Number Rate Number Rate Source: New Zealand National Minimum Dataset Note: rates are expressed per 100,000 population and age-standardised to the WHO World Standard population. Figure 29: Intentional self-harm hospitalisation age-standardised rates, by sex, Source: New Zealand National Minimum Dataset Note: rates are expressed per 100,000 population and age-standardised to the WHO World Standard population. Suicide Facts: Deaths and intentional self-harm hospitalisations
48 Age This section discusses intentional self-harm hospitalisations by five-year age groups and then focuses specifically on the group youth aged years. All ages In 2012, the year age group had the highest rate of intentional self-harm hospitalisations for both males (103.1 per 100,000 population) and females (279.5 per 100,000 population) (Table 13). Female rates of intentional self-harm hospitalisation were significantly higher than male rates for each five-year age group between the ages of 10 and 74 years. In those aged 75 years and over, male rates were significantly higher than female rates (Figure 30). The lowest male rates of intentional self-harm hospitalisations were in those aged years followed by years. In females, the lowest rates of intentional self-harm hospitalisations were in those aged years (Table 13). Table 13: Intentional self-harm hospitalisation numbers and rates, by sex and five-year age group, 2012 Age group (years) Male Female Total Number Rate Number Rate Number Rate Total Source: New Zealand National Minimum Dataset Notes: The rates for five-year age groups in this table are age-specific rates, expressed as deaths per 100,000 population. The total rates are expressed per 100,000 population and age-standardised to the WHO World Standard population. There were no intentional self-harm hospitalisations in the 0 4 years or 5 9 years age groups. 38 Suicide Facts: Deaths and intentional self-harm hospitalisations 2012
 In 2012, the female rate of intentional self-harm hospitalisations was 2.4 times the male rate (233.7 and 98.")
49 Figure 30: Intentional self-harm hospitalisation age-specific rates, by age group and sex, 2012 Source: New Zealand National Minimum Dataset Note: rates are age-specific, expressed as deaths per 100,000 population. Youth (15 24 years) In 2012, the female rate of intentional self-harm hospitalisations was 2.4 times the male rate (233.7 and 98.4 per 100,000 female and male populations respectively) (Table 14). Over the 10-year period of , youth hospitalisation rates for intentional self-harm varied. Female rates were consistently at least 2.1 times greater than males. The rates in 2012 were the highest during this period (Figure 31). Table 14: Youth intentional self-harm hospitalisation numbers and age-specific rates, by sex, Year Male Female Total Sex rate ratio (F:M) Number Rate Number Rate Number Rate Source: New Zealand National Minimum Dataset Note: rates are expressed as deaths per 100,000 population. Suicide Facts: Deaths and intentional self-harm hospitalisations

50 Figure 31: Youth (15 24 years) intentional self-harm hospitalisation age-specific rates, by sex, Source: New Zealand National Minimum Dataset Note: rates are expressed as deaths per 100,000 population. 40 Suicide Facts: Deaths and intentional self-harm hospitalisations 2012
51 Ethnicity Rates of intentional self-harm hospitalisations in 2012 for each ethnic group are as follows: a) Māori 85.0 per 100,000 population b) Pacific peoples 34.0 per 100,000 population c) European & Other 82.8 per 100,000 population d) Asian 18.0 per 100,000 population (Table 15). Over the five-year period of , Māori rates of hospitalisations for intentional selfharm were the highest followed by European & Other. During this period, Māori rates were at least more than twice those of the Pacific peoples and Asian populations (Figure 32). Māori In 2012, there were 563 intentional self-harm hospitalisations of Māori (18.6% of total intentional self-harm hospitalisations) (Table 15). The most common age group for both Māori males and females to be hospitalised for intentional self-harm was youth (15 24 years) closely followed by the years age group. There were 88 hospitalisations for male youth, equating to per 100,000 population, and 138 hospitalisations for female youth, equating to per 100,000 population (Table 16). Pacific peoples In 2012, there were 101 Pacific people hospitalised for intentional self-harm (3.3% of total intentional self-harm hospitalisations), equating to an age-standardised rate of 34.0 per 100,000 Pacific population (Table 15). Half of these were in youths aged years (Table 16). Asian In 2012, there were 97 intentional self-harm hospitalisations of Asian people (3.2% of total intentional self-harm hospitalisations), equating to an age-standardised rate of 18.0 per 100,000 Asian population (Table 15). Youth (15 24 years) accounted for nearly 30% of all Asian intentional self-harm hospitalisations (Table 16). European & Other There were 2270 intentional self-harm hospitalisations for people of ethnicities classified as European & Other in 2012 (74.9% of total intentional self-harm hospitalisations). Females accounted for 68.0% of intentional self-harm hospitalisations in this group (Table 15). Youth (15 24 years) were the most common age group to be hospitalised for intentional selfharm (198 males and 549 females) (Table 16). Suicide Facts: Deaths and intentional self-harm hospitalisations

52 Table 15: Intentional self-harm hospitalisation numbers and rates, by ethnicity and sex, Sex Year Māori Pacific peoples Asian European & Other Number Rate Number Rate Number Rate Number Rate Male Female Total Source: New Zealand National Minimum Dataset Notes: Rates are expressed per 100,000 population and age-standardised to the WHO World Standard population. Numbers and rates for are presented in the online tables for Māori, Pacific peoples and European & Other. Figure 32: Intentional self-harm hospitalisation age-standardised rates, by ethnic group, Source: New Zealand National Minimum Dataset Note: rates are expressed per 100,000 population and age-standardised to the WHO World Standard population. 42 Suicide Facts: Deaths and intentional self-harm hospitalisations 2012
53 Table 16: Intentional self-harm hospitalisations, by ethnicity, life-stage age group and sex, 2012 Ethnicity Sex Life-stage age group (years) Total < Māori Male Pacific peoples Female Total Male Female Total Asian Male European & Other All ethnicities Female Total Male Female Total Male Female Total Source: New Zealand National Minimum Dataset Suicide Facts: Deaths and intentional self-harm hospitalisations
.")
54 Māori and non-māori comparison In 2012, the Māori rate of intentional self-harm hospitalisations was 25% higher than the non-māori rate (85.0 per 100,000 and 68.0 per 100,000, respectively). This difference was statistically significant. Between 2003 and 2012, rates for Māori were variable and showed no real trend. Rates for non- Māori showed a general downward trend (Figure 33). Figure 33: Intentional self-harm hospitalisation age-standardised rates, Māori and non- Māori, Source: New Zealand National Minimum Dataset Note: rates are expressed per 100,000 population and age-standardised to the WHO World Standard population. 44 Suicide Facts: Deaths and intentional self-harm hospitalisations 2012

55 Sex The rates for male Māori and non-māori intentional self-harm hospitalisations continued to be lower than the rates for female Māori and non-māori in Between 2003 and 2012, rates for non-māori males showed a downward trend and were significantly lower than Māori male rates. Māori male rates remained variable. Non-Māori female rates for intentional self-harm hospitalisations showed a downward trend between 2003 and 2008, after which rates increased. The rate for Māori females was more variable throughout the whole period (Figure 34). Figure 34: Intentional self-harm hospitalisation age-standardised rates for Māori and non- Māori, by sex, Source: New Zealand National Minimum Dataset Note: rates are expressed per 100,000 population and age-standardised to the WHO World Standard population. Suicide Facts: Deaths and intentional self-harm hospitalisations
.")
56 Youth (15 24 years) In 2012, both Māori and non-māori youth self-harm hospitalisation rates were the highest recorded in the 10 years from 2003 to The difference between Māori and non-māori youth rates in 2012 was not statistically significant (Figure 35, Table 17). Between 2003 and 2012, Māori male youth rates of intentional self-harm hospitalisation were at least 1.4 times the non-māori male youth rate. In contrast, the ethnic disparity was less defined for female youth (Figure 36). Figure 35: Youth intentional self-harm hospitalisation age-specific rates, by ethnic group, Source: New Zealand National Minimum Dataset Note: rates are expressed as deaths per 100,000 population. Figure 36: Youth intentional self-harm hospitalisation age-specific rates, by ethnic group and sex, Source: New Zealand National Minimum Dataset Note: rates are expressed as deaths per 100,000 population. 46 Suicide Facts: Deaths and intentional self-harm hospitalisations 2012
57 Table 17: Youth intentional self-harm hospitalisation numbers and age-specific rates, Māori and non-māori, by sex, Year Māori Non-Māori Male Female Total Male Female Total Number Rate Number Rate Number Rate Number Rate Number Rate Number Rate Source: New Zealand National Minimum Dataset Note: rates are expressed as deaths per 100,000 population. Suicide Facts: Deaths and intentional self-harm hospitalisations
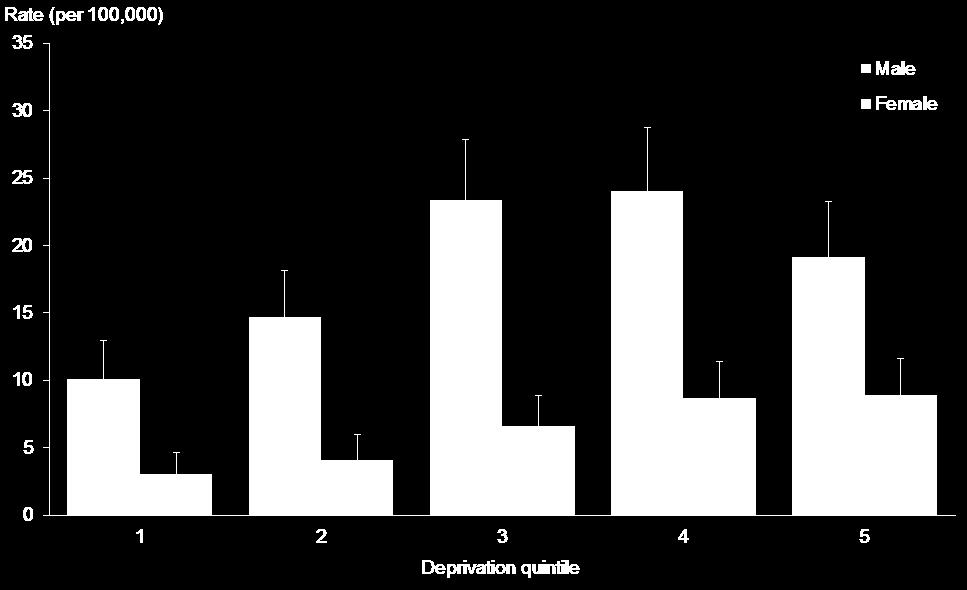
58 Deprivation Deprivation quintiles are used to represent the level of deprivation of the area of residence. Deprivation quintile 1 represents the least deprived areas, and quintile 5 represents the most deprived areas, according to the 2006 New Zealand Deprivation Index (NZDep 2006). In 2012, the highest rate of intentional self-harm hospitalisations was among those residing in deprivation quintile 4. The rate in quintile 4 was 1.8 times the rate for those in quintile 1 (90.9 per 100,000 population compared with 49.6 per 100,000 population) (Table 18). For males, the rates for quintiles 3 5 were significantly higher than the rates for quintiles 1 and 2. The rate in quintile 4 was 2.5 times the rate in the least deprived quintile (66.0 per 100,000 population compared with 26.8 per 100,000 population). In 2012, the female intentional self-harm hospitalisations rate was highest in quintile 4 (116.3 per 100,000 population); this rate was 1.6 times higher than the rate in the least deprived quintile (quintile 1, at 73.3 per 100,000 population) (Table 18). Female rates in the three most deprived quintiles (3 5) were significantly higher than female rates in the least deprived quintile (Figure 37). Table 18: Intentional self-harm hospitalisation numbers and age-standardised rates, by deprivation quintile and sex, 2012 Deprivation quintile Male Female Total Number Rate Number Rate Number Rate 1 (least) (most) Source: New Zealand National Minimum Dataset Note: rates are expressed per 100,000 population and age-standardised to the WHO World Standard population. 48 Suicide Facts: Deaths and intentional self-harm hospitalisations 2012


59 Figure 37: Intentional self-harm hospitalisation age-standardised rates, by deprivation quintile and sex, 2012 Source: New Zealand National Minimum Dataset Note: rates are expressed per 100,000 population and age-standardised to the WHO World Standard population. Suicide Facts: Deaths and intentional self-harm hospitalisations
60 District health board regions In this section, data for district health board (DHB) regions has been aggregated over three years ( ) because intentional self-harm hospitalisation rates can vary considerably from year to year. The national rate was 66.0 intentional self-harm hospitalisations per 100,000 population over the three years from 2010 to Eight DHB regions had significantly higher rates for intentional self-harm hospitalisation than the national rate, with Wairarapa having a notably higher than all other DHB regions (169.0 per 100,000 population). Auckland, Counties Manukau, Hawke s Bay and MidCentral DHB regions had significantly lower rates than the national rate (Table 19, Figures 38 and 39). Table 19: Intentional self-harm hospitalisation age-standardised rates, by DHB of domicile and sex, DHB region Sex Male Female Total Rate CI Rate CI Rate CI Northland 68.7 ( ) ( ) 91.7 ( ) Waitemata 48.5 ( ) 85.6 ( ) 67.0 ( ) Auckland 30.0 ( ) 36.8 ( ) 33.3 ( ) Counties Manukau 25.7 ( ) 34.4 ( ) 29.9 ( ) Waikato 49.1 ( ) 80.7 ( ) 64.9 ( ) Lakes 60.6 ( ) 79.1 ( ) 69.9 ( ) Bay of Plenty 62.1 ( ) ( ) 91.2 ( ) Tairawhiti 50.6 ( ) 94.3 ( ) 72.7 ( ) Hawke s Bay 39.4 ( ) 43.4 ( ) 41.4 ( ) Taranaki 57.8 ( ) 99.7 ( ) 78.3 ( ) MidCentral 32.1 ( ) 70.9 ( ) 51.6 ( ) Whanganui 61.0 ( ) 67.9 ( ) 64.2 ( ) Capital & Coast 51.5 ( ) ( ) ( ) Hutt Valley 57.0 ( ) ( ) 90.3 ( ) Wairarapa 97.2 ( ) ( ) ( ) Nelson Marlborough 47.7 ( ) ( ) ( ) West Coast 75.5 ( ) ( ) ( ) Canterbury 38.6 ( ) 86.6 ( ) 62.2 ( ) South Canterbury 59.8 ( ) ( ) 81.0 ( ) Southern 57.6 ( ) ( ) 89.4 ( ) National 45.2 ( ( ) 66.0 ( ) Source: New Zealand National Minimum Dataset Notes: Rates are expressed per 100,000 population and age-standardised to the WHO World Standard population. Rates were calculated based on the total number of intentional self-harm hospitalisations between 2010 and For the national rate, the denominator population is the aggregated estimated resident population for Confidence intervals (CI) are for 99% confidence (lower limit upper limit). 50 Suicide Facts: Deaths and intentional self-harm hospitalisations 2012
61 Figure 38: Intentional self-harm hospitalisation age-standardised rates, by DHB, Source: New Zealand National Minimum Dataset Note: rates are expressed per 100,000 population and age-standardised to the WHO World Standard population. Figure 39: Comparison of DHB region intentional self-harm hospitalisation rates with national rate, All ages Youth Auckland Northland Auckland Counties Manukau Counties Manukau Capital & Coast Bay of Plenty Bay of Plenty Hutt Valley Hawke's Bay Capital & Coast Hawke's Bay MidCentral MidCentral Wairarapa Wairarapa Nelson Marlborough Nelson Marlborough West Coast West Coast Southern Southern Difference from the national rate of intentional self-harm hospitalisations significantly lower not significantly different significantly higher Notes: Intentional self-harm hospitalisation rates for all ages are expressed per 100,000 population and age-standardised to the WHO World Standard population. Youth rates are age-specific, expressed as intentional self-harm hospitalisations per 100,000 population. Suicide Facts: Deaths and intentional self-harm hospitalisations

62 Māori and non-māori comparison There was considerable variation between DHB regions for Māori and non-māori rates of intentional self-harm hospitalisations over the period Among Māori, the highest rates were in the Waitemata DHB region for males and the Wairarapa DHB region for females. The highest non-māori rates for both males and females were seen in the Wairarapa DHB region (Figures 40 and 41). However, when the DHB region data is broken down into population subgroups, the numbers in some subgroups (for example, Māori males) are small and therefore should be treated with caution. Figure 40: Intentional self-harm hospitalisation age-standardised rates for males, by DHB and ethnic group, (aggregated data) Source: New Zealand National Minimum Dataset Note: rates are expressed per 100,000 population and age-standardised to the WHO World Standard population. 52 Suicide Facts: Deaths and intentional self-harm hospitalisations 2012

63 Figure 41: Intentional self-harm hospitalisation age-standardised rates for females, by DHB and ethnic group, (aggregated data) Source: New Zealand National Minimum Dataset Note: rates are expressed per 100,000 population and age-standardised to the WHO World Standard population. Suicide Facts: Deaths and intentional self-harm hospitalisations
BSA New Zealand Hawkes Bay District Health Board Coverage Report
 BSA New Zealand Hawkes Bay District Health Board Coverage Report For the period ending 31 December 2016 Citation: Ministry of Health. February 2017. BSA New Zealand District Health Board Coverage Report:
Universal Newborn Hearing Screening and Early Intervention Programme (UNHSEIP) Monitoring Report
 Monitoring Report") Universal ewborn Hearing Screening and Early Intervention Programme (UHSEIP) Monitoring Report January to December 2015 Released 2016 health.govt.nz Copyright The copyright owner of this publication is
Universal ewborn Hearing Screening and Early Intervention Programme (UHSEIP) Monitoring Report January to December 2015 Released 2016 health.govt.nz Copyright The copyright owner of this publication is
PERTUSSIS REPORT. November 2013
 PERTUSSIS REPORT Data contained within this monthly report is based on information recorded on EpiSurv by public health service staff as at 12 December 213. Changes made to EpiSurv data after this date
Tobacco Trends 2007 A brief update on monitoring indicators
 Tobacco Trends 2007 A brief update on monitoring indicators Citation: Ministry of Health. 2008. Tobacco Trends 2007: A brief update on monitoring indicators. Wellington: Ministry of Health. Published in
Ministry of Health. Refresh of rheumatic fever prevention plans: Guiding information for high incidence District Health Boards June 2015
 Ministry of Health Refresh of rheumatic fever prevention plans: Guiding information for high incidence District Health Boards June 2015 Contents Introduction... 1 Guidance for update of Rheumatic Fever
Diabetic Retinal Screening, Grading, Monitoring and Referral Guidance. Objective
 Diabetic Retinal Screening, Grading, Monitoring and Referral Guidance. Objective The Diabetic Retinal Grading, Monitoring and Referral Guidance 2015 updates all previous guidelines And outlines the key
Kidney Transplant Activity New Zealand
 Kidney Transplant Activity New Zealand 2016 Calendar Year Author: Nick Cross, Clinical Director Dale Gommans, Analyst National Renal Transplant Service Data Collection Data is provided directly to the
Kidney Transplant Activity New Zealand
 Kidney Transplant Activity New Zealand 2017 Calendar Year Author: Nick Cross, Clinical Director National Renal Transplant Service Date: 13 March 2018 Data Collection Data is provided directly to the National
Dialysis and Transplantation Audit
 New Zealand Dialysis and Transplantation Audit and A summary report of activity for New Zealand nephrology services Dr Suetonia Palmer On behalf of the National Renal Advisory Board NRAB Standard and Audits
Judy Li Nick Chen The Quit Group
 Redemption of Nicotine Replacement Therapy (NRT) Quit Cards distributed through the Quitline, January June 2007 Judy Li Nick Chen The Quit Group July 2008 1 EXECUTIVE SUMMARY Aims 1. To give an indication
Community and Hospital Surveillance
 6SSN 2324-497 Community and Hospital Surveillance ILI, SARI, Influenza and Respiratory Pathogens 217 Influenza Season, Week 3, ending 3 July 217 SUMMARY Influenza-like illness (ILI) consultation rates
The impact of respiratory disease in New Zealand: 2014 update RAL I A T A F O U N D AT I SENS ITIVE CHOICE
 The impact of respiratory disease in New Zealand: 2014 update IL ST AL MA COUNC RAL I A NATION TH AU AS T M (N Z) AS H A F ON O U N D AT I SENS ITIVE CHOICE This report was prepared for the The Asthma
508 the number of suicide deaths in deaths per 100,000 people was the suicide rate in Suicide deaths in 2013 by gender
 An overview of suicide statistics This document summarises information about suicide deaths in New Zealand covering up to 13. It does not attempt to explain causes of suicidal behaviour or causes of changes
Laboratory Surveillance of Chlamydia and Gonorrhoea in New Zealand. October to December 2010
 ISSN 1176-7316 Laboratory Surveillance of Chlamydia and Gonorrhoea in New Zealand October to December 2010 Prepared as part of a Ministry of Health contract for scientific services by Health Intelligence
Invasive Pneumococcal Disease Quarterly Report
 Invasive Pneumococcal Disease Quarterly Report April June 2018 Prepared as part of a Ministry of Health contract for scientific services by Liza Lopez Helen Heffernan July 2018 Acknowledgements This report
Dr Chris Jackson. Consultant Medical Oncologist Southern Blood and Cancer Service (SDHB) University of Otago
 University of Otago") Dr Chris Jackson Consultant Medical Oncologist Southern Blood and Cancer Service (SDHB) University of Otago 14:50-15:15 Priorities for Cancer Care in NZ - The Cancer Society's View Priorities for Cancer
Dr Chris Jackson Consultant Medical Oncologist Southern Blood and Cancer Service (SDHB) University of Otago 14:50-15:15 Priorities for Cancer Care in NZ - The Cancer Society's View Priorities for Cancer
Problem-solving therapy (PST) for people who present to hospital with self-harm
 for people who present to hospital with self-harm") Technology Note Problem-solving therapy (PST) for people who present to hospital with self-harm August 2012 Key words: self-harm, problem-solving therapy, depression, suicide Summary Purpose To provide
Technology Note Problem-solving therapy (PST) for people who present to hospital with self-harm August 2012 Key words: self-harm, problem-solving therapy, depression, suicide Summary Purpose To provide
Invasive Pneumococcal Disease Quarterly Report
 Invasive Pneumococcal Disease Quarterly Report January March 2018 Prepared as part of a Ministry of Health contract for scientific services by Rebekah Roos Helen Heffernan June 2018 Acknowledgements This
Dr Alasdair Patrick. Dr Nagham Al-Mozany. 9:45-10:10 Where Are We Up To With Bowel Cancer Screening?
 Dr Alasdair Patrick Gastroenterologist and General Physician Middlemore Hospital Auckland Dr Nagham Al-Mozany Colorectal Surgeon Auckland City Hospital Clinical Senior Lecturer University of Auckland 9:45-10:10
The impact of respiratory disease in New Zealand: 2018 update
 The impact of respiratory disease in New Zealand: 2018 update Dr Lucy Telfar Barnard Jane Zhang This report was prepared for the Asthma and Respiratory Foundation NZ Contents 1. List of Figures... 5 2.
National Year 10 ASH Snapshot Survey, : Trends in Tobacco Use by Students Aged Years
 National Year 10 ASH Snapshot Survey, 1999-2009: Trends in Tobacco Use by Students Aged 14-15 Years Janine Paynter On behalf of Action on Smoking and Health, Health Sponsorship Council and the Ministry
The epidemiology of meningococcal disease in New Zealand 2010 SURVEILLANCE REPORT
 SURVEILLANCE REPORT The epidemiology of meningococcal disease in New Zealand 2010 Prepared as part of a Ministry of Health contract for scientific services by the Health Intelligence Team, Institute of
The incidence of acute rheumatic fever in New Zealand ( )
") The incidence of acute rheumatic fever in New Zealand (2010-2013) Citation: Jason Gurney, James Stanley and Diana Sarfati (2015). The incidence of acute rheumatic fever in New Zealand, 2010-2013. Wellington:
The incidence of acute rheumatic fever in New Zealand (2010-2013) Citation: Jason Gurney, James Stanley and Diana Sarfati (2015). The incidence of acute rheumatic fever in New Zealand, 2010-2013. Wellington:
MONTHLY NOTIFIABLE DISEASE SURVEILLANCE REPORT
 ISSN 2324-254X April 2018 MONTHLY NOTIFIABLE DISEASE SURVEILLANCE REPORT Data contained within this monthly report is based on information recorded on EpiSurv by Public Health Service (PHS) staff at 11
Newborn Metabolic Screening Programme. Annual Report
 Newborn Metabolic Screening Programme Annual Report January to December 2016 1 Disclaimer This publication reports on information provided to the Ministry of Health by the Auckland District Health Board.
Newborn Metabolic Screening Programme Annual Report
 Newborn Metabolic Screening Programme Annual Report January to December 2015 Disclaimer This publication reports on information provided to the Ministry of Health by the Auckland District Health Board.
Atlas of Cancer Mortality in New Zealand Public Health Intelligence Occasional Bulletin Number 29
 Atlas of Cancer Mortality in New Zealand 1994 2000 Public Health Intelligence Occasional Bulletin Number 29 Citation: Ministry of Health. 2005. Atlas of Cancer Mortality in New Zealand 1994 2000. Wellington:
This form is completed by the consenting parent and the lead maternity carer (LMC) after the birth immunisations.
 after the birth immunisations.") Instructions This form is completed by the consenting parent and the lead maternity carer (LMC) after the birth immunisations. The white LMC page is to remain with the maternity notes. Fax, or send a photocopy,
Instructions This form is completed by the consenting parent and the lead maternity carer (LMC) after the birth immunisations. The white LMC page is to remain with the maternity notes. Fax, or send a photocopy,
MONTHLY NOTIFIABLE DISEASE SURVEILLANCE REPORT
 ISSN 2324-254X January 2016 MONTHLY NOTIFIABLE DISEASE SURVEILLANCE REPORT Data contained within this monthly report is based on information recorded on EpiSurv by Public Health Service (PHS) staff as
New Zealand. Dialysis and Transplantation Audit
 New Zealand Dialysis and Transplantation Audit Report for New Zealand Nephrology Services on behalf of the National Renal Advisory Board Grant Pidgeon Standards and Audit Subcommittee July 2012 Establishment
AMBULATORY SENSITIVE HOSPITALISATIONS
 AMBULATORY SENSITIVE HOSPITALISATIONS Introduction Ambulatory sensitive hospitalisations (ASH) are often used as a measure for assessing the performance of primary health care [97]. From 2007, the Ministry
Hazardous drinking in 2011/12: Findings from the New Zealand Health Survey
 Hazardous drinking in 11/12: Findings from the New Zealand Health Survey This report presents key findings about alcohol use and hazardous drinking among adults aged 15 years and over, which come from
MONTHLY NOTIFIABLE DISEASE SURVEILLANCE REPORT
 ISSN 2324-254X May 2016 MONTHLY NOTIFIABLE DISEASE SURVEILLANCE REPORT Data contained within this monthly report is based on information recorded on EpiSurv by Public Health Service (PHS) staff as at 20
INVASIVE GROUP A STREPTOCOCCAL INFECTION IN NEW ZEALAND, 2014 AND 2015
 INVASIVE GROUP A STREPTOCOCCAL INFECTION IN NEW ZEALAND, 2014 AND 2015 Authors: Tammy Hambling Yvonne Galloway Susan Jack Julie Morgan PREPARED FOR: CLIENT REPORT No: PREPARED BY: Ministry of Health FW15036
Revitalising the National HPV Immunisation Programme. with agreed outcomes from the August 2014 workshop
 Revitalising the National HPV Immunisation Programme with agreed outcomes from the August 2014 workshop Citation: Ministry of Health. 2015. Revitalising the National HPV Immunisation Programme with Agreed
Nelson Marlborough District Health Board. Health Needs Assessment. Prepared by Sarah Simmonds Population Health Analyst, NMDHB
 Nelson Marlborough District Health Board Health Needs Assessment 2011 Prepared by Sarah Simmonds Population Health Analyst, NMDHB Contents 1. Introduction... 3 2. Mortality... 4 3. Foetal and Infant Mortality...
Report for the Minister of Health from the Pandemic Influenza Mortality and Morbidity Review Group
 Report for the Minister of Health from the Pandemic Influenza Mortality and Morbidity Review Group PIMMRG. 2010. Report for the Minister of Health from the Pandemic Influenza Mortality and Morbidity Review
ACC Treatment Injury Claims
 ACC Treatment Injury Claims Surgical Mesh-Related Claim Data From 1 July 25 to 3 June 217 (12 fiscal years) 18/1/217 1 P age Contents Contents... 2 Abbreviations... 2 Colour references... 3 Terminology...
INVASIVE GROUP A STREPTOCOCCAL INFECTION IN NEW ZEALAND, 2016
 INVASIVE GROUP A STREPTOCOCCAL INFECTION IN NEW ZEALAND, 2016 Authors: Tammy Hambling Yvonne Galloway Susan Jack Julie Morgan PREPARED FOR: CLIENT REPORT No: PREPARED BY: Ministry of Health FW17051 Health
MONTHLY NOTIFIABLE DISEASE SURVEILLANCE REPORT
 ISSN 2324-254X October 2016 MONTHLY NOTIFIABLE DISEASE SURVEILLANCE REPORT Data contained within this monthly report is based on information recorded on EpiSurv by Public Health Service (PHS) staff at
Interval Cancers in BreastScreen Aotearoa
 Interval Cancers in BreastScreen Aotearoa 2008 2009 Released 2018 nsu.govt.nz Citation: National Screening Unit. 2018. Interval Cancers in BreastScreen Aotearoa 2008 2009. Wellington: Ministry of Health.
Effectiveness of the Get Checked diabetes programme
 Effectiveness of the Get Checked diabetes programme This is an independent report published under section 21 of the Public Audit Act 2001. September 2010 ISBN 978-0-478-32675-8 (online) 2 Contents Auditor-General
Newborn Metabolic Screening Programme
 Newborn Metabolic Screening Programme Annual Report January to December 2017 Released 2018 health.govt.nz Disclaimer This publication reports on information provided to the Ministry of Health by the Auckland
MONTHLY NOTIFIABLE DISEASE SURVEILLANCE REPORT
 ISSN 2324-254X November 2017 MONTHLY NOTIFIABLE DISEASE SURVEILLANCE REPORT Data contained within this monthly report is based on information recorded on EpiSurv by Public Health Service (PHS) staff at
ARTICLE. Epidemiology of melanoma in situ in New Zealand: Sam Rice, Lifeng Zhou, Richard Martin ABSTRACT
 Epidemiology of melanoma in situ in New Zealand: 2008 2012 Sam Rice, Lifeng Zhou, Richard Martin ABSTRACT AIM: The incidence of melanoma in situ varies throughout the world. It is associated with excellent
National Hazardous Substances and Lead Notifications
 National Hazardous Substances and Lead Notifications January December 2016 Report to the Ministry of Health 03 July 2017 Author This report was written by Fei Xu, Analyst, Environmental Health Indicators
Medical Officers of Health (send yellow page) Name Districts covered Address Phone Fax. Waikato District Health Board. Toi Te Ora Public Health
 Name Districts covered Address Phone Fax. Waikato District Health Board. Toi Te Ora Public Health") Instructions This form is completed by the consenting parent and the lead maternity carer (LMC) after the birth immunisations. The white LMC page is to remain with the maternity notes. Fax, or send a photocopy,
Instructions This form is completed by the consenting parent and the lead maternity carer (LMC) after the birth immunisations. The white LMC page is to remain with the maternity notes. Fax, or send a photocopy,
INVASIVE PNEUMOCOCCAL DISEASE IN NEW ZEALAND, 2015
 INVASIVE PNEUMOCOCCAL DISEASE IN NEW ZEALAND, 2015 Prepared as part of a Ministry of Health contract for scientific services by Health Group Institute of Environmental Science and Research Limited June
Helen Heffernan and Rosemary Woodhouse Antibiotic Reference Laboratory, Institute of Environmental Science and Research Limited (ESR); July 2014.
; July 2014.") Annual survey of extended-spectrum -lactamase (ESBL)-producing Enterobacteriaceae, 2013 Helen Heffernan and Rosemary Woodhouse Antibiotic Reference Laboratory, Institute of Environmental Science and Research
Annual survey of extended-spectrum -lactamase (ESBL)-producing Enterobacteriaceae, 2013 Helen Heffernan and Rosemary Woodhouse Antibiotic Reference Laboratory, Institute of Environmental Science and Research
The benefits and costs of water fluoridation - a summary for DHBs. David Moore and Matt Poynton
 The benefits and costs of water fluoridation - a summary for DHBs David Moore and Matt Poynton June 2016 About Sapere Research Group Limited Sapere Research Group is one of the largest expert consulting
Newborn Metabolic Screening Programme. Annual Report
 Newborn Metabolic Screening Programme Annual Report January to December 2011 Copyright The copyright owner of this publication is the Ministry of Health, which is part of the New Zealand Crown. The Ministry
Health Needs Assessment
 Health Needs Assessment District Health Board For the Ministry of Health Contact Person: Associate Professor Barry Borman Centre for Public Health Research Massey University, Wellington Campus PO Box 76,
MidCentral District Health Board Rheumatic Fever Prevention Plan. October 2013
 MidCentral District Health Board Rheumatic Fever Prevention Plan October 2013 Contents Section 1: Introduction... 3 1.1 Executive summary... 3 1.2 Purpose... 5 Section 2: Overview of acute rheumatic fever
Department of Conservation National Survey Information, bookings and online services
 Department of Conservation National Survey Information, bookings and online services Survey conducted: June 2012 Reporting produced: August 2012 1 Contents 1.0 Methodology... 3 2.0 Findings... 4 2.1 Source
Cancer in the South Island of New Zealand Health Needs Assessment
 Cancer in the South Island of New Zealand Health Needs Assessment - 21 Southern Cancer Network July 21 Prepared by: Tony Macdonald, Claire Worsfold, Robert Weir Disclaimer Information within the report
Newborn Metabolic Screening Programme. Annual Report
 Newborn Metabolic Screening Programme Annual Report January to December 2014 Copyright The copyright owner of this publication is the Ministry of Health, which is part of the New Zealand Crown. The Ministry
Expected Non Melanoma Skin (Keratinocytic) Cancer incidence in New Zealand for 2018
 Cancer incidence in New Zealand for 2018") Expected Non Melanoma Skin (Keratinocytic) Cancer incidence in New Zealand for 2018 March 2018 Provider: Dr Mary Jane Sneyd (Consultant Epidemiologist, Public Health Research and Consulting Services) and
Expected Non Melanoma Skin (Keratinocytic) Cancer incidence in New Zealand for 2018 March 2018 Provider: Dr Mary Jane Sneyd (Consultant Epidemiologist, Public Health Research and Consulting Services) and
INVASIVE PNEUMOCOCCAL DISEASE IN NEW ZEALAND, Helen Heffernan. Julie Morgan. Rosemary Woodhouse. Diana Martin
 INVASIVE PNEUMOCOCCAL DISEASE IN NEW ZEALAND, 2009 Helen Heffernan Julie Morgan Rosemary Woodhouse Diana Martin Health Group Institute of Environmental Science and Research Ltd (ESR) Kenepuru Science Centre
Bowel Cancer Quality Improvement Report
 Bowel Cancer Quality Improvement Report 2019 Released 2019 health.govt.nz This report publishes quality performance indicator data from patients diagnosed with colorectal cancer in New Zealand between
Cutting back on alcohol consumption. Key results from the 2015/16 Attitudes and Behaviour towards Alcohol Survey & 2016 Health and Lifestyles Survey
 Cutting back on alcohol consumption Key results from the 2015/16 Attitudes and Behaviour towards Alcohol Survey & 2016 Health and Lifestyles Survey March 2018 ISBN: 978-0-478-44931-0 Citation: Health Promotion
New Zealand Nephrology Activity Report 2014
 New Zealand Nephrology Activity Report Care Processes and Treatment Targets Key findings about care for people with end-stage kidney disease treated with dialysis or kidney transplantation in New Zealand
Annual Hazardous Substances Injury Report Report to the Ministry of Health
 Annual Hazardous Substances Injury Report 2016 Report to the Ministry of Health 21 November 2016 Author This report was written by Fei Xu, Analyst, Environmental Health Indicators Programme, Centre for
APPENDIX: NATIONAL SURVEILLANCE DATA AND TRENDS
 2008 Annual Surveillance Report Notifiable and Other s in New Zealand 49 APPENDIX: NATIONAL SURVEILLANCE DATA AND TRENDS COMPARISON OF NOTIFIABLE DISEASE CASES AND RATES FOR 2007 AND 2008 Table 37. Number
National Cancer Programme. Work Plan 2015/16
 National Cancer Programme Work Plan 2015/16 Citation: Ministry of Health. 2015. National Cancer Programme: Work plan 2015/16. Wellington: Ministry of Health. Published in October 2015 by the Ministry of
Helplines and local mental health services
 Helplines and local mental health services FEBRUARY 2018 Tēnā koe In this resource you will find a directory of helplines and local mental health service contact details. To help connect people with their
Department of Conservation National Survey Kauri Dieback
 Department of Conservation National Survey Kauri Dieback Survey conducted: June 2012 Reporting produced: August 2012 1 Contents 1.0 Methodology... 3 2.0 Findings... 5 2.1 Been to a DOC managed area in
Fifth Report to the Minister of Health Reporting mortality
 ... Unuhia i terito o te harakeke... Child and Youth Mortality Review Committee Te Ròpù Arotake Auau Mate o te Hunga Tamariki, Taiohi... taken away too... early Fifth Report to the Minister of Health Reporting
Annual Hazardous Substances Injury Report 2015
 Annual Hazardous Substances Injury Report 2015 20 November 2015 Author This report was written by Helene Marsters, Senior Analyst at the Centre for Public Health Research (CPHR), Massey University. Suggested
Supporting information for the Report on National Gynaecological Oncology Service Provision Models
 Discussion document Supporting information for the Report on National Gynaecological Oncology Service Provision Models Sub Group of the National Gynaecological Cancer Working Group 26 November 2013 For
Section 3: Health and Independence Report 2013
 Section 3: Health and Independence Report 2013 Purpose of this report The Health and Independence Report (the Report) gives an overview of the current state of public health in New Zealand. It has three
Antimicrobial resistance and molecular epidemiology of Neisseria gonorrhoeae in New Zealand,
 Antimicrobial resistance and molecular epidemiology of Neisseria gonorrhoeae in New Zealand, 2014-15 December 2015 PREPARED FOR: CLIENT REPORT No: PREPARED BY: Ministry of Health FW15061 Helen Heffernan,
Tracking the Obesity Epidemic: New Zealand Public Health Intelligence Occasional Bulletin No 24
 Tracking the Obesity Epidemic: New Zealand 1977 2003 Public Health Intelligence Occasional Bulletin No 24 Citation: Ministry of Health. 2004. Tracking the Obesity Epidemic: New Zealand 1977 2003. Wellington:
Tatau Kahukura. Mäori Health Chart Book. Public Health Intelligence Monitoring Report No.5
 Tatau Kahukura Mäori Health Chart Book 2006 Public Health Intelligence Monitoring Report No.5 The title of this publication, Tatau Kahukura, refers to valuable, high-quality information that has been woven
THE NEW ZEALAND MEDICAL JOURNAL
 THE NEW ZEALAND MEDICAL JOURNAL Journal of the New Zealand Medical Association Sociodemographic characteristics of New Zealand adult smokers, ex-smokers, and non-smokers: results from the 2006 Census Sharon
BRONCHIOLITIS. Introduction
 BRONCHIOLITIS Introduction Bronchiolitis is the most common lower respiratory infection in infants and a leading cause of hospital admission in this age group. It is a viral infection and is most commonly
The Health of Pacific Peoples
 The Health of Pacific Peoples i Citation: Ministry of Health. 2005.. Wellington: Ministry of Health. Published in April 2005 by the Ministry of Health PO Box 5013, Wellington, New Zealand ISBN 0-478-28327-X
Māori Health Profile 2015
 BAY OF PLENTY DISTRICT HEALTH BOARD TE HAUORA A TOI Māori Health Profile 2015 Te taupori Population In 2013, 53,700 Māori lived in the Bay of Plenty District Health Board region, 25% of the District s
PERTUSSIS. Introduction
 PERTUSSIS Introduction Pertussis (whooping cough) is a highly contagious acute respiratory tract infection caused by the bacterium Bordetella pertussis. It is spread by aerosol droplets. Neither vaccination
ROTAVIRUS IN NEW ZEALAND, 2015
 ROTAVIRUS IN NEW ZEALAND, 2015 Prepared by/author(s): Yvonne Galloway Susan Jack Joanne Hewitt PREPARED FOR: CLIENT REPORT No: PREPARED BY: Ministry of Health FW16040 Institute of Environmental Science
Supporting students who are deaf or hard of hearing. Health - Education Interface
 Supporting students who are deaf or hard of hearing Health - Education Interface Review of Services to Deaf Children Ross Wilson Report 2011 12 Key Recommendations Implementation of recommendations Focus
Māori Health Profile 2015
 SOUTHERN DISTRICT HEALTH BOARD TE POARI HAUORA Ā-ROHE O ŌTĀKOU-MURIHIKU Māori Health Profile 2015 Te taupori Population In 2013, 29,200 Māori lived in the Southern District Health Board region, 10% of
Māori Health Profile 2015
 HUTT VALLEY DISTRICT HEALTH BOARD TE POARI HAUORA O TE AWAKAIRANGI Māori Health Profile 2015 Te taupori Population In 2013, 23,800 Māori lived in the Hutt District Health Board region, 17% of the District
Targeting Immunisation
 Targeting Immunisation Increased Immunisation Our target: 85% of two-yearolds will be fully immunised by July 2010, 90% by July 2011 and 95% by July 2012. Increased Better help for Better Shorter stays
Māori Health Profile 2015
 WHANGANUI DISTRICT HEALTH BOARD TE POARI HAUORA O WHANGANUI Māori Health Profile 2015 Te taupori Population In 2013, 15,850 Māori lived in the Whanganui District Health Board (DHB) region, 25% of the District
Submission on the Health (Fluoridation of Drinking Water) Amendment Bill
 Amendment Bill") Auckland Regional Public Health Service Cornwall Complex Floor 2, Building 15 Greenlane Clinical Centre Private Bag 92 605 Symonds Street Auckland 1150 New Zealand Telephone: 09-623 4600 Facsimile: 09-623
Auckland Regional Public Health Service Cornwall Complex Floor 2, Building 15 Greenlane Clinical Centre Private Bag 92 605 Symonds Street Auckland 1150 New Zealand Telephone: 09-623 4600 Facsimile: 09-623
Health of Older People Strategy
 Health of Older People Strategy Health Sector Action to 2010 to Support Positive Ageing Draft for Consultation Hon Ruth Dyson Associate Minister of Health and Minister for Disability Issues September 2001
Measles Elimination in NZ. Dr Tom Kiedrzynski Principal Adviser, Communicable diseases, Ministry of Health
 Measles Elimination in NZ Dr Tom Kiedrzynski Principal Adviser, Communicable diseases, Ministry of Health Presentation Outline International background WHO requirements Overview of the measles situation
Metropolitan Auckland Cervical Screening Strategic Plan
 Introduction The National Cervical Screening Programme (NCSP) was established as a national programme over twenty years ago in 1990. The aim of the programme is to reduce the number of women who develop
THE NEW ZEALAND MEDICAL JOURNAL
 THE NEW ZEALAND MEDICAL JOURNAL Journal of the New Zealand Medical Association Hospital admissions for people with diagnosed diabetes: challenges for diabetes prevention and management programmes Gary
Cancer in Pacific people in New Zealand: a descriptive study
 Cancer in Pacific people in New Zealand: a descriptive study Abstract: Non-Mâori Pacific people constitute a significant and rapidly growing population in New Zealand. An accompanying change in lifestyle
MENTAL HEALTH INDICATORS: WITHIN 30-DAY HOSPITAL RE-ADMISSION
 MENTAL HEALTH INDICATORS: WITHIN 30-DAY HOSPITAL RE-ADMISSION OECD HCQI Expert Meeting Rie Fujisawa November 16 th 2012 Within 30-day hospital re-admission Data are collected in two different ways: The
Te Rau Hinengaro: The New Zealand Mental Health Survey
 Te Rau Hinengaro: The New Zealand Mental Health Survey Executive Summary Mark A Oakley Browne, J Elisabeth Wells, Kate M Scott Citation: Oakley Browne MA, Wells JE, Scott KM. 2006. Executive summary. In:
Report to Waikato Medical Research Foundation
 Report to Waikato Medical Research Foundation Understanding the importance of tumour biology and socio-demographic difference in cancer stage at diagnosis using the Midland Lung Cancer Register Ross Lawrenson
Alcohol use in advanced age: Findings from LiLACS NZ
 Alcohol use in advanced age: Findings from LiLACS NZ Te Puāwaitanga O Ngā Tapuwae Kia Ora Tonu This report presents key findings about alcohol use in advanced age including patterns of use and the relationship
TARGETS To reduce the age-standardised mortality rate from cervical cancer in all New Zealand women to 3.5 per or less by the year 2005.
 Cervical Cancer Key points Annually, around 85 women die from, and 230 women are registered with, cervical cancer. The decline in both incidence and mortality rates for cervical cancer has accelerated
Drug related deaths and hospital admissions in Lincolnshire
 Drug related deaths and hospital admissions in Lincolnshire 1. Drug related deaths The Office for National Statistics defines drug related deaths where the underlying cause has been coded to: Mental and
SUICIDE PREVENTION OUTCOME FRAMEWORK
 SUICIDE PREVENTION OUTCOME FRAMEWORK The purpose of this population-based outcome framework is to strengthen intersectoral efforts to reduce the incidence and rate of suicide in Aotearoa/New Zealand. Prepared
INFLUENZA WEEKLY UPDATE
 INFLUENZA WEEKLY UPDATE 29/28: 6-12 July 29 The national influenza surveillance system in New Zealand is an essential public health component for assessing and implementing strategies to control influenza.
Tobacco Trends 2008 A brief update of tobacco use in New Zealand
 Tobacco Trends 2008 A brief update of tobacco use in New Zealand Please note: Care must be taken when comparing smoking rates as rates may vary depending on the survey type, age range of respondents, definition