Nature Biotechnology: doi: /nbt Supplementary Figure 1. Diagram of BBB and brain chips.
|
|
|
- Sophie Roxanne Hawkins
- 5 years ago
- Views:
Transcription
 Schematic of the BBB Chip demonstrates the 3 parts of the chip, Top PDMS channel, membrane and Bottom PDMS channel; (b) Image of 2 BBB Chips, the red color represents the bottom (Endo) channel")
1 Supplementary Figure 1 Diagram of BBB and brain chips. (a) Schematic of the BBB Chip demonstrates the 3 parts of the chip, Top PDMS channel, membrane and Bottom PDMS channel; (b) Image of 2 BBB Chips, the red color represents the bottom (Endo) channel while the blue represents the top (Pericytes/Astrocytes) channel, (c) Schematic of the Brain Chip demonstrates the different parts of the chip, (from top to bottom) the manifold which hold the chip and enables perfusion of the chip, Brain Chip, PDMS gasket, Topas substrate and PC base which hold the chip; (d) Image of Brain Chips, top tube represents the inlet and outlet of the Brain Chips. The orange triangles represent the location of the human neuronal culture. (e) The diagram represents the experimental setup. The red line represents the endothelial media (ablood) whereas the blue line represents the neuronal media (acsf).
2
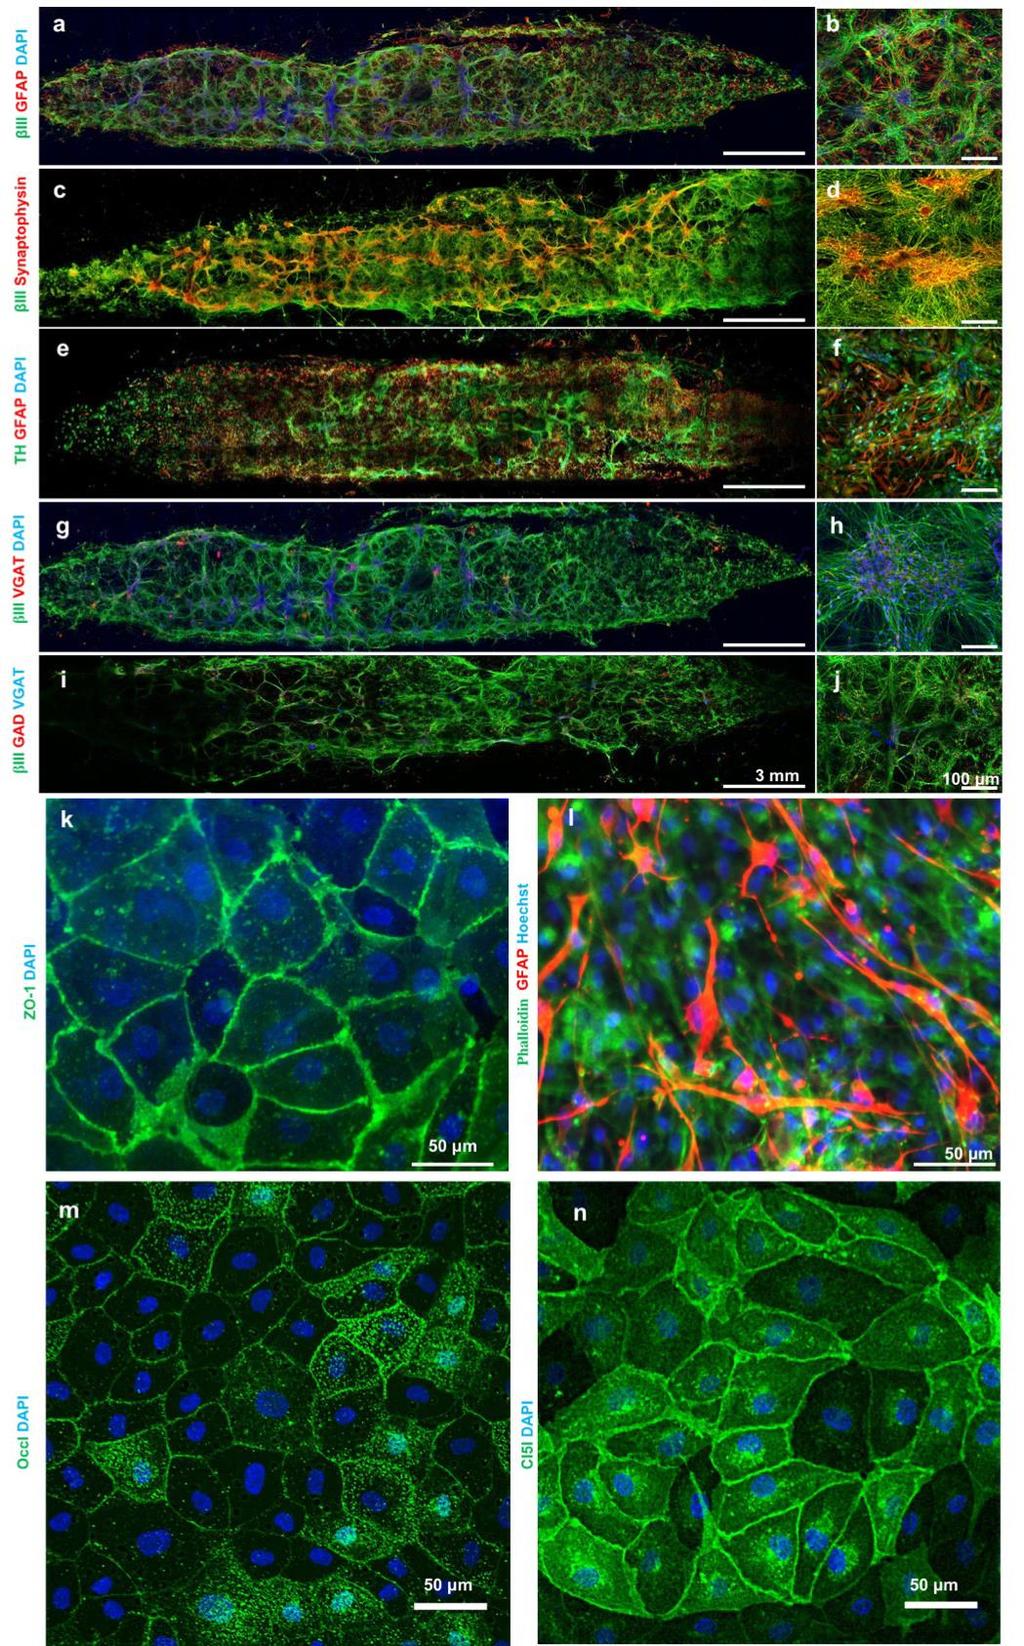
3 Supplementary Figure 2 Immunohistochemical characterization of human neural cell cultures in the brain chip and the neurovascular cells in the BBB chip. (a, b) Confocal images of astrocytes stained for glial fibrillary acidic protein (GFAP, red), neurons stained for β-iii-tubulin (βiii, green) and cell nuclei stained with 4,6-diamidino-2phenylindole (DAPI, blue). (c, d) Confocal images of neurons (βiii, green), synapses (synaptophysin, red) and cell nuclei (DAPI, blue). (e, f) Confocal images of dopaminergic neurons stained for tyrosine hydroxylase (TH, green), astrocytes (GFAP, red) and cell nuclei (DAPI, blue). (g, h) Confocal images of neurons (βiii, green), GABAergic neurons stained for vesicular gamma-aminobutiric acid transporter (VGAT, red) and cell nuclei (DAPI, blue). (i, j) Confocal micrographs of neurons (βiii, green), glutamatergic neurons stained for glutamate decarboxylase (GAD, red) and GABAergic neurons (VGAT, blue). (a, c, e, g, i) scale bars = 3 mm; (b, d, f, h, j) scale bars = 100 μm. (k, l) Demonstration of different cell types that comprise the BBB: (k) Endothelial cells (ZO-1, green, nuclei, blue), (l) Pericytes (Phalloidin, green) and Astrocytes (GFAP, red) and nuclei, blue. Scale bar = 50 μm.(m) Endothelial cells (Occludin, green, nuclei, blue), (n) Endothelial cells (Claudin-5, green, nuclei, blue). More than 10 cultures have been replicated and characterized with immunofluorescence for each condition with similar results.

4 Supplementary Figure 3 Flow velocity in the model system (a) Simulation of flow distribution in the coupled chip setup (COMSOL ). Model illustrates precise control of fluidic flow using our microfluidic platform to accurately mimic the differential flow velocities found throughout the BBB-Brain-BBB Chips. Flow distribution confirms our coupled system follows laminar flow with lower velocities applied to the apical channels of the BBB Chip and Brain Chip with a higher velocity found in the basal or vascular component of the BBB Chip.
5 Supplementary Figure 4 Permeability measurements in the empty BBB-brain-BBB system. (a) Mean fluorescence intensity measurement of cascade blue-containing medium at different points of the system: vascular component of influx BBB, inlet of Brain Chip, inlet of the brain side of efflux BBB and outlet of the vascular side of efflux BBB. Values are presented as percentage of cascade blue (CB) fluorescence intensity of medium flowing into the system at the inlet vascular part of the influx BBB. N=5 for Vessel 1 and N= 3 for Perivasc.1, Brain and Vessel 2, N representing independent NVU systems, (p values: SI Notes, Supplementary Table 1b.) (b) Mean fluorescence intensity measurement of Alexa-555 labeled BSA (BSA-555) at different points throughout the system. Values are presented as percentage of the BSA-555 intensity values of the medium flowing into the system at the inlet vascular component of the influx BBB microfluidic device (p values: SI Notes, Supplementary Table 1b.). Error bars are SEM, N=5 for Vessel 1 and N= 3 for Perivasc.1, Brain and Vessel 2, significance calculated with one-way ANOVA, Bonferroni post-test.
6
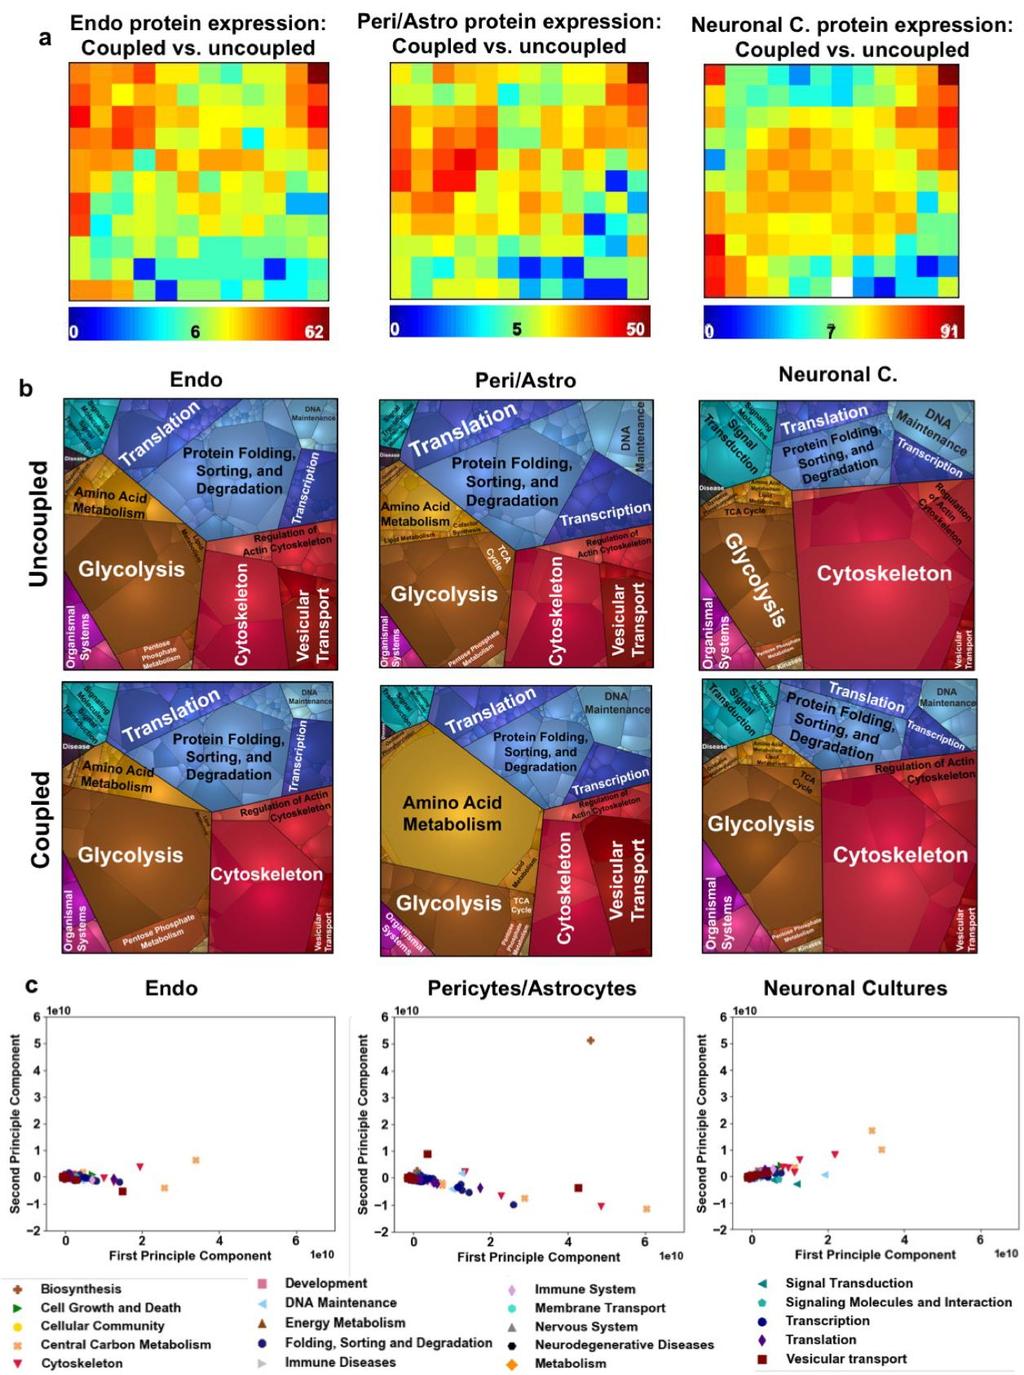
7 Supplementary Figure 5 Protein cluster density maps for GEDI Figure 2 and breakdown of the biological processes associated with NVU compartment proteomes. (a) Mosaics representing the number of proteins that were assigned to each cluster (i.e. tile) in the mosaic after SOM training. These mosaics illustrate the distribution of proteins across the global expression profile GEDI maps shown in Fig. 2. The data are reduced dimensionality by classifying proteins with similar expression profiles into discrete groups that are organized into distinct twodimensional mosaics. Each tile of these mosaics represents a cluster of proteins and the mapping of proteins to these tiles is conserved across samples to facilitate comparison. Thus, the tiles represent the amount of proteins that have the same expression profile, ranging from low numbers illustrated in blue and high numbers in red. The protein expression for each of the NVU compartments (Endo, Peri/Astro and Neurons) was compared between the uncoupled and coupled conditions. (b). Proteomaps illustrate the KEGG Orthology biological process terms associated with low and high abundance proteins observed in the expression profiles of fluidically uncoupled chips compartments of endothelial cells, pericyte/astrocyte and neuronal/astrocyte cultures contrasted with expression values observed in coupled BBB-Brain-BBB Chips. In these Voronoi diagrams, each individual polygon represents one protein, wherein polygon area is a function of mass abundance. Each polygon is color-coded according to the KEGG Orthology term associated with it, and polygons representing the same KEGG Orthology term are clustered into larger polygons to form the map (Supplementary Video 3-8). The percentage of the protein expression profiles represented by each KEGG Orthology term shown in the Proteomaps is presented in Fig. 2b. (c) Principle component analysis (PCA) was used to assess the variability in global protein expression observed in the coupled and uncoupled cell populations for each compartment of the BBB and Brain Chips N=3 representing independent NVU systems.
 The BBB Chip influx recapitulates tight barrier preventing penetration of an antibody (anti-glur2, pink y-shaped objects) from the vascular to the perivascular compartment during control")
8 Supplementary Figure 6 GluR2 penetration across the barrier after Meth addition, schematic of experiment shown in Figure 3. (a) The BBB Chip influx recapitulates tight barrier preventing penetration of an antibody (anti-glur2, pink y-shaped objects) from the vascular to the perivascular compartment during control conditions. (b) 24 hrs of Meth addition compromises the barrier, allowing the anti-glur2 to stain the neurons. Due to the low concentration of Meth reaching the BBB Chip efflux, the barrier stayed intact. (c) 24 hrs after Meth withdrawal resulted in recovery of the Chip influx while anti-glur2 remains attached to the neurons.
9 Supplementary Figure 7 Effect of Meth on the barrier properties of the BBB. (a-b) Meth dose response of TEER values for a BBB Transwell model. Mean values are represented as percentage of control (untreated well). (a) Meth concentrations were applied 24hrs and (b) recovery for 24 hrs after Meth removal. Error bars are SEM, N=2. (c) Effect of Meth on neuronal viability in the Brain Chip. Cell viability of neurons treated with 1 mm Meth. Dead cells were stained with ethidium homodimer while all cells were stained with DAPI and images were analyzed with a custom MATLAB script. Results are presented as percentage of live and dead cells, (p values: for each group, the p values for the live vs. dead was <0.0001, SI Notes, Supplementary Table 1b.). Error bars are SEM, N=3 neuronal cultures, were field of views were taken for each culture, in order to calculate the mean value for each setup. significance calculated with one-way ANOVA, Bonferroni post-test.
10 Supplementary Figure 8 Mass balance of Meth in the coupled NVU microfluidic system and Meth uptake by cells in well plates. (a) Characterization of Meth dilution in BBB-Brain-BBB Chips. Mass spectrometry analysis of the concentration of Meth in different compartments throughout the system: vascular component of the influx BBB (Vessel 1), inlet of the Brain Chip (Perivasc. 1), outlet of the CSF (Brain) and vascular part of the efflux BBB (Vessel 2). Mean values are represented as percentage of the Meth dose flowed into the system (vascular part of the influx BBB), (p values < SI Notes, Supplementary Table 1b.). N=3 representing independent NVU systems, significance calculated with one-way ANOVA, Bonferroni post-test (b) Mean values of Meth uptake by the neurovascular cell types in well-plates after 24hrs incubation N=3 representing independent NVU systems.

11 Supplementary Figure 9 Perivasculature response to Meth. Immunofluorescence microscopic views of the different cell populations within the influx and efflux BBB Chip in the fluidically coupled NVU system. Perivascular cells stained with astrocyte specific glial fibrillary associated protein (GFAP) and general F-actin staining with Phalloidin demonstrated consistent morphology in the influx and efflux BBB. The cell morphology was compared between steady state (a, b), addition of Meth (c, d), and drug removal (e, f). Administration of Meth for 24 hrs demonstrated only a minor change in perivascular cell morphology of mostly GFAP-negative cells (pericytes and GFAP-negative astrocytes) in the influx BBB (c), whereas efflux BBB maintained the control morphology (d). 24 hrs recovery restored the morphology of the influx BBB Chip (e) which is now identical to the efflux BBB (f). The experiment represented by the immunofluorescence micrographs was repeated 3 times with 2-4 individual NVU systems for each repeat.
12
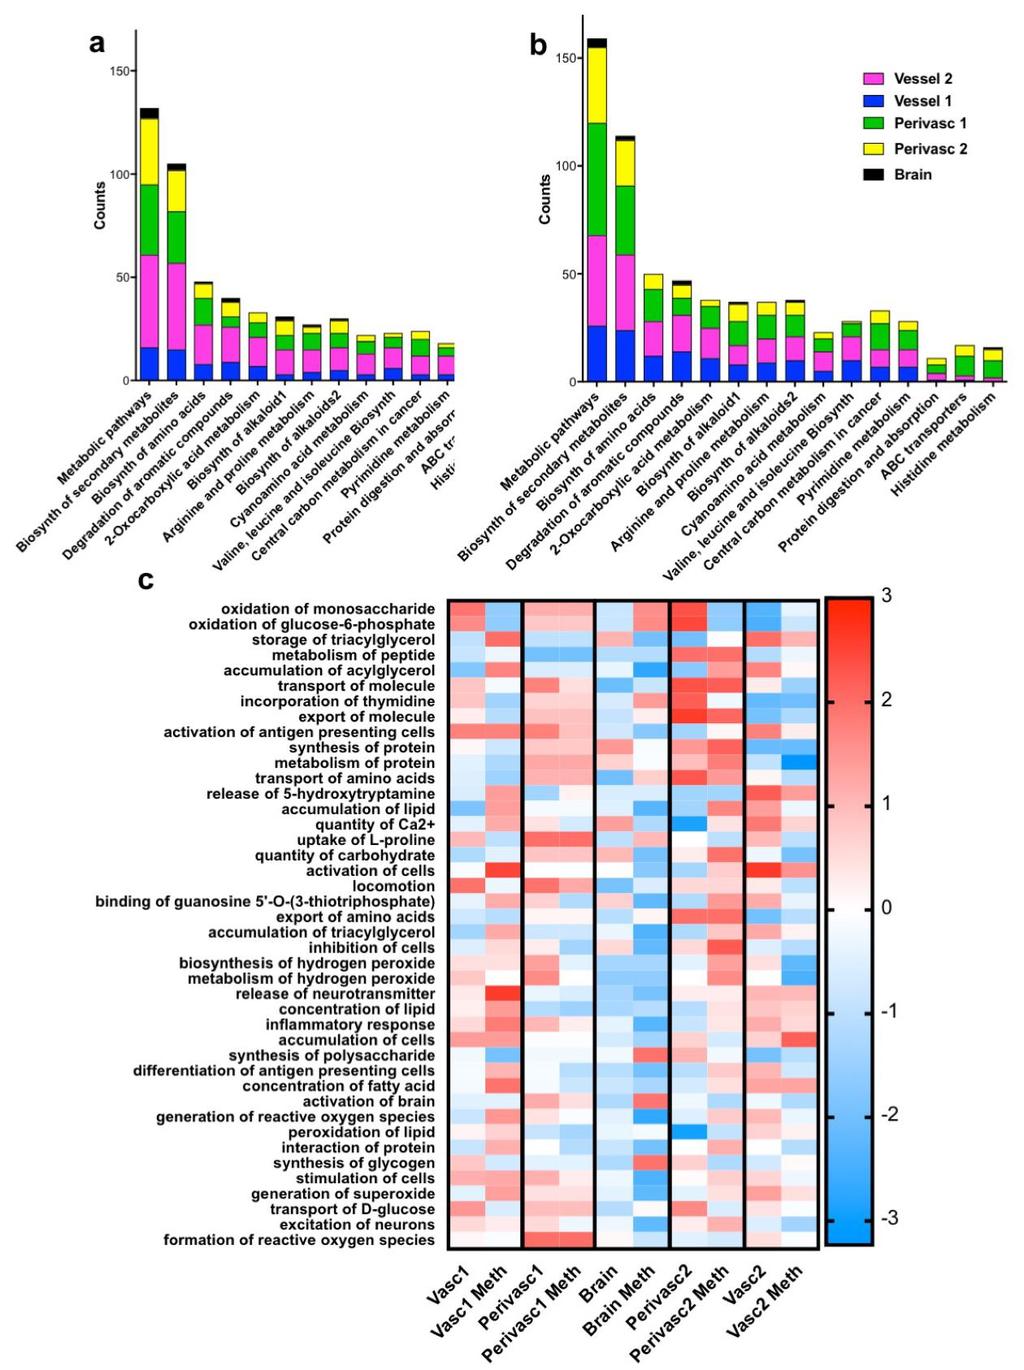
13 Supplementary Figure 10 Untargeted metabolism. Potential biochemical pathways associated with significant metabolic changes identified by MS analysis (Compound Discoverer) within cells in the vascular compartment of the influx or efflux BBB Chips (Vessel 1 or 2, respectively), perivascular compartments of the influx or efflux BBB Chips (Perivasc 1 or 2, respectively), or the lower compartment of the Brain Chip (Brain) within the coupled NVU system under control conditions (b) or exposed to Meth for 24 hrs (c). Vessel 1 (Blue), Vessel 2 (Magenta), Perivasc 1 (Green), Perivasc 2 (Yellow) and Brain (Black). (c) IPA was used to identify the significant Disease Pathways together with Biofunction and their regulation which change due to Meth administration, using Z-score, (Z-score scale: red, high Z-score, pathway is upregulated, blue, low Z-score, pathway is downregulated)
 Exploded illustration of the glycolysis and TCA cycles highlighting the modifications to each carbon entity during all steps in the pathway.")
14 Supplementary Figure 11 Metabolic cycle of labelled glucose. (a) Exploded illustration of the glycolysis and TCA cycles highlighting the modifications to each carbon entity during all steps in the pathway. In our system, we used all carbons C 13 labeled glucose (referred to as 6C 13 ; i.e, when a molecule had 2 carbons C 13 it was referred as 2C 13 ) to illustrate the glycolysis processes of each carbon. (b) Distribution of the number of C 13 -labelled carbons in glucose and glutamate in the fluidically coupled NVU system. (c) Distribution of the number of C 13 -labelled carbons in glucose and glutamate in the uncoupled Brain Chip as it was perfused with C 13 -labeled glucose, lactate and pyruvate.
15 Supplementary Figure 12 Theoretical metabolic flux balance analysis. Theoretical metabolic flux balance analysis of the GABA production in synaptic cleft as the neurons can uptake exogenous pyruvate and lactate without the astrocytes contribution (while Fig. 6d display the exogenous uptake by the astrocytes and directly supplying to neurons). The GABA exchange is shown as a function of the uptake of glucose or equal amounts of lactate and pyruvate in the presence or absence of metabolites in parentheses. All fluxes are reported as µmol g wet brain -1 min -1.
1. Microfluidic device characteristics and cell compartmentalization
 Supplementary figures: 1. Microfluidic device characteristics and cell compartmentalization Microfluidic channels were molded in PDMS (Fig. S1 A and B) over silicon masters, which were structured with
3D Tissue Models. Simple, Low Cost Fabrication. Simple, Robust Protocols
 3D Tissue Models SynVivo is a physiological, cell-based microfluidic platform that provides a morphologically and physiologically realistic microenvironment allowing real-time study of cellular behavior,
The blood-brain barrier: barrier or customs border?
 The blood-brain barrier: barrier or customs border? Jerome Badaut, Phd Brain Molecular Imaging group Badaut et al. 2000 Neuro (green) vascular (red) unit (NVU) (Obenaus, Coats, Krucker) (brain s vascular
SUPPLEMENTARY FIG. S2. Representative counting fields used in quantification of the in vitro neural differentiation of pattern of dnscs.
 Supplementary Data SUPPLEMENTARY FIG. S1. Representative counting fields used in quantification of the in vitro neural differentiation of pattern of anpcs. A panel of lineage-specific markers were used
Supplementary Figure 1
 Supplementary Figure 1 The average sigmoid parametric curves of capillary dilation time courses and average time to 50% peak capillary diameter dilation computed from individual capillary responses averaged
Supplementary Figure 1. Validation of astrocytes. Primary astrocytes were
 Supplementary Figure 1. Validation of astrocytes. Primary astrocytes were separated from the glial cultures using a mild trypsinization protocol. Anti-glial fibrillary acidic protein (GFAP) immunofluorescent
What Cell Make Up the Brain and Spinal Cord
 What Cell Make Up the Brain and Spinal Cord Jennifer LaVail, Ph.D. (http://anatomy.ucsf.edu/pages/lavaillab/index.html) What kinds of cells are these?" Neuron?" Epithelial cell?" Glial cell?" What makes
Supplementary Data Dll4-containing exosomes induce capillary sprout retraction ina 3D microenvironment
 Supplementary Data Dll4-containing exosomes induce capillary sprout retraction ina 3D microenvironment Soheila Sharghi-Namini 1, Evan Tan 1,2, Lee-Ling Sharon Ong 1, Ruowen Ge 2 * and H. Harry Asada 1,3
mm Distance (mm)
") b a Magnet Illumination Coverslips MPs Objective 2575 µm 1875 µm 1575 µm 1075 µm 875 µm 545 µm 20µm 2 3 0.5 0.3mm 1 1000 100 10 1 0.1 1000 100 10 1 0.1 Field Induction (Gauss) 1.5 0 5 10 15 20 Distance
b a Magnet Illumination Coverslips MPs Objective 2575 µm 1875 µm 1575 µm 1075 µm 875 µm 545 µm 20µm 2 3 0.5 0.3mm 1 1000 100 10 1 0.1 1000 100 10 1 0.1 Field Induction (Gauss) 1.5 0 5 10 15 20 Distance
label the basement membrane). Different fixation methods of EB-perfused P8 mice to optimize the combination
. Different fixation methods of EB-perfused P8 mice to optimize the combination") Supplementary Figure 1 Optimization of the tissue fixation protocol to combine EB perfusion and IB4 endothelial tip cell staining in the postnatal mouse brain. a-l Labeling of EB-perfused P8 mice with
Supplementary Figure 1 Optimization of the tissue fixation protocol to combine EB perfusion and IB4 endothelial tip cell staining in the postnatal mouse brain. a-l Labeling of EB-perfused P8 mice with
A Precise Bicoid Gradient is Nonessential During Cycles for Precise Patterning in the Drosophila Blastoderm
 Supporting Information for A Precise Bicoid Gradient is Nonessential During Cycles 11-13 for Precise Patterning in the Drosophila Blastoderm Elena M. Lucchetta, Meghan E. Vincent and Rustem F. Ismagilov*
Nature Neuroscience: doi: /nn Supplementary Figure 1
 Supplementary Figure 1 Subcellular segregation of VGluT2-IR and TH-IR within the same VGluT2-TH axon (wild type rats). (a-e) Serial sections of a dual VGluT2-TH labeled axon. This axon (blue outline) has
Human recombinat MIF protein (hrmif), MW: Da. m/z. hrmif ( Da) + 4-IPP (282 Da) MWtot ~ Da. m/z.
, MW: Da. m/z. hrmif ( Da) + 4-IPP (282 Da) MWtot ~ Da. m/z.") Intensity % Intensity % A Human recombinat MIF protein (hrmif), MW: 12428.31 Da m/z hrmif (12428.31 Da) + 4-IPP (282 Da) MWtot ~ 12715.21 Da m/z B HTC/C3 DAPI phistone-h3 Merge HTC/C3 DAPI phistone-h3
Intensity % Intensity % A Human recombinat MIF protein (hrmif), MW: 12428.31 Da m/z hrmif (12428.31 Da) + 4-IPP (282 Da) MWtot ~ 12715.21 Da m/z B HTC/C3 DAPI phistone-h3 Merge HTC/C3 DAPI phistone-h3
ROCK/Cdc42-mediated microglial motility and gliapse formation lead to phagocytosis of degenerating dopaminergic neurons in vivo
 Supplementary Information ROCK/Cdc42-mediated microglial motility and gliapse formation lead to phagocytosis of degenerating dopaminergic neurons in vivo Carlos Barcia* 1,2, Carmen M Ros 1,2, Valentina
SUPPLEMENTARY INFORMATION
 SUPPLEMENTARY INFORMATION doi:10.1038/nature11306 Supplementary Figures Supplementary Figure 1. Basic characterization of GFP+ RGLs in the dentate gyrus of adult nestin-gfp mice. a, Sample confocal images
SUPPLEMENTARY INFORMATION
 SUPPLEMENTARY INFORMATION Advances in pancreatic islet monolayer culture on glass surfaces enable superresolution microscopy and insights into beta cell ciliogenesis and proliferation Edward A. Phelps,
Silver nanoparticles (AgNPs) cause degeneration of cytoskeleton and disrupt synaptic machinery of cultured cortical neurons
 cause degeneration of cytoskeleton and disrupt synaptic machinery of cultured cortical neurons") Xu et al. Molecular Brain 2013, 6:29 RESEARCH Open Access Silver nanoparticles (AgNPs) cause degeneration of cytoskeleton and disrupt synaptic machinery of cultured cortical neurons Fenglian Xu 1,2*, Cortt
Xu et al. Molecular Brain 2013, 6:29 RESEARCH Open Access Silver nanoparticles (AgNPs) cause degeneration of cytoskeleton and disrupt synaptic machinery of cultured cortical neurons Fenglian Xu 1,2*, Cortt
Nature Methods: doi: /nmeth Supplementary Figure 1
 Supplementary Figure 1 Finite-element analysis of cell cluster dynamics in different cluster trap architectures. (a) Cluster-Chip (b) Filter (c) A structure identical to the Cluster-Chip except that one
Supplementary information - Table (1), Figures (12), and Videos (5)
, Figures (12), and Videos (5)") Supplementary information - Table (1), Figures (12), and Videos (5) A soft, transparent, freely accessible cranial window for chronic imaging and electrophysiology Chaejeong Heo 1, Hyejin Park 1, 2, Yong-Tae
Supplementary information - Table (1), Figures (12), and Videos (5) A soft, transparent, freely accessible cranial window for chronic imaging and electrophysiology Chaejeong Heo 1, Hyejin Park 1, 2, Yong-Tae
Supplementary Figure 1. SDS-FRL localization of CB 1 in the distal CA3 area of the rat hippocampus. (a-d) Axon terminals (t) in stratum pyramidale
 Axon terminals (t) in stratum pyramidale") Supplementary Figure 1. SDS-FRL localization of CB 1 in the distal CA3 area of the rat hippocampus. (a-d) Axon terminals (t) in stratum pyramidale (b) show stronger immunolabeling for CB 1 than those in
Supplementary Figure 1. SDS-FRL localization of CB 1 in the distal CA3 area of the rat hippocampus. (a-d) Axon terminals (t) in stratum pyramidale (b) show stronger immunolabeling for CB 1 than those in
SUPPLEMENTARY INFORMATION
 DOI: 10.1038/ncb2988 Supplementary Figure 1 Kif7 L130P encodes a stable protein that does not localize to cilia tips. (a) Immunoblot with KIF7 antibody in cell lysates of wild-type, Kif7 L130P and Kif7
Assay Name: Transwell migration using DAPI
 Assay Name: Transwell migration using DAPI Assay ID: Celigo_04_0001 Table of Contents Experiment: Identification of cells which have migrated through the membrane of a transwell insert....2 Celigo Setup...2
SUPPLEMENTARY INFORMATION
 SUPPLEMENTARY INFORMATION Human cerebral cortex development from pluripotent stem cells to functional excitatory synapses Yichen Shi 1,2, Peter Kirwan 1,2, James Smith 1,2, Hugh P.C. Robinson 3 and Frederick
Postn MCM Smad2 fl/fl Postn MCM Smad3 fl/fl Postn MCM Smad2/3 fl/fl. Postn MCM. Tgfbr1/2 fl/fl TAC
 A Smad2 fl/fl Smad3 fl/fl Smad2/3 fl/fl Tgfbr1/2 fl/fl 1. mm B Tcf21 MCM Tcf21 MCM Smad3 fl/fl Tcf21 MCM Smad2/3 fl/fl Tcf21 MCM Tgfbr1/2 fl/fl αmhc MCM C 1. mm 1. mm D Smad2 fl/fl Smad3 fl/fl Smad2/3
SUPPLEMENTARY INFORMATION
 DOI:.38/ncb3399 a b c d FSP DAPI 5mm mm 5mm 5mm e Correspond to melanoma in-situ Figure a DCT FSP- f MITF mm mm MlanaA melanoma in-situ DCT 5mm FSP- mm mm mm mm mm g melanoma in-situ MITF MlanaA mm mm
BLOOD-BRAIN BARRIER MODELS IN CHIP DEVICES
 BLOOD-BRAIN BARRIER MODELS IN CHIP DEVICES Mária A. Deli Institute of Biophysics, Biological Research Centre Hungarian Academy of Sciences, Szeged, Hungary Centre of Excellence of the European Union WHAT
Dep. Control Time (min)
") aa Control Dep. RP 1s 1 mv 2s 1 mv b % potentiation of IPSP 2 15 1 5 Dep. * 1 2 3 4 Time (min) Supplementary Figure 1. Rebound potentiation of IPSPs in PCs. a, IPSPs recorded with a K + gluconate pipette
aa Control Dep. RP 1s 1 mv 2s 1 mv b % potentiation of IPSP 2 15 1 5 Dep. * 1 2 3 4 Time (min) Supplementary Figure 1. Rebound potentiation of IPSPs in PCs. a, IPSPs recorded with a K + gluconate pipette
Supplementary Materials for
 advances.sciencemag.org/cgi/content/full/3/8/e1700521/dc1 Supplementary Materials for Functional vascularized lung grafts for lung bioengineering N. Valerio Dorrello, Brandon A. Guenthart, John D. O Neill,
Electronic Supplementary Information (ESI) for Lab on a Chip. This journal is The Royal Society of Chemistry 2012
 for Lab on a Chip. This journal is The Royal Society of Chemistry 2012") Electronic Supplementary Information (ESI) for Lab on a Chip Electronic Supplementary Information Construction of oxygen and chemical concentration gradients in a single microfluidic device for studying
Electronic Supplementary Information (ESI) for Lab on a Chip Electronic Supplementary Information Construction of oxygen and chemical concentration gradients in a single microfluidic device for studying
Supplementary Information
 Supplementary Information Title Degeneration and impaired regeneration of gray matter oligodendrocytes in amyotrophic lateral sclerosis Authors Shin H. Kang, Ying Li, Masahiro Fukaya, Ileana Lorenzini,
Fluorescence Microscopy
 Fluorescence Microscopy Imaging Organelles Mitochondria Lysosomes Nuclei Endoplasmic Reticulum Plasma Membrane F-Actin AAT Bioquest Introduction: Organelle-Selective Stains Organelles are tiny, specialized
Nature Neuroscience: doi: /nn Supplementary Figure 1
 Supplementary Figure 1 Atlas representations of the midcingulate (MCC) region targeted in this study compared against the anterior cingulate (ACC) region commonly reported. Coronal sections are shown on
Nature Structural and Molecular Biology: doi: /nsmb Supplementary Figure 1
 Supplementary Figure 1 Mutational analysis of the SA2-Scc1 interaction in vitro and in human cells. (a) Autoradiograph (top) and Coomassie stained gel (bottom) of 35 S-labeled Myc-SA2 proteins (input)
INTRODUCTION. This material is quoted from below PDF and modified.
 INTRODUCTION While drug response profiling of cancer cells in two-dimensional culture has been a mainstay of predictive biomarker discovery and anti-cancer drug development, there are aspects of tumor
Supplementary table and figures
 3D single molecule tracking with multifocal plane microscopy reveals rapid intercellular transferrin transport at epithelial cell barriers Sripad Ram, Dongyoung Kim, Raimund J. Ober and E. Sally Ward Supplementary
SUPPLEMENTARY INFORMATION
 Supplementary Figure 1. Normal AMPAR-mediated fepsp input-output curve in CA3-Psen cdko mice. Input-output curves, which are plotted initial slopes of the evoked fepsp as function of the amplitude of the
Neurovascular Coupling
 Cerebral Blood Flow and Brain Activation UCLA NITP July 2012 Neurovascular Coupling Richard B. Buxton University of California, San Diego rbuxton@ucsd.edu... The subject to be observed lay on a delicately
CEREBRAL BLOOD FLOW AND METABOLISM
 Supported by: HURO/0901/069/2.3.1 HU-RO-DOCS CEREBRAL BLOOD FLOW AND METABOLISM Part 11. Cerebral blood flow Supplies cerebral metabolism demanded by neuronal function Is required for the production and
C-peptide and Zinc Delivery to Erythrocytes Requires the Presence of Albumin: Implications in Diabetes Explored with a 3D-printed Fluidic Device
 Electronic Supplementary Material (ESI) for Integrative Biology. This journal is The Royal Society of Chemistry 215 Supplementary Information C-peptide and Zinc Delivery to Erythrocytes Requires the Presence
Social stress induces neurovascular pathology promoting depression
 SUPPLEMENTARY INFORMATION Articles https://doi.org/10.1038/s41593-017-0010-3 In the format provided by the authors and unedited. Social stress induces neurovascular pathology promoting depression Caroline
GFP/Iba1/GFAP. Brain. Liver. Kidney. Lung. Hoechst/Iba1/TLR9!
 Supplementary information a +KA Relative expression d! Tlr9 5!! 5! NSC Neuron Astrocyte Microglia! 5! Tlr7!!!! NSC Neuron Astrocyte! GFP/Sβ/! Iba/Hoechst Microglia e Hoechst/Iba/TLR9! GFP/Iba/GFAP f Brain
Supplementary Figure 1) GABAergic enhancement by leptin hyperpolarizes POMC neurons A) Representative recording samples showing the membrane
 GABAergic enhancement by leptin hyperpolarizes POMC neurons A) Representative recording samples showing the membrane") Supplementary Figure 1) GABAergic enhancement by leptin hyperpolarizes POMC neurons A) Representative recording samples showing the membrane potential recorded from POMC neurons following treatment with
Supplementary Figure 1) GABAergic enhancement by leptin hyperpolarizes POMC neurons A) Representative recording samples showing the membrane potential recorded from POMC neurons following treatment with
Nature Methods: doi: /nmeth.4257
 Supplementary Figure 1 Screen for polypeptides that affect cellular actin filaments. (a) Table summarizing results from all polypeptides tested. Source shows organism, gene, and amino acid numbers used.
Nervous System. Master controlling and communicating system of the body. Secrete chemicals called neurotransmitters
 Nervous System Master controlling and communicating system of the body Interacts with the endocrine system to control and coordinate the body s responses to changes in its environment, as well as growth,
Supplementary Figure 1. GABA depolarizes the majority of immature neurons in the
 Supplementary Figure 1. GABA depolarizes the majority of immature neurons in the upper cortical layers at P3 4 in vivo. (a b) Cell-attached current-clamp recordings illustrate responses to puff-applied
Nature Neuroscience: doi: /nn Supplementary Figure 1. PICALM expression in brain capillary endothelium in human brain and in mouse brain.
 Supplementary Figure 1 PICALM expression in brain capillary endothelium in human brain and in mouse brain. a, Double immunostaining for PICALM (red, left) and lectin positive endothelial profiles (blue,
Supplementary Materials for
 www.sciencesignaling.org/cgi/content/full/7/308/ra4/dc1 Supplementary Materials for Antipsychotics Activate mtorc1-dependent Translation to Enhance Neuronal Morphological Complexity Heather Bowling, Guoan
Supplementary figure legends
 Supplementary figure legends Supplementary Figure 1. Exposure of CRT occurs independently from the apoptosisassociated loss of the mitochondrial membrane potential (MMP). (A) HeLa cells treated with MTX
Supplementary Figure 1: GFAP positive nerves in patients with adenocarcinoma of
 SUPPLEMENTARY FIGURES AND MOVIE LEGENDS Supplementary Figure 1: GFAP positive nerves in patients with adenocarcinoma of the pancreas. (A) Images of nerves stained for GFAP (green), S100 (red) and DAPI
Transcriptional and Epigenetic Mechanisms of Addiction
 Transcriptional and Epigenetic Mechanisms of Addiction Eric J. Nestler Mount Sinai School of Medicine New York, NY Dr. Ray Fuller There is every reason to be optimistic that in the future we will find
Bone marrow-derived mesenchymal stem cells improve diabetes-induced cognitive impairment by
 Nakano et al. Supplementary information 1. Supplementary Figure 2. Methods 3. References Bone marrow-derived mesenchymal stem cells improve diabetes-induced cognitive impairment by exosome transfer into
Structural basis for the role of inhibition in facilitating adult brain plasticity
 Structural basis for the role of inhibition in facilitating adult brain plasticity Jerry L. Chen, Walter C. Lin, Jae Won Cha, Peter T. So, Yoshiyuki Kubota & Elly Nedivi SUPPLEMENTARY FIGURES 1-6 a b M
Supplementary Figure 1. Nature Neuroscience: doi: /nn.4547
 Supplementary Figure 1 Characterization of the Microfetti mouse model. (a) Gating strategy for 8-color flow analysis of peripheral Ly-6C + monocytes from Microfetti mice 5-7 days after TAM treatment. Living
Neuropharmacology NOTES
 Neuropharmacology NOTES Contents Topic Page # Lecture 1- Intro to Neurochemical Transmission & Neuromodulation 2 Lecture 2- Serotonin & Noradrenaline 7 Lecture 3- Acetylcholine & Dopamine 14 Lecture 4-
Nature Neuroscience: doi: /nn.2275
 Supplementary Figure S1. The presence of MeCP2 in enriched primary glial cultures from rat or mouse brains is not neuronal. Western blot analysis of protein extracts from (a) rat glial and neuronal cultures.
Santulli G. et al. A microrna-based strategy to suppress restenosis while preserving endothelial function
 ONLINE DATA SUPPLEMENTS Santulli G. et al. A microrna-based strategy to suppress restenosis while preserving endothelial function Supplementary Figures Figure S1 Effect of Ad-p27-126TS on the expression
Supplementary Figure 1. EC-specific Deletion of Snail1 Does Not Affect EC Apoptosis. (a,b) Cryo-sections of WT (a) and Snail1 LOF (b) embryos at
 Cryo-sections of WT (a) and Snail1 LOF (b) embryos at") Supplementary Figure 1. EC-specific Deletion of Snail1 Does Not Affect EC Apoptosis. (a,b) Cryo-sections of WT (a) and Snail1 LOF (b) embryos at E10.5 were double-stained for TUNEL (red) and PECAM-1 (green).
Supplementary Figure 1. EC-specific Deletion of Snail1 Does Not Affect EC Apoptosis. (a,b) Cryo-sections of WT (a) and Snail1 LOF (b) embryos at E10.5 were double-stained for TUNEL (red) and PECAM-1 (green).
Synapses and Neurotransmitters
 Synapses and Neurotransmitters Communication Between Neurons Synapse: A specialized site of contact, and transmission of information between a neuron and an effector cell Anterior Motor Neuron Figure 45-5
Wenqin Hu, Cuiping Tian, Tun Li, Mingpo Yang, Han Hou & Yousheng Shu
 Distinct contributions of Na v 1.6 and Na v 1.2 in action potential initiation and backpropagation Wenqin Hu, Cuiping Tian, Tun Li, Mingpo Yang, Han Hou & Yousheng Shu Supplementary figure and legend Supplementary
J. Cell Sci. 129: doi: /jcs : Supplementary information
 Movie 1. AgLDL is contained in small sub-regions of the lysosomal synapse that are acidic. J774 cells were incubated with agldl dual labeled with a ph sensitive and a ph insensitive fluorophore for 1 hr.
SUPPLEMENTARY INFORMATION
 In the format provided by the authors and unedited. SUPPLEMENTARY INFORMATION VOLUME: 2 ARTICLE NUMBER: 17084 Metabolic anticipation in Mycobacterium tuberculosis Hyungjin Eoh, Zhe Wang, Emilie Layre,
Supplementary Materials for
 www.sciencesignaling.org/cgi/content/full/6/283/ra57/dc1 Supplementary Materials for JNK3 Couples the Neuronal Stress Response to Inhibition of Secretory Trafficking Guang Yang,* Xun Zhou, Jingyan Zhu,
Simulation of Chemotractant Gradients in Microfluidic Channels to Study Cell Migration Mechanism in silico
 Simulation of Chemotractant Gradients in Microfluidic Channels to Study Cell Migration Mechanism in silico P. Wallin 1*, E. Bernson 1, and J. Gold 1 1 Chalmers University of Technology, Applied Physics,
Nature Neuroscience: doi: /nn Supplementary Figure 1. MADM labeling of thalamic clones.
 Supplementary Figure 1 MADM labeling of thalamic clones. (a) Confocal images of an E12 Nestin-CreERT2;Ai9-tdTomato brain treated with TM at E10 and stained for BLBP (green), a radial glial progenitor-specific
Name Animal source Vendor Cat # Dilutions
 Supplementary data Table S1. Primary and Secondary antibody sources Devi et al, TXNIP in mitophagy A. Primary Antibodies Name Animal source Vendor Cat # Dilutions 1. TXNIP mouse MBL KO205-2 1:2000 (WB)
Pyruvate Alanine 0.15 *** ** ***
 SUPPLEMENTARY FIGURES Glucose ΔµM from fresh media / mg protein -1-2 -3 - -.1 -.3 -.5 Lactate Alanine Formate ΔµM from fresh media / mg protein 5 3 2 1.15.1.5.6..2.. NS-3 WT-NS G93A-NS Supplementary Figure
Supplementary Figure 1. Properties of various IZUMO1 monoclonal antibodies and behavior of SPACA6. (a) (b) (c) (d) (e) (f) (g) .
 (b) (c) (d) (e) (f) (g) .") Supplementary Figure 1. Properties of various IZUMO1 monoclonal antibodies and behavior of SPACA6. (a) The inhibitory effects of new antibodies (Mab17 and Mab18). They were investigated in in vitro fertilization
Supplementary Figure 1. Properties of various IZUMO1 monoclonal antibodies and behavior of SPACA6. (a) The inhibitory effects of new antibodies (Mab17 and Mab18). They were investigated in in vitro fertilization
Supplementary Information
 Nature Immunology doi:1.138/ni.2477 Supplementary Information Capillary and arteriolar pericytes attract innate leukocytes exiting through venules and instruct them with pattern recognition and motility
c Ischemia (30 min) Reperfusion (8 w) Supplementary Figure bp 300 bp Ischemia (30 min) Reperfusion (4 h) Dox 20 mg/kg i.p.
 Reperfusion (8 w) Supplementary Figure bp 300 bp Ischemia (30 min) Reperfusion (4 h) Dox 20 mg/kg i.p.") a Marker Ripk3 +/ 5 bp 3 bp b Ischemia (3 min) Reperfusion (4 h) d 2 mg/kg i.p. 1 w 5 w Sacrifice for IF size A subset for echocardiography and morphological analysis c Ischemia (3 min) Reperfusion (8
a Marker Ripk3 +/ 5 bp 3 bp b Ischemia (3 min) Reperfusion (4 h) d 2 mg/kg i.p. 1 w 5 w Sacrifice for IF size A subset for echocardiography and morphological analysis c Ischemia (3 min) Reperfusion (8
Supplementary Table I Blood pressure and heart rate measurements pre- and post-stroke
 SUPPLEMENTARY INFORMATION doi:10.1038/nature09511 Supplementary Table I Blood pressure and heart rate measurements pre- and post-stroke Pre Post 7-days Systolic Diastolic BPM Systolic Diastolic BPM Systolic
Nature Immunology: doi: /ni eee Supplementary Figure 1
 eee Supplementary Figure 1 Hyphae induce NET release, but yeast do not. (a) NET release by human peripheral neutrophils stimulated with a hgc1 yeast-locked C. albicans mutant (yeast) or pre-formed WT C.
Nature Neuroscience: doi: /nn Supplementary Figure 1. Distribution of starter cells for RV-mediated retrograde tracing.
 Supplementary Figure 1 Distribution of starter cells for RV-mediated retrograde tracing. Parcellation of cortical areas is based on Allen Mouse Brain Atlas and drawn to scale. Thick white curves, outlines
File name: Supplementary Information Description: Supplementary Figures, Supplementary Table and Supplementary References
 File name: Supplementary Information Description: Supplementary Figures, Supplementary Table and Supplementary References File name: Supplementary Data 1 Description: Summary datasheets showing the spatial
Proteomic profiling of small-molecule inhibitors reveals dispensability of MTH1 for cancer cell survival
 Supplementary Information for Proteomic profiling of small-molecule inhibitors reveals dispensability of MTH1 for cancer cell survival Tatsuro Kawamura 1, Makoto Kawatani 1, Makoto Muroi, Yasumitsu Kondoh,
Supplemental Materials Molecular Biology of the Cell
 Supplemental Materials Molecular Biology of the Cell Gilberti et al. SUPPLEMENTAL FIGURE LEGENDS: Figure S1: The effect of pharmacological inhibitors on particle uptake. The data presented in Figure 1
Developing a Kidney on a Chip for Clinical and Translational Research
 Developing a Kidney on a Chip for Clinical and Translational Research Jonathan Himmelfarb, M.D. Director, Kidney Research Institute Joseph W. Eschbach M.D. Endowed Chair for Kidney Research Professor of
marker. DAPI labels nuclei. Flies were 20 days old. Scale bar is 5 µm. Ctrl is
 Supplementary Figure 1. (a) Nos is detected in glial cells in both control and GFAP R79H transgenic flies (arrows), but not in deletion mutant Nos Δ15 animals. Repo is a glial cell marker. DAPI labels
Nature Medicine: doi: /nm.4078
 Supplementary Figure 1. Cetuximab induces ER stress response in DiFi cells. (a) Scheme of SILAC proteome. (b) MS-base read out of SILAC experiment. The histogram of log 2 -transformed normalized H/L ratios
Supplementary Materials for
 www.sciencesignaling.org/cgi/content/full/10/473/eaai7696/dc1 Supplementary Materials for Astrocyte-shed extracellular vesicles regulate the peripheral leukocyte response to inflammatory brain lesions
Fig. S4. Current-voltage relations of iglurs. A-C: time courses of currents evoked by 100 ms pulses
 Fig. S1. Immunohistochemical detection of iglur2 protein in single islet cells. A: α cells identified using glucagon-specific antibody express the iglur2 subtype of AMPA receptor. 24 out of 26 identified
Nature Neuroscience: doi: /nn Supplementary Figure 1. Neuron class-specific arrangements of Khc::nod::lacZ label in dendrites.
 Supplementary Figure 1 Neuron class-specific arrangements of Khc::nod::lacZ label in dendrites. Staining with fluorescence antibodies to detect GFP (Green), β-galactosidase (magenta/white). (a, b) Class
SUPPLEMENTARY INFORMATION
 doi:10.1038/nature12652 Supplementary Figure 1. PRDM16 interacts with endogenous EHMT1 in brown adipocytes. Immunoprecipitation of PRDM16 complex by flag antibody (M2) followed by Western blot analysis
Genesis of cerebellar interneurons and the prevention of neural DNA damage require XRCC1.
 Genesis of cerebellar interneurons and the prevention of neural DNA damage require XRCC1. Youngsoo Lee, Sachin Katyal, Yang Li, Sherif F. El-Khamisy, Helen R. Russell, Keith W. Caldecott and Peter J. McKinnon.
Supplementary Materials for
 www.sciencetranslationalmedicine.org/cgi/content/full/4/117/117ra8/dc1 Supplementary Materials for Notch4 Normalization Reduces Blood Vessel Size in Arteriovenous Malformations Patrick A. Murphy, Tyson
SUPPLEMENTARY INFORMATION. Supplementary Figures
 SUPPLEMENTARY INFORMATION Supplementary Figures Supplementary Figure 1: Characterization of CerTN-L15 expressed in Arabidopsis roots. a. Ratiometric images of CerTN-L15 in roots under osmotic stress Ratiometric
Nature Neuroscience: doi: /nn Supplementary Figure 1. Visualization of AT1a-positive cells using AT1a lacz/+ mouse.
 Supplementary Figure 1 Visualization of AT1a-positive cells using AT1a lacz/+ mouse. (a f) Immunohistochemical detection of β-gal in the mouse brain. Coronal sections at the respective anteroposterior
Supplementary Figure 1. mrna targets were found in exosomes and absent in free-floating supernatant. Serum exosomes and exosome-free supernatant were
 Supplementary Figure 1. mrna targets were found in exosomes and absent in free-floating supernatant. Serum exosomes and exosome-free supernatant were separated via ultracentrifugation and lysed to analyze
Supplementary Figure 1. Spatial distribution of LRP5 and β-catenin in intact cardiomyocytes. (a) and (b) Immunofluorescence staining of endogenous
 and (b) Immunofluorescence staining of endogenous") Supplementary Figure 1. Spatial distribution of LRP5 and β-catenin in intact cardiomyocytes. (a) and (b) Immunofluorescence staining of endogenous LRP5 in intact adult mouse ventricular myocytes (AMVMs)
Supplementary Figure 1. Spatial distribution of LRP5 and β-catenin in intact cardiomyocytes. (a) and (b) Immunofluorescence staining of endogenous LRP5 in intact adult mouse ventricular myocytes (AMVMs)
Nature Neuroscience: doi: /nn Supplementary Figure 1. Trial structure for go/no-go behavior
 Supplementary Figure 1 Trial structure for go/no-go behavior a, Overall timeline of experiments. Day 1: A1 mapping, injection of AAV1-SYN-GCAMP6s, cranial window and headpost implantation. Water restriction
A. Generation and characterization of Ras-expressing autophagycompetent
 Supplemental Material Supplemental Figure Legends Fig. S1 A. Generation and characterization of Ras-expressing autophagycompetent and -deficient cell lines. HA-tagged H-ras V12 was stably expressed in
Supplementary Figure 1. ACE robotic platform. A. Overview of the rig setup showing major hardware components of ACE (Automatic single Cell
 2 Supplementary Figure 1. ACE robotic platform. A. Overview of the rig setup showing major hardware components of ACE (Automatic single Cell Experimenter) including the MultiClamp 700B, Digidata 1440A,
SUPPLEMENTARY FIGURE LEGENDS
 SUPPLEMENTARY FIGURE LEGENDS Supplemental FIG. 1. Localization of myosin Vb in cultured neurons varies with maturation stage. A and B, localization of myosin Vb in cultured hippocampal neurons. A, in DIV
T H E J O U R N A L O F C E L L B I O L O G Y
 Supplemental material Brooks and Wallingford, http://www.jcb.org/cgi/content/full/jcb.201204072/dc1 T H E J O U R N A L O F C E L L B I O L O G Y Figure S1. Quantification of ciliary compartments in control
Relative SOD1 activity. Relative SOD2 activity. Relative SOD activity (Infected:Mock) + CP + DDC
 + CP + DDC") Supplementary Figure 1. SOD1 activity is significantly increased relative to SOD1 levels. SOD1 and SOD2 activities in the infected mork13 cells are shown normalised to their corresponding levels and relative
Supplementary Figure 1. SOD1 activity is significantly increased relative to SOD1 levels. SOD1 and SOD2 activities in the infected mork13 cells are shown normalised to their corresponding levels and relative
MOLECULAR AND CELLULAR NEUROSCIENCE
 MOLECULAR AND CELLULAR NEUROSCIENCE BMP-218 November 4, 2014 DIVISIONS OF THE NERVOUS SYSTEM The nervous system is composed of two primary divisions: 1. CNS - Central Nervous System (Brain + Spinal Cord)
Supplementary Figure S1. Distinct compartmentalization of proinsulin in obese db/db mouse islet ß- cells.
 Supplementary Figure S1. Distinct compartmentalization of proinsulin in obese db/db mouse islet ß- cells. Pancreata from 16-weeks-old 6J +/+, 6J db/db, KS +/+ and KS db/db mice were harvested, fixed with
Suppl Video: Tumor cells (green) and monocytes (white) are seeded on a confluent endothelial
 and monocytes (white) are seeded on a confluent endothelial") Supplementary Information Häuselmann et al. Monocyte induction of E-selectin-mediated endothelial activation releases VE-cadherin junctions to promote tumor cell extravasation in the metastasis cascade
Supplementary Information Häuselmann et al. Monocyte induction of E-selectin-mediated endothelial activation releases VE-cadherin junctions to promote tumor cell extravasation in the metastasis cascade
Nature Neuroscience: doi: /nn Supplementary Figure 1. Lick response during the delayed Go versus No-Go task.
 Supplementary Figure 1 Lick response during the delayed Go versus No-Go task. Trial-averaged lick rate was averaged across all mice used for pyramidal cell imaging (n = 9). Different colors denote different
supplementary information
 DOI: 10.1038/ncb2133 Figure S1 Actomyosin organisation in human squamous cell carcinoma. (a) Three examples of actomyosin organisation around the edges of squamous cell carcinoma biopsies are shown. Myosin
Functional Development of Neuronal Networks in Culture -An in vitro Assay System of Developing Brain for Endocrine Disruptors
 Functional Development of Neuronal Networks in Culture -An in vitro Assay System of Developing Brain for Endocrine Disruptors Masahiro Kawahara and Yoichiro Kuroda Tokyo Metropolitan Institute for Neuroscience