Supplementary Table 1
|
|
|
- Ami Bell
- 5 years ago
- Views:
Transcription
1 Supplementary Table 1 Flow Cytometry Antibodies Antibody Fluorochrome Clone Vendor CD45 PE-cyanine 7 30-F11 D ioscience CD3 Pacific lue 17A2 iolegend (San Diego, CA) CD11b APC M1/70 iolegend (San Diego, CA) F4/80 FITC M8 eioscience, Inc (San Diego, CA) Ly6G PercP-cyanine 5.5 1A8 D ioscience Ly6C APC-cyanine 7 AL-21 D ioscience CD16/32 PE 93 eioscience, Inc (San Diego, CA) CD40 PE 3/23 D ioscience CD64 PE X54-5/7.1.1 D ioscience CD80 PE 16-10A1 D ioscience CD86 PE GL1 D ioscience I-A/I-E PE M5/ D ioscience IL-4Rα PE mil4r-m1 D ioscience OX40L PE RM134L D ioscience PD-L1 PE MIH5 D ioscience APC, allophycocyanin; PE, phycoerythrin, PercP, peridinin-chlorophyll protein complex; FITC, fluorescein isothiocyanate
2 Supplementary Figure 1 A. aseline Day +14 Diameter: 4.5 mm Volume: 95.0 mm 3 Diameter: 2.5 mm Volume: 54.2 mm 3. aseline Day +14 Diameter: 4.1 mm Volume: 47.0 mm 3 Diameter: 5.7 mm Volume: mm 3 Supplementary Figure 1. Ultrasound images showing representative examples of spontaneous pancreatic tumors from PC mice that (A) regressed or () progressed during therapy. PC mice were imaged and treated as described in Figure 5. oth examples are from mice treated with Gem+FG45+CEL. In the displayed images, the ultrasound detected tumor is highlighted in the right panel using a dotted line. Longest dimension diameter and volume for tumors is displayed below each set of images. = bowel, = kidney.
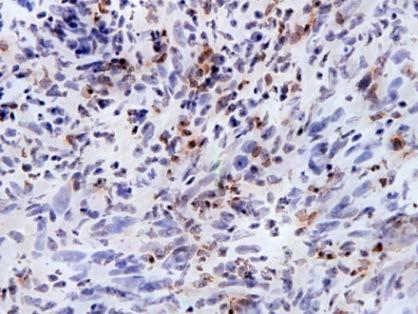
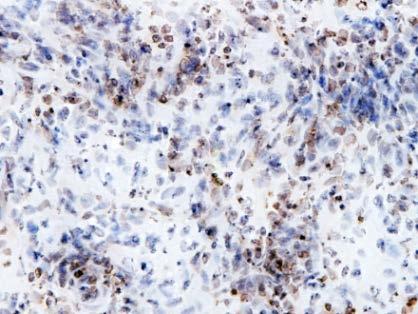
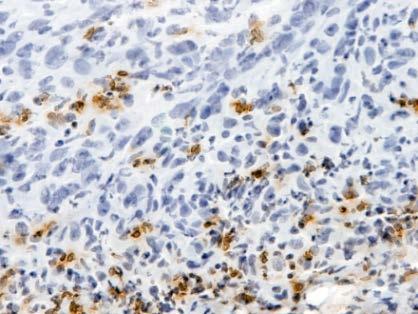
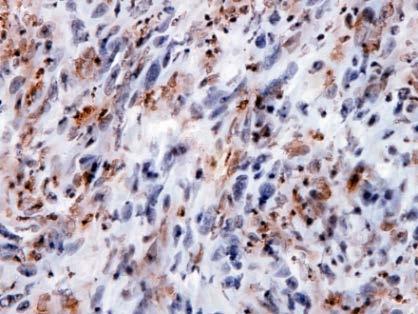
3 Supplementary Figure 2 H&E CD3 CD4 CD8 Gemcitabine + FG45 FG45 Gemcitabine Control Supplementary Figure 2. Treatment with gemcitabine and FG45 induces T cell infiltration into tumor tissue in a transplantation model of pancreatic carcinoma. Images showing H&E staining of tumors and immunohistochemistry for CD3, CD4, and CD8 expressing cells in tumors from mice described in Figure 1. Scale bars, 50 µm.


4 Supplementary Figure 3 H&E CD3 CD4 CD8 Foxp3 Gemcitabine + FG45 Non-responder Responder Control Supplementary Figure 3. T cells responding to treatment with gemcitabine and FG45 infiltrate the stromal tumor microenvironment. Images showing H&E staining and immunohistochemistry for CD3, CD4, CD8, and Foxp3 expressing cells in PDA explants re-implanted subcutaneously into PC mice and subsequently treated with IgG2a + PS (Control) versus gemcitabine + FG45 as described in Fig 3. Responder and non-responder indicate tumors which did and did not undergo regression, respectively, after treatment with gemcitabine plus FG45. Scale bars, 100 µm.


5 Supplementary Figure 4 H&E CD3 CD8 CD4 Foxp3 Gemcitabine + FG45 Control Supplementary Figure 4. Images showing H&E staining and CD3, CD4, CD8, and Foxp3 staining of spontaneously arising tumors from PC mice that have also been implanted subcutaneously with explanted tumor tissue and treated with or without gemcitabine and FG45 as described in Fig 3. Scale bars, 50 µm.


 Whisker plots showing quantification by")

 Quantification of CD4, CD8, and Foxp3 expressing")


6 Supplementary Figure 5 A 100 CD3 100 Gem+FG+lysate Cells per 40x field Cells per 40x field CD4 CD8 Foxp3 C D E F CD3 CD4 CD8 Foxp3 Supplementary Figure 5. Delivery of tumor lysate in combination with gemcitabine and FG45 induces T cell infiltration into primary pancreatic tumors. (A) Whisker plots showing quantification by immunohistochemistry of CD3 cell infiltrates into pancreatic tumors of PC mice 14 days after the indicated treatment is shown (n = 4 per group). () Quantification of CD4, CD8, and Foxp3 expressing cells in pancreatic tumors from PC mice treated with gemcitabine + FG45 + tumor lysate administered subcutaneously (s.c.). Representative images showing immunohistochemistry for (C) CD3, (D) CD4, (E) CD8, and (F) Foxp3 expressing cells in pancreatic tumors from PC mice treated with gemcitabine + FG45 + tumor lysate.


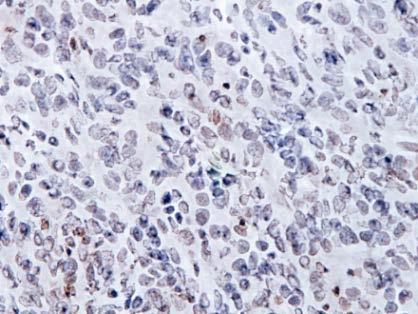
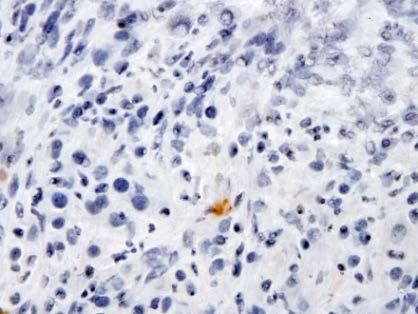
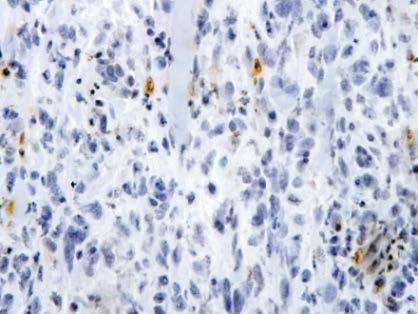
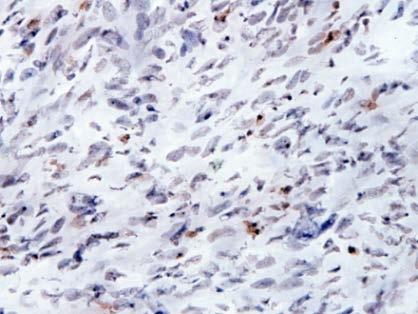
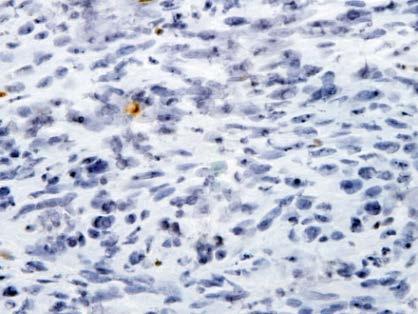
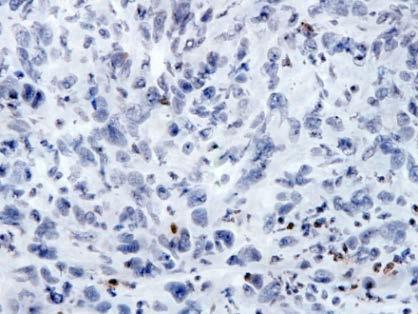
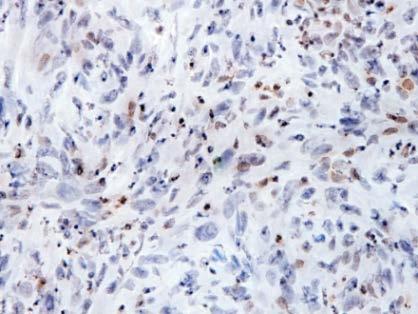
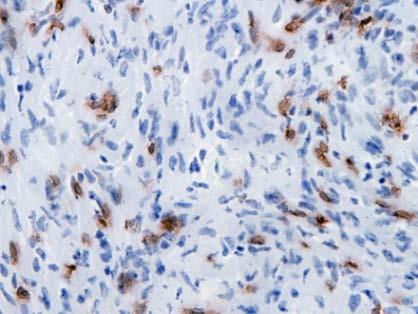
7 Supplementary Figure 6 CD4 CD8 Foxp3 Ctrl CEL Gem + FG45 + CEL Supplementary Figure 6. Macrophages regulate T cell infiltration into spontaneously arising pancreatic tumors in the PC model. Representative images showing immunohistochemistry for CD4, CD8, and Foxp3 expressing cells in pancreatic tumors from PC mice 14 days after treatment with IgG2a + PS (Ctrl), clodronate encapsulated liposomes (CEL), and gemcitabine + FG45 + CEL. Scale bars, 50 µm.


 in spontaneously arising tumors from PC mice receiving (A) control, () FG45, or (C) FG45 + CEL.")
8 Supplementary Figure 7 Control FG45 FG45 + CEL A C D FAP EpCAM DAPI FAP EpCAM DAPI FAP EpCAM DAPI Number of FAP + cells per 20x field Control FG45 FG45 + CEL Supplemental Figure 7. Treatment with an agonist CD40 mab with or without macrophage depletion does not impact the presence of cancer associated fibroblasts in PDAC. Images showing immunofluorescence staining of FAP + cancer associated fibroblasts (red), EpCAM + tumor cells (green), and DAPI stained nuclei (blue) in spontaneously arising tumors from PC mice receiving (A) control, () FG45, or (C) FG45 + CEL. (D) The number of FAP + stromal cells per 20x field is shown for each treatment group. P > 0.05 for comparisons between groups, Student s t test. Treatment Group


9 Supplementary Figure SSC-A FSC-A 95 SSC-A 100 SSC-A FSC-A FSC-H SSC-H live/dead CD11b CD11b 22 CD11b SSC-A F4/80 Ly6G CD3 CD F4/80 Ly6C Supplementary Figure 8. Gating strategy for identification of macrophages by flow cytometry. Shown are representative images from the analysis of splenocytes from a PC mouse with a primary pancreatic tumor. Mature macrophages are defined as CD45 + CD11b + CD3 neg Ly6G neg F4/80 + Ly6C low.
Supplemental Table 1. Primer sequences for transcript analysis
 Supplemental Table 1. Primer sequences for transcript analysis Primer Sequence (5 3 ) Primer Sequence (5 3 ) Mmp2 Forward CCCGTGTGGCCCTC Mmp15 Forward CGGGGCTGGCT Reverse GCTCTCCCGGTTTC Reverse CCTGGTGTGCCTGCTC
Supporting Information
 Supporting Information Idoyaga et al. 10.1073/pnas.0812247106 SSC a) Single cell suspension 99 Aqua b) Live cells 96 -W c) Singlets 92 -A CD19+ER119 d) CD19 ER119 cells 97 CD3 e) CD3 cells 27 f) DX5 cells
sequences of a styx mutant reveals a T to A transversion in the donor splice site of intron 5
 sfigure 1 Styx mutant mice recapitulate the phenotype of SHIP -/- mice. (A) Analysis of the genomic sequences of a styx mutant reveals a T to A transversion in the donor splice site of intron 5 (GTAAC
Supplementary Figure 1. Double-staining immunofluorescence analysis of invasive colon and breast cancers. Specimens from invasive ductal breast
 Supplementary Figure 1. Double-staining immunofluorescence analysis of invasive colon and breast cancers. Specimens from invasive ductal breast carcinoma (a) and colon adenocarcinoma (b) were staining
SUPPORTING INFORMATIONS
 SUPPORTING INFORMATIONS Mice MT/ret RetCD3ε KO α-cd25 treated MT/ret Age 1 month 3 mnths 6 months 1 month 3 months 6 months 1 month 3 months 6 months 2/87 Survival 87/87 incidence of 17/87 1 ary tumor
Bezzi et al., Supplementary Figure 1 *** Nature Medicine: doi: /nm Pten pc-/- ;Zbtb7a pc-/- Pten pc-/- ;Pml pc-/- Pten pc-/- ;Trp53 pc-/-
 Gr-1 Gr-1 Gr-1 Bezzi et al., Supplementary Figure 1 a Gr1-CD11b 3 months Spleen T cells 3 months Spleen B cells 3 months Spleen Macrophages 3 months Spleen 15 4 8 6 c CD11b+/Gr1+ cells [%] 1 5 b T cells
SUPPLEMENTARY INFORMATION
 doi:1.138/nature1554 a TNF-α + in CD4 + cells [%] 1 GF SPF 6 b IL-1 + in CD4 + cells [%] 5 4 3 2 1 Supplementary Figure 1. Effect of microbiota on cytokine profiles of T cells in GALT. Frequencies of TNF-α
SUPPLEMENTARY METHODS
 SUPPLEMENTARY METHODS Histological analysis. Colonic tissues were collected from 5 parts of the middle colon on day 7 after the start of DSS treatment, and then were cut into segments, fixed with 4% paraformaldehyde,
Supplementary Figure 1.
 Supplementary Figure 1. Female Pro-ins2 -/- mice at 5-6 weeks of age were either inoculated i.p. with a single dose of CVB4 (1x10 5 PFU/mouse) or PBS and treated with αgalcer or control vehicle. On day
A Versatile Tool to Study Immune Checkpoint Therapeutics: Syngeneic Tumor Mouse Models in vivo
 The Solution Provider for Drug Discovery in Oncology A Versatile Tool to Study Immune Checkpoint Therapeutics: Syngeneic Tumor Mouse Models in vivo Holger Weber - 1 - Drug discovery platform for oncology
Suppl Video: Tumor cells (green) and monocytes (white) are seeded on a confluent endothelial
 and monocytes (white) are seeded on a confluent endothelial") Supplementary Information Häuselmann et al. Monocyte induction of E-selectin-mediated endothelial activation releases VE-cadherin junctions to promote tumor cell extravasation in the metastasis cascade
Supplementary Information Häuselmann et al. Monocyte induction of E-selectin-mediated endothelial activation releases VE-cadherin junctions to promote tumor cell extravasation in the metastasis cascade
Supplementary Figure 1. mtor LysM and Rictor LysM mice have normal cellularity and percentages of hematopoe>c cells. a. Cell numbers of lung, liver,
 a. b. c. Supplementary Figure 1. mtor LysM and Rictor LysM mice have normal cellularity and percentages of hematopoe>c cells. a. Cell numbers of lung, liver, and spleen. b. Cell numbers of bone marrow
Supplementary Figure 1. BMS enhances human T cell activation in vitro in a
 Supplementary Figure 1. BMS98662 enhances human T cell activation in vitro in a concentration-dependent manner. Jurkat T cells were activated with anti-cd3 and anti-cd28 antibody in the presence of titrated
Supplemental figure 1. PDGFRα is expressed dominantly by stromal cells surrounding mammary ducts and alveoli. A) IHC staining of PDGFRα in
 IHC staining of PDGFRα in") Supplemental figure 1. PDGFRα is expressed dominantly by stromal cells surrounding mammary ducts and alveoli. A) IHC staining of PDGFRα in nulliparous (left panel) and InvD6 mouse mammary glands (right
Supplemental figure 1. PDGFRα is expressed dominantly by stromal cells surrounding mammary ducts and alveoli. A) IHC staining of PDGFRα in nulliparous (left panel) and InvD6 mouse mammary glands (right
SUPPLEMENTARY INFORMATION
 SUPPLEMENTARY INFORMATION doi:10.1038/nature19814 Figure 3e - - - Beads: Hep SA Sup Hep SA Sup Hep - SA - Sup 150 102 76 102 76 Blot: NP-1 Blot: MECA-32 Blot: VEGF Figure 3f Rbt IgG ctrl IP VEGF IP Extended
Supplementary Figure 1. Deletion of Smad3 prevents B16F10 melanoma invasion and metastasis in a mouse s.c. tumor model.
 A B16F1 s.c. Lung LN Distant lymph nodes Colon B B16F1 s.c. Supplementary Figure 1. Deletion of Smad3 prevents B16F1 melanoma invasion and metastasis in a mouse s.c. tumor model. Highly invasive growth
Interferon γ regulates idiopathic pneumonia syndrome, a. Th17 + CD4 + T-cell-mediated GvH disease
 Interferon γ regulates idiopathic pneumonia syndrome, a Th17 + CD4 + T-cell-mediated GvH disease Nora Mauermann, Julia Burian, Christophe von Garnier, Stefan Dirnhofer, Davide Germano, Christine Schuett,
Nature Protocols: doi: /nprot Supplementary Figure 1
 Supplementary Figure 1 Traditional electronic gating strategy for analysing cell death based on A5-FITC and 7-AAD. a, Flow cytometry analysis showing the traditional two-stage electronic gating strategy
SUPPLEMENTARY INFORMATION
 DOI: 1.138/ncb3355 a S1A8 + cells/ total.1.8.6.4.2 b S1A8/?-Actin c % T-cell proliferation 3 25 2 15 1 5 T cells Supplementary Figure 1 Inter-tumoral heterogeneity of MDSC accumulation in mammary tumor
Fisher et al. Supplemental Figure 1
 Supplemental Figure 1 A TNF IL-1 IL-6 CCL2 CCL5 CXCL10 pg/mg total protein 50 30 10 4,000 3,000 2,000 1,000 n.d. 1 1 14,000 12,000 10,000 8,000 6,000 4,000 2,000 6,000,000 CT26 5,000 16,000 B16 4,000 12,000
hexahistidine tagged GRP78 devoid of the KDEL motif (GRP78-His) on SDS-PAGE. This
 on SDS-PAGE. This") SUPPLEMENTAL FIGURE LEGEND Fig. S1. Generation and characterization of. (A) Coomassie staining of soluble hexahistidine tagged GRP78 devoid of the KDEL motif (GRP78-His) on SDS-PAGE. This protein was expressed
SUPPLEMENTAL FIGURE LEGEND Fig. S1. Generation and characterization of. (A) Coomassie staining of soluble hexahistidine tagged GRP78 devoid of the KDEL motif (GRP78-His) on SDS-PAGE. This protein was expressed
Supplementary Figure 1. Expression of EPO and EPOR during self-limited versus delayed
 Supplementary Figure 1. Expression of EPO and EPOR during self-limited versus delayed inflammation resolution. a: Flow cytometry analysis showing the electronic gating strategy used to identify peritoneal
CONTRACTING ORGANIZATION: Children s Hospital Los Angeles Los Angeles, CA 90027
 AD Award Number: TITLE: Studies of the Tumor Microenvironment in Pathogenesis of Neuroblastoma PRINCIPAL INVESTIGATOR: Shahab Asgharzadeh, M D CONTRACTING ORGANIZATION: Children s Hospital Los Angeles
Supplemental Material
 Supplemental Material Supplementary Fig. 1. EETs stimulate primary tumor growth. a) Schematic presentation of genetic and pharmacological tools used to manipulate endogenous EET levels. b) Endothelial
Supplementary information
 Supplementary information Intrahepatic myeloid cell-aggregates enable local CD8 + T cell expansion and successful immunotherapy against chronic viral liver infection Li- Rung Huang, Dirk Wohlleber, Florian
Supplementary Materials for
 www.sciencemag.org/content/348/6241/aaa825/suppl/dc1 Supplementary Materials for A mucosal vaccine against Chlamydia trachomatis generates two waves of protective memory T cells Georg Stary,* Andrew Olive,
Supplementary Figures
 Supplementary Figures Supplementary Fig. 1. Galectin-3 is present within tumors. (A) mrna expression levels of Lgals3 (galectin-3) and Lgals8 (galectin-8) in the four classes of cell lines as determined
NK cell flow cytometric assay In vivo DC viability and migration assay
 NK cell flow cytometric assay 6 NK cells were purified, by negative selection with the NK Cell Isolation Kit (Miltenyi iotec), from spleen and lymph nodes of 6 RAG1KO mice, injected the day before with
Supplementary Figure 1 Chemokine and chemokine receptor expression during muscle regeneration (a) Analysis of CR3CR1 mrna expression by real time-pcr
 Analysis of CR3CR1 mrna expression by real time-pcr") Supplementary Figure 1 Chemokine and chemokine receptor expression during muscle regeneration (a) Analysis of CR3CR1 mrna expression by real time-pcr at day 0, 1, 4, 10 and 21 post- muscle injury. (b)
Supplementary Figure 1 Chemokine and chemokine receptor expression during muscle regeneration (a) Analysis of CR3CR1 mrna expression by real time-pcr at day 0, 1, 4, 10 and 21 post- muscle injury. (b)
X P. Supplementary Figure 1. Nature Medicine: doi: /nm Nilotinib LSK LT-HSC. Cytoplasm. Cytoplasm. Nucleus. Nucleus
 a b c Supplementary Figure 1 c-kit-apc-eflu780 Lin-FITC Flt3-Linc-Kit-APC-eflu780 LSK Sca-1-PE-Cy7 d e f CD48-APC LT-HSC CD150-PerCP-cy5.5 g h i j Cytoplasm RCC1 X Exp 5 mir 126 SPRED1 SPRED1 RAN P SPRED1
well for 2 h at rt. Each dot represents an individual mouse and bar is the mean ±
 Supplementary data: Control DC Blimp-1 ko DC 8 6 4 2-2 IL-1β p=.5 medium 8 6 4 2 IL-2 Medium p=.16 8 6 4 2 IL-6 medium p=.3 5 4 3 2 1-1 medium IL-1 n.s. 25 2 15 1 5 IL-12(p7) p=.15 5 IFNγ p=.65 4 3 2 1
Supporting Information
 Supporting Information Desnues et al. 10.1073/pnas.1314121111 SI Materials and Methods Mice. Toll-like receptor (TLR)8 / and TLR9 / mice were generated as described previously (1, 2). TLR9 / mice were
Nature Immunology: doi: /ni Supplementary Figure 1. Examples of staining for each antibody used for the mass cytometry analysis.
 Supplementary Figure 1 Examples of staining for each antibody used for the mass cytometry analysis. To illustrate the functionality of each antibody probe, representative plots illustrating the expected
Comprehensive evaluation of human immune system reconstitution in NSG. and NSG -SGM3 mouse models toward the development of a novel ONCO-HU
 Comprehensive evaluation of human immune system reconstitution in NSG and NSG -SGM3 mouse models toward the development of a novel ONCO-HU xenograft model Aaron Middlebrook, 1 Eileen Snowden, 2 Warren
Chitin Activates Parallel Immune Modules that Direct Distinct Inflammatory Responses via Innate Lymphoid Type 2 and T Cells
 Immunity, Volume 4 Supplemental Information Chitin Activates Parallel Immune Modules that Direct Distinct Inflammatory Responses via Innate Lymphoid Type 2 and T Cells Steven J. Van Dyken, Alexander Mohapatra,
Supplemental Information. Tissue-Resident Macrophages in Pancreatic. Ductal Adenocarcinoma Originate from Embryonic
 Immunity, Volume 7 Supplemental Information Tissue-Resident Macrophages in Pancreatic Ductal Adenocarcinoma Originate from Embryonic Hematopoiesis and Promote Tumor Progression Yu Zhu, John M. Herndon,
Reviewers' comments: Reviewer #1 (Remarks to the Author):
:") Reviewers' comments: Reviewer #1 (Remarks to the Author): In the manuscript Rational Combination of CXCL11-Expressing Oncolytic Virus and PD-L1 Blockade Works Synergistically to Enhance Therapeutic Efficacy
Reviewers' comments: Reviewer #1 (Remarks to the Author): In the manuscript Rational Combination of CXCL11-Expressing Oncolytic Virus and PD-L1 Blockade Works Synergistically to Enhance Therapeutic Efficacy
Supplementary Figure 1
 Supplementary Figure 1 AAV-GFP injection in the MEC of the mouse brain C57Bl/6 mice at 4 months of age were injected with AAV-GFP into the MEC and sacrificed at 7 days post injection (dpi). (a) Brains
Pearson r = P (one-tailed) = n = 9
 = n = 9") 8F4-Specific Lysis, % 1 UPN1 UPN3 8 UPN7 6 Pearson r =.69 UPN2 UPN5 P (one-tailed) =.192 4 UPN8 n = 9 2 UPN9 UPN4 UPN6 5 1 15 2 25 8 8F4, % Max MFI Supplementary Figure S1. AML samples UPN1-UPN9 show variable
8F4-Specific Lysis, % 1 UPN1 UPN3 8 UPN7 6 Pearson r =.69 UPN2 UPN5 P (one-tailed) =.192 4 UPN8 n = 9 2 UPN9 UPN4 UPN6 5 1 15 2 25 8 8F4, % Max MFI Supplementary Figure S1. AML samples UPN1-UPN9 show variable
Fluorochrome Panel 1 Panel 2 Panel 3 Panel 4 Panel 5 CTLA-4 CTLA-4 CD15 CD3 FITC. Bio) PD-1 (MIH4, BD) ICOS (C398.4A, Biolegend) PD-L1 (MIH1, BD)
 PD-1 (MIH4, BD) ICOS (C398.4A, Biolegend) PD-L1 (MIH1, BD)") Additional file : Table S. Antibodies used for panel stain to identify peripheral immune cell subsets. Panel : PD- signaling; Panel : CD + T cells, CD + T cells, B cells; Panel : Tregs; Panel :, -T, cdc,
Additional file : Table S. Antibodies used for panel stain to identify peripheral immune cell subsets. Panel : PD- signaling; Panel : CD + T cells, CD + T cells, B cells; Panel : Tregs; Panel :, -T, cdc,
Supplementary Figure 1: TSLP receptor skin expression in dcssc. A: Healthy control (HC) skin with TSLP receptor expression in brown (10x
 skin with TSLP receptor expression in brown (10x") Supplementary Figure 1: TSLP receptor skin expression in dcssc. A: Healthy control (HC) skin with TSLP receptor expression in brown (10x magnification). B: Second HC skin stained for TSLP receptor in brown
Supplementary Figure 1: TSLP receptor skin expression in dcssc. A: Healthy control (HC) skin with TSLP receptor expression in brown (10x magnification). B: Second HC skin stained for TSLP receptor in brown
Supplementary Figure 1. Example of gating strategy
 Supplementary Figure 1. Example of gating strategy Legend Supplementary Figure 1: First, gating is performed to include only single cells (singlets) (A) and CD3+ cells (B). After gating on the lymphocyte
Application Information Bulletin: Human NK Cells Phenotypic characterizing of human Natural Killer (NK) cell populations in peripheral blood
 cell populations in peripheral blood") Application Information Bulletin: Human NK Cells Phenotypic characterizing of human Natural Killer (NK) cell populations in peripheral blood Christopher A Fraker, Ph.D., University of Miami - Miami, Florida
Application Information Bulletin: Human NK Cells Phenotypic characterizing of human Natural Killer (NK) cell populations in peripheral blood Christopher A Fraker, Ph.D., University of Miami - Miami, Florida
Nature Medicine: doi: /nm.3922
 Title: Glucocorticoid-induced tumor necrosis factor receptor-related protein co-stimulation facilitates tumor regression by inducing IL-9-producing helper T cells Authors: Il-Kyu Kim, Byung-Seok Kim, Choong-Hyun
Blocking antibodies and peptides. Rat anti-mouse PD-1 (29F.1A12, rat IgG2a, k), PD-
, PD-") Supplementary Methods Blocking antibodies and peptides. Rat anti-mouse PD-1 (29F.1A12, rat IgG2a, k), PD- L1 (10F.9G2, rat IgG2b, k), and PD-L2 (3.2, mouse IgG1) have been described (24). Anti-CTLA-4 (clone
Supplementary Methods Blocking antibodies and peptides. Rat anti-mouse PD-1 (29F.1A12, rat IgG2a, k), PD- L1 (10F.9G2, rat IgG2b, k), and PD-L2 (3.2, mouse IgG1) have been described (24). Anti-CTLA-4 (clone
Figure S1 Generation of γ-gt DTR transgenic mice. (A) Schematic construct of the transgene. (B)
 Schematic construct of the transgene. (B)") Figure S1 Generation of γ-gt DTR transgenic mice. (A) Schematic construct of the transgene. (B) PCR identified expected hhb-egf band (left panel) and HA tag band (right) in kidneys of transgenic (TG) mice
Figure S1 Generation of γ-gt DTR transgenic mice. (A) Schematic construct of the transgene. (B) PCR identified expected hhb-egf band (left panel) and HA tag band (right) in kidneys of transgenic (TG) mice
IL-6Rα IL-6RαT-KO KO. IL-6Rα f/f bp. f/f 628 bp deleted 368 bp. 500 bp
 STD H 2 O WT KO IL-6Rα f/f IL-6Rα IL-6RαT-KO KO 1000 bp 500 bp f/f 628 bp deleted 368 bp Supplementary Figure 1 Confirmation of T-cell IL-6Rα deficiency. (a) Representative histograms and (b) quantification
Supplementary Figure 1: GFAP positive nerves in patients with adenocarcinoma of
 SUPPLEMENTARY FIGURES AND MOVIE LEGENDS Supplementary Figure 1: GFAP positive nerves in patients with adenocarcinoma of the pancreas. (A) Images of nerves stained for GFAP (green), S100 (red) and DAPI
Pathologic Stage. Lymph node Stage
 ASC ASC a c Patient ID BMI Age Gleason score Non-obese PBMC 1 22.1 81 6 (3+3) PBMC 2 21.9 6 6 (3+3) PBMC 3 22 84 8 (4+4) PBMC 4 24.6 68 7 (3+4) PBMC 24. 6 (3+3) PBMC 6 24.7 73 7 (3+4) PBMC 7 23. 67 7 (3+4)
Combined Rho-kinase inhibition and immunogenic cell death triggers and propagates immunity against cancer
 Supplementary Information Combined Rho-kinase inhibition and immunogenic cell death triggers and propagates immunity against cancer Gi-Hoon Nam, Eun-Jung Lee, Yoon Kyoung Kim, Yeonsun Hong, Yoonjeong Choi,
CyTOF analyses in rheumatoid arthritis. Deepak Rao, MD PhD Rheumatology, Immunology, Allergy, BWH
 CyTOF analyses in rheumatoid arthritis Deepak Rao, MD PhD Rheumatology, Immunology, Allergy, BWH Agenda: CyTOF analyses Analysis of synovial tissue Panel for analysis of synovial cells Comparison of CyTOF
Supplementary Information:
 Supplementary Information: Follicular regulatory T cells with Bcl6 expression suppress germinal center reactions by Yeonseok Chung, Shinya Tanaka, Fuliang Chu, Roza Nurieva, Gustavo J. Martinez, Seema
Hua Tang, Weiping Cao, Sudhir Pai Kasturi, Rajesh Ravindran, Helder I Nakaya, Kousik
 SUPPLEMENTARY FIGURES 1-19 T H 2 response to cysteine-proteases requires dendritic cell-basophil cooperation via ROS mediated signaling Hua Tang, Weiping Cao, Sudhir Pai Kasturi, Rajesh Ravindran, Helder
SUPPLEMENTARY INFORMATION
 doi:10.1038/nature10134 Supplementary Figure 1. Anti-inflammatory activity of sfc. a, Autoantibody immune complexes crosslink activating Fc receptors, promoting activation of macrophages, and WWW.NATURE.COM/NATURE
Eosinophils are required. for the maintenance of plasma cells in the bone marrow
 Eosinophils are required for the maintenance of plasma cells in the bone marrow Van Trung Chu, Anja Fröhlich, Gudrun Steinhauser, Tobias Scheel, Toralf Roch, Simon Fillatreau, James J. Lee, Max Löhning
T cell protein tyrosine phosphatase attenuates T cell signaling to maintain tolerance in mice
 SUPPLEMENTAL METHODS T cell protein tyrosine phosphatase attenuates T cell signaling to maintain tolerance in mice Florian Wiede 1, Benjamin J. Shields 1, Sock Hui Chew 1, Konstantinos Kyparissoudis 2,
CD14 + S100A9 + Monocytic Myeloid-Derived Suppressor Cells and Their Clinical Relevance in Non-Small Cell Lung Cancer
 CD14 + S1A9 + Monocytic Myeloid-Derived Suppressor Cells and Their Clinical Relevance in Non-Small Cell Lung Cancer Po-Hao, Feng M.D., Kang-Yun, Lee, M.D. Ph.D., Ya-Ling Chang, Yao-Fei Chan, Lu- Wei, Kuo,Ting-Yu
Serafino et al. Thymosin α1 activates complement receptor-mediated phagocytosis in human monocyte-derived macrophages. SUPPLEMENTARY FIGURES
 Supplementary Fig. S1. Evaluation of the purity and maturation of macrophage cultures tested by flow cytometry. The lymphocytic/monocytic cellular fraction was isolated from buffy coats of healthy donors
Supplementary Figure 1.TRIM33 binds β-catenin in the nucleus. a & b, Co-IP of endogenous TRIM33 with β-catenin in HT-29 cells (a) and HEK 293T cells
 and HEK 293T cells") Supplementary Figure 1.TRIM33 binds β-catenin in the nucleus. a & b, Co-IP of endogenous TRIM33 with β-catenin in HT-29 cells (a) and HEK 293T cells (b). TRIM33 was immunoprecipitated, and the amount of
Supplementary Figure 1.TRIM33 binds β-catenin in the nucleus. a & b, Co-IP of endogenous TRIM33 with β-catenin in HT-29 cells (a) and HEK 293T cells (b). TRIM33 was immunoprecipitated, and the amount of
ONLINE SUPPLEMENT MATERIAL. CD70 limits atherosclerosis and promotes macrophage function.
 ONLINE SUPPLEMENT MATERIAL CD7 limits atherosclerosis and promotes macrophage function. Holger Winkels* 1,2, Svenja Meiler* 1,2, Esther Smeets* 2, Dirk Lievens 1, David Engel 3, Charlotte Spitz 1, Christina
and follicular helper T cells is Egr2-dependent. (a) Diagrammatic representation of the
 Diagrammatic representation of the") Supplementary Figure 1. LAG3 + Treg-mediated regulation of germinal center B cells and follicular helper T cells is Egr2-dependent. (a) Diagrammatic representation of the experimental protocol for the
Supplementary Figure 1. LAG3 + Treg-mediated regulation of germinal center B cells and follicular helper T cells is Egr2-dependent. (a) Diagrammatic representation of the experimental protocol for the
Supplementary Materials. for Garmy-Susini, et al, Integrin 4 1 signaling is required for lymphangiogenesis and tumor metastasis
 Supplementary Materials for Garmy-Susini, et al, Integrin 4 1 signaling is required for lymphangiogenesis and tumor metastasis 1 Supplementary Figure Legends Supplementary Figure 1: Integrin expression
PHENOTYPIC DYNAMICS OF MICROGLIAL AND MONOCYTE-DERIVED CELLS IN GLIOBLASTOMA-BEARING MICE.
 SUPPLEMENTARY FIGURES, TABLES AND VIDEOS PHENOTYPIC DYNAMICS OF MICROGLIAL AND MONOCYTE-DERIVED CELLS IN GLIOBLASTOMA-BEARING MICE. Clément Ricard 1,2,3,4, Aurélie Tchoghandjian 2,4, Hervé Luche 5, Pierre
Supplementary Figure 1
 Supplementary Figure 1 Genetic labeling of microglia Male and female 2-3 month-old CreERT2;R26-tdTomato mice or CreERT2;R26-tdTomato;Iba1-eGFP transgenic mice were treated with 1x, 2x (48 h apart), or
Supplemental Figure S1. RANK expression on human lung cancer cells.
 Supplemental Figure S1. RANK expression on human lung cancer cells. (A) Incidence and H-Scores of RANK expression determined from IHC in the indicated primary lung cancer subgroups. The overall expression
ndln NK Cells (x10 3 ) Days post-infection (A/PR/8) *** *** *** Liver NK Cells (x10 4 ) Days post-infection (MCMV)
 Days post-infection (A/PR/8) *** *** *** Liver NK Cells (x10 4 ) Days post-infection (MCMV)") A mln NK Cells(x ) 6 1 * ndln NK Cells (x ) ns C Lung NK Cells(x ) 1 1 7 * D LN NK Cells (x ) 1 7 1 7 Days post-infection (A/PR/8) * * E Liver NK Cells (x ) 1 7 Days post-infection (A/PR/8) * * * 1 7 Days
A mln NK Cells(x ) 6 1 * ndln NK Cells (x ) ns C Lung NK Cells(x ) 1 1 7 * D LN NK Cells (x ) 1 7 1 7 Days post-infection (A/PR/8) * * E Liver NK Cells (x ) 1 7 Days post-infection (A/PR/8) * * * 1 7 Days
Supplementary Materials for
 www.sciencetranslationalmedicine.org/cgi/content/full/8/352/352ra110/dc1 Supplementary Materials for Spatially selective depletion of tumor-associated regulatory T cells with near-infrared photoimmunotherapy
Title of file for HTML: Supplementary Information Description: Supplementary Figures and Supplementary Table
 Title of file for HTML: Supplementary Information Description: Supplementary Figures and Supplementary Table Title of file for HTML: Peer Review File Description: Innate Scavenger Receptor-A regulates
Gladstone Institutes, University of California (UCSF), San Francisco, USA
, San Francisco, USA") Fluorescence-linked Antigen Quantification (FLAQ) Assay for Fast Quantification of HIV-1 p24 Gag Marianne Gesner, Mekhala Maiti, Robert Grant and Marielle Cavrois * Gladstone Institutes, University of
Fluorescence-linked Antigen Quantification (FLAQ) Assay for Fast Quantification of HIV-1 p24 Gag Marianne Gesner, Mekhala Maiti, Robert Grant and Marielle Cavrois * Gladstone Institutes, University of
Supplemental Figures. Amylase. Glucose. Pancreas FAP-WT FAP-KO weight (g) mg/dl U/L 0.
 mg/dl U/L 0.") Supplemental Figures A.2 3.1 2 2 1 1.5. 3 U/L 4 mg/dl weight (g).25.15 Amylase Glucose Pancreas B Trichrome HABP PAS H&E Supplemental Figure 1. FAP is dispensable for pancreatic development. (A) The pancreas
Supplemental Figures A.2 3.1 2 2 1 1.5. 3 U/L 4 mg/dl weight (g).25.15 Amylase Glucose Pancreas B Trichrome HABP PAS H&E Supplemental Figure 1. FAP is dispensable for pancreatic development. (A) The pancreas
Supplementary Figure 1: si-craf but not si-braf sensitizes tumor cells to radiation.
 Supplementary Figure 1: si-craf but not si-braf sensitizes tumor cells to radiation. (a) Embryonic fibroblasts isolated from wildtype (WT), BRAF -/-, or CRAF -/- mice were irradiated (6 Gy) and DNA damage
Online Appendix Material and Methods: Pancreatic RNA isolation and quantitative real-time (q)rt-pcr. Mice were fasted overnight and killed 1 hour (h)
rt-pcr. Mice were fasted overnight and killed 1 hour (h)") Online Appendix Material and Methods: Pancreatic RNA isolation and quantitative real-time (q)rt-pcr. Mice were fasted overnight and killed 1 hour (h) after feeding. A small slice (~5-1 mm 3 ) was taken
Online Appendix Material and Methods: Pancreatic RNA isolation and quantitative real-time (q)rt-pcr. Mice were fasted overnight and killed 1 hour (h) after feeding. A small slice (~5-1 mm 3 ) was taken
Supplementary Information. Tissue-wide immunity against Leishmania. through collective production of nitric oxide
 Supplementary Information Tissue-wide immunity against Leishmania through collective production of nitric oxide Romain Olekhnovitch, Bernhard Ryffel, Andreas J. Müller and Philippe Bousso Supplementary
fl/+ KRas;Atg5 fl/+ KRas;Atg5 fl/fl KRas;Atg5 fl/fl KRas;Atg5 Supplementary Figure 1. Gene set enrichment analyses. (a) (b)
 (b)") KRas;At KRas;At KRas;At KRas;At a b Supplementary Figure 1. Gene set enrichment analyses. (a) GO gene sets (MSigDB v3. c5) enriched in KRas;Atg5 fl/+ as compared to KRas;Atg5 fl/fl tumors using gene set
KRas;At KRas;At KRas;At KRas;At a b Supplementary Figure 1. Gene set enrichment analyses. (a) GO gene sets (MSigDB v3. c5) enriched in KRas;Atg5 fl/+ as compared to KRas;Atg5 fl/fl tumors using gene set
Supplemental Materials. Stromal Modulation Reverses Primary Resistance to Immune Checkpoint Blockade in. Pancreatic Cancer.
 Supplemental Materials Stromal Modulation Reverses Primary Resistance to Immune Checkpoint Blockade in Pancreatic Cancer Jun Zhao 1, Zhilan Xiao 2, 3, Tingting Li 1, 4, Huiqin Chen 5, Ying Yuan 5, Alan
SUPPLEMENTARY INFORMATION
 DOI:.38/ncb3399 a b c d FSP DAPI 5mm mm 5mm 5mm e Correspond to melanoma in-situ Figure a DCT FSP- f MITF mm mm MlanaA melanoma in-situ DCT 5mm FSP- mm mm mm mm mm g melanoma in-situ MITF MlanaA mm mm
Supplementary Information
 Supplementary Information Supplementary Figure 1. Short-term coreceptor and costimulation blockade induces tolerance to pluripotent human ESCs. (A) Schematic diagram showing experimental approaches and
% of live splenocytes. STAT5 deletion. (open shapes) % ROSA + % floxed
 % ROSA + % floxed") Supp. Figure 1. a 14 1 1 8 6 spleen cells (x1 6 ) 16 % of live splenocytes 5 4 3 1 % of live splenocytes 8 6 4 b 1 1 c % of CD11c + splenocytes (closed shapes) 8 6 4 8 6 4 % ROSA + (open shapes) % floxed
Supp. Figure 1. a 14 1 1 8 6 spleen cells (x1 6 ) 16 % of live splenocytes 5 4 3 1 % of live splenocytes 8 6 4 b 1 1 c % of CD11c + splenocytes (closed shapes) 8 6 4 8 6 4 % ROSA + (open shapes) % floxed
Optimizing Intracellular Flow Cytometry:
 Optimizing Intracellular Flow Cytometry: Simultaneous Detection of Cytokines and Transcription Factors An encore presentation by Jurg Rohrer, PhD, BD Biosciences 10.26.10 Outline Introduction Cytokines
Diphtheria toxin-mediated ablation of lymphatic endothelial cells results in progressive lymphedema
 Diphtheria toxin-mediated ablation of lymphatic endothelial cells results in progressive lymphedema Jason C. Gardenier 1, Geoffrey E. Hespe 1, Raghu P. Kataru 1, Ira L. Savetsky 1, Jeremy S. Torrisi 1,
Supplementary Materials for
 www.sciencesignaling.org/cgi/content/full/2/1/ra81/dc1 Supplementary Materials for Delivery of MicroRNA-126 by Apoptotic Bodies Induces CXCL12- Dependent Vascular Protection Alma Zernecke,* Kiril Bidzhekov,
Supplementary Figure 1. Successful excision of genes from WBM lysates and
 Supplementary Information: Supplementary Figure 1. Successful excision of genes from WBM lysates and survival of mice with different genotypes. (a) The proper excision of Pten, p110α, p110α and p110δ was
Supplementary Figure 1. Immune profiles of untreated and PD-1 blockade resistant EGFR and Kras mouse lung tumors (a) Total lung weight of untreated
 Total lung weight of untreated") 1 Supplementary Figure 1. Immune profiles of untreated and PD-1 blockade resistant EGFR and Kras mouse lung tumors (a) Total lung weight of untreated (U) EGFR TL mice (n=7), Kras mice (n=7), PD-1 blockade
1 Supplementary Figure 1. Immune profiles of untreated and PD-1 blockade resistant EGFR and Kras mouse lung tumors (a) Total lung weight of untreated (U) EGFR TL mice (n=7), Kras mice (n=7), PD-1 blockade
Supporting Information
 Supporting Information Demaria et al. 1.173/pnas.1512832112 SI Materials and Methods Study Approval. All animal experiments were approved by the Institutional Animal Care and Use Committee of the University
Supporting Information
 Supporting Information Shime et al. 1.173/pnas.11139919 SI Methods Reagents. was purchased from GE Healthcare, which was free from LPS contamination. TNF-α and IFN-β ELISA kit was purchased from eioscience
Supplementary Data. Treg phenotype
 Supplementary Data Additional Experiment An additional experiment was performed using cryopreserved peripheral blood mononuclear cells (PBMC) derived from five renal cell carcinoma (RCC) patients [see
Optimizing Intracellular Flow Cytometry:
 Optimizing Intracellular Flow Cytometry: Simultaneous Detection of Cytokines and Transcription Factors Presented by Jurg Rohrer, PhD, BD Biosciences 23-10780-00 Outline Introduction Cytokines Transcription
a surface permeabilized
 a surface permeabilized RAW 64.7 P388D1 J774 b CD11b + Ly-6G - Blood Monocytes WT Supplementary Figure 1. Cell surface expression on macrophages and DCs. (a) RAW64.7, P388D1, and J774 cells were subjected
Supplementary Figure 1. A. Bar graph representing the expression levels of the 19 indicated genes in the microarrays analyses comparing human lung
 Supplementary Figure 1. A. Bar graph representing the expression levels of the 19 indicated genes in the microarrays analyses comparing human lung immortalized broncho-epithelial cells (AALE cells) expressing
Supplementary Figure 1. Efficient DC depletion in CD11c.DOG transgenic mice
 Supplementary Figure 1. Efficient DC depletion in CD11c.DOG transgenic mice (a) CD11c.DOG transgenic mice (tg) were treated with 8 ng/g body weight (b.w.) diphtheria toxin (DT) i.p. on day -1 and every
SUPPLEMENTARY INFORMATION
 DOI: 10.1038/ncb2638 Figure S1 Morphological characteristics of fetal testes and ovaries from 6.5-20 developmental weeks. Representative images of Hematoxylin and Eosin staining of testes and ovaries over
x Lymphocyte count /µl CD8+ count/µl 800 Calculated
 % Lymphocyte in CBC A. 50 40 30 20 10 Lymphocyte count /µl B. x10 3 2.5 1.5 C. 50 D. 1000 % CD3+CD8+ Cells 40 30 20 Calculated CD8+ count/µl 800 600 400 200 10 0 #61 #63 #64 #65 #68 #71 #72 #75 Figure
SUPPLEMENTARY FIG. S2. Representative counting fields used in quantification of the in vitro neural differentiation of pattern of dnscs.
 Supplementary Data SUPPLEMENTARY FIG. S1. Representative counting fields used in quantification of the in vitro neural differentiation of pattern of anpcs. A panel of lineage-specific markers were used
Supplementary Figures
 Supplementary Figures Supplementary Figure 1 Increased ABHD5 expression in human colon cancer associated macrophages. (a) Murine peritoneal macrophages were treated with regular culture medium (Ctrl) or
Nature Immunology: doi: /ni.3836
 Supplementary Figure 1 Recombinant LIGHT-VTP induces pericyte contractility and endothelial cell activation. (a) Western blot showing purification steps for full length murine LIGHT-VTP (CGKRK) protein:
Supplementary Figure 1. Nature Neuroscience: doi: /nn.4547
 Supplementary Figure 1 Characterization of the Microfetti mouse model. (a) Gating strategy for 8-color flow analysis of peripheral Ly-6C + monocytes from Microfetti mice 5-7 days after TAM treatment. Living
Supporting Information
 Supporting Information Huang et al. 10.1073/pnas.1215397109 SI Materials and Methods Animals and Tumor Models. FVB, Tie2 p -GFP/FVB, and C3H mice were bred and maintained in our gnotobiotic animal facility.
SUPPLEMENTARY FIGURE 1
 SUPPLEMENTARY FIGURE 1 A LN Cell count (1 ) 1 3 1 CD+ 1 1 CDL lo CD hi 1 CD+FoxP3+ 1 1 1 7 3 3 3 % of cells 9 7 7 % of cells CD+ 3 1 % of cells CDL lo CD hi 1 1 % of CD+ cells CD+FoxP3+ 3 1 % of CD+ T
Fig 1 CD163. CD11b S100A9. Sirius Red. 100μm ** ** CD163. CD11b S100A9 ** Sirius Red (PL) Sirius Red SUM Mo.
 Sirius Red SUM Mo.") T47D T47D + o SU-59 Fig SU-59 + o IHC score (-3) IHC score (-2) CD63 3 2 IHC score (-3) CD63 3 ** 2 CDb CDb * * SA9 SA9 ** * 2 IHC score (-4) αsa αsa 4 ** ** 2 Sirius Red μm IHC score (%) Sirius Red 8
T47D T47D + o SU-59 Fig SU-59 + o IHC score (-3) IHC score (-2) CD63 3 2 IHC score (-3) CD63 3 ** 2 CDb CDb * * SA9 SA9 ** * 2 IHC score (-4) αsa αsa 4 ** ** 2 Sirius Red μm IHC score (%) Sirius Red 8
Supplementary Figure 1. IDH1 and IDH2 mutation site sequences on WHO grade III
 Supplementary Materials: Supplementary Figure 1. IDH1 and IDH2 mutation site sequences on WHO grade III patient samples. Genomic DNA samples extracted from punch biopsies from either FFPE or frozen tumor