PHENOTYPIC DYNAMICS OF MICROGLIAL AND MONOCYTE-DERIVED CELLS IN GLIOBLASTOMA-BEARING MICE.
|
|
|
- Trevor Chapman
- 5 years ago
- Views:
Transcription
1 SUPPLEMENTARY FIGURES, TABLES AND VIDEOS PHENOTYPIC DYNAMICS OF MICROGLIAL AND MONOCYTE-DERIVED CELLS IN GLIOBLASTOMA-BEARING MICE. Clément Ricard 1,2,3,4, Aurélie Tchoghandjian 2,4, Hervé Luche 5, Pierre Grenot 5,, Dominique Figarella-Branger 2,4, Geneviève Rougon # 1,3, Marie Malissen # 5,6 & Franck Debarbieux #, * 1,3. 1. Institut des Neurosciences de la Timone, Marseille, Aix-Marseille Université and CNRS UMR7289, France. 2. Services d Anatomie Pathologique-Neuropathologique et de Pharmacie, Assistance Publique Hopitaux de Marseille, Marseille, France. 3. Centre Européen de Recherche en Imagerie Médicale, Aix-Marseille Université, Marseille, France. 4. Centre de Recherche en Oncobiologie et Oncopharmacologie, INSERM UMR911 and Aix- Marseille Université, Marseille, France. 5. Centre d Immunophénomique, Aix-Marseille Université UM2, INSERM, US012, CNRS UMS3367, Marseille, France. 6. Centre d Immunologie de Marseille-Luminy, Aix Marseille Université UM2, INSERM, U1104, CNRS UMR7280, Marseille, France. # equivalent participation * corresponding author
2
3
4
5

6
7
8
9 Supplementary table 1 : Molecule Supplier Clone Siglec H ebioscience CD5 BD Bioscience LY6C Biolegend/Ozyme HK1.4 CD45 Biolegend/Ozyme 30F11 CD161 Biolegend/Ozyme NK11 CD11b BD Bioscience M1/70 CD11c Biolegend/Ozyme N418 LysM-GFP CD11c-EYFP CCR2 R&D Siglec F BD Bioscience E Ds-Red2 CD19 ebioscience 1D3 F4/80 Biolegend/Ozyme BM8 CD64 Biolegend/Ozyme X54-5/7.1 CD8a BD Bioscience LY6G BD Bioscience 1A8 CMHCII Biolegend/Ozyme M5/ Live/Dead
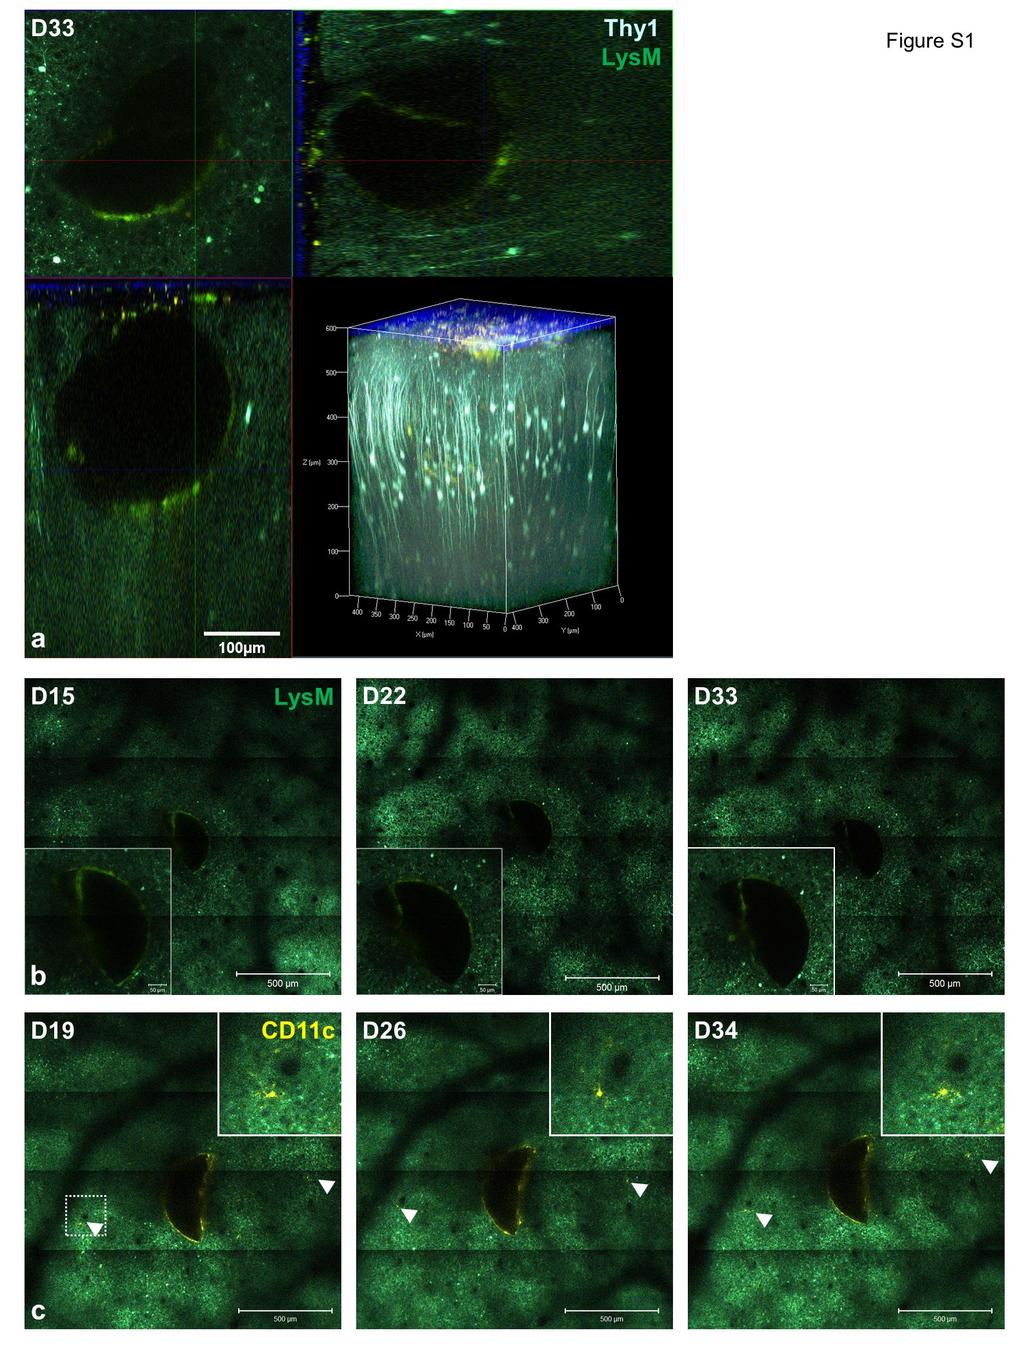
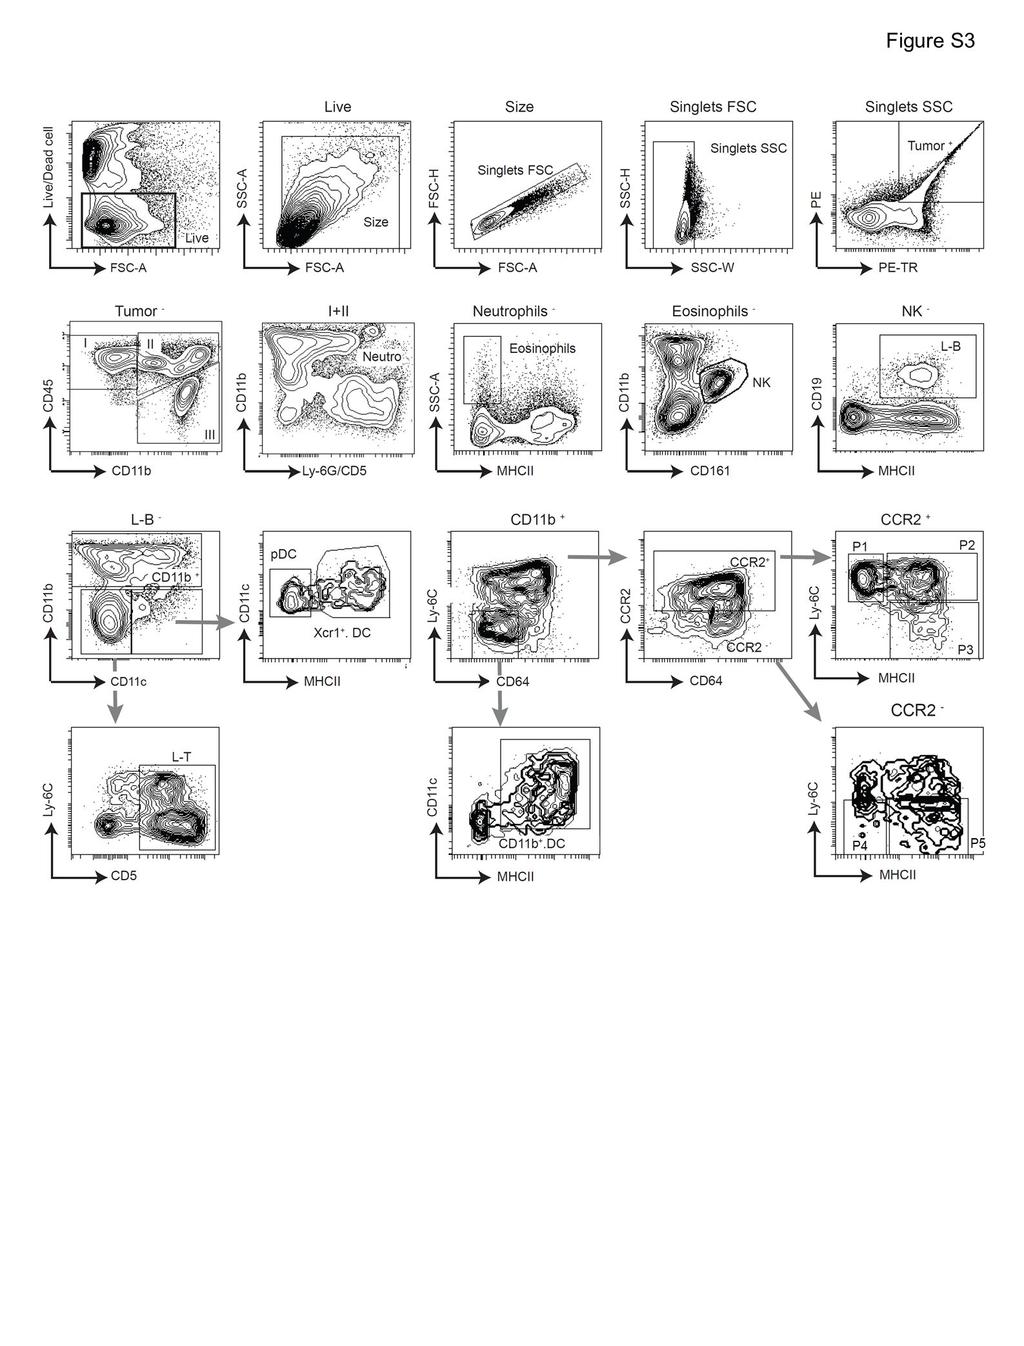
10 SUPPLEMENTARY FIGURES LEGENDS Suppl. Fig.1: Intravital two-photon imaging of CD11c-EYFP and LysM-EGFP cell dynamics in sham-operated animals. (a) Orthogonal reconstruction and 3D- rendering after intravital two- photon imaging of a Thy1- CFP (neurons)/lysm- EGFP (myeloid cells) mouse at D33 post- surgery. Scale- bar: 100µm. (b) Intravital two- photon imaging of a Thy1- CFP/LysM- EGFP mouse at D15, D22 and D33 post- surgery. Some LysM- EGFP cells lay on the Sephadex hemi- bead but do not accumulate in the surrounding tissue. Scale- bar: 500µm. Insets: zoom on the Sephadex hemi- bead. n=6 mice. Scale- bar: 50µm. (c) Intravital two- photon imaging of a Thy1- CFP (neurons) /CD11c- EYFP (microglia, XCR1 + DCs) mouse at D19, D26 and D34 post- surgery. Some CD11c- EYFP + cells lay on the Sephadex hemi- bead but are rare in the surrounding tissues (arrows) and not attracted by the Sephadex hemi- bead over time. Scale- bar: 500µm. Insets: zoom on a CD11c- EYFP + cell that is stable over time (n=6 mice). Scale- bar: 50µm. Blue: second- harmonic generation (dura- mater); cyan: neurons; green: LysM- EGFP + cells; yellow: CD11c- EYFP + cells; dark area: Sephadex hemi- bead. Suppl. Fig.2: Expression of EGFP and EYFP in cell populations I, II and III. Cells corresponding to populations I, II and III were extracted from the brain before tumor grafting (D0) or 21 (T- D21) or 28 days (T- D28) after tumor grafting and analyzed for the expression of the LysM- EGFP and CD11b- EYFP fluorescent reporters. The percentage of EGFP EYFP, EGFP EYFP +, EGFP + EYFP + and EGFP + EYFP cells are indicated in each plot. Suppl. Fig.3: Gating strategy used for analyzing the cells contained within the brain. Cell suspensions were prepared by enzymatic digestion of the brain. Among Sytox Blue- negative cells (gate live cells), single cells (gate singlets) were first selected from which tumor cells (Tumor + ) were excluded on the basis of their fluorescence (DsRed expressing tumor). The remaining CD45 +/low leukocytes Tumor cells were further analyzed. The microglia (III), neutrophils, eosinophils, NK cells and B cells were successively excluded from the CD45 +/low Tumor cells. The remaining cells were then analyzed. CD45 +/low Tumor cells deprived of microglia (III), neutrophils, eosinophils, NK
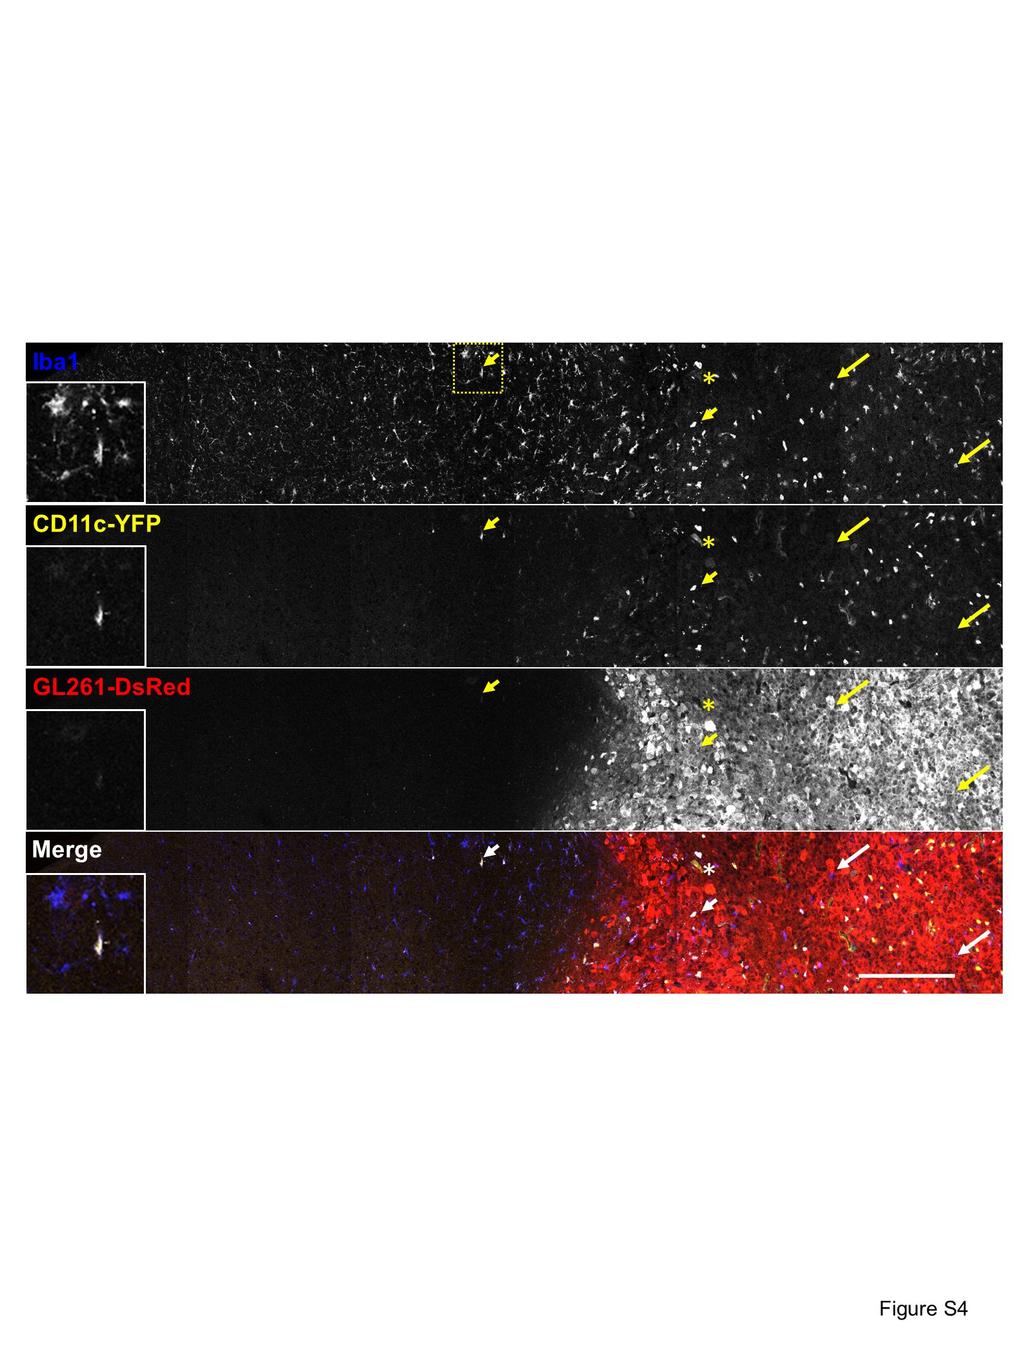
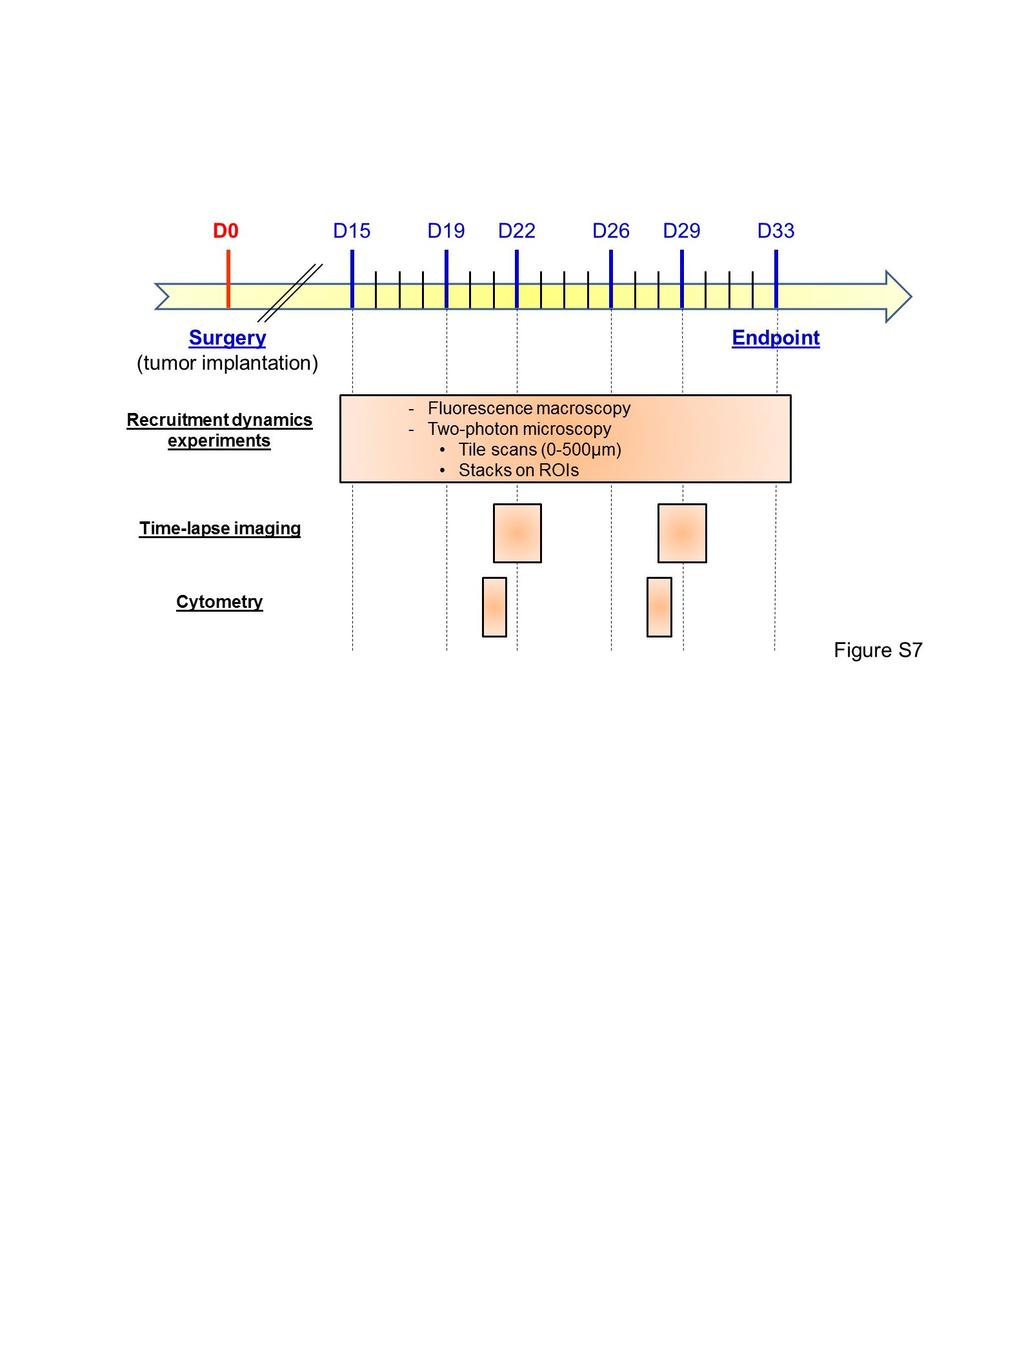
11 cells and B cells were separated on the basis of CD11c and CD11b into three populations. CD11c CD11b cells correspond mainly to CD5 + T cells, CD11c + CD11b cells comprise pdc and Xcr1 + DC, whereas CD11b + cells comprise Ly- 6C CD64 CD11b + DC and monocytes, modcs and macrophages (denoted as P1 to P5 as in 15 ). Suppl. Fig.4: CD11c-YFP + cells characterization in brain parenchyma. Iba1 immunostaining (blue) of a CD11c- EYFP (yellow) mouse cortex bearing a GL261 Ds- Red glioma (red). Arrows: Iba1 + cells that do not colocalize with CD11c- YFP; arrowheads: Iba1 + cells that colocalize with CD11c- YFP; asterisk: CD11c- YFP cell that does not colocalize with Iba1 staining. n=2 mice and 4 ROI per animal were used for the quantification. Scale- bar: 100µm. Suppl. Fig.5: Neutrophil quantification inside the tumor. (a) Percentage of Ly6G + cells among LysM- EGFP + cells at D21 and D28 by quantitative immunohistochemistry. *: p<0.05, Mann- Whitney test. (b) Representative immunohistochemistry image taken at D21. Green: LysM- EGFP; magenta: Ly6G. Scale- bar: 100µm (inset: 20µm). Suppl. Fig.6: Amoeboid LysM-EGFP cells have no preferential direction in the tumor core. (a-b) xy (left) and z (right) tracking of LysM- EGFP amoeboid cells in the tumor core at (a) Day 21 (D21, n=25 cells) and (b) Day 28 (D28, n=26 cells). The origin of the coordinates (0,0,0) was systematically set as the origin of the trajectories at t=0 and tracked for 55min. Graph units: x,y,z: µm; t: seconds. (c) Evolutions of instantaneous speed for 3 individual LysM- EGFP + cells showing irregular kinetics with phases of arrest (speed < 20micron/h). Suppl. Fig.7: Experimental timetable. Suppl. Table.1: Antibodies used for cytometry experiments. SUPPLEMENTARY MOVIES LEGENDS Suppl. Movie 1: Intravital two-photon timelapse imaging over a ten minutes observation period at D21. In the center, note the CD11c- EYFP microglial cells that wrap around tumor cells and transiently interact with a LysM- EGFP + cell. Large
12 deformations of a LysM- EGFP + cell are visible. Time resolution: 10s. Red: Tumor, Green: LysM- EGFP + cells, Yellow: CD11c- EYFP + cells. Scale- bar: 20µm. Suppl. Movie 2: Intravital two-photon timelapse imaging over a five minutes observation period at D28. Note the motile CD11c- EYFP cell (most probably a DC, arrow) whose soma moves during the acquisition period and that expands cytoplasmic protrusions over glioma cells. Deformations of a LysM- EGFP cell (arrowhead) are also highlighted. Time resolution: 1sec. Red: Tumor, Green: LysM- EGFP + cells, Yellow: CD11c- EYFP + cells. Scale- bar: 20µm. Suppl. Movie 3: Intravital two-photon time-lapse imaging over a three-hour observation period at D28. Note the CD11c- EYFP + cells wrapping around tumor cells that acts as a focal spot for interactions with LysM- EGFP + cells over a few hours. Time resolution: 5min. Red: Tumor, Green: LysM- EGFP + cells, Yellow: CD11c- EYFP + cells. Scale- bar: 20µm.
Supplementary Figure 1. Nature Neuroscience: doi: /nn.4547
 Supplementary Figure 1 Characterization of the Microfetti mouse model. (a) Gating strategy for 8-color flow analysis of peripheral Ly-6C + monocytes from Microfetti mice 5-7 days after TAM treatment. Living
Supplementary Information. Tissue-wide immunity against Leishmania. through collective production of nitric oxide
 Supplementary Information Tissue-wide immunity against Leishmania through collective production of nitric oxide Romain Olekhnovitch, Bernhard Ryffel, Andreas J. Müller and Philippe Bousso Supplementary
ROCK/Cdc42-mediated microglial motility and gliapse formation lead to phagocytosis of degenerating dopaminergic neurons in vivo
 Supplementary Information ROCK/Cdc42-mediated microglial motility and gliapse formation lead to phagocytosis of degenerating dopaminergic neurons in vivo Carlos Barcia* 1,2, Carmen M Ros 1,2, Valentina
Nature Immunology: doi: /ni Supplementary Figure 1. Examples of staining for each antibody used for the mass cytometry analysis.
 Supplementary Figure 1 Examples of staining for each antibody used for the mass cytometry analysis. To illustrate the functionality of each antibody probe, representative plots illustrating the expected
Supplementary Figure 1 Chemokine and chemokine receptor expression during muscle regeneration (a) Analysis of CR3CR1 mrna expression by real time-pcr
 Analysis of CR3CR1 mrna expression by real time-pcr") Supplementary Figure 1 Chemokine and chemokine receptor expression during muscle regeneration (a) Analysis of CR3CR1 mrna expression by real time-pcr at day 0, 1, 4, 10 and 21 post- muscle injury. (b)
Supplementary Figure 1 Chemokine and chemokine receptor expression during muscle regeneration (a) Analysis of CR3CR1 mrna expression by real time-pcr at day 0, 1, 4, 10 and 21 post- muscle injury. (b)
Supplementary Information
 Nature Immunology doi:1.138/ni.2477 Supplementary Information Capillary and arteriolar pericytes attract innate leukocytes exiting through venules and instruct them with pattern recognition and motility
Ultrapure laser-synthesized Si-based nanomaterials for biomedical. applications: in vivo assessment of safety and biodistribution
 Supplementary Information Ultrapure laser-synthesized Si-based nanomaterials for biomedical applications: in vivo assessment of safety and biodistribution Tarek Baati, 1 Ahmed Al-Kattan, 2 Marie-Anne Esteve,
Supporting Information
 Supporting Information Desnues et al. 10.1073/pnas.1314121111 SI Materials and Methods Mice. Toll-like receptor (TLR)8 / and TLR9 / mice were generated as described previously (1, 2). TLR9 / mice were
Type of file: PDF Title of file for HTML: Supplementary Information Description: Supplementary Figures
 Type of file: PDF Title of file for HTML: Supplementary Information Description: Supplementary Figures Type of file: MOV Title of file for HTML: Supplementary Movie 1 Description: NLRP3 is moving along
Supplementary Figure 1
 Supplementary Figure 1 Genetic labeling of microglia Male and female 2-3 month-old CreERT2;R26-tdTomato mice or CreERT2;R26-tdTomato;Iba1-eGFP transgenic mice were treated with 1x, 2x (48 h apart), or
Suppl Video: Tumor cells (green) and monocytes (white) are seeded on a confluent endothelial
 and monocytes (white) are seeded on a confluent endothelial") Supplementary Information Häuselmann et al. Monocyte induction of E-selectin-mediated endothelial activation releases VE-cadherin junctions to promote tumor cell extravasation in the metastasis cascade
Supplementary Information Häuselmann et al. Monocyte induction of E-selectin-mediated endothelial activation releases VE-cadherin junctions to promote tumor cell extravasation in the metastasis cascade
SUPPLEMENTARY METHODS
 SUPPLEMENTARY METHODS Histological analysis. Colonic tissues were collected from 5 parts of the middle colon on day 7 after the start of DSS treatment, and then were cut into segments, fixed with 4% paraformaldehyde,
Supplementary Figure 1. Microglia do not show signs of classical immune activation following MD a-b. Images showing immunoreactivity for MHCII (a)
") 1 Supplementary Figure 1. Microglia do not show signs of classical immune activation following MD a-b. Images showing immunoreactivity for MHCII (a) and CD45 (b) in fixed sections of binocular visual cortex
1 Supplementary Figure 1. Microglia do not show signs of classical immune activation following MD a-b. Images showing immunoreactivity for MHCII (a) and CD45 (b) in fixed sections of binocular visual cortex
CD4 and CD8 T cells show a similar accumulation in the tumor stroma.
 Fig S1 CD4 Fibronectin EpCM CD8 CD4 and CD8 T cells show a similar accumulation in the tumor stroma. Fluorescently-labeled CD4 (CMFD, green) and CD8 (Hoechst, yellow) T cells were added to a human lung
SUPPLEMENTARY INFORMATION
 doi: 10.1038/nature06994 A phosphatase cascade by which rewarding stimuli control nucleosomal response A. Stipanovich*, E. Valjent*, M. Matamales*, A. Nishi, J.H. Ahn, M. Maroteaux, J. Bertran-Gonzalez,
Supplemental Table 1. Primer sequences for transcript analysis
 Supplemental Table 1. Primer sequences for transcript analysis Primer Sequence (5 3 ) Primer Sequence (5 3 ) Mmp2 Forward CCCGTGTGGCCCTC Mmp15 Forward CGGGGCTGGCT Reverse GCTCTCCCGGTTTC Reverse CCTGGTGTGCCTGCTC
Endogenous TNFα orchestrates the trafficking of neutrophils into and within lymphatic vessels during acute inflammation
 SUPPLEMENTARY INFORMATION Endogenous TNFα orchestrates the trafficking of neutrophils into and within lymphatic vessels during acute inflammation Samantha Arokiasamy 1,2, Christian Zakian 1, Jessica Dilliway
Supporting Information
 Supporting Information Idoyaga et al. 10.1073/pnas.0812247106 SSC a) Single cell suspension 99 Aqua b) Live cells 96 -W c) Singlets 92 -A CD19+ER119 d) CD19 ER119 cells 97 CD3 e) CD3 cells 27 f) DX5 cells
Supplementary information
 Supplementary information Intrahepatic myeloid cell-aggregates enable local CD8 + T cell expansion and successful immunotherapy against chronic viral liver infection Li- Rung Huang, Dirk Wohlleber, Florian
Supplemental Figure 1. Quantification of proliferation in thyroid of WT, Ctns -/- and grafted
 Supplemental Figure 1. Quantification of proliferation in thyroid of WT, Ctns -/- and grafted Ctns -/- mice. Cells immunolabeled for the proliferation marker (Ki-67) were counted in sections (n=3 WT, n=4
SUPPLEMENTARY INFORMATION
 1. Supplementary Figures and Legends Supplementary Fig. 1. S1P-mediated transcriptional regulation of integrins expressed in OP/monocytoid cells. Real-time quantitative PCR analyses of mrna for two integrins,
Supplementary Table 1
 Supplementary Table 1 Flow Cytometry Antibodies Antibody Fluorochrome Clone Vendor CD45 PE-cyanine 7 30-F11 D ioscience CD3 Pacific lue 17A2 iolegend (San Diego, CA) CD11b APC M1/70 iolegend (San Diego,
sequences of a styx mutant reveals a T to A transversion in the donor splice site of intron 5
 sfigure 1 Styx mutant mice recapitulate the phenotype of SHIP -/- mice. (A) Analysis of the genomic sequences of a styx mutant reveals a T to A transversion in the donor splice site of intron 5 (GTAAC
Supplemental Figures Supplemental Figure 1:
 Supplemental Figures Supplemental Figure 1: Representative FACS data showing Concurrent Brain cell type Acquisition using either Percoll PLUS (top row) or myelin removal beads (bottom two rows). Debris
Supplemental figure 1. PDGFRα is expressed dominantly by stromal cells surrounding mammary ducts and alveoli. A) IHC staining of PDGFRα in
 IHC staining of PDGFRα in") Supplemental figure 1. PDGFRα is expressed dominantly by stromal cells surrounding mammary ducts and alveoli. A) IHC staining of PDGFRα in nulliparous (left panel) and InvD6 mouse mammary glands (right
Supplemental figure 1. PDGFRα is expressed dominantly by stromal cells surrounding mammary ducts and alveoli. A) IHC staining of PDGFRα in nulliparous (left panel) and InvD6 mouse mammary glands (right
d e f Spatiotemporal quantification of subcellular ATP levels in a single HeLa cell during changes in morphology Supplementary Information
 Ca 2+ level (a. u.) Area (a. u.) Normalized distance Normalized distance Center Edge Center Edge Relative ATP level Relative ATP level Supplementary Information Spatiotemporal quantification of subcellular
Afferent lymph-derived T cells and dendritic cells use different CCR7-dependent routes for lymph node entry and intranodal migration
 Braun et al. Supplementary Information 1 Supplementary Information Afferent lymph-derived T cells and dendritic cells use different CCR7-dependent routes for lymph node entry and intranodal migration Asolina
SUPPORTING INFORMATIONS
 SUPPORTING INFORMATIONS Mice MT/ret RetCD3ε KO α-cd25 treated MT/ret Age 1 month 3 mnths 6 months 1 month 3 months 6 months 1 month 3 months 6 months 2/87 Survival 87/87 incidence of 17/87 1 ary tumor
IL-34 is a tissue-restricted ligand of CSF1R required for the development of Langerhans cells and microglia
 Supplementary Figures IL-34 is a tissue-restricted ligand of CSF1R required for the development of Langerhans cells and microglia Yaming Wang, Kristy J. Szretter, William Vermi, Susan Gilfillan, Cristina
T H E J O U R N A L O F C E L L B I O L O G Y
 T H E J O U R N A L O F C E L L B I O L O G Y Supplemental material Lu et al., http://www.jcb.org/cgi/content/full/jcb.201012063/dc1 Figure S1. Kinetics of nuclear envelope assembly, recruitment of Nup133
SUPPLEMENTARY INFORMATION
 doi:10.1038/nature10188 Supplementary Figure 1. Embryonic epicardial genes are down-regulated from midgestation stages and barely detectable post-natally. Real time qrt-pcr revealed a significant down-regulation
% of live splenocytes. STAT5 deletion. (open shapes) % ROSA + % floxed
 % ROSA + % floxed") Supp. Figure 1. a 14 1 1 8 6 spleen cells (x1 6 ) 16 % of live splenocytes 5 4 3 1 % of live splenocytes 8 6 4 b 1 1 c % of CD11c + splenocytes (closed shapes) 8 6 4 8 6 4 % ROSA + (open shapes) % floxed
Supp. Figure 1. a 14 1 1 8 6 spleen cells (x1 6 ) 16 % of live splenocytes 5 4 3 1 % of live splenocytes 8 6 4 b 1 1 c % of CD11c + splenocytes (closed shapes) 8 6 4 8 6 4 % ROSA + (open shapes) % floxed
Chronic variable stress activates hematopoietic stem cells
 SUPPLEMENTARY INFORMATION Chronic variable stress activates hematopoietic stem cells Timo Heidt *, Hendrik B. Sager *, Gabriel Courties, Partha Dutta, Yoshiko Iwamoto, Alex Zaltsman, Constantin von zur
Supplemental Information. Genomic Characterization of Murine. Monocytes Reveals C/EBPb Transcription. Factor Dependence of Ly6C Cells
 Immunity, Volume 46 Supplemental Information Genomic Characterization of Murine Monocytes Reveals C/EBPb Transcription Factor Dependence of Ly6C Cells Alexander Mildner, Jörg Schönheit, Amir Giladi, Eyal
SUPPLEMENTARY INFORMATION
 DOI: 10.1038/ncb2988 Supplementary Figure 1 Kif7 L130P encodes a stable protein that does not localize to cilia tips. (a) Immunoblot with KIF7 antibody in cell lysates of wild-type, Kif7 L130P and Kif7
F-actin VWF Vinculin. F-actin. Vinculin VWF
 a F-actin VWF Vinculin b F-actin VWF Vinculin Supplementary Fig. 1. WPBs in HUVECs are located along stress fibers and at focal adhesions. (a) Immunofluorescence images of f-actin (cyan), VWF (yellow),
SUPPLEMENTARY INFORMATION
 doi:10.1038/nature10134 Supplementary Figure 1. Anti-inflammatory activity of sfc. a, Autoantibody immune complexes crosslink activating Fc receptors, promoting activation of macrophages, and WWW.NATURE.COM/NATURE
Supplementary Information
 Supplementary Information Title Degeneration and impaired regeneration of gray matter oligodendrocytes in amyotrophic lateral sclerosis Authors Shin H. Kang, Ying Li, Masahiro Fukaya, Ileana Lorenzini,
Supplemental Materials Molecular Biology of the Cell
 Supplemental Materials Molecular Biology of the Cell Garcia-Alvarez et al. Supplementary Figure Legends Figure S1.Expression and RNAi-mediated silencing of STIM1 in hippocampal neurons (DIV, days in vitro).
Supplementary Materials
 Supplementary Materials 43 Figure S1. CD123 in acute lymphoblastic leukemia and leukemia-initiating cells. A. CD123 (histograms) is highly and homogenously expressed in B-ALL blasts (as defined by live,
Akt targeting as a strategy to boost chemotherapy efficacy in non-small cell lung cancer through metabolism suppression.
 Akt targeting as a strategy to boost chemotherapy efficacy in non-small cell lung cancer through metabolism suppression. Marion Le Grand 1,2, Raphael Berges 1, Eddy Pasquier 1,3, Marie-Pierre Montero 1,
Supplementary Figure S1 (a) (b)
 (b)") Supplementary Figure S1: IC87114 does not affect basal Ca 2+ level nor nicotineinduced Ca 2+ influx. (a) Bovine chromaffin cells were loaded with Fluo-4AM (1 μm) in buffer A containing 0.02% of pluronic
Supplementary Figure S1: IC87114 does not affect basal Ca 2+ level nor nicotineinduced Ca 2+ influx. (a) Bovine chromaffin cells were loaded with Fluo-4AM (1 μm) in buffer A containing 0.02% of pluronic
Supplementary Figure 1. mtor LysM and Rictor LysM mice have normal cellularity and percentages of hematopoe>c cells. a. Cell numbers of lung, liver,
 a. b. c. Supplementary Figure 1. mtor LysM and Rictor LysM mice have normal cellularity and percentages of hematopoe>c cells. a. Cell numbers of lung, liver, and spleen. b. Cell numbers of bone marrow
J. Cell Sci. 129: doi: /jcs : Supplementary information
 Movie 1. AgLDL is contained in small sub-regions of the lysosomal synapse that are acidic. J774 cells were incubated with agldl dual labeled with a ph sensitive and a ph insensitive fluorophore for 1 hr.
Supplemental Information. Aryl Hydrocarbon Receptor Controls. Monocyte Differentiation. into Dendritic Cells versus Macrophages
 Immunity, Volume 47 Supplemental Information Aryl Hydrocarbon Receptor Controls Monocyte Differentiation into Dendritic Cells versus Macrophages Christel Goudot, Alice Coillard, Alexandra-Chloé Villani,
GFP/Iba1/GFAP. Brain. Liver. Kidney. Lung. Hoechst/Iba1/TLR9!
 Supplementary information a +KA Relative expression d! Tlr9 5!! 5! NSC Neuron Astrocyte Microglia! 5! Tlr7!!!! NSC Neuron Astrocyte! GFP/Sβ/! Iba/Hoechst Microglia e Hoechst/Iba/TLR9! GFP/Iba/GFAP f Brain
CD3 coated cover slips indicating stimulatory contact site, F-actin polymerization and
 SUPPLEMENTAL FIGURES FIGURE S1. Detection of MCs. A, Schematic representation of T cells stimulated on anti- CD3 coated cover slips indicating stimulatory contact site, F-actin polymerization and microclusters.
SHREE ET AL, SUPPLEMENTAL MATERIALS. (A) Workflow for tumor cell line derivation and orthotopic implantation.
 Workflow for tumor cell line derivation and orthotopic implantation.") SHREE ET AL, SUPPLEMENTAL MATERIALS SUPPLEMENTAL FIGURE AND TABLE LEGENDS Supplemental Figure 1. Derivation and characterization of TS1-TGL and TS2-TGL PyMT cell lines and development of an orthotopic
SHREE ET AL, SUPPLEMENTAL MATERIALS SUPPLEMENTAL FIGURE AND TABLE LEGENDS Supplemental Figure 1. Derivation and characterization of TS1-TGL and TS2-TGL PyMT cell lines and development of an orthotopic
SUPPLEMENTARY FIGURES
 SUPPLEMENTARY FIGURES 1 2 3 4 SUPPLEMENTARY TABLES Supplementary Table S1. Brain Tumors used in the study Code Tumor Classification Age Gender HuTuP51 Glioblastoma 57 Male HuTuP52 Glioblastoma 53 Male
Supplementary Materials for
 www.sciencetranslationalmedicine.org/cgi/content/full/4/117/117ra8/dc1 Supplementary Materials for Notch4 Normalization Reduces Blood Vessel Size in Arteriovenous Malformations Patrick A. Murphy, Tyson
Supplementary Figure 1. Immune profiles of untreated and PD-1 blockade resistant EGFR and Kras mouse lung tumors (a) Total lung weight of untreated
 Total lung weight of untreated") 1 Supplementary Figure 1. Immune profiles of untreated and PD-1 blockade resistant EGFR and Kras mouse lung tumors (a) Total lung weight of untreated (U) EGFR TL mice (n=7), Kras mice (n=7), PD-1 blockade
1 Supplementary Figure 1. Immune profiles of untreated and PD-1 blockade resistant EGFR and Kras mouse lung tumors (a) Total lung weight of untreated (U) EGFR TL mice (n=7), Kras mice (n=7), PD-1 blockade
Nature Neuroscience doi: /nn Supplementary Figure 1. Characterization of viral injections.
 Supplementary Figure 1 Characterization of viral injections. (a) Dorsal view of a mouse brain (dashed white outline) after receiving a large, unilateral thalamic injection (~100 nl); demonstrating that
effect on the upregulation of these cell surface markers. The mean peak fluorescence intensity
 SUPPLEMENTARY FIGURE 1 Supplementary Figure 1 ASIC1 disruption or blockade does not effect in vitro and in vivo antigen-presenting cell activation. (a) Flow cytometric analysis of cell surface molecules
Nature Neuroscience: doi: /nn Supplementary Figure 1
 Supplementary Figure 1 Quantification of myelin fragments in the aging brain (a) Electron microscopy on corpus callosum is shown for a 18-month-old wild type mice. Myelin fragments (arrows) were detected
Synergy of radiotherapy and PD-1 blockade in Kras-mutant lung cancer
 Supplementary Information Synergy of radiotherapy and PD-1 blockade in Kras-mutant lung cancer Grit S. Herter-Sprie, Shohei Koyama, Houari Korideck, Josephine Hai, Jiehui Deng, Yvonne Y. Li, Kevin A. Buczkowski,
Supplemental Information. Tissue-Resident Macrophages in Pancreatic. Ductal Adenocarcinoma Originate from Embryonic
 Immunity, Volume 7 Supplemental Information Tissue-Resident Macrophages in Pancreatic Ductal Adenocarcinoma Originate from Embryonic Hematopoiesis and Promote Tumor Progression Yu Zhu, John M. Herndon,
Ahtiainen et al., http :// /cgi /content /full /jcb /DC1
 Supplemental material JCB Ahtiainen et al., http ://www.jcb.org /cgi /content /full /jcb.201512074 /DC1 THE JOURNAL OF CELL BIOLOGY Figure S1. Distinct distribution of different cell cycle phases in the
DC were seeded into tissue culture dishes in IMDM 2% FCS, and added with PMN. (1:1; PMN: DC) for 16h also in the presence of DNAse (100 U/ml); DC were
 for 16h also in the presence of DNAse (100 U/ml); DC were") Supplementary methods Flow cytometric analysis of DCs. DC were seeded into tissue culture dishes in IMDM 2% FCS, and added with PMN (1:1; PMN: DC) for 16h also in the presence of DNAse (100 U/ml); DC were
Supplementary methods Flow cytometric analysis of DCs. DC were seeded into tissue culture dishes in IMDM 2% FCS, and added with PMN (1:1; PMN: DC) for 16h also in the presence of DNAse (100 U/ml); DC were
Supplemental Figure 1. IL-3 blockade with Fab CSL362 depletes plasmacytoid dendritic cells (pdcs), but not basophils, at higher doses.
, but not basophils, at higher doses.") Supplemental Figure 1. IL-3 blockade with Fab CSL362 depletes plasmacytoid dendritic cells (pdcs), but not basophils, at higher doses. Percentage of viable (A) pdcs (Sytox Blue-, Lin1-, HLADR+, BDCA2++)
Supplemental Figure 1. IL-3 blockade with Fab CSL362 depletes plasmacytoid dendritic cells (pdcs), but not basophils, at higher doses. Percentage of viable (A) pdcs (Sytox Blue-, Lin1-, HLADR+, BDCA2++)
pplementary Figur Supplementary Figure 1. a.
 pplementary Figur Supplementary Figure 1. a. Quantification by RT-qPCR of YFV-17D and YFV-17D pol- (+) RNA in the supernatant of cultured Huh7.5 cells following viral RNA electroporation of respective
COPD lungs show an attached stratified mucus layer that separate. bacteria from the epithelial cells resembling the protective colonic
 COPD lungs show an attached stratified mucus layer that separate bacteria from the epithelial cells resembling the protective colonic mucus SUPPLEMENTARY TABLES AND FIGURES Tables S1 S8, page 1 and separate
Supplementary Figure 1 Expression of Crb3 in mouse sciatic nerve: biochemical analysis (a) Schematic of Crb3 isoforms, ERLI and CLPI, indicating the
 Schematic of Crb3 isoforms, ERLI and CLPI, indicating the") Supplementary Figure 1 Expression of Crb3 in mouse sciatic nerve: biochemical analysis (a) Schematic of Crb3 isoforms, ERLI and CLPI, indicating the location of the transmembrane (TM), FRM binding (FB)
Supplementary Figure 1 Expression of Crb3 in mouse sciatic nerve: biochemical analysis (a) Schematic of Crb3 isoforms, ERLI and CLPI, indicating the location of the transmembrane (TM), FRM binding (FB)
Supplementary Figure 1. Double-staining immunofluorescence analysis of invasive colon and breast cancers. Specimens from invasive ductal breast
 Supplementary Figure 1. Double-staining immunofluorescence analysis of invasive colon and breast cancers. Specimens from invasive ductal breast carcinoma (a) and colon adenocarcinoma (b) were staining
mm Distance (mm)
") b a Magnet Illumination Coverslips MPs Objective 2575 µm 1875 µm 1575 µm 1075 µm 875 µm 545 µm 20µm 2 3 0.5 0.3mm 1 1000 100 10 1 0.1 1000 100 10 1 0.1 Field Induction (Gauss) 1.5 0 5 10 15 20 Distance
b a Magnet Illumination Coverslips MPs Objective 2575 µm 1875 µm 1575 µm 1075 µm 875 µm 545 µm 20µm 2 3 0.5 0.3mm 1 1000 100 10 1 0.1 1000 100 10 1 0.1 Field Induction (Gauss) 1.5 0 5 10 15 20 Distance
Fisher et al. Supplemental Figure 1
 Supplemental Figure 1 A TNF IL-1 IL-6 CCL2 CCL5 CXCL10 pg/mg total protein 50 30 10 4,000 3,000 2,000 1,000 n.d. 1 1 14,000 12,000 10,000 8,000 6,000 4,000 2,000 6,000,000 CT26 5,000 16,000 B16 4,000 12,000
MII. Supplement Figure 1. CapZ β2. Merge. 250ng. 500ng DIC. Merge. Journal of Cell Science Supplementary Material. GFP-CapZ β2 DNA
 A GV GVBD MI DNA CapZ β2 CapZ β2 Merge B DIC GFP-CapZ β2 Merge CapZ β2-gfp 250ng 500ng Supplement Figure 1. MII A early MI late MI Control RNAi CapZαβ DNA Actin Tubulin B Phalloidin Intensity(A.U.) n=10
nature methods Organelle-specific, rapid induction of molecular activities and membrane tethering
 nature methods Organelle-specific, rapid induction of molecular activities and membrane tethering Toru Komatsu, Igor Kukelyansky, J Michael McCaffery, Tasuku Ueno, Lidenys C Varela & Takanari Inoue Supplementary
Supplementary Figures
 Supplementary Figures Supplementary Fig. 1. Galectin-3 is present within tumors. (A) mrna expression levels of Lgals3 (galectin-3) and Lgals8 (galectin-8) in the four classes of cell lines as determined
Ultra-filtration of human serum for improved quantitative analysis of low molecular weight biomarkers
 Electronic Supplementary Material (ESI) for Analyst. This journal is The Royal Society of Chemistry 2016 Ultra-filtration of human serum for improved quantitative analysis of low molecular weight biomarkers
Supplementary Figure 1: TSLP receptor skin expression in dcssc. A: Healthy control (HC) skin with TSLP receptor expression in brown (10x
 skin with TSLP receptor expression in brown (10x") Supplementary Figure 1: TSLP receptor skin expression in dcssc. A: Healthy control (HC) skin with TSLP receptor expression in brown (10x magnification). B: Second HC skin stained for TSLP receptor in brown
Supplementary Figure 1: TSLP receptor skin expression in dcssc. A: Healthy control (HC) skin with TSLP receptor expression in brown (10x magnification). B: Second HC skin stained for TSLP receptor in brown
Supplemental Figure 1. Intracranial transduction of a modified ptomo lentiviral vector in the mouse
 Supplemental figure legends Supplemental Figure 1. Intracranial transduction of a modified ptomo lentiviral vector in the mouse hippocampus targets GFAP-positive but not NeuN-positive cells. (A) Stereotaxic
Supplementary Information
 Supplementary Information Distinct bone marrow-derived and tissue resident macrophage lineages proliferate at key stages during inflammation. 1 Luke C. Davies, 1 Marcela Rosas, 2 Stephen J. Jenkins, 1
Fibrinogen-induced perivascular microglial clustering is required for the. development of axonal damage in neuroinflammation
 SUPPLEMENTARY INFORMATION Fibrinogen-induced perivascular microglial clustering is required for the development of axonal damage in neuroinflammation Dimitrios Davalos, Jae Kyu Ryu, Mario Merlini, Kim
Supplementary material page 1/10
 Supplementary Figure 1. Metoprolol administration during ongoing AMI reduces MVO in STEMI patients (a, b) Complete representative CMR exams (short-axis covering the entire left ventricle (LV) from base
Supplementary Figure 1. Characterization of basophils after reconstitution of SCID mice
 Supplementary figure legends Supplementary Figure 1. Characterization of after reconstitution of SCID mice with CD4 + CD62L + T cells. (A-C) SCID mice (n = 6 / group) were reconstituted with 2 x 1 6 CD4
SUPPLEMENTARY FIG. S2. Representative counting fields used in quantification of the in vitro neural differentiation of pattern of dnscs.
 Supplementary Data SUPPLEMENTARY FIG. S1. Representative counting fields used in quantification of the in vitro neural differentiation of pattern of anpcs. A panel of lineage-specific markers were used
Supplementary Figure 1.
 Supplementary Figure 1. Transduction of adipocytes after intra-ewat administration of AAV vectors. A: Immunostaining against GFP (green) in sections of ewat two weeks after the intra-ewat administration
Structural basis for the role of inhibition in facilitating adult brain plasticity
 Structural basis for the role of inhibition in facilitating adult brain plasticity Jerry L. Chen, Walter C. Lin, Jae Won Cha, Peter T. So, Yoshiyuki Kubota & Elly Nedivi SUPPLEMENTARY FIGURES 1-6 a b M
Nature Neuroscience: doi: /nn Supplementary Figure 1. MADM labeling of thalamic clones.
 Supplementary Figure 1 MADM labeling of thalamic clones. (a) Confocal images of an E12 Nestin-CreERT2;Ai9-tdTomato brain treated with TM at E10 and stained for BLBP (green), a radial glial progenitor-specific
Supplementary Figure 1: GFAP positive nerves in patients with adenocarcinoma of
 SUPPLEMENTARY FIGURES AND MOVIE LEGENDS Supplementary Figure 1: GFAP positive nerves in patients with adenocarcinoma of the pancreas. (A) Images of nerves stained for GFAP (green), S100 (red) and DAPI
Supplementary Figure 1
 Supplementary Figure 1 AAV-GFP injection in the MEC of the mouse brain C57Bl/6 mice at 4 months of age were injected with AAV-GFP into the MEC and sacrificed at 7 days post injection (dpi). (a) Brains
Macrophages form functional vascular mimicry channels in vivo. SI Figures and Legend
 Macrophages form functional vascular mimicry channels in vivo Authors: *Faith H. Barnett, *Mauricio Rosenfeld, Malcolm Wood, William Kiosses, Yoshihiko Usui, Valentina Marchetti, Edith Aguilar, and Martin
Blocking antibodies and peptides. Rat anti-mouse PD-1 (29F.1A12, rat IgG2a, k), PD-
, PD-") Supplementary Methods Blocking antibodies and peptides. Rat anti-mouse PD-1 (29F.1A12, rat IgG2a, k), PD- L1 (10F.9G2, rat IgG2b, k), and PD-L2 (3.2, mouse IgG1) have been described (24). Anti-CTLA-4 (clone
Supplementary Methods Blocking antibodies and peptides. Rat anti-mouse PD-1 (29F.1A12, rat IgG2a, k), PD- L1 (10F.9G2, rat IgG2b, k), and PD-L2 (3.2, mouse IgG1) have been described (24). Anti-CTLA-4 (clone
Nature Immunology: doi: /ni.3412
 Supplementary Figure 1 Gata1 expression in heamatopoietic stem and progenitor populations. (a) Unsupervised clustering according to 100 top variable genes across single pre-gm cells. The two main cell
Authors: K. L. Arendt, M. Royo, M. Fernández-Monreal, S. Knafo, C. N. Petrok, J.
 SUPPLEMENTARY INFORMATION Title: PIP 3 controls synaptic function by maintaining AMPA receptor clustering at the postsynaptic membrane Authors: K. L. Arendt, M. Royo, M. Fernández-Monreal, S. Knafo, C.
Nature Immunology: doi: /ni Supplementary Figure 1. Cytokine pattern in skin in response to urushiol.
 Supplementary Figure 1 Cytokine pattern in skin in response to urushiol. Wild-type (WT) and CD1a-tg mice (n = 3 per group) were sensitized and challenged with urushiol (uru) or vehicle (veh). Quantitative
TITLE: Microenvironments and Signaling Pathways Regulating Early Dissemination, Dormancy, and Metastasis
 AWARD NUMBER: W81XWH-14-1-0296 TITLE: Microenvironments and Signaling Pathways Regulating Early Dissemination, Dormancy, and Metastasis PRINCIPAL INVESTIGATOR: John Condeelis CONTRACTING ORGANIZATION:
SUPPLEMENTAL MATERIALS
 Supplementary Methods SUPPLEMENTAL MATERIALS Supplementary References Supplementary Video Legends Supplementary Figures and Legends SUPPLEMENTARY METHODS Additional animals and cell lines used for the
Supplementary information. Nkx2.1 regulates the generation of telencephalic astrocytes during embryonic
 Supplementary information Nkx2.1 regulates the generation of telencephalic astrocytes during embryonic development Shilpi Minocha 1*, Delphine Valloton 1*, Yvan Arsenijevic 2, Jean-René Cardinaux 3, Raffaella
Pathologic Stage. Lymph node Stage
 ASC ASC a c Patient ID BMI Age Gleason score Non-obese PBMC 1 22.1 81 6 (3+3) PBMC 2 21.9 6 6 (3+3) PBMC 3 22 84 8 (4+4) PBMC 4 24.6 68 7 (3+4) PBMC 24. 6 (3+3) PBMC 6 24.7 73 7 (3+4) PBMC 7 23. 67 7 (3+4)
a surface permeabilized
 a surface permeabilized RAW 64.7 P388D1 J774 b CD11b + Ly-6G - Blood Monocytes WT Supplementary Figure 1. Cell surface expression on macrophages and DCs. (a) RAW64.7, P388D1, and J774 cells were subjected
Rapid blue-light mediated induction of protein interactions in living cells
 Nature Methods Rapid blue-light mediated induction of protein interactions in living cells Matthew J Kennedy, Robert M Hughes, Leslie A Peteya, Joel W Schwartz, Michael D Ehlers & Chandra L Tucker Supplementary
File name: Supplementary Information Description: Supplementary Figures, Supplementary Table and Supplementary References
 File name: Supplementary Information Description: Supplementary Figures, Supplementary Table and Supplementary References File name: Supplementary Data 1 Description: Summary datasheets showing the spatial
Mitosis. Single Nano Micro Milli Macro. Primary. PCNA expression
 a b c DAPI YFP CC3 DAPI YFP PCNA DAPI YFP ph3 DAPI YFP KI67 e 6 Mitosis f 1 PCNA expression %ph3 + /YFP + n= 63 87 61 3 13 8 n= 15 3 9 1 5 %PCNA+/YFP+ 8 6 Supplementary Figure 1. Proliferation/apoptosis
In Vivo Imaging of Virological Synapses
 In Vivo Imaging of Virological Synapses Xaver Sewald 1, David G. Gonzalez 2, Ann M. Haberman 2, and Walther Mothes 1 * 1 Department of Microbial Pathogenesis, Yale University School of Medicine, New Haven,
Supplemental Table I.
 Supplemental Table I Male / Mean ± SEM n Mean ± SEM n Body weight, g 29.2±0.4 17 29.7±0.5 17 Total cholesterol, mg/dl 534.0±30.8 17 561.6±26.1 17 HDL-cholesterol, mg/dl 9.6±0.8 17 10.1±0.7 17 Triglycerides,
Supplementary Materials for
 www.sciencetranslationalmedicine.org/cgi/content/full/8/352/352ra110/dc1 Supplementary Materials for Spatially selective depletion of tumor-associated regulatory T cells with near-infrared photoimmunotherapy
Extracellular vesicles are transferred from melanocytes to keratinocytes after UVA irradiation
 Supplementary material; Title; Extracellular vesicles are transferred from melanocytes to keratinocytes after UVA irradiation Authors; Petra Wäster 1, Ida Eriksson 1, Linda Vainikka 1, Inger Rosdahl 2,
SUPPLEMENTARY INFORMATION
 DOI: 10.1038/ncb2697 Figure S1 Cytokeratin 5 is a specific marker for basal and intermediate cells in all mouse prostate lobes. (a) Immunofluorescence staining showing co-localization of YFP with p63 in
Supplementary information - Table (1), Figures (12), and Videos (5)
, Figures (12), and Videos (5)") Supplementary information - Table (1), Figures (12), and Videos (5) A soft, transparent, freely accessible cranial window for chronic imaging and electrophysiology Chaejeong Heo 1, Hyejin Park 1, 2, Yong-Tae
Supplementary information - Table (1), Figures (12), and Videos (5) A soft, transparent, freely accessible cranial window for chronic imaging and electrophysiology Chaejeong Heo 1, Hyejin Park 1, 2, Yong-Tae