Supplementary figure 1
|
|
|
- Pauline Long
- 5 years ago
- Views:
Transcription
 which is in correlation with the increase of myc intensity (Fig.1E).")
1 Supplementary figure 1 (A) Quantitative analysis of F-actin signal intensity in NIH3T3 cells treated with PTD4-myc- RBD. NIH3T3 cells were treated with PTD4-myc-RBD as described. Please note the increase in the F-actin signal intensity under the cell membrane (left) which is in correlation with the increase of myc intensity (Fig.1E). The F-actin intensity remained unchanged in the intermediate zone among the stress fibers as comparing to serum untreated cells. (B) p75-fc chimera blocks the activation of Rho after Nogo addition. Cerebellar granule neurons were treated with PTD4-myc-RBD as described, and 2 hours before Nogo
2 addition 10µg/ml of p75-fc chimera was added into the medium. The middle panel shows diffuse distribution of PTD4-myc-RBD without any colocalization with p75 NTR signal. The result is consistent with the notion that p75-fc blocks activation of Rho by myelin-derived products. Scale bar = 10 µm. (C) Activation of Rho in CGN plated on myelin. CGN were plated on myelin and the assay was performed as described. The signal for PTD4-myc- RBD in the middle panel shows colocalization with the p75 NTR signal (left) panel. Scale bar = 10 µm.

3 Supplemetary Figure 2 Colocalization of myc staining with anti-neuron-specific b tubulin III (TuJ-1) in the spinal cord. The images are taken from corticospinal tract 3 mm from the injury site in the rostral stump. PTD4-myc-RBD was administered via the tail vein of the rats with spinal cord injury. Note the colocalization of myc with TuJ1, showing that the fibers are neurons. Scale bar = 20 µm.
4 Supplemetary Figure 3
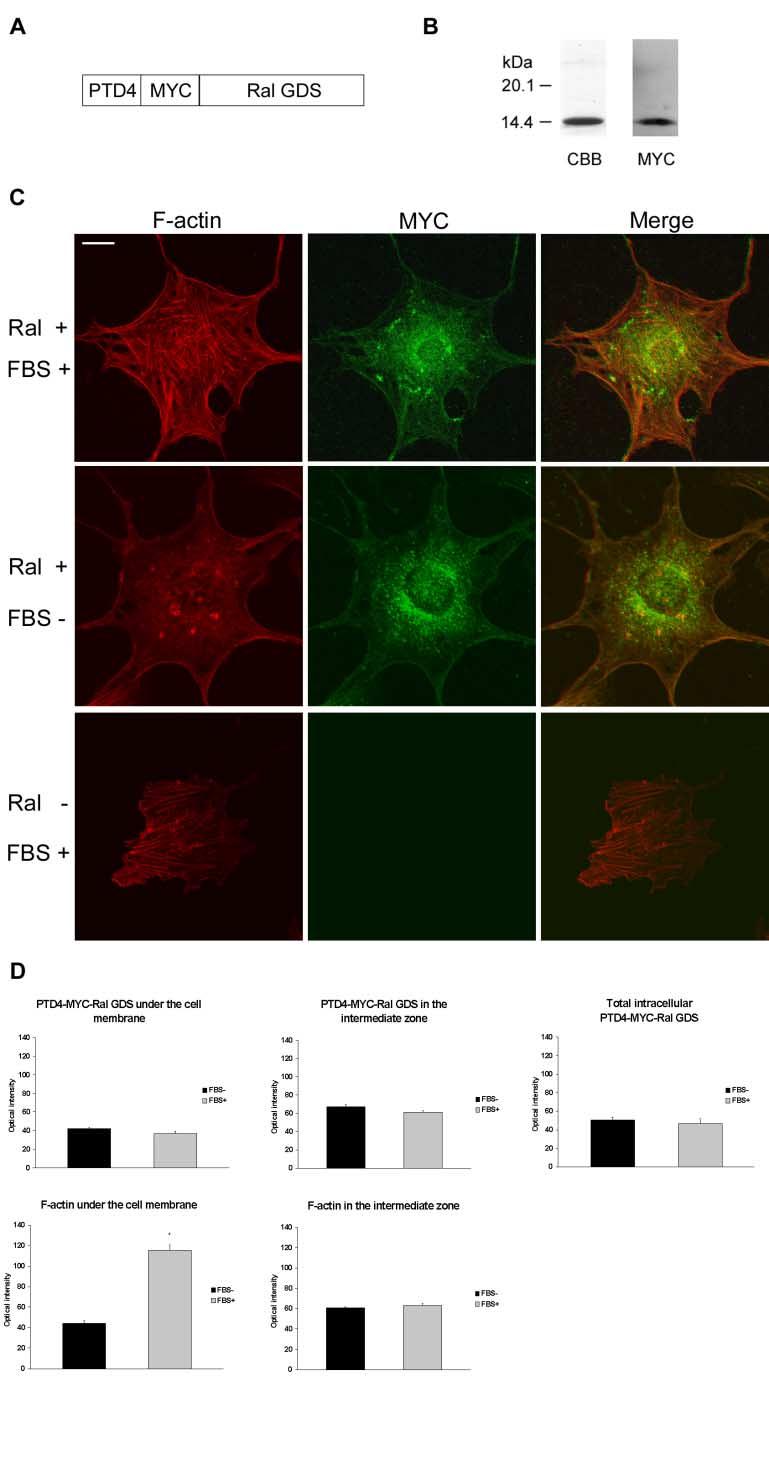
5 PTD4-myc-RalGDS does not induce cytoskeletal changes in the NIH3T3 cells. (A) Structure of PTD4-myc-RalGDS. RalGDS-Rap binding domain of RalGDS. (B) Purification of PTD4-myc-RalGDS. PTD4-myc-RalGDS was produced as a GST-fused protein, and the GST moiety was removed. Coomasie blue staining (left) and immunoblot with the anti-myc antibody (right) are shown. (C) PTD4-myc-RalGDS does not detect the active form of Rho. Serum starved NIH 3T3 cells were either treated or not treated with the serum. The cells were stained with anti-myc antibody (MYC) and phalloidin (F-actin). The PTD4-myc-RalGDS signal is not colocalized with F-actin and shows no detectable changes in the distribution after 10% FBS stimulation. Ral, PTD4-myc-RalGDS. Scale bar = 10 µm. (D) Quantitative analysis of PTD4-myc-RalGDS and F-actin signal distribution following serum stimulation. Note that no significant changes of myc signal intensity were observed after serum stimulation. PTD4-myc-RalGDS signal intensity does not correlate with the increase in signal intensity of F-actin under the cell membrane. The total intensity of myc signal was not affected by serum stimulation.
 Purification of PTD4- myc-20aa. PTD4-myc-20aa was produced as a GST-fused protein, and the GST moiety")
6 Supplementary Figure 4 PTD4-myc-20aa does not induce cytoskeletal changes in the serum starved NIH3T3 cells after fetal bovine serum addition. (A) Structure of PTD4-myc-20aa. 20aa - 20 random amino acids with the sequence NSRAGYAGRTQSCRGNGIRM. (B) Purification of PTD4- myc-20aa. PTD4-myc-20aa was produced as a GST-fused protein, and the GST moiety
7 was removed. Coomasie blue staining (left) and immunoblot with the anti-myc antibody (right) are shown. (C) PTD4-myc-20aa does not detect the active form of Rho. Serum starved NIH 3T3 cells were either treated or not treated with the serum. The cells were stained with anti-myc antibody (MYC) and phalloidin (F-actin). The PTD4-myc-20 signal is not colocalized with F-actin (Fig.1D) and shows no detectable changes in the distribution after 10% FBS addition. 20 aa, PTD4-myc-20aa. Scale bar = 10 µm. (D) Quantitative analysis of PTD4-myc-20aa and F-actin signal intensity following serum stimulation. Note that no significant changes of myc signal intensity were observed after serum stimulation. PTD4-myc-20aa signal intensity does not correlate with the increase in signal intensity of F-actin under the cell membrane. The total intensity of myc signal was not affected by serum stimulation.
 Purification of ScrPTD4-myc-RBD. ScrPTD4-myc-RBD was produced as a GST-fused protein, and the GST moiety was removed.")
8 Supplementary Figure 5 Scrambled PTD4-myc-RBD is not incorporated into the NIH3T3 cells. (A) Structure of ScrPTD4-myc-RBD. ScrPTD4 scrambled version of PTD4 with the amino acid sequence; ARARARYAQAA. (B) Purification of ScrPTD4-myc-RBD. ScrPTD4-myc-RBD was produced as a GST-fused protein, and the GST moiety was removed. Coomasie blue staining (left) and immunoblot with the anti-myc antibody (right) are shown. (C) ScrPTD4- myc-rbd is not incorporated into the cells. Serum starved NIH 3T3 cells were either treated or not treated with the serum. The cells were stained with anti-myc antibody (MYC) and phalloidin (F-actin). No signal was detected for ScrPTD4-myc-RBD in the cells. Scr = ScrPTD4-myc-RBD. Scale bar = 10 µm.
 and either treated or not treated with the Nogo peptide (10 µm) for 10 min.")
9 Supplementary Figure 6 PTD4-myc-RalGDS does not detect Rho activation in CGN after Nogo addition. Cerebellar granule neurons were incubated with PTD4-myc-RalGDS (1 µm) and either treated or not treated with the Nogo peptide (10 µm) for 10 min. Immunostaining was carried out with the anti-myc antibody and the anti-p75 antibody. Representative single optical sections for p75 NTR (left), PTD4-myc-RalGDS (middle) and overlay images (right) are shown. Note the weak and diffuse myc signal in both, Nogo treated and untreated CGN, showing that PTD4-myc-RalGDS was unable to detect Rho activation in the cells. Ral = PTD4-myc-RalGDS. Scale bar = 10 µm.
, and either treated or not treated with the Nogo peptide (10 µm) for 10 min.")
10 Supplementary Figure 7 PTD4-myc-20aa does not detect Rho activation in CGN after the Nogo peptide addition. Cerebellar granule neurons were incubated with PTD4-myc-20aa (1 µm), and either treated or not treated with the Nogo peptide (10 µm) for 10 min. Immunostaining was carried out with the anti-myc antibody and the anti-p75 antibody. Representative single optical sections for p75 NTR (left), PTD4-myc-RalGDS (middle) and overlay images (right) are shown. Note the diffuse myc signal in both, Nogo treated and untreated CGN, showing that PTD4-myc-20aa was unable to detect Rho activation in the cells. 20aa, PTD4-myc 20aa. Scale bar = 10 µm.
 and either treated or not treated with the Nogo peptide (10 µm) for 10 min.")
11 Supplementary Figure 8 ScrPTD4-myc-RBD is not incorporated into the cerebellar granule neurons. Cerebellar granule neurons were incubated with ScrPTD4-myc-RBD (1 µm) and either treated or not treated with the Nogo peptide (10 µm) for 10 min. Immunostaining was carried out with the anti-myc antibody and the anti-p75 antibody. Absence of myc signal demonstrates that ScrPTD4-myc-RBD was not incorporated into the cells. Scr, ScrPTD4-myc-RBD. Scale bar = 10 µm.
12 Supplementary Figure 9
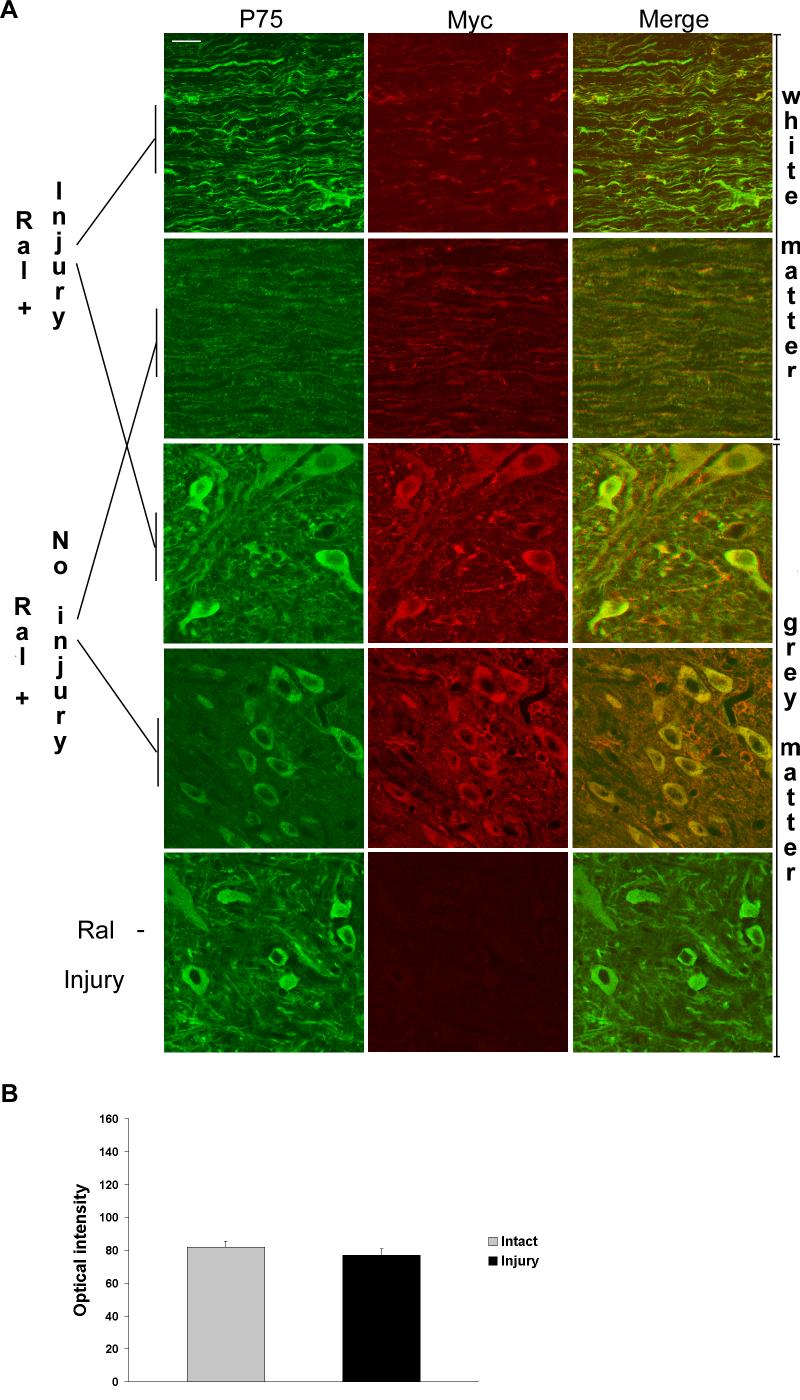
13 PTD4-myc-RalGDS does not detect the Rho activation after spinal chord injury. (A) Representative longitudinal sections of spinal cord of injured and sham-operated animals, which received PTD4-myc-RalGDS intravenously. Images of the white matter were taken from the rostral stump from the area of corticospinal tract 3 mm from the transection site and the corresponding site in sham-operated rats. Images of the grey matter were taken from the base of the dorsal horn 3 mm rostrally from the transection site. The sections of injured and sham-operated spinal cord were immunostained with the anti-myc antibody and the anti-p75 antibody. p75 NTR immunoreactivity is induced in the fibers in the white matter after the injury as well as in the neurons in the grey matter. There is no detectable difference in the myc staining in both white and grey matter. Ral+, PTD4-myc-RalGDS administered; RBD, PTD4-myc-RalGDS not administered. Scale bar = 20 µm. (B) Quantitative analysis of PTD4-myc-RalGDS signal intensity in the white matter in the injured and the sham-operated (intact) animals. There was no significant difference in the optical intensity of the myc signal between the injured and the sham-operated animals. The data is mean ± SEM. Range of optical intensity
14 Supplementary Figure 10
15 PTD4-myc-20aa does not detect the Rho activation after spinal chord injury. (A) Representative longitudinal sections of spinal chord of injured and sham-operated animals which received PTD4-myc-20aa intravenously. Images of the white matter were taken from the rostral stump from the area of corticospinal tract 3 mm from the transection site and the corresponding site in sham-operated rats. Images of the grey matter were taken from the base of the dorsal horn 3 mm rostrally from the transection site. The sections of injured and sham-operated spinal cord were immunostained with the anti-myc antibody and the anti-p75 antibody. p75 NTR immunoreactivity is induced in the fibers in the white matter after the injury as well as in the neurons in the grey matter. Their is no detectable difference in the myc staining in both white and grey matter. 20aa+ = PTD4-myc-20aa administered, 20aa- = PTD4-myc-20aa not administered. Scale bar = 20 µm. (B) Quantitative analysis of PTD4-myc-RalGDS signal intensity in the white matter in the injured and the sham-operated (intact) animals. There was no significant difference in the optical intensity of the myc signal between the injured and the sham-operated animals. The data is mean ± SEM. Range of optical intensity
16 Supplementary Figure 11
17 ScrPTD4-myc-RBD does not cross the blood brain barrier. Representative longitudinal sections of spinal chord of injured and sham-operated animals which received ScrPTD4- myc-rbd intravenously. Images of the white matter were taken from the rostral stump from the area of corticospinal tract 3 mm from the transection site and the corresponding site in sham-operated rats. Images of the grey matter were taken from the base of the dorsal horn 3 mm rostrally from the transection site. The sections of injured and shamoperated spinal cord were immunostained with the anti-myc antibody and the anti-p75 antibody. p75 NTR immunoreactivity is induced in the fibers in the white matter after the injury as well as in the neurons in the grey matter. There is no detectable signal in the myc staining in both white and grey matter. Scr+ = ScrPTD4-myc-RBD administered, Scr- = ScrPTD4-myc-RBD not administered. Scale bar = 20 µm.
SUPPLEMENTARY FIG. S2. Representative counting fields used in quantification of the in vitro neural differentiation of pattern of dnscs.
 Supplementary Data SUPPLEMENTARY FIG. S1. Representative counting fields used in quantification of the in vitro neural differentiation of pattern of anpcs. A panel of lineage-specific markers were used
Supplementary Materials
 Supplementary Materials Figure S1. MTT Cell viability assay. To measure the cytotoxic potential of the oxidative treatment, the MTT [3-(4,5-dimethylthiazol- 2-yl)-2,5-diphenyl tetrazolium bromide] assay
Supplemental Materials. STK16 regulates actin dynamics to control Golgi organization and cell cycle
 Supplemental Materials STK16 regulates actin dynamics to control Golgi organization and cell cycle Juanjuan Liu 1,2,3, Xingxing Yang 1,3, Binhua Li 1, Junjun Wang 1,2, Wenchao Wang 1, Jing Liu 1, Qingsong
Supplementary Figure 1: Characterisation of phospho-fgfr-y463 antibody. (A)
") Supplementary Figure 1: Characterisation of phospho-fgfr-y463 antibody. (A) Cells over-expressing hfgfr1-pcdna3 (+) or pcdna3 (-) were stimulated for 10 minutes with 50ng/ml FGF2 and lysates immunoblotted
Supplementary Figure 1: Characterisation of phospho-fgfr-y463 antibody. (A) Cells over-expressing hfgfr1-pcdna3 (+) or pcdna3 (-) were stimulated for 10 minutes with 50ng/ml FGF2 and lysates immunoblotted
SUPPLEMENTARY INFORMATION
 doi:10.1038/nature10353 Supplementary Figure 1. Mutations of UBQLN2 in patients with ALS and ALS/dementia. (a) A mutation, c.1489c>t (p.p497s), was identified in F#9975. The pedigree is shown on the left
Supplementary Figure 1. Characterization of NMuMG-ErbB2 and NIC breast cancer cells expressing shrnas targeting LPP. NMuMG-ErbB2 cells (a) and NIC
 and NIC") Supplementary Figure 1. Characterization of NMuMG-ErbB2 and NIC breast cancer cells expressing shrnas targeting LPP. NMuMG-ErbB2 cells (a) and NIC cells (b) were engineered to stably express either a LucA-shRNA
Supplementary Figure 1. Characterization of NMuMG-ErbB2 and NIC breast cancer cells expressing shrnas targeting LPP. NMuMG-ErbB2 cells (a) and NIC cells (b) were engineered to stably express either a LucA-shRNA
Supplementary Fig. 1 Blocking shh function at the protein level confirms its role as a guidance cue for postcommissural axons.
 Supplementary Fig. 1 Blocking shh function at the protein level confirms its role as a guidance cue for postcommissural axons. As an alternative method to demonstrate the role of shh as a guidance cue
Supplementary Figure 1: GFAP positive nerves in patients with adenocarcinoma of
 SUPPLEMENTARY FIGURES AND MOVIE LEGENDS Supplementary Figure 1: GFAP positive nerves in patients with adenocarcinoma of the pancreas. (A) Images of nerves stained for GFAP (green), S100 (red) and DAPI
Nature Neuroscience: doi: /nn.2275
 Supplementary Figure S1. The presence of MeCP2 in enriched primary glial cultures from rat or mouse brains is not neuronal. Western blot analysis of protein extracts from (a) rat glial and neuronal cultures.
J. Cell Sci. 129: doi: /jcs : Supplementary information
 Movie 1. AgLDL is contained in small sub-regions of the lysosomal synapse that are acidic. J774 cells were incubated with agldl dual labeled with a ph sensitive and a ph insensitive fluorophore for 1 hr.
a b G75 G60 Sw-2 Sw-1 Supplementary Figure 1. Structure predictions by I-TASSER Server.
 a b G75 2 2 G60 Sw-2 Sw-1 Supplementary Figure 1. Structure predictions by I-TASSER Server. a. Overlay of top 10 models generated by I-TASSER illustrates the potential effect of 7 amino acid insertion
Rescue of mutant rhodopsin traffic by metformin-induced AMPK activation accelerates photoreceptor degeneration Athanasiou et al
 Supplementary Material Rescue of mutant rhodopsin traffic by metformin-induced AMPK activation accelerates photoreceptor degeneration Athanasiou et al Supplementary Figure 1. AICAR improves P23H rod opsin
Low Cell Binding Property of LIPIDURE -COAT
 Technical Note_1 ver.1 Low Cell Binding Property of LIPIDURE -COAT 1. LIPIDURE -COAT MULTI DISH A-6MD (Cat. No. 51011617) 2. Cell; NIH 3T3 (Fibroblast, mouse) 1. 10 %CS-DMEM; DMEM (Dulbecco's Modified
SUPPLEMENTARY INFORMATION
 Supplementary Figures Supplementary Figure S1. Binding of full-length OGT and deletion mutants to PIP strips (Echelon Biosciences). Supplementary Figure S2. Binding of the OGT (919-1036) fragments with
Supplementary Figure S1
 Supplementary Figure S1 Supplementary Figure S1. PARP localization patterns using GFP-PARP and PARP-specific antibody libraries GFP-PARP localization in non-fixed (A) and formaldehyde fixed (B) GFP-PARPx
SUPPLEMENTARY INFORMATION
 Figure S1. Loss of Ena/VASP proteins inhibits filopodia and neuritogenesis. (a) Bar graph of filopodia number per stage 1 control and mmvvee (Mena/ VASP/EVL-null) neurons at 40hrs in culture. Loss of all
Supplementary Table 1. List of primers used in this study
 Supplementary Table 1. List of primers used in this study Gene Forward primer Reverse primer Rat Met 5 -aggtcgcttcatgcaggt-3 5 -tccggagacacaggatgg-3 Rat Runx1 5 -cctccttgaaccactccact-3 5 -ctggatctgcctggcatc-3
Genesis of cerebellar interneurons and the prevention of neural DNA damage require XRCC1.
 Genesis of cerebellar interneurons and the prevention of neural DNA damage require XRCC1. Youngsoo Lee, Sachin Katyal, Yang Li, Sherif F. El-Khamisy, Helen R. Russell, Keith W. Caldecott and Peter J. McKinnon.
Supplementary Figure 1. Normal T lymphocyte populations in Dapk -/- mice. (a) Normal thymic development in Dapk -/- mice. Thymocytes from WT and Dapk
 Normal thymic development in Dapk -/- mice. Thymocytes from WT and Dapk") Supplementary Figure 1. Normal T lymphocyte populations in Dapk -/- mice. (a) Normal thymic development in Dapk -/- mice. Thymocytes from WT and Dapk -/- mice were stained for expression of CD4 and CD8.
Supplementary Figure 1. Normal T lymphocyte populations in Dapk -/- mice. (a) Normal thymic development in Dapk -/- mice. Thymocytes from WT and Dapk -/- mice were stained for expression of CD4 and CD8.
Supplementary Figure 1
 Supplementary Figure 1 Kif1a RNAi effect on basal progenitor differentiation Related to Figure 2. Representative confocal images of the VZ and SVZ of rat cortices transfected at E16 with scrambled or Kif1a
SUPPLEMENTARY INFORMATION
 doi:10.1038/nature11095 Supplementary Table 1. Summary of the binding between Angptls and various Igdomain containing receptors as determined by flow cytometry analysis. The results were summarized from
effect on the upregulation of these cell surface markers. The mean peak fluorescence intensity
 SUPPLEMENTARY FIGURE 1 Supplementary Figure 1 ASIC1 disruption or blockade does not effect in vitro and in vivo antigen-presenting cell activation. (a) Flow cytometric analysis of cell surface molecules
A Cxcl12-Cxcr4 Chemokine Signaling Pathway Defines
 Supplemental Data A Cxcl12-Cxcr4 Chemokine Signaling Pathway Defines the Initial Trajectory of Mammalian Motor Axons Ivo Lieberam, Dritan Agalliu, Takashi Nagasawa, Johan Ericson, and Thomas M. Jessell
SUPPLEMENTARY FIGURE LEGENDS
 SUPPLEMENTARY FIGURE LEGENDS Supplemental FIG. 1. Localization of myosin Vb in cultured neurons varies with maturation stage. A and B, localization of myosin Vb in cultured hippocampal neurons. A, in DIV
SUPPLEMENTARY INFORMATION
 Supplementary Figure 1. Behavioural effects of ketamine in non-stressed and stressed mice. Naive C57BL/6 adult male mice (n=10/group) were given a single dose of saline vehicle or ketamine (3.0 mg/kg,
Supplementary Fig. 1
 PDK1-dependent quenching of TACE shedding activity in prion and Alzheimer s diseases Mathéa Pietri, Caroline Dakowski, Samia Hannaoui, Aurélie Alleaume-Butaux, Julia Hernandez-Rapp, Audrey Ragagnin, Sophie
Interleukin-6 promotes pancreatic cancer cell migration by rapidly activating the small GTPase CDC42
 Interleukin-6 promotes pancreatic cancer cell migration by rapidly activating the small GTPase CDC42 Gina L. Razidlo, Kevin M. Burton, and Mark A. McNiven SUPPORTING INFORMATION Figure S1. IL-6 promotes
Supplementary Materials for
 www.sciencesignaling.org/cgi/content/full/7/334/rs4/dc1 Supplementary Materials for Rapidly rendering cells phagocytic through a cell surface display technique and concurrent Rac activation Hiroki Onuma,
T H E J O U R N A L O F C E L L B I O L O G Y
 Supplemental material Díaz et al., http://www.jcb.org/cgi/content/full/jcb.201209151/dc1 T H E J O U R N A L O F C E L L B I O L O G Y Figure S1. Hypoxia induces invadopodia formation in different epithelial
Pearson r = P (one-tailed) = n = 9
 = n = 9") 8F4-Specific Lysis, % 1 UPN1 UPN3 8 UPN7 6 Pearson r =.69 UPN2 UPN5 P (one-tailed) =.192 4 UPN8 n = 9 2 UPN9 UPN4 UPN6 5 1 15 2 25 8 8F4, % Max MFI Supplementary Figure S1. AML samples UPN1-UPN9 show variable
8F4-Specific Lysis, % 1 UPN1 UPN3 8 UPN7 6 Pearson r =.69 UPN2 UPN5 P (one-tailed) =.192 4 UPN8 n = 9 2 UPN9 UPN4 UPN6 5 1 15 2 25 8 8F4, % Max MFI Supplementary Figure S1. AML samples UPN1-UPN9 show variable
Supplements. Figure S1. B Phalloidin Alexa488
 Supplements A, DMSO, PP2, PP3 Crk-myc Figure S1. (A) Src kinase activity is necessary for recruitment of Crk to Nephrin cytoplasmic domain. Human podocytes expressing /7-NephrinCD () were treated with
Dep. Control Time (min)
") aa Control Dep. RP 1s 1 mv 2s 1 mv b % potentiation of IPSP 2 15 1 5 Dep. * 1 2 3 4 Time (min) Supplementary Figure 1. Rebound potentiation of IPSPs in PCs. a, IPSPs recorded with a K + gluconate pipette
aa Control Dep. RP 1s 1 mv 2s 1 mv b % potentiation of IPSP 2 15 1 5 Dep. * 1 2 3 4 Time (min) Supplementary Figure 1. Rebound potentiation of IPSPs in PCs. a, IPSPs recorded with a K + gluconate pipette
Supplemental Table I
 Supplemental Table I Cortex Hippocampus Age (weeks) Genotype STE 61 pste 61 STE 61 pste 61 8 100.0 ± 4.4 96.2 ± 6.0 99.8 ± 8.7 167.5 ± 7.8* 100.0 ± 7.0 90.5 ± 13.8 100.0 ± 12.8 260.4 ± 33.9** 12 100.0
Supplementary Materials
 Supplementary Materials Fig. S1. Weights of full-dose treatment groups comparing 1 st, 2 nd, and 3 rd generation gene replacement therapy. Mice were treated at p1 with 4x10 11 GC of the three different
Progress Report for NJCSCR (Yu-Wen Chang)
") Progress Report for NJCSCR (Yu-Wen Chang) Overall Plan Summary: Traumatic injury to the spinal cord initiates a cascade of degenerative processes, known as secondary injury, which include various inflammatory
Progress Report for NJCSCR (Yu-Wen Chang) Overall Plan Summary: Traumatic injury to the spinal cord initiates a cascade of degenerative processes, known as secondary injury, which include various inflammatory
Symptoms of spinal cord injury:
 Symptoms of spinal cord injury: involuntary muscle spasms loss of voluntary movement sensation, balance control of breathing autonomic functions (blood pressure) bladder, sexual, bowel control All due
Control GST GST-RAP. α2-mg. 170 kda. b-actin. 42 kda LRP-1
 % of max Supplementary Figure 1 Control GST GST-RP 17 kda α2-mg 42 kda b-actin Gate: CD11c+ (DCs) Gate: F4/8+ (Mfs) IgG Cd11cCre + Lrp1 fl/fl LRP-1 Supplementary figure 1. () MDCs were pretreated with
Supplementary Materials for
 advances.sciencemag.org/cgi/content/full/3/6/e1700338/dc1 Supplementary Materials for HIV virions sense plasma membrane heterogeneity for cell entry Sung-Tae Yang, Alex J. B. Kreutzberger, Volker Kiessling,
The clathrin adaptor Numb regulates intestinal cholesterol. absorption through dynamic interaction with NPC1L1
 The clathrin adaptor Numb regulates intestinal cholesterol absorption through dynamic interaction with NPC1L1 Pei-Shan Li 1, Zhen-Yan Fu 1,2, Ying-Yu Zhang 1, Jin-Hui Zhang 1, Chen-Qi Xu 1, Yi-Tong Ma
Supplementary Information
 Supplementary Information Title Degeneration and impaired regeneration of gray matter oligodendrocytes in amyotrophic lateral sclerosis Authors Shin H. Kang, Ying Li, Masahiro Fukaya, Ileana Lorenzini,
doi: /nature09554
 SUPPLEMENTARY INFORMATION doi:10.1038/nature09554 Supplementary Figure 1: Optical Tracing with New Photoactivatable GFP Variants Reveals Enhanced Labeling of Neuronal Processes We qualitatively compare
Tumor suppressor Spred2 interaction with LC3 promotes autophagosome maturation and induces autophagy-dependent cell death
 www.impactjournals.com/oncotarget/ Oncotarget, Supplementary Materials 2016 Tumor suppressor Spred2 interaction with LC3 promotes autophagosome maturation and induces autophagy-dependent cell death Supplementary
Title: Vectorization of biomacromolecules into cells using extracellular vesicles with enhanced internalization induced by macropinocytosis
 Scientific Reports Supplementary information Title: Vectorization of biomacromolecules into cells using extracellular vesicles with enhanced internalization induced by macropinocytosis Authors: Ikuhiko
Nature Neuroscience: doi: /nn Supplementary Figure 1. Splenic atrophy and leucopenia caused by T3 SCI.
 Supplementary Figure 1 Splenic atrophy and leucopenia caused by T3 SCI. (a) Gross anatomy of representative spleens from control and T3 SCI mice at 28 days post-injury. (b and c) Hematoxylin and eosin
TRAF6 ubiquitinates TGFβ type I receptor to promote its cleavage and nuclear translocation in cancer
 Supplementary Information TRAF6 ubiquitinates TGFβ type I receptor to promote its cleavage and nuclear translocation in cancer Yabing Mu, Reshma Sundar, Noopur Thakur, Maria Ekman, Shyam Kumar Gudey, Mariya
Is Spinal Cord Repair a Reality? Schwann Cell Transplantation for Subacute Spinal Cord Injury
 Is Spinal Cord Repair a Reality? Schwann Cell Transplantation for Subacute Spinal Cord Injury James Guest MD, PhD, FACS Clinical Professor of Neurological Surgery, Neurosurgery and the Miami Project to
Figure S1. Sorting nexin 9 (SNX9) specifically binds psmad3 and not psmad 1/5/8. Lysates from AKR-2B cells untreated (-) or stimulated (+) for 45 min
 specifically binds psmad3 and not psmad 1/5/8. Lysates from AKR-2B cells untreated (-) or stimulated (+) for 45 min") Figure S1. Sorting nexin 9 (SNX9) specifically binds psmad3 and not psmad 1/5/8. Lysates from AKR2B cells untreated () or stimulated () for 45 min with 5 ng/ml TGFβ or 10 ng/ml BMP4 were incubated with
Figure S1. Sorting nexin 9 (SNX9) specifically binds psmad3 and not psmad 1/5/8. Lysates from AKR2B cells untreated () or stimulated () for 45 min with 5 ng/ml TGFβ or 10 ng/ml BMP4 were incubated with
Supplementary Figure 1. Supernatants electrophoresis from CD14+ and dendritic cells. Supernatants were resolved by SDS-PAGE and stained with
 Supplementary Figure 1. Supernatants electrophoresis from CD14+ and dendritic cells. Supernatants were resolved by SDS-PAGE and stained with Coomassie brilliant blue. One µg/ml recombinant human (rh) apo-e
Supplementary Materials for
 www.sciencesignaling.org/cgi/content/full/6/283/ra57/dc1 Supplementary Materials for JNK3 Couples the Neuronal Stress Response to Inhibition of Secretory Trafficking Guang Yang,* Xun Zhou, Jingyan Zhu,
Silencing neurotransmission with membrane-tethered toxins
 nature methods Silencing neurotransmission with membrane-tethered toxins Sebastian Auer, Annika S Stürzebecher, René Jüttner, Julio Santos-Torres, Christina Hanack, Silke Frahm, Beate Liehl & Inés Ibañez-Tallon
Supplementary Material
 Supplementary Material accompanying the manuscript Interleukin 37 is a fundamental inhibitor of innate immunity Marcel F Nold, Claudia A Nold-Petry, Jarod A Zepp, Brent E Palmer, Philip Bufler & Charles
Supplementary Figure 1
 Supplementary Figure 1 Localization of virus injections. (a) Schematic showing the approximate center of AAV-DIO-ChR2-YFP injection sites in the NAc of Dyn-cre mice (n=8 mice, 16 injections; caudate/putamen,
Supplementary Figure 1. Properties of various IZUMO1 monoclonal antibodies and behavior of SPACA6. (a) (b) (c) (d) (e) (f) (g) .
 (b) (c) (d) (e) (f) (g) .") Supplementary Figure 1. Properties of various IZUMO1 monoclonal antibodies and behavior of SPACA6. (a) The inhibitory effects of new antibodies (Mab17 and Mab18). They were investigated in in vitro fertilization
Supplementary Figure 1. Properties of various IZUMO1 monoclonal antibodies and behavior of SPACA6. (a) The inhibitory effects of new antibodies (Mab17 and Mab18). They were investigated in in vitro fertilization
Supplementary Figure 1
 Supplementary Figure 1 Global TeNT expression effectively impairs synaptic transmission. Injection of 100 pg tent mrna leads to a reduction of vesicle mediated synaptic transmission in the spinal cord
Nature Neuroscience: doi: /nn Supplementary Figure 1. PICALM expression in brain capillary endothelium in human brain and in mouse brain.
 Supplementary Figure 1 PICALM expression in brain capillary endothelium in human brain and in mouse brain. a, Double immunostaining for PICALM (red, left) and lectin positive endothelial profiles (blue,
Supplementary Figure 1
 Supplementary Figure 1 AAV-GFP injection in the MEC of the mouse brain C57Bl/6 mice at 4 months of age were injected with AAV-GFP into the MEC and sacrificed at 7 days post injection (dpi). (a) Brains
SUPPLEMENTAL EXPERIMENTAL PROCEDURES
 SUPPLEMENTAL EXPERIMENTAL PROCEDURES Crystal violet assay Cells were seeded in 24-well plates and cultured in media supplemented with % FBS for 7 days. Media were then removed, plates were briefly washed
Suppl Video: Tumor cells (green) and monocytes (white) are seeded on a confluent endothelial
 and monocytes (white) are seeded on a confluent endothelial") Supplementary Information Häuselmann et al. Monocyte induction of E-selectin-mediated endothelial activation releases VE-cadherin junctions to promote tumor cell extravasation in the metastasis cascade
Supplementary Information Häuselmann et al. Monocyte induction of E-selectin-mediated endothelial activation releases VE-cadherin junctions to promote tumor cell extravasation in the metastasis cascade
TGF-β Signaling Regulates Neuronal C1q Expression and Developmental Synaptic Refinement
 Supplementary Information Title: TGF-β Signaling Regulates Neuronal C1q Expression and Developmental Synaptic Refinement Authors: Allison R. Bialas and Beth Stevens Supplemental Figure 1. In vitro characterization
Supplementary Figure 1 Expression of Crb3 in mouse sciatic nerve: biochemical analysis (a) Schematic of Crb3 isoforms, ERLI and CLPI, indicating the
 Schematic of Crb3 isoforms, ERLI and CLPI, indicating the") Supplementary Figure 1 Expression of Crb3 in mouse sciatic nerve: biochemical analysis (a) Schematic of Crb3 isoforms, ERLI and CLPI, indicating the location of the transmembrane (TM), FRM binding (FB)
Supplementary Figure 1 Expression of Crb3 in mouse sciatic nerve: biochemical analysis (a) Schematic of Crb3 isoforms, ERLI and CLPI, indicating the location of the transmembrane (TM), FRM binding (FB)
Nature Structural and Molecular Biology: doi: /nsmb Supplementary Figure 1
 Supplementary Figure 1 Mutational analysis of the SA2-Scc1 interaction in vitro and in human cells. (a) Autoradiograph (top) and Coomassie stained gel (bottom) of 35 S-labeled Myc-SA2 proteins (input)
T H E J O U R N A L O F C E L L B I O L O G Y
 T H E J O U R N A L O F C E L L B I O L O G Y Supplemental material Amelio et al., http://www.jcb.org/cgi/content/full/jcb.201203134/dc1 Figure S1. mir-24 regulates proliferation and by itself induces
Supplementary Figures
 Supplementary Figures Supplementary Figure 1 Characterization of stable expression of GlucB and sshbira in the CT26 cell line (a) Live cell imaging of stable CT26 cells expressing green fluorescent protein
Primary Cilia Can Both Mediate and Suppress Hedgehog Pathway- Dependent Tumorigenesis (Supplementary Figures and Materials)
") Primary Cilia Can Both Mediate and Suppress Hedgehog Pathway- Dependent Tumorigenesis (Supplementary Figures and Materials) Sunny Y. Wong, Allen D. Seol, Po-Lin So, Alexandre N. Ermilov, Christopher K.
Primary Cilia Can Both Mediate and Suppress Hedgehog Pathway- Dependent Tumorigenesis (Supplementary Figures and Materials) Sunny Y. Wong, Allen D. Seol, Po-Lin So, Alexandre N. Ermilov, Christopher K.
Supplementary Materials for
 www.sciencesignaling.org/cgi/content/full/7/308/ra4/dc1 Supplementary Materials for Antipsychotics Activate mtorc1-dependent Translation to Enhance Neuronal Morphological Complexity Heather Bowling, Guoan
SUPPLEMENTARY INFORMATION
 DOI: 10.1038/ncb2566 Figure S1 CDKL5 protein expression pattern and localization in mouse brain. (a) Multiple-tissue western blot from a postnatal day (P) 21 mouse probed with an antibody against CDKL5.
Supplemental information
 Supplemental information PI(3)K p11δ controls the sucellular compartmentalization of TLR4 signaling and protects from endotoxic shock Ezra Aksoy, Salma Taoui, David Torres, Sandrine Delauve, Aderrahman
Supplementary Figure 1
 S U P P L E M E N TA R Y I N F O R M AT I O N DOI: 10.1038/ncb2896 Supplementary Figure 1 Supplementary Figure 1. Sequence alignment of TERB1 homologs in vertebrates. M. musculus TERB1 was derived from
S1a S1b S1c. S1d. S1f S1g S1h SUPPLEMENTARY FIGURE 1. - si sc Il17rd Il17ra bp. rig/s IL-17RD (ng) -100 IL-17RD
 -100 IL-17RD") SUPPLEMENTARY FIGURE 1 0 20 50 80 100 IL-17RD (ng) S1a S1b S1c IL-17RD β-actin kda S1d - si sc Il17rd Il17ra rig/s15-574 - 458-361 bp S1f S1g S1h S1i S1j Supplementary Figure 1. Knockdown of IL-17RD enhances
SUPPLEMENTARY FIGURE 1 0 20 50 80 100 IL-17RD (ng) S1a S1b S1c IL-17RD β-actin kda S1d - si sc Il17rd Il17ra rig/s15-574 - 458-361 bp S1f S1g S1h S1i S1j Supplementary Figure 1. Knockdown of IL-17RD enhances
Supplementary Figure 1.TRIM33 binds β-catenin in the nucleus. a & b, Co-IP of endogenous TRIM33 with β-catenin in HT-29 cells (a) and HEK 293T cells
 and HEK 293T cells") Supplementary Figure 1.TRIM33 binds β-catenin in the nucleus. a & b, Co-IP of endogenous TRIM33 with β-catenin in HT-29 cells (a) and HEK 293T cells (b). TRIM33 was immunoprecipitated, and the amount of
Supplementary Figure 1.TRIM33 binds β-catenin in the nucleus. a & b, Co-IP of endogenous TRIM33 with β-catenin in HT-29 cells (a) and HEK 293T cells (b). TRIM33 was immunoprecipitated, and the amount of
Supplementary Figure 1. Validation of astrocytes. Primary astrocytes were
 Supplementary Figure 1. Validation of astrocytes. Primary astrocytes were separated from the glial cultures using a mild trypsinization protocol. Anti-glial fibrillary acidic protein (GFAP) immunofluorescent
supplementary information
 DOI: 10.1038/ncb2133 Figure S1 Actomyosin organisation in human squamous cell carcinoma. (a) Three examples of actomyosin organisation around the edges of squamous cell carcinoma biopsies are shown. Myosin
Supplementary Figure 1: Co-localization of reconstituted L-PTC and dendritic cells
 a CD11c Na + K + ATPase Na + K + ATPase CD11c x-y CD11c Na + K + ATPase Na + K + ATPase CD11c x-z c b x-y view BoNT NAPs CD11c BoNT CD11c NAPs BoNT NAPs CD11c 90 x-z view Apical Basolateral Supplementary
Myelin suppresses axon regeneration by PIR-B/SHPmediated inhibition of Trk activity
 Manuscript EMBO-2010-76298 Myelin suppresses axon regeneration by PIR-B/SHPmediated inhibition of Trk activity Yuki Fujita, Shota Endo, Toshiyuki Takai and Toshihide Yamashita Corresponding author: Toshihide
Supplementary Materials for
 www.sciencesignaling.org/cgi/content/full/8/375/ra41/dc1 Supplementary Materials for Actin cytoskeletal remodeling with protrusion formation is essential for heart regeneration in Hippo-deficient mice
Supplementary Figure 1. Repression of hepcidin expression in the liver of mice treated with
 Supplementary Figure 1. Repression of hepcidin expression in the liver of mice treated with DMN Immunohistochemistry for hepcidin and H&E staining (left). qrt-pcr assays for hepcidin in the liver (right).
Supplementary Fig. 1. GPRC5A post-transcriptionally down-regulates EGFR expression. (a) Plot of the changes in steady state mrna levels versus
 Plot of the changes in steady state mrna levels versus") Supplementary Fig. 1. GPRC5A post-transcriptionally down-regulates EGFR expression. (a) Plot of the changes in steady state mrna levels versus changes in corresponding proteins between wild type and Gprc5a-/-
Supplementary Fig. 1. GPRC5A post-transcriptionally down-regulates EGFR expression. (a) Plot of the changes in steady state mrna levels versus changes in corresponding proteins between wild type and Gprc5a-/-
Development of Spinal Cord & Vertebral Column. Dr. Sanaa Alshaarawi & Prof. Ahmed Fathalla
 Development of Spinal Cord & Vertebral Column Dr. Sanaa Alshaarawi & Prof. Ahmed Fathalla OBJECTIVES At the end of the lecture, students should be able to: q Describe the development of the spinal cord
Supplemental Information. Ciliary Beating Compartmentalizes. Cerebrospinal Fluid Flow in the Brain. and Regulates Ventricular Development
 Current Biology, Volume Supplemental Information Ciliary Beating Compartmentalizes Cerebrospinal Fluid Flow in the Brain and Regulates Ventricular Development Emilie W. Olstad, Christa Ringers, Jan N.
Mst1 regulates integrin-dependent thymocyte trafficking and antigen recognition in the thymus
 Mst1 regulates integrin-dependent thymocyte trafficking and antigen recognition in the thymus Yoshihiro Ueda, Koko Katagiri, Takashi Tomiyama, Kaneki Yasuda, Katsuyoshi Habiro, Tomoya Katakai, Susumu Ikehara,
Hypothalamus. To learn how the brain regulates neuroendocrine secretions NTA Ch 14, pgs Key Figs: 14-3; 14-4,
 Hypothalamus Objectives To learn the general organization of the hypothalamus and the functions of the major nuclei NTA Ch 14, pgs. 419-422 Key Figs: 14-2, 14-3 To learn how the brain regulates neuroendocrine
Nature Neuroscience: doi: /nn Supplementary Figure 1. Confirmation that optogenetic inhibition of dopaminergic neurons affects choice
 Supplementary Figure 1 Confirmation that optogenetic inhibition of dopaminergic neurons affects choice (a) Sample behavioral trace as in Figure 1d, but with NpHR stimulation trials depicted as green blocks
Supplementary Materials for. c-abl Activation Plays a Role in α-synucleinopathy Induced Neurodegeneration
 Supplementary Materials for c-abl Activation Plays a Role in α-synucleinopathy Induced Neurodegeneration Saurav Brahmachari, Preston Ge, Su Hyun Lee, Donghoon Kim, Senthilkumar S. Karuppagounder, Manoj
What Cell Make Up the Brain and Spinal Cord
 What Cell Make Up the Brain and Spinal Cord Jennifer LaVail, Ph.D. (http://anatomy.ucsf.edu/pages/lavaillab/index.html) What kinds of cells are these?" Neuron?" Epithelial cell?" Glial cell?" What makes
Cerebellum. Steven McLoon Department of Neuroscience University of Minnesota
 Cerebellum Steven McLoon Department of Neuroscience University of Minnesota 1 Anatomy of the Cerebellum The cerebellum has approximately half of all the neurons in the central nervous system. The cerebellum
Rewiring of hindlimb corticospinal neurons after spinal cord injury
 Rewiring of hindlimb corticospinal neurons after spinal cord injury Arko Ghosh, Florent Haiss, Esther Sydekum, Regula Schneider, Miriam Gullo, Matthias T. Wyss, Thomas Mueggler, Christof Baltes, Markus
mm Distance (mm)
") b a Magnet Illumination Coverslips MPs Objective 2575 µm 1875 µm 1575 µm 1075 µm 875 µm 545 µm 20µm 2 3 0.5 0.3mm 1 1000 100 10 1 0.1 1000 100 10 1 0.1 Field Induction (Gauss) 1.5 0 5 10 15 20 Distance
b a Magnet Illumination Coverslips MPs Objective 2575 µm 1875 µm 1575 µm 1075 µm 875 µm 545 µm 20µm 2 3 0.5 0.3mm 1 1000 100 10 1 0.1 1000 100 10 1 0.1 Field Induction (Gauss) 1.5 0 5 10 15 20 Distance
Relative Rates. SUM159 CB- 839-Resistant *** n.s Intracellular % Labeled by U- 13 C-Asn 0.
 A Relative Growth Rates 1.2 1.8.6.4.2 B Relative Rates 1.6 1.4 1.2 1.8.6.4.2 LPS2 Parental LPS2 Q-Independent SUM159 Parental SUM159 CB-839-Resistant LPS2 Parental LPS2 Q- Independent SUM159 Parental SUM159
p = formed with HCI-001 p = Relative # of blood vessels that formed with HCI-002 Control Bevacizumab + 17AAG Bevacizumab 17AAG
 A.. Relative # of ECs associated with HCI-001 1.4 1.2 1.0 0.8 0.6 0.4 0.2 0.0 ol b p < 0.001 Relative # of blood vessels that formed with HCI-001 1.4 1.2 1.0 0.8 0.6 0.4 0.2 0.0 l b p = 0.002 Control IHC:
Nature Biotechnology: doi: /nbt Supplementary Figure 1. Diagram of BBB and brain chips.
 Supplementary Figure 1 Diagram of BBB and brain chips. (a) Schematic of the BBB Chip demonstrates the 3 parts of the chip, Top PDMS channel, membrane and Bottom PDMS channel; (b) Image of 2 BBB Chips,
Final Scientific Progress Report
 CUREPSP Final Scientific Progress Report Tau in Peripheral Tissues of PSP and CBD. Brittany Dugger, PhD; University of California San Francisco Specific Aim: Using immunohistochemical methods on autopsy
Relative SOD1 activity. Relative SOD2 activity. Relative SOD activity (Infected:Mock) + CP + DDC
 + CP + DDC") Supplementary Figure 1. SOD1 activity is significantly increased relative to SOD1 levels. SOD1 and SOD2 activities in the infected mork13 cells are shown normalised to their corresponding levels and relative
Supplementary Figure 1. SOD1 activity is significantly increased relative to SOD1 levels. SOD1 and SOD2 activities in the infected mork13 cells are shown normalised to their corresponding levels and relative
INDEPENDENT LEARNING: DISC HERNIATION IN THE NATIONAL FOOTBALL LEAGUE: ANATOMICAL FACTORS TO CONSIDER IN REVIEW
 INDEPENDENT LEARNING: DISC HERNIATION IN THE NATIONAL FOOTBALL LEAGUE: ANATOMICAL FACTORS TO CONSIDER IN REVIEW CDC REPORT - CAUSES OF DISABILITY, 2005 REVIEW QUESTIONS ABOUT DISC HERNIATION IN THE NATIONAL
Nature Neuroscience: doi: /nn Supplementary Figure 1. Neuron class-specific arrangements of Khc::nod::lacZ label in dendrites.
 Supplementary Figure 1 Neuron class-specific arrangements of Khc::nod::lacZ label in dendrites. Staining with fluorescence antibodies to detect GFP (Green), β-galactosidase (magenta/white). (a, b) Class
Supplementary Figure 1. Confocal immunofluorescence showing mitochondrial translocation of Drp1. Cardiomyocytes treated with H 2 O 2 were prestained
 Supplementary Figure 1. Confocal immunofluorescence showing mitochondrial translocation of Drp1. Cardiomyocytes treated with H 2 O 2 were prestained with MitoTracker (red), then were immunostained with
SUPPLEMENTARY INFORMATION
 doi:10.1038/nature12652 Supplementary Figure 1. PRDM16 interacts with endogenous EHMT1 in brown adipocytes. Immunoprecipitation of PRDM16 complex by flag antibody (M2) followed by Western blot analysis
Cell membrane penetration and mitochondrial targeting by platinumdecorated
 Electronic Supplementary Material (ESI) for Nanoscale. This journal is The Royal Society of Chemistry 2016 Cell membrane penetration and mitochondrial targeting by platinumdecorated ceria nanoparticles
GFP-LC3 +/+ CLU -/- kda CLU GFP. Actin. GFP-LC3 +/+ CLU -/- kda CLU GFP. Actin
 Supplementary Fig. 1 a CQ treatment ScrB OGX11 MG132 I II AZD5363 I II b GFP / / GFP / / GFP / / GFP / / GFP GFP Actin Actin ctrl CQ GFP / / GFP / / GFP / / GFP / / GFP GFP Actin Actin rapamycin rapamycincq
Introduction to the Central Nervous System: Internal Structure
 Introduction to the Central Nervous System: Internal Structure Objective To understand, in general terms, the internal organization of the brain and spinal cord. To understand the 3-dimensional organization
Helen R Barbour 2, Christine D Plant 1, Alan R Harvey 3 and Giles W Plant 1,2*
 Barbour et al. BMC Neuroscience 2013, 14:106 RESEARCH ARTICLE Open Access Tissue sparing, behavioral recovery, supraspinal axonal sparing/regeneration following sub-acute glial transplantation in a model