FUNCTIONAL MAGNETIC RESONANCE IMAGING IN FOLLOW-UP OF CEREBRAL GLIAL TUMORS
|
|
|
- Linette Cecily McKinney
- 5 years ago
- Views:
Transcription

1 Anvita Bieza FUNCTIONAL MAGNETIC RESONANCE IMAGING IN FOLLOW-UP OF CEREBRAL GLIAL TUMORS Summary of Doctoral Thesis to obtain PhD degree in medicine Specialty Diagnostic Radiology Riga, 2013

2 Doctoral thesis was developed in Riga Eastern Clinical University Hospital Gaiļezers and Department of Radiology, Rīga Stradiņš University Scientific supervisor: Dr. habil. med., Professor Gaida Krumina, Rīga Stradiņš University Official reviewers: Dr. med., Professor A. Millers, Rīga Stradiņš University Dr. habil. med., Professor I. Aksiks, University of Latvia Dr. med. O. Utehina, Riga Eastern Clinical University Hospital Gaiļezers Doctoral Thesis will be defended on the 28 th of June, 2013 at at Rīga Stradiņš University open meeting of Promotion Council of Theoretical Medicine in Riga, Dzirciema Street 16, Hippocrate auditorium. Promotion thesis is available at Rīga Stradiņš University library and home page: The Doctoral Thesis was supported by the European Social Fund program Support for acquisition of doctoral study program and obtaining of a scientific degree in Rīga Stradiņš University Secretary of the Promotional Council: Dr. habil. med., Professor Liga Aberberga-Augskalne
3 TABLE OF CONTENTS LIST OF ABBREVIATIONS... 4 INTRODUCTION MATERIALS AND METHODS Patient selection Morphological and immunohistochemical examinations Magnetic resonance imaging protocol Magnetic resonance imaging data processing Fractional anisotropy measurements Tractography Magnetic resonance spectroscopy Statistical analysis RESULTS Glial tumors Fractional anisotropy analysis Metabolite ratio analysis Tractography findings Treatment induced brain injury Fractional anisotropy analysis Metabolite ratio analysis Tractography findings Comparison of metabolites and FA between patients with glial tumors and treatment induced brain injury Analysis of diagnostic test accuracy Repeatability of MRS and DTI measurements Influence of ROI size on FA measurements CONCLUSIONS PRACTICAL RECOMMENDATIONS PUBLICATIONS AND PRESENTATIONS ON RESEARCH THEME ACKNOWLEDGMENTS LIST OF REFERENCES
4 LIST OF ABBREVIATIONS Cho Cr DTI FA FOV LL MI MRI MRS NAA ROI choline creatine diffusion tensor imaging fractional anisotropy field of view lipids and lactate myo-inositol magnetic resonance imaging magnetic resonance spectroscopy N-acetylaspartate region of interest 4
5 INTRODUCTION Glioma is the most common malignant primary tumor that arises in the brain (1,2). It accounts for approximately 70% of the malignant primary brain tumors in adults, the incidence is 6 cases per per year (3). Despite the development of advanced surgical technique, new methods of focused radiotherapy and novel chemotherapy schemes, the majority of glial brain tumors recur due to the invasive growth pattern (2). Even after total resection of tumor recurrence is observed near the primary tumor localization (1). Malignant infiltrative brain gliomas have tendency to infiltrate surrounding white matter for several centimeters from the core of tumor (4). Despite numerous studies, preoperative assessment of glioma invasion and resection border remains one of the major problems in neuro-oncology (5). Another important, unresolved issue is the clinical and radiological distinction of glial tumor recurrence and radiation/chemotherapy induced injury (6), as structural MRI is often nonspecific in post-treatment period both recurrent tumor and inflammatory or necrotic changes due to radiation/chemotherapy typically accumulate contrast agents. Noninvasive evaluation of cerebral white matter, visualization of white matter fibers, information about the tract destruction, especially in the area around the tumor is essential in diagnosis, treatment planning and determination of prognosis (1). In daily practice MRI with intravenous contrast administration is the main additional method for the initial noninvasive investigation of patients with intracranial mass. It helps to assess tumor volume, but not the extent of tumor infiltration in white matter tracts. The use of conventional structural MRI sequences is limited because of their insensitivity for detection of tumor cells outside the visible tumor border (4,7), as well as provides little functional information (8). In such cases, advanced imaging 5
6 techniques could be of great value, which allows monitoring the physiological and metabolic characteristics of the tumor and surrounding brain tissue (1). MRS is a noninvasive imaging of metabolic changes within the brain (9). In parallel, the DTI sequence was developed in the last decade and has application in the evaluation of white matter pathways by measuring the degree and directionality of water diffusion in tissue (10). In this study the quantitative parameter of DTI (FA) and MRS metabolic ratios (Cho/Cr, NAA/Cr, LL/Cr and MI/Cr) were measured in selected brain areas. The brain white matter tracts were reconstructed in damaged hemisphere and compared with the opposite normal hemisphere pathways using DTI 3-dimensional tractography method, color coded FA maps and color coded fiber orientation maps. So far, such multimodal approaches in glial tumors studies were not well described in the literature. Although various studies indicate that DTI and MRS quantitative measurements can provide additional information in glial tumors diagnostics and monitoring, it is necessary to determine the repeatability of the tests so that they could be more widely used in clinical practice. However, the reproducibility of DTI and MRS derived indices has not yet been systematically analyzed in the literature (11). Even less repeatability research has been conducted from patients with glial brain tumor. This is the first study evaluating the repeatability index of FA and MRS measures in the tumor, zone of perifocal edema, as well as the distant and the contralateral symmetrical normal-appearing white matter. The structure of the doctoral thesis: Doctoral thesis is written in Latvian and executed on 149 pages. It has one attachment. The work has a classic design, it includes annotations in Latvian and English, introduction, topicality, novelty and practical significance of the study, the aim and the objectives of the study, hypotheses, literature review, materials and methods, results, discussion, conclusions, list of publications and 6
7 reports, bibliography which includes 173 references. Doctoral thesis contains 10 tables and 156 figures. The aim of the study was to assess the usefulness of DTI and MRS in glial brain tumor specified primary radiological diagnosis, and in differentiation between glial tumor recurrence and radiation/chemotherapy induced changes in the brain. Objectives: 1. Investigate FA changes in the specific areas of interest tumor, zone of perifocal edema, treatment induced injury zone, the distant and the contralateral normal-appearing white matter. 2. Collect and analyze the MRS data - different metabolites ratios in identical areas of interest on patients with glial tumors and treatment induced brain injury. 3. Assess the possibility of MRI tractography in characterization of white matter injury caused by tumor and in evaluation of applied treatment. Hypotheses: 1. Glial brain tumor and its perifocal zone are characterized by different values and ratios of MRS neuronal markers, specific changes in brain white matter tracts and quantitative differences in diffusion anisotropy parameters that allow radiological evaluation of tumor spread in visually unchanged peritumoral area. 2. Radiation and/or chemotherapy induced brain injury and tumor recurrence is possible to differentiate, based on differences in MRS neuronal markers and diffusion anisotropy parameters. Topicality, novelty and practical significance of the study: 1. This is the first study in Latvia to evaluate the role of MRS and DTI in glioma diagnosis and in the assessment of treatment effectiveness. 2. For the first time, multimodal approach has been used for the study of glial tumors, combining structural MRI with analysis of MRS and DTI 7
8 quantitative parameters, color coded FA maps, color coded fiber orientation maps and 3-dimensional tractography. 3. MRI tractography methodology has been approbated in clinical practice. 4. Results of this study indicate that DTI is able to differentiate between different white matter tract lesions due to the spread of glial tumor, which is important for preoperative planning and for determining treatment effectiveness. 5. This is the first study evaluating the repeatability index of FA and MRS measures in the tumor, zone of perifocal edema, as well as the distant and the contralateral symmetrical normal-appearing white matter. 6. New data were obtained about the role of MRS and DTI in determination of the vital glioma cells and infiltration area. 7. The most important MRI parameters for evaluating the effectiveness of radiation/chemotherapy were identified. 8. Several recommendations have been developed to introduce DTI and MRS in clinical practice. 9. Our MRI protocol improves the accuracy of radiological diagnosis both for newly diagnosed glioma patients and repeated examination, evaluating the efficacy and side effects of treatment. Accurate diagnosis allows choosing the most appropriate treatment, thereby improving the quality of life and prolonging survival. Personal contribution: The author personally participated in all stages of the research in the study design; in the collection of material, MRI data post-processing, statistical analysis, interpretation of the results obtained, literature review, preparation of publications, theses, conferences reports, and translation; is the author of the published images. 8
9 1. MATERIALS AND METHODS 1.1. Patient selection The study included 150 MRI examinations in 92 patients acquired during the period between August 2009 and December The study included patients with both newly diagnosed brain glioma and those in the follow-up period after treatment. Inclusion criteria: 1. Morphologically confirmed brain glioma. 2. MRI performed using a protocol including DTI and MRS sequences. 3. High quality MRI images (without motion artifacts). Exclusion criteria: 1. Patients without morphologically confirmed brain glioma. 2. Patients with histologically confirmed another type of pathology. 3. MRI performed using a protocol without DTI and/or MRS sequences. 4. Poor quality MRI images (with motion artifacts). Patients were divided into two major groups based on histological findings and structural MRI appearance: 1. Patients with glial brain tumors. 2. Patients in remission after treatment. 73 patients were included in the first group with typical glial brain tumors. Two subgroups were categorized depending on whether or not the patient had received radiotherapy/chemotherapy: before radiotherapy/ chemotherapy (n=24), after radiotherapy/chemotherapy (n=49). The time period between initiation of radiotherapy/chemotherapy and MRS, DTI examinations were from 0.5 to 130 months. The majority of patients (n=53) had received corticosteroids before the MRI examination, 20 patients had not 9
10 received corticosteroids. Depending on grades of malignancy two subgroups were dealt: low-grade glioma (grade II) 7 patients; high-grade glioma (grade III and IV) 66 patients. The second study group included 77 patients in remission with treatment induced brain injury. The treatment induced brain injury was determined by the following criteria: long-term stability of the structural MRI findings or spontaneous regression of lesions. In our study the median follow-up time was 9.41 months (range, 3-24 months) Morphological and immunohistochemical examinations The patients enrolled in this study had different types of neuroepithelial tumors: 53 glioblastomas, 42 anaplastic oligoastrocytomas, 26 anaplastic astrocytomas, 11 astrocytomas, 7 oligoastrocytomas, 5 anaplastic oligodendrogliomas, 4 oligodendrogliomas, 1 pleomorphic xanthoastrocytoma and 1 astroblastoma. Tumors were classified by using the 2007 revised World Health Organization classification of tumors of the central nervous system (12). The final histopathological diagnosis was determined by analysis of formalinfixed, paraffin-embedded tissue samples. The standard method was hematoxylin and eosin staining, and immunohistochemical analysis, including Ki-67 antigen immunostaining (MIB-1 antibody) and GFAP (glial fibrillary acidic protein). Tumor grade was determined histologically, based on seven criteria of malignancy: mitotic activity, microvascular proliferation - angiogenesis, necrosis in tumor, cell polymorphism, nuclear pleomorphism, cell density, lymphocytic muff around the blood vessels. 10
11 1.3. Magnetic resonance imaging protocol All patients were examined using a 1.5 Tesla MR system (General Electric Signa EXCITE MR) equipped with an eight-channel head coil. MRI protocol included following examination sequences: 1. Standard structural sequences a. Axial T2 propeller or coronal T2 FRFSE. b. Axial T2 FLAIR propeller or coronal T2 FLAIR. c. Axial diffusion-weighted imaging (0/Ax DWI 1000b ASSET). d. Obl T1 3D FSPGR IR prep before and after intravenous gadolinium-based contrast media administration. 2. DTI (TENSOR 25 directions 1000b). 3. MRS was performed with 2-dimensional multi-voxel chemical shift imaging - (8ch) PROBE-2DSI PRESS 144TE. The total MRI acquisition time was maximum 20 minutes 17 seconds Magnetic resonance imaging data processing MRS and DTI primary data were automatically transferred to the workstation MR GELS (General Electric) for post-processing. MRS spectral curves, metabolite measurements and DTI images (color coded FA maps, color coded fiber orientation maps and 3-dimensional tractography) were obtained by using the program Functool. Quantitative DTI and MRS measurements were made on identical areas of interest, which were placed manually. In the study group of typical glioma the measurements were made at four locations: tumor, zone of perifocal edema, the distant and the contralateral normal-appearing white matter. In the 11
12 second study group of patients in remission the measurements were made at three locations: abnormal signal intensity area around the postoperative cavity (treatment induced injury zone), the distant and the contralateral normalappearing white matter. Placement of ROI was based on previously published recommendations (4) Fractional anisotropy measurements To make the measurements of quantitative DTI parameter (FA), DTI gray scale maps and color coded FA maps were reconstructed. FA measurements were made on defined areas of interest, which were placed manually on 2-dimensional DTI gray scale maps. Overall, 496 FA measurements were obtained. Selection of the ROI was based on the different brain areas which were identified by the structural T2, FLAIR, post-contrast T1 images and color coded FA maps. The ROI size for FA measurements was 30 pixels (41.2mm 2 ) Tractography In order to distinguish the different tract lesions, the structural MRI images, color coded FA maps, color coded fiber orientation maps and 3- dimensional tractography reconstructions were used. Overall, 243 brain white matter tracts were reconstructed in affected hemisphere 71 internal capsule/corona radiata, 62 subcortical U-fibers, 40 inferior longitudinal fasciculus, 28 uncinate fasciculus, 19 corpus callosum, 8 12
13 inferior frontooccipital fasciculus, 7 middle cerebellar peduncle fibers, 6 arcuate fasciculus, 2 cingulum. In order to visualize white matter tracts by tractography, it was necessary to find the ROIs - the starting points to reconstruct the tract. In our study these starting points were placed manually on DTI color coded fiber orientation maps, based on previously developed 3-dimensional tractography atlas (13) and adapted it to our workstation. Both single and multiple ROIs were used for tractography, depending on the type of tract. White matter tract involvement adjacent to tumor was classified as displacement, edema, infiltration and disruption according to previously published criteria (5): Tract displacement tract maintained normal anisotropy relative to the corresponding tract in the contralateral hemisphere, but was situated in an abnormal location or with an abnormal orientation on color coded fiber orientation maps (5). Tract edema tract maintained normal anisotropy and orientation, but demonstrated high signal intensity on T2 and FLAIR images (5). Tract infiltration tract showed reduced anisotropy, but remained identifiable on color coded fiber orientation maps (5). Tract disruption anisotropy was markedly reduced such that the tract could not be identified on color coded fiber orientation maps (5) Magnetic resonance spectroscopy Quantitative measurements of MRS (Cho/Cr, NAA/Cr, LL/Cr, MI/Cr ratios) were made in definite areas of interest identical to those of FA measurements. After the automatic MRS data post-processing we determined 13
14 the highest metabolic peaks at specific points of spectral curve - MI at ppm, Cho 3.2ppm, Cr 3.0ppm and NAA 2.0ppm. Regarding LL we determined the sum of peak heights between 0.8 and 1.3 ppm. Individual voxels were placed on defined areas of interest at the previously scanned slice. Then the spectrum was calculated automatically. Each metabolite peak was initially assessed visually and metabolite ratios were calculated. Cr was used as the denominator for calculating metabolite ratios, because it is considered the most stable cerebral metabolite. Overall, 2057 measurements of metabolite ratios were obtained Statistical analysis Microsoft Office Excel 2003 was used for data collection. Statistical analysis was performed by using the Statistical Package for the Social Sciences (SPSS, version 20). Statistical methods of data analysis: 1. Descriptive statistics were used for calculating the mean and standard deviations of the samples and the measures (Cho/Cr, NAA/Cr, MI/Cr, LL/Cr and FA). The Kolmogorov - Smirnov test was used to determine if the data were normally distributed. 2. Conclusive statistics: Hypothesis testing. If the variables in paired samples did not meet the normal distribution (p<0.05), the nonparametric related samples Wilcoxon signed rank test was used to compare pairs. If the data were normally distributed (p>0.05), the paired sample t-test was used to compare the values of means for two related samples. The repeatability of measurements was tested with single factor analysis of variance (ANOVA, MS Excel). Mean squares between 14
15 groups (MS A ) and mean squares within groups (MS W ) were derived from ANOVA. Repeatability index (r) was calculated using the following formulas: r=s 2 A/(S 2 +S 2 A) (1.formula) S 2 is mean square within group (MS W ). S 2 A = (MS A -MS W )/n 0 (2.formula) n 0 is the weighted average number of observations per group (14). In this study we have 2 observations per individual, so n 0 =2. The following terminology was used to describe various degrees of repeatability as recommended Martin and Bateson (1986): r <0.2 slight repeatability, r low repeatability, r moderate repeatability, r high repeatability, r >0.9 very high repeatability. This repeatability index was only used in cases if data were statistically significant (15). A p value of less than 0.05 was considered to indicate a significant difference. 15
16 2. RESULTS After post-processing 150 MRI scans, 2553 quantitative measurements of metabolite ratios (Cho/Cr, NAA/Cr, LL/Cr, MI/Cr) and FA parameter were obtained on defined areas of interest: 362 measurements were made in the tumor, 324 measurements in the zone of perifocal edema, 380 measurements in the treatment induced injury zone, 744 measurements in the distant normalappearing white matter and 743 measurements in the contralateral normalappearing white matter Glial tumors Fractional anisotropy analysis We calculated FA mean values and standard deviations in each area of interest using descriptive statistics method. We observed a gradual increase of FA values in the direction from tumor to peritumoral zone and contralateral normal-appearing white matter. The FA measurements results (mean ± standard deviation) in patients with glial brain tumors: in the tumor 0.122(±0.049); in the perifocal edema 0.175(±0.323); in the distant normalappearing white matter 0.323(±0.091); in the contralateral normal-appearing white matter 0.473(±0.068). Comparing data in paired samples between tumor and perifocal edema, statistically significant differences were observed between the FA mean values (p<0.001, Wilcoxon test). Comparing data in paired samples between tumor and distant normalappearing white matter, statistically significant differences were observed between the FA mean values (p<0.001, Wilcoxon test). 16
17 Comparing data between tumor and contralateral normal-appearing white matter, statistically significant differences were observed between the FA mean values (p<0.001, Wilcoxon test). Comparing data between perifocal edema and distant normalappearing white matter, statistically significant differences were observed between the FA mean values (p<0.001, t test). Comparing data between perifocal edema and contralateral normalappearing white matter, statistically significant differences were observed between the FA mean values (p<0.001, Wilcoxon test). Comparing data between distant and contralateral normal-appearing white matter, statistically significant differences were observed between the FA mean values (p<0.001, Wilcoxon test). To determine whether the received radiation/chemotherapy affected diffusion anisotropy parameters, we compared the measurements in two subgroups of patients - before radiotherapy/chemotherapy (n=24) and after radiotherapy/chemotherapy (n=49) by the Wilcoxon test. At any of the measured areas FA mean values did not show statistically significant difference. To determine whether the use of corticosteroids affected FA parameters, we compared the measurements in two subgroups of patients by the Wilcoxon test - patients who received corticosteroids (n=53) and who did not receive corticosteroids (n=20) before MRI. At any of the measured areas FA mean values did not show statistically significant difference Metabolite ratio analysis We calculated mean values and standard deviations of Cho/Cr, NAA/Cr, MI/Cr, LL/Cr ratios in each area of interest using descriptive statistics 17

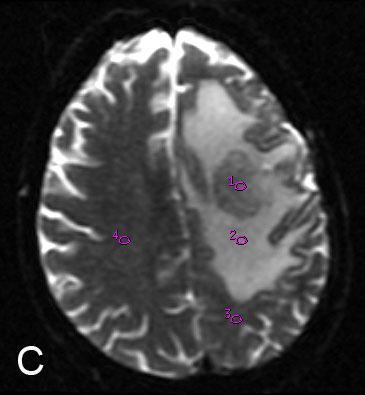
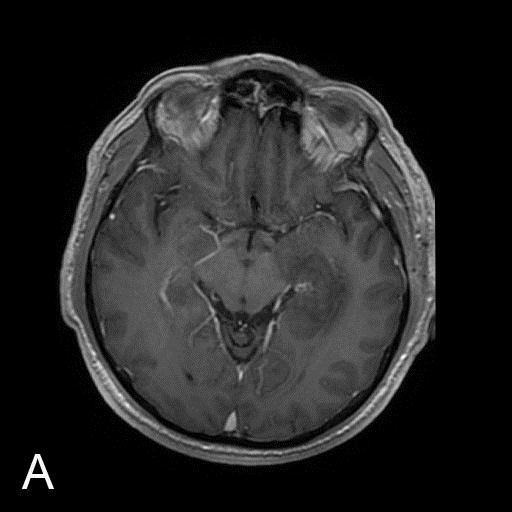
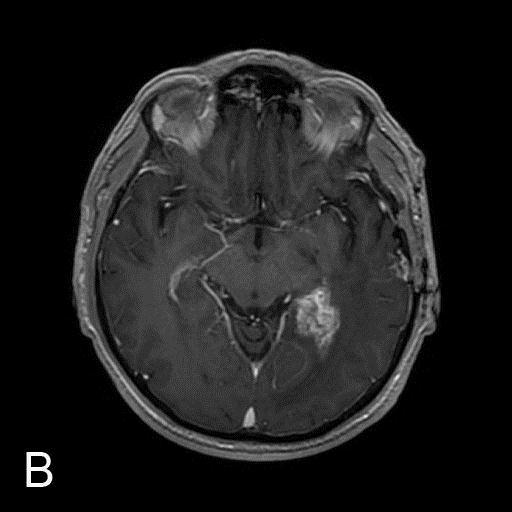
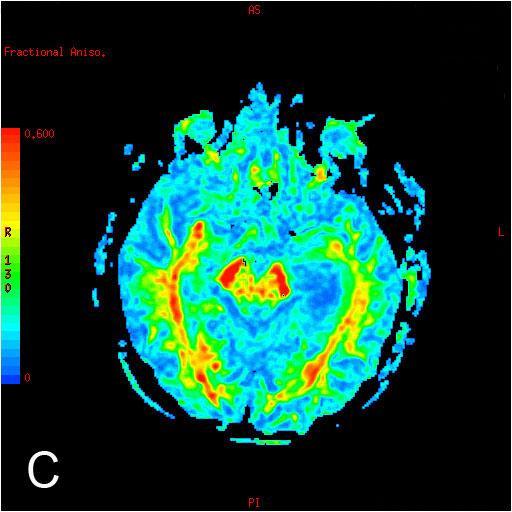
18 method. There were gradual reduction of Cho/Cr, MI/Cr, LL/Cr mean ratios and gradual increase of NAA/Cr mean values in the direction from the tumor to the distant and contralateral normal-appearing white matter. The MRS measurements (NAA/Cr, Cho/Cr, MI/Cr, LL/Cr ratios) are displayed in the Table 2.1. Table 2.1. The metabolite measurements results (mean ± standard deviation) in patients with glial brain tumors The metabolite ratios Tumor Perifocal edema Distant normalappearing white matter Contralateral normalappearing white matter Cho/Cr 2.305(±1.543) 1.444(±0.953) 1.143(±0.545) 0.924(±0.366) NAA/Cr 1.031(±0.517) 1.221(±0.560) 1.493(±0.767) 2.354(±1.010) MI/Cr 0.814(±0.509) 0.756(±0.494) 0.509(±0.302) 0.482(±0.315) LL/Cr 3.933(±1.547) 2.791(±1.313) 1.834(±0.896) 1.247(±0.427) A clinical example of DTI and MRS quantitative measurements from a patient with glial brain tumor is demonstrated in figure (Fig.2.1.). 18

19 19
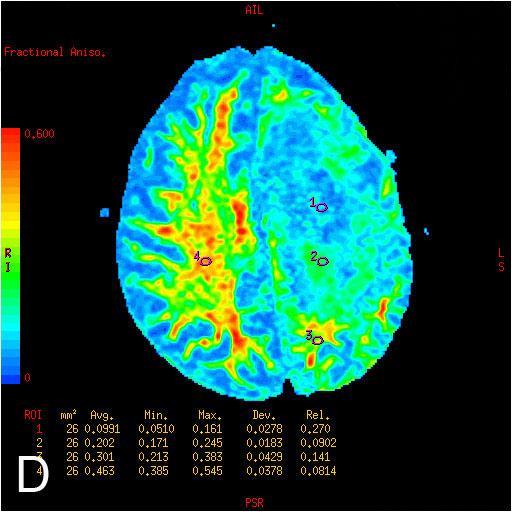
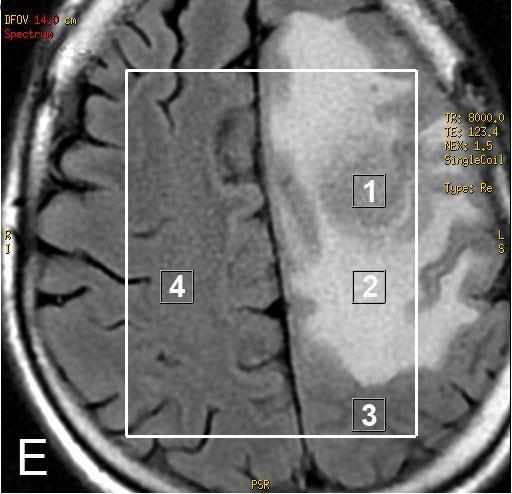
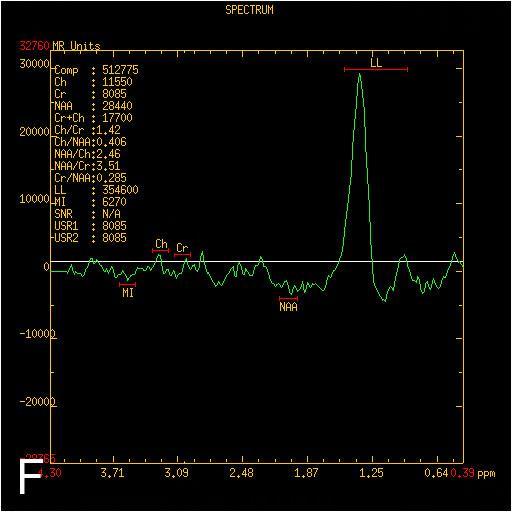
20 Fig.2.1. MR images of 48 years old male with recurrent anaplastic oligodendroglioma. A. Axial FLAIR MRI shows an infiltrative left frontal lobe white matter mass with extensive perifocal edema. B. Axial T1 image after contrast administration demonstrates a well-defined solid tumor with inhomogeneous contrast enhancement and perifocal edema. C. Axial gray scale diffusion tensor map with ROIs placements for the determination of the FA values in definite areas: the tumor [1], the perifocal edema [2], the distant normal-appearing white matter [3] and the contralateral normal-appearing white matter [4]. D. Color coded FA map demonstrates gradual reduction of FA values in the direction from the periphery to the tumor. Regions of high anisotropy are shown in red, and regions of low anisotropy are shown in blue. E. The location of the MRS volume of interest in the brain is outlined by a white square. ROIs for the calculation of the metabolite ratios were placed in identical localizations. F. Typical MRS spectrum of the tumor from the ROI [1] with an elevated LL peak, reduced NAA peak. G. MRS spectrum in the perifocal edema from the ROI [2] displays reduced NAA peak and gradually reduced LL peak in comparison with tumor. H. MR spectrum in the contralateral normal-appearing white matter [4] shows high NAA peak. The LL peak is not visible. (Images from the author's archive) Comparing data in paired samples between tumor and perifocal edema, statistically significant differences were observed between the Cho/Cr mean values (p<0.001, Wilcoxon test), between the NAA/Cr mean values (p=0.009, t test), between the LL/Cr mean values (p<0.001, t test), but MI/Cr did not show statistically significant difference (p=0.647, Wilcoxon test). Comparing data in paired samples between tumor and distant normalappearing white matter, statistically significant differences were observed between the Cho/Cr mean values (p<0.001, Wilcoxon test), between the NAA/Cr mean values (p<0.001, t test), between the MI/Cr mean values (p<0.001, Wilcoxon test), between the LL/Cr mean values (p<0.001, Wilcoxon test). Comparing data between tumor and contralateral normal-appearing white matter, statistically significant differences were observed between the Cho/Cr mean values (p<0.001, Wilcoxon test), between the NAA/Cr mean values (p<0.001, Wilcoxon test), between the MI/Cr mean values (p<0.001, Wilcoxon test), between the LL/Cr mean values (p<0.001, t test). 20
21 Comparing data between perifocal edema and distant normalappearing white matter, statistically significant differences were observed between the Cho/Cr mean values (p=0.034, Wilcoxon test), between the NAA/Cr mean values (p=0.010, t test), between the MI/Cr mean values (p=0.002, Wilcoxon test), between the LL/Cr mean values (p<0.001, Wilcoxon test). Comparing data between perifocal edema and contralateral normalappearing white matter, statistically significant differences were observed between the Cho/Cr mean values (p<0.001, Wilcoxon test), between the NAA/Cr mean values (p<0.001, Wilcoxon test), between the MI/Cr mean values (p<0.001, Wilcoxon test), between the LL/Cr mean values (p<0.001, t test). Comparing data between distant and contralateral normal-appearing white matter, statistically significant differences were observed between the Cho/Cr mean values (p=0.002, Wilcoxon test), between the NAA/Cr mean values (p<0.001, Wilcoxon test), between the LL/Cr mean values (p<0.001, Wilcoxon test), but MI/Cr did not show statistically significant difference (p=0.365, Wilcoxon test). To determine whether the received radiation/chemotherapy affected neuronal markers, we compared the measurements in two subgroups of patients: before radiotherapy/chemotherapy (n=24) and after radiotherapy/ chemotherapy (n=49) by the Wilcoxon test. Comparing measurements in the distant normal-appearing white matter, LL/Cr mean values before radiotherapy/chemotherapy and after radiotherapy/chemotherapy showed statistically significant difference (p=0.013). Other measurements did not show statistically significant differences. Since only the LL/Cr measurements in the distant normal-appearing white matter showed statistically significant difference in patients before and after radiotherapy/chemotherapy, we compared this measurement between patients in clinical and radiological 21
22 remission period (1.377) and patients after received combination therapy with a residual tumor tissue (1.622). The measurements did not show statistically significant difference (p=0.193). To determine whether the use of corticosteroids affected neuronal markers, we compared the measurements in two subgroups of patients by the Wilcoxon test: patients who received corticosteroids (n=53) and who did not receive corticosteroids (n=20) before MRI. In the perifocal edema NAA/Cr mean values in the first subgroup and in the second subgroup showed statistically significant difference (p=0.048) Tractography findings After analysis of 3-dimensional tractography reconstructions, color coded FA maps and color coded fiber orientation maps, four main types of fiber damage by glial tumor spread were defined displacement, edema, infiltration and disruption. These types were divided, based on fiber continuity and orientation on 3-dimensional tractography images and visual assessment of color coded FA maps and color coded fiber orientation maps. We observed tract edema in 3 patients, displacement in 21 patients, infiltration in 32 patients, disruption in 37 patients. Tract lesions were not observed in 9 patients with DTI (Table 2.2. ). Tract lesions depending on the grading of malignancy are summarized in the Table 2.3. Postoperative white matter tract defect was found in 35 patients. 22
23 Table 2.2. Characteristics of white matter tracts involvement in patients with different histological types of glial tumors Type of involvement Histological diagnosis Number of white matter tracts studied Norm (n=9) Glioblastoma 5 Anaplastic astrocytoma 3 Anaplastic oligoastrocytoma 1 Edema (n=3) Glioblastoma 1 Oligoastrocytoma 1 Anaplastic oligoastrocytoma 1 Infiltration (n=32) Glioblastoma 22 Anaplastic astrocytoma 6 Anaplastic oligoastrocytoma 2 Astrocytoma 1 Oligoastrocytoma 1 Displacement (n=21) Glioblastoma 12 Anaplastic astrocytoma 4 Anaplastic oligoastrocytoma 3 Astrocytoma 1 Oligodendroglioma 1 Disruption (n=37) Glioblastoma 23 Anaplastic astrocytoma 6 Anaplastic oligoastrocytoma 4 Oligoastrocytoma 2 Astrocytoma 1 Anaplastic oligodendroglioma 1 23
24 Table 2.3. Characteristics of white matter tracts involvement in high and low grade gliomas Type of involvement Grading of malignancy Number of white matter tracts studied Norm (n=9) high grade 9 low grade 0 Edema (n=3) high grade 2 low grade 1 Infiltration (n=32) high grade 30 low grade 2 Displacement (n=21) high grade 19 low grade 2 Disruption (n=37) high grade 34 low grade 3 Analyzing tract anatomical division, we found the following affected tracts caused by tumor growth and spread internal capsule/corona radiata were affected in 28 patients, inferior longitudinal fasciculus - 23, uncinate fasciculus - 16, corpus callosum - 16, subcortical U-fibers - 11, inferior frontooccipital fasciculus - 7, middle cerebellar peduncle fibers - 7, arcuate fasciculus - 6. Analyzing different tract lesions and their combinations, we found that most patients had only one type of fiber injury. It was observed in 34 patients (disruption in 17 cases, infiltration - 9, displacement - 4, edema - 4). Two types of fiber involvement were associated in 27 patients (infiltration + disruption in 12 cases, infiltration + displacement - 9, displacement + disruption - 6). Combined three types of fiber involvement were observed in 2 patients (displacement + infiltration + disruption). The features of different tract lesions are demonstrated in MRI internal capsule displacement (Fig.2.2.), inferior frontooccipital fasciculus disruption (Fig.2.3. ), right middle cerebellar peduncle fibers infiltration (Fig.2.4.), subcortical U-fibers edema (Fig.2.5). 24


25 Fig.2.2. Internal capsule displacement in a 34-year-old woman with newly diagnosed anaplastic oligoastrocytoma. A. Axial T1 post-contrast MRI shows an infiltrative, inhomogeneous mass with central necrosis in the right temporal lobe, right thalamus, internal capsule with compression of right lateral ventricle and midline shift. Minimal peripheral contrast enhancement is observed. B. DTI color coded fiber orientation map demonstrates medial displacement of the posterior limb of the internal capsule; it retains normal blue-red color. C. In DTI color coded FA map the posterior limb of the internal capsule maintains normal anisotropy relative to the corresponding tract in the contralateral hemisphere. D. Coronal DTI 3-dimensional tractography reconstruction shows abnormal location of the internal capsule it is wrapped around the tumor. (Images from the author's archive) 25


26 Fig.2.3. Inferior frontooccipital fasciculus disruption in a 63-year-old woman with newly diagnosed glioblastoma A. Axial T2 image shows an inhomogeneous, hyperintense mass with central necrosis in the left temporal-occipital lobe. Surrounding hyperintensity represents edema and/or tumor cells. The underlying sulci are effaced and the left ventricle is compressed. B. Axial T1 post-contrast MRI shows heterogeneous, peripheral contrast enhancement that surrounds central necrosis. C. The left inferior frontooccipital fasciculus could not be identified on DTI color coded fiber orientation map, suggestive of disruption. D. DTI color coded FA map demonstrates markedly reduced anisotropy in tumor zone. Disrupted tract could not be reconstructed with 3-dimensional tractography. (Images from the author's archive) 26

27 Fig.2.4. Right middle cerebellar peduncle fibers infiltration in a 62-year-old man due to residual glioblastoma tissues 2 weeks after tumor resection from the posterior cranial fossa. A. Axial T1 post-contrast MRI shows round, enhancing mass in the right middle cerebellar peduncle. B. The majority of the right middle cerebellar peduncle fibers are identifiable on DTI color coded fiber orientation map; small defect is observed in the area of lesion. C. Residual tumor shows reduced anisotropy on DTI color coded FA map. D. Axial DTI 3-dimensional tractography reconstruction demonstrates preserved cortico-ponto-cerebellar pathways. (Images from the author's archive) 27
 demonstrates preserved subcortical U-fibers in the tumor area.")
28 Fig.2.5. Subcortical U-fibers edema in a 25-year-old woman with newly diagnosed anaplastic oligoastrocytoma. A. Axial T2 image shows a hyperintense mass in the right frontal lobe. B. Tract is maintained normal orientation on DTI color coded fiber orientation map. C. Normal anisotropy is maintained on DTI color coded FA map, suggestive of edema. D. Axial DTI 3-dimensional tractography reconstruction (inferior view) demonstrates preserved subcortical U-fibers in the tumor area. (Images from the author's archive) In the study group of glial brain tumors 24 patients with high-grade gliomas were followed up by repeated DTI scans to monitor for therapeutic response. The majority of patients (n=21) demonstrated tract changes in followup images. Tumor growth progression with signs of possible malignant transformation was observed most frequently (n=13): the white matter tract 28
29 displacement, edema or infiltration transformed into disruption, or additional tract involvement joined. More rare DTI tractography did not changed in follow-up studies (n=3) or tumor regression was seen where tracts infiltration decreased in size; their fiber orientation and color were normalized in comparison with MRI before the specific treatment (n=3). During the observation period a number of patients (n=5) underwent surgery and affected tracts were operated. Tractography findings during the follow-up period are summarized in graph (Fig.2.6.). Summarizing the results, most of glial tumor underwent malignant transformation (Fig.2.7.). No change in follow up studies; 3; 13% Tumor is resected; 5; 21% Infiltration reduction; 3; 13% Displacement, edema or infiltration transformation into disruption; 13; 53% Fig.2.6. Monitoring of therapeutic response in 24 patients with high-grade cerebral gliomas using DTI tractography 29
30 30

31 Fig.2.7. Development of high-grade tumor tumor areas with tract infiltration and displacement undergo malignant transformation into disruption within six months in a 57-year-old man with recurrent glioblastoma. A. Axial T1 post-contrast MRI shows mild enhancement of residual tumor. B. Within six months strongly enhanced high-grade tumor is developed. C. DTI color coded FA map shows reduced anisotropy (yellow) in left inferior longitudinal fasciculus, suggestive of an infiltration. D. In a follow-up examination tract demonstrates pronounced FA reduction (greenish-blue color), suggestive of a disruption. E. Left inferior longitudinal fasciculus has maintained its normal green color on DTI color coded fiber orientation map, but it is displaced laterally by the residual tumor. F. After six months disrupted fibers of left inferior longitudinal fasciculus are no longer identifiable on DTI color coded fiber orientation map. G. Axial DTI 3-dimensional tractography reconstruction demonstrates displacement of left inferior longitudinal fasciculus. H. Disrupted left inferior longitudinal fasciculus could not be reconstructed with DTI tractography method. (Images from the author's archive) 2.2. Treatment induced brain injury Fractional anisotropy analysis We calculated FA mean values and standard deviations in each area of interest using descriptive statistics method. We observed a gradual increase of FA mean values in the direction from abnormal signal intensity area around the postoperative cavity to the distant and contralateral normal-appearing white matter. The FA measurements results (mean ± standard deviation) in patients 31
32 with treatment induced injury: in the abnormal signal intensity area around the postoperative cavity 0.185(±0.065); in the distant normal-appearing white matter 0.431(±0.058); in the contralateral white matter 0.446(±0.049). Using a nonparametric related sample Wilcoxon signed rank test we observed statistically significant differences in FA measurements between treatment induced injury zone and distant normal-appearing white matter (p<0.001), between distant and contralateral normal-appearing white matter (p<0.001). Using a paired samples t-test, we observed statistically significant differences in FA measurements between treatment induced injury zone and contralateral normal-appearing white matter (p<0.001) Metabolite ratio analysis We calculated mean values and standard deviations of Cho/Cr, NAA/Cr, MI/Cr, LL/Cr ratios in each area of interest using descriptive statistics method. The results of metabolite measurements are displayed in the Table 2.4. Table 2.4. The metabolite measurements results (mean ± standard deviation) in patients with treatment induced injury The metabolite ratios Abnormal signal intensity area around the postoperative cavity Distant normalappearing white matter Contralateral normal-appearing white matter Cho/Cr 1.355(±0.606) 1.193(±0.418) 1.061(±0.432) NAA/Cr 1.153(±0.507) 1.890(±0.705) 2.272(±0.725) MI/Cr 0.607(±0.362) 0.452(±0.230) 0.383(±0.235) LL/Cr 2.304(±1.213) 1.377(±0.556) 1.217(±0.353) There were gradual reduction of Cho/Cr, MI/Cr, LL/Cr mean ratios and gradual increase of NAA/Cr mean values in the direction from the 32
33 abnormal signal intensity area around the postoperative cavity to the distant and contralateral normal-appearing white matter. Using a nonparametric related sample Wilcoxon signed rank test we observed statistically significant differences in Cho/Cr measurements between treatment induced injury zone and distant normal-appearing white matter (p=0.023), between distant and contralateral white matter (p=0.044). Statistically significant differences in NAA/Cr measurements were observed between treatment induced injury zone and distant normal-appearing white matter (p<0.001), between treatment induced injury zone and contralateral white matter (p<0.001), between distant and contralateral white matter (p<0.001); in MI/Cr measurements were observed between treatment induced injury zone and distant white matter (p<0.001), between treatment induced injury zone and contralateral white matter (p<0.001), between distant and contralateral white matter (p=0.035); in LL/Cr measurements were observed between treatment induced injury zone and distant white matter (p<0.001), between treatment induced injury zone and contralateral white matter (p<0.001). LL/Cr measurements did not show statistically significant difference between distant and contralateral white matter (p=0.054). Using t-test, we observed statistically significant differences in Cho/Cr measurements between treatment induced injury zone and contralateral white matter (p=0.001) Tractography findings Two main types of treatment induced white matter injury were determined using 3-dimensional tractography reconstructions, color coded FA maps and color coded fiber orientation maps - post-surgical fiber defect (Fig.2.8.) and radiation/chemotherapy related demyelination destruction (Fig.2.9.). 33


. D.")
34 Fig.2.8. Post-surgical corpus callosum defect in a 39-year-old man after anaplastic astrocytoma surgery 4 years ago, followed by radiation and chemotherapy. A. Axial T1 post-contrast MRI shows porencephalic cavity in the right frontal lobe, which connects to the frontal horn of the right lateral ventricle. Postoperative defect is visible in the right side of genu corporis callosum, in the left side - gliosis without mass effect. Abnormal contrast enhancement is not seen. B. Genu corporis callosum in the right side is not visualized on DTI color coded fiber orientation map, in the left side - partially visualized. C. Genu corporis callosum in the right side shows significantly reduced anisotropy (blue as cerebrospinal fluid) on DTI color coded FA map, in the right side gliotic area anisotropy is moderately reduced (green). D. In the postoperative defect corpus callosum fibers are not visible, other fibers are preserved on axial DTI 3-dimensional tractography reconstruction (inferior view). (Images from the author's archive) 34

 in the postoperative area, compared with the unchanged right corona radiata (red).")
 35")
35 Fig.2.9. Acute radiation injury in a 44-year-old woman 2 months after anaplastic astrocytoma resection followed by radiotherapy. A. Axial T1 post-contrast MRI demonstrates postoperative cavity in the left frontal parietal lobe with a rim of contrast enhancement. Observing this area after 7 months, pathological contrast enhancement disappeared, suggesting post-treatment changes. B. Left corona radiata fibers is not visualized in the postoperative defect and perifocal abnormal signal intensity area on DTI color coded fiber orientation map. C. DTI color coded FA map shows significantly reduced anisotropy (blue) in the postoperative area, compared with the unchanged right corona radiata (red). Around the postoperative cavity an area with a slightly higher anisotropy (blue-green) is observed, where the injured brain tissue are observed on structural MRI images. D. Sagittal DTI 3-dimensional tractography reconstruction shows defect in corona radiata fibers. (Images from the author's archive) 35
36 In our study postoperative white matter tract defect was found in 71 patients, radiation/chemotherapy induced demyelination destruction in 40 patients (in 33 patients - only postoperative defect, in 2 patients - only demyelination destruction, in 38 patients - both types of fiber injury). Demyelination or gliosis around the postoperative cavity on T2 and FLAIR images were observed in all cases of varying degrees. Destruction of myelin fibers were found in 40 patients (55%) on DTI images, while in the remaining 33 patients (45%) the fibers were not affected, despite the changes on structural conventional MRI. Analyzing tract anatomical division, we found following white matter tract lesions after treatment in 46 patients subcortical U-fibers were affected, 38 internal capsule/corona radiata, 9 inferior longitudinal fasciculus, 3 uncinate fasciculus, 3 corpus callosum, 1 inferior frontooccipital fasciculus and 1 middle cerebellar peduncle fibers. Postoperative fiber injury was mostly diagnosed in association and projection fibers. Postoperative defect of commissural fibers was observed in only two cases. In this study group, 16 patients in remission were observed during follow-up period, by repeated MRI scans. In 14 cases tractography findings were not changed (control MRI was performed within 3-19 months). White matter destruction had progressed only in 2 cases (in 5 and 7 months) Comparison of metabolites and FA between patients with glial tumors and treatment induced brain injury Using nonparametric Wilcoxon test or t-test (depending on the data distribution), mean metabolites ratios and FA values were compared between tumor and treatment induced brain injury zone, between distant normal- 36
37 appearing white matter in patients with glial tumors and patients in remission after treatment, between contralateral normal-appearing white matter in patients with glial tumors and patients in remission. Mean Cho/Cr, MI/Cr, LL/Cr ratios in glial brain tumors were statistically significantly higher and mean FA value lower than those in the treatment induced brain injury zone. NAA/Cr ratios between the tumor and treatment induced brain injury zone did not show statistically significant difference (Table 2.5. ). Table 2.5. Comparison of metabolites and FA between glial tumor and treatment induced brain injury zone Metabolites ratios and FA measurement Tumor Abnormal signal intensity area around the postoperative cavity p value (test) Cho/Cr 2.305(±1.543) 1.355(±0.606) p<0.001 (Wilcoxon test) NAA/Cr 1.031(±0.517) 1.153(±0.507) p=0.192 (t-test) MI/Cr 0.814(±0.509) 0.607(±0.362) p=0.010 (Wilcoxon test) LL/Cr 3.933(±1.547) 2.304(±1.213) p<0.001 (Wilcoxon test) FA 0.122(±0.049) 0.185(±0.065) p<0.001 (Wilcoxon test) Comparing measurements of distant normal signal intensity areas, NAA/Cr ratio and mean FA value were significantly lower and LL/Cr ratio was significantly higher in patients with glial tumors than those in remission period (Table 2.6. ). 37
38 Table 2.6. Comparison of metabolites and FA in the distant normal-appearing white matter between patients with glial tumors and patients in remission after treatment Metabolites ratios and FA measurement Distant white matter in patients with glial tumors Distant white matter in remission p value (test) Cho/Cr 1.143(±0.545) 1.193(±0.418) p=0.466 (Wilcoxon test) NAA/Cr 1.493(±0.767) 1.890(±0.705) p=0.002 (Wilcoxon test) MI/Cr 0.509(±0.302) 0.452(±0.230) p=0.130 (Wilcoxon test) LL/Cr 1.834(±0.896) 1.377(±0.556) p=0.001 (Wilcoxon test) FA 0.323(±0.091) 0.431(±0.058) p<0.001 (Wilcoxon test) Comparing measurements of contralateral normal signal intensity areas, Cho/Cr ratio was significantly lower and MI/Cr ratio, mean FA value were significantly higher in patients with glial tumors than those in remission period (Table 2.7.). Table 2.7. Comparison of metabolites and FA in the contralateral normal-appearing white matter between patients with glial tumors and patients in remission after treatment Metabolites ratios and FA measurement Contralateral white matter in patients with glial tumors Contralateral white matter in remission p value (test) Cho/Cr 0.924(±0.366) 1.061(±0.432) p=0.045 (Wilcoxon test) NAA/Cr 2.354(±1.010) 2.272(±0.725) p=0.985 (Wilcoxon test) MI/Cr 0.482(±0.315) 0.383(±0.235) p=0.027 (Wilcoxon test) LL/Cr 1.247(±0.427) 1.217(±0.353) p=0.644 (t-test) FA 0.473(±0.068) 0.446(±0.049) p=0.017 (Wilcoxon test) 38
39 2.4. Analysis of diagnostic test accuracy Repeatability of MRS and DTI measurements To perform the repeatability analysis of DTI and MRS quantitative measurements, 20 patients with glial tumors were selected. The metabolite ratios (Cho/Cr, NAA/Cr, LL/Cr, MI/Cr) and FA measurements were repeatedly measured using the identical methodology ROIs were placed on the tumor, zone of perifocal edema, the distant and the contralateral normal-appearing white matter. Overall, 398 repeated measurements were made. Analyzing repeated measurements in 20 patients, statistically significant differences were not observed in the tumor between Cho/Cr measurements (p=0.180, Wilcoxon test), NAA/Cr measurements (p=0.081, t- test), MI/Cr measurements (p=0.789, t-test), FA measurements (p=0.671, t- test); in the he perifocal edema between Cho/Cr measurements (p=0.273, Wilcoxon test), MI/Cr measurements (p=0.285, Wilcoxon test), LL/Cr measurements (p=0.347, t-test), FA measurements (p=0.755, t-test); in the distant normal-appearing white matter between NAA/Cr measurements (p=0.500, Wilcoxon test), MI/Cr measurements (p=0.686, Wilcoxon test), LL/Cr measurements (p=0.528, t-test), FA measurements (p=0.563, t-test); in the contralateral normal-appearing white matter between Cho/Cr measurements (p=0.577, t-test), LL/Cr measurements (p=0.093, Wilcoxon test). In six cases, repeated measurements were statistically significantly different, so the repeatability index r was measured. Table 2.8. shows summary of the repeatability index analysis for repeated measurements of MRS and DTI derived measures. 39
40 Table 2.8. Results of repeatability in MRS and DTI derived measurements on 20 patients with glial brain tumors. Mean squares, F and critical values of F were derived from single factor analysis of variance (MS Excel) Measurement LL/Cr tumor NAA/Cr edema Cho/Cr distant NAA/Cr contralateral MI/Cr contralateral FA contralateral Mean square between groups Mean square within groups F ratio* Critical value of F p <0.001 <0.001 < < Index of repeatability (r) Repeatability High High High Moderate High Moderate * F is calculated as the ratio of mean square between groups divided by mean square within groups Influence of ROI size on FA measurements To assess the influence of ROI size on FA measurements, we made repeated measurements with ROI of 12 pixels and 30 pixels in 7 different areas in 115 patients. FA mean value in tumor, measured by 12 pixels ROI was 0.147(± 0.068), with a 30 pixels ROI was 0.134(±0.049) (number of measurements in each group - 50). Measurements did not show statistically significant difference (p=0.322, Wilcoxon test). FA mean value in zone of perifocal edema, measured by 12 pixels ROI was 0.177(±0.063), with a 30 pixels ROI was 0.179(±0.049) (number of measurements in each group - 45). Measurements did not show statistically significant difference (p=0.803, t-test). 40
General Identification. Name: 江 X X Age: 29 y/o Gender: Male Height:172cm, Weight: 65kg Date of admission:95/09/27
 General Identification Name: 江 X X Age: 29 y/o Gender: Male Height:172cm, Weight: 65kg Date of admission:95/09/27 Chief Complaint Sudden onset of seizure for several minutes Present illness This 29-year
Fig.1: A, Sagittal 110x110 mm subimage close to the midline, passing through the cingulum. Note that the fibers of the corpus callosum run at a
 Fig.1 E Fig.1:, Sagittal 110x110 mm subimage close to the midline, passing through the cingulum. Note that the fibers of the corpus callosum run at a slight angle are through the plane (blue dots with
Structural and functional imaging for the characterization of CNS lymphomas
 Structural and functional imaging for the characterization of CNS lymphomas Cristina Besada Introduction A few decades ago, Primary Central Nervous System Lymphoma (PCNSL) was considered as an extremely
Diffusion Tensor Imaging in brain tumours
 Diffusion Tensor Imaging in brain tumours @MarionSmits, MD PhD Associate Professor of Neuroradiology Dept. of Radiology, Erasmus MC, Rotterdam (NL) Honorary Consultant and Reader UCLH National Hospital
Diffusion Tensor Imaging 12/06/2013
 12/06/2013 Beate Diehl, MD PhD FRCP University College London National Hospital for Neurology and Neurosurgery Queen Square London, UK American Epilepsy Society Annual Meeting Disclosure None Learning
1) Diffusion weighted imaging DWI is a term used to describe moving molecules due to random thermal motion. This motion is restricted by boundaries
 Diffusion weighted imaging DWI is a term used to describe moving molecules due to random thermal motion. This motion is restricted by boundaries") 1) Diffusion weighted imaging DWI is a term used to describe moving molecules due to random thermal motion. This motion is restricted by boundaries such as ligaments, membranes and macro molecules. Diffusion
1) Diffusion weighted imaging DWI is a term used to describe moving molecules due to random thermal motion. This motion is restricted by boundaries such as ligaments, membranes and macro molecules. Diffusion
Visualization strategies for major white matter tracts identified by diffusion tensor imaging for intraoperative use
 International Congress Series 1281 (2005) 793 797 www.ics-elsevier.com Visualization strategies for major white matter tracts identified by diffusion tensor imaging for intraoperative use Ch. Nimsky a,b,
Diffusion Tensor Imaging in Psychiatry
 2003 KHBM DTI in Psychiatry Diffusion Tensor Imaging in Psychiatry KHBM 2003. 11. 21. 서울대학교 의과대학 정신과학교실 권준수 Neuropsychiatric conditions DTI has been studied in Alzheimer s disease Schizophrenia Alcoholism
1 MS Lesions in T2-Weighted Images
 1 MS Lesions in T2-Weighted Images M.A. Sahraian, E.-W. Radue 1.1 Introduction Multiple hyperintense lesions on T2- and PDweighted sequences are the characteristic magnetic resonance imaging (MRI) appearance
Lara A. Brandão, MD a,b, *, Mark S. Shiroishi, MD c, Meng Law, MD c. mri.theclinics.com KEYWORDS KEY POINTS
 Brain Tumors A Multimodality Approach with Diffusion- Weighted Imaging, Diffusion Tensor Imaging, Magnetic Resonance Spectroscopy, Dynamic Susceptibility Contrast and Dynamic Contrast-Enhanced Magnetic
Correlation of quantitative proton MR spectroscopy with local histology from stereotactic brain biopsy to evaluate heterogeneity of brain tumors
 Correlation of quantitative proton MR spectroscopy with local histology from stereotactic brain biopsy to evaluate heterogeneity of brain tumors Steve H. Fung, MD 1, Edward F. Jackson, PhD 2, Samuel J.
Exploring Peritumoral White Matter Fibers for Neurosurgical Planning
 Exploring Peritumoral White Matter Fibers for Sonia Pujol, Ph.D. Ron Kikinis, M.D. Surgical Planning Laboratory Harvard University Clinical Goal Diffusion Tensor Imaging (DTI) Tractography has the potential
Regional and Lobe Parcellation Rhesus Monkey Brain Atlas. Manual Tracing for Parcellation Template
 Regional and Lobe Parcellation Rhesus Monkey Brain Atlas Manual Tracing for Parcellation Template Overview of Tracing Guidelines A) Traces are performed in a systematic order they, allowing the more easily
CNS TUMORS. D r. Ali Eltayb ( U. of Omdurman. I ). M. Path (U. of Alexandria)
. M. Path (U. of Alexandria)") CNS TUMORS D r. Ali Eltayb ( U. of Omdurman. I ). M. Path (U. of Alexandria) CNS TUMORS The annual incidence of intracranial tumors of the CNS ISmore than intraspinal tumors May be Primary or Secondary
CNS TUMORS D r. Ali Eltayb ( U. of Omdurman. I ). M. Path (U. of Alexandria) CNS TUMORS The annual incidence of intracranial tumors of the CNS ISmore than intraspinal tumors May be Primary or Secondary
Five Most Common Problems in Surgical Neuropathology
 Five Most Common Problems in Surgical Neuropathology If the brain were so simple that we could understand it, we would be so simple that we couldn t Emerson Pugh What is your greatest difficulty in neuropathology?
Astroblastoma: Radiologic-Pathologic Correlation and Distinction from Ependymoma
 AJNR Am J Neuroradiol 23:243 247, February 2002 Case Report Astroblastoma: Radiologic-Pathologic Correlation and Distinction from Ependymoma John D. Port, Daniel J. Brat, Peter C. Burger, and Martin G.
MRS and Perfusion of Brain Tumors
 Department of Radiology University of California San Diego MRS and Perfusion of Brain Tumors John R. Hesselink, M.D. MRS & Perfusion of Brain Tumors Tumor histology Degree of malignancy Delineate tumor
Role of functional MRI in evaluating intraaxial brain tumors Advances and pitfalls.
 Role of functional MRI in evaluating intraaxial brain tumors Advances and pitfalls. Poster No.: C-1685 Congress: ECR 2014 Type: Educational Exhibit Authors: A. R. Udare, A. Mahajan, S. Juvekar, P. Shetty,
Gross Organization I The Brain. Reading: BCP Chapter 7
 Gross Organization I The Brain Reading: BCP Chapter 7 Layout of the Nervous System Central Nervous System (CNS) Located inside of bone Includes the brain (in the skull) and the spinal cord (in the backbone)
Oligodendroglioma: imaging findings, radio-pathological correlation and evolution
 Oligodendroglioma: imaging findings, radio-pathological correlation and evolution Poster No.: C-2104 Congress: ECR 2013 Type: Authors: Keywords: DOI: Scientific Exhibit A. Hernandez Castro, M. D. Monedero
Functional MRI and Diffusion Tensor Imaging
 Functional MRI and Diffusion Tensor Imaging Andrew Steven March 23, 2018 Ochsner Neuroscience Symposium None Disclosure 1 Objectives Review basic principles of BOLD fmri and DTI. Discuss indications and
Research Article Corticospinal Tract Change during Motor Recovery in Patients with Medulla Infarct: A Diffusion Tensor Imaging Study
 BioMed Research International, Article ID 524096, 5 pages http://dx.doi.org/10.1155/2014/524096 Research Article Corticospinal Tract Change during Motor Recovery in Patients with Medulla Infarct: A Diffusion
Is DTI Increasing the Connectivity Between the Magnet Suite and the Clinic?
 Current Literature In Clinical Science Is DTI Increasing the Connectivity Between the Magnet Suite and the Clinic? Spatial Patterns of Water Diffusion Along White Matter Tracts in Temporal Lobe Epilepsy.
SUPPLEMENTARY INFORMATION
 VOLUME: 1 ARTICLE NUMBER: 0027 In the format provided by the authors and unedited. Rapid intraoperative histology of unprocessed surgical specimens via fibre-laser-based stimulated Raman scattering microscopy
Translating MRS into clinical benefit for children with brain tumours
 Translating MRS into clinical benefit for children with brain tumours Andrew Peet NIHR Research Professor Childhood Cancer The Facts Cancer is the most common cause of death from disease in childhood Brain
Goals for this Lecture. Case 1. Key Points MRI TECHNIQUES FOR DIFFERENTIAL DIAGNOSIS OF RECURRENT BRAIN LESIONS
 MRI TECHNIQUES FOR DIFFERENTIAL DIAGNOSIS OF RECURRENT BRAIN LESIONS Goals for this Lecture 1. Review common appearances for recurrent tumor and treatment effects on conventional MRI 2. Discuss current
Functional aspects of anatomical imaging techniques
 Functional aspects of anatomical imaging techniques Nilendu Purandare Associate Professor & Consultant Radiologist Tata Memorial Centre Functional/metabolic/molecular imaging (radioisotope scanning) PET
Publication for the Philips MRI Community Issue 39 December 2009
 FieldStrength Publication for the Philips MRI Community Issue 39 December 2009 32-channel coil boosts 3.0T neuro imaging at Kennedy Krieger Kennedy Krieger Institute sees significantly better fmri, DTI,
CNS pathology Third year medical students. Dr Heyam Awad 2018 Lecture 12: CNS tumours 2/3
 CNS pathology Third year medical students Dr Heyam Awad 2018 Lecture 12: CNS tumours 2/3 Pilocytic astrocytoma Relatively benign ( WHO grade 1) Occurs in children and young adults Mostly: in the cerebellum
Role of proton magnetic resonance spectroscopy in diagnosis of pilocytic astrocytoma in children
 Alexandria Journal of Medicine (2012) 48, 131 137 Alexandria University Faculty of Medicine Alexandria Journal of Medicine www.sciencedirect.com ORIGINAL ARTICLE Role of proton magnetic resonance spectroscopy
Speed, Comfort and Quality with NeuroDrive
 Speed, Comfort and Quality with NeuroDrive Echelon Oval provides a broad range of capabilities supporting fast, accurate diagnosis of brain conditions and injuries. From anatomical depiction to vascular
MRI and CT of the CNS
 MRI and CT of the CNS Dr.Maha ELBeltagy Assistant Professor of Anatomy Faculty of Medicine The University of Jordan 2018 Computed Tomography CT is used for the detection of intracranial lesions. CT relies
DISTINCTION BETWEEN RECURRENT GLIOMA AND RADIATION INJURY USING MAGNETIC RESONANCE SPECTROSCOPY IN COMBINATION WITH DIFFUSION-WEIGHTED IMAGING
 doi:10.1016/j.ijrobp.2006.12.001 Int. J. Radiation Oncology Biol. Phys., Vol. 68, No. 1, pp. 151 158, 2007 Copyright 2007 Elsevier Inc. Printed in the USA. All rights reserved 0360-3016/07/$ see front
CT & MRI Evaluation of Brain Tumour & Tumour like Conditions
 CT & MRI Evaluation of Brain Tumour & Tumour like Conditions Dr. Anjana Trivedi 1, Dr. Jay Thakkar 2, Dr. Maulik Jethva 3, Dr. Ishita Virda 4 1 M.D. Radiology, Professor and Head, P.D.U. Medical College
P. Hitchcock, Ph.D. Department of Cell and Developmental Biology Kellogg Eye Center. Wednesday, 16 March 2009, 1:00p.m. 2:00p.m.
 Normal CNS, Special Senses, Head and Neck TOPIC: CEREBRAL HEMISPHERES FACULTY: LECTURE: READING: P. Hitchcock, Ph.D. Department of Cell and Developmental Biology Kellogg Eye Center Wednesday, 16 March
Patterns of Brain Tumor Recurrence Predicted From DTI Tractography
 Patterns of Brain Tumor Recurrence Predicted From DTI Tractography Anitha Priya Krishnan 1, Isaac Asher 2, Dave Fuller 2, Delphine Davis 3, Paul Okunieff 2, Walter O Dell 1,2 Department of Biomedical Engineering
Chapter 1 Introduction
 Chapter 1 Introduction Men think epilepsy divine, merely because they do not understand it. But if they called everything divine which they do not understand, why, there would be no end to divine things.
Summary of findings from the previous meta-analyses of DTI studies in MDD patients. SDM (39) 221 Left superior longitudinal
 221 Left superior longitudinal") Supplemental Data Table S1 Summary of findings from the previous meta-analyses of DTI studies in MDD patients Study Analysis Method Included studies, n MDD (medicated) HC Results (MDDHC)
Supplemental Data Table S1 Summary of findings from the previous meta-analyses of DTI studies in MDD patients Study Analysis Method Included studies, n MDD (medicated) HC Results (MDDHC)
Comparison of 1.5T and 3T 1 H MR Spectroscopy for Human Brain Tumors
 Comparison of 1.5T and 3T 1 H MR Spectroscopy for Human Brain Tumors Ji-hoon Kim, MD 1 Kee-Hyun Chang, MD 2-4 Dong Gyu Na, MD 2 In Chan Song, PhD 2,3 Seung Ja Kim, MD 2 Bae Ju Kwon, MD 2 Moon Hee Han,
SPECIAL SLIDE SEMINAR CASE 3
 SPECIAL SLIDE SEMINAR CASE 3 Tihana Džombeta, MD Leo Pažanin, MD, PhD Department of Pathology, School of Medicine, University of Zagreb Department of Pathology, Clinical Hospital Centre Sestre milosrdnice
/13/$ IEEE
 Multivariate Discriminant Analysis of Multiparametric Brain MRI to Differentiate High Grade and Low Grade Gliomas - A Computer- Aided Diagnosis Development Study *, Zeynep Firat, Ilhami Kovanlikaya, Ugur
Case Report. Case Report
 AJNR Am J Neuroradiol 26:274 278, February 2005 Case Report Differential Chemosensitivity of Tumor Components in a Malignant Oligodendroglioma: Assessment with Diffusion-Weighted, Perfusion- Weighted,
DTI fiber tracking at 3T MR using b-1000 value in the depiction of periprostatic nerve before and after nervesparing prostatectomy
 DTI fiber tracking at 3T MR using b-1000 value in the depiction of periprostatic nerve before and after nervesparing prostatectomy Poster No.: C-2328 Congress: ECR 2012 Type: Scientific Paper Authors:
LOW GRADE ASTROCYTOMAS
 LOW GRADE ASTROCYTOMAS This article was provided to us by David Schiff, MD, Associate Professor of Neurology, Neurosurgery, and Medicine at University of Virginia, Charlottesville. We appreciate his generous
The human brain weighs roughly 1.5 kg and has an average volume of 1130 cm 3. A sheep s brain weighs in however at kg.
 Sheep Brain Dissection Objectives: 1. List and describe the principal structures of the sheep brain 2. Identify important parts of the sheep brain in a preserved specimen Materials: Dissection tools, lab
Chronology of normal brain myelination in newborns with MR imaging
 Chronology of normal brain myelination in newborns with MR imaging Poster No.: C-0577 Congress: ECR 2012 Type: Authors: Keywords: DOI: Scientific Exhibit F. Fernandez Usagre; Sevilla/ES Neuroradiology
General: Brain tumors are lesions that have mass effect distorting the normal tissue and often result in increased intracranial pressure.
 1 Lecture Objectives Know the histologic features of the most common tumors of the CNS. Know the differences in behavior of the different tumor types. Be aware of the treatment modalities in the various
Fourth Ventricular Lesions in Metastatic Gliomas: A Rare Predilection?
 CASE REPORT Brain Tumor Res Treat 2017;5(1):24-29 / pissn 2288-2405 / eissn 2288-2413 https://doi.org/10.14791/btrt.2017.5.1.24 Fourth Ventricular Lesions in Metastatic Gliomas: A Rare Predilection? Mohammed
Stereotactic Diffusion Tensor Tractography For Gamma Knife Stereotactic Radiosurgery
 Disclosures The authors of this study declare that they have no commercial or other interests in the presentation of this study. This study does not contain any use of offlabel devices or treatments. Stereotactic
Laura Tormoehlen, M.D. Neurology and EM-Toxicology Indiana University
 Laura Tormoehlen, M.D. Neurology and EM-Toxicology Indiana University Disclosures! No conflicts of interest to disclose Neuroimaging 101! Plain films! Computed tomography " Angiography " Perfusion! Magnetic
Pearls and Pitfalls of MR Diffusion in Clinical Neurology
 Pearls and Pitfalls of MR Diffusion in Clinical Neurology Dr. Alberto Bizzi Neuroradiology Unit Fondazione IRCCS Istituto Neurologico Carlo Besta Milan, Italy Email: alberto_bizzi@fastwebnet.it Diffusion
Tumors of the Nervous System
 Tumors of the Nervous System Peter Canoll MD. PhD. What I want to cover What are the most common types of brain tumors? Who gets them? How do they present? What do they look like? How do they behave? 1
Study of the CNS. Bent O. Kjos' Richard L. Ehman Michael Brant-Zawadzki William M. Kelly David Norman Thomas H. Newton
 271 Reproducibility of Relaxation Times and Spin Density Calculated from Routine MR Imaging Sequences: Clinical Study of the CNS Bent O. Kjos' Richard L. Ehman Michael Brant-Zawadzki William M. Kelly David
Diffusion-Weighted and Conventional MR Imaging Findings of Neuroaxonal Dystrophy
 AJNR Am J Neuroradiol 25:1269 1273, August 2004 Diffusion-Weighted and Conventional MR Imaging Findings of Neuroaxonal Dystrophy R. Nuri Sener BACKGROUND AND PURPOSE: Neuroaxonal dystrophy is a rare progressive
Fig. 1. Localized single voxel proton MR spectroscopy was performed along the long axis of right hippocampus after extension of patient s head to
 125 A B C Fig. 1. Localized single voxel proton MR spectroscopy was performed along the long axis of right hippocampus after extension of patient s head to obtain entire dimension of the hippocampal body.
Fibre orientation dispersion in the corpus callosum relates to interhemispheric functional connectivity
 Fibre orientation dispersion in the corpus callosum relates to interhemispheric functional connectivity ISMRM 2017: http://submissions.mirasmart.com/ismrm2017/viewsubmissionpublic.aspx?sei=8t1bikppq Jeroen
Cerebral Cortex 1. Sarah Heilbronner
 Cerebral Cortex 1 Sarah Heilbronner heilb028@umn.edu Want to meet? Coffee hour 10-11am Tuesday 11/27 Surdyk s Overview and organization of the cerebral cortex What is the cerebral cortex? Where is each
The Radiologic Evaluation of Glioblastoma (GBM) and Differentiation from Pseudoprogression
 and Differentiation from Pseudoprogression") The Radiologic Evaluation of Glioblastoma (GBM) and Differentiation from Pseudoprogression Alexis Roy, Harvard Medical School, Year III Our Patient AB: Clinical Presentation 53 year old female with a past
The Radiologic Evaluation of Glioblastoma (GBM) and Differentiation from Pseudoprogression Alexis Roy, Harvard Medical School, Year III Our Patient AB: Clinical Presentation 53 year old female with a past
Amide Proton Transfer Imaging: A Novel MR Method for High-grade Brain Tumors.
 Amide Proton Transfer Imaging: A Novel MR Method for High-grade Brain Tumors. Poster No.: C-1732 Congress: ECR 2013 Type: Scientific Exhibit Authors: M. Ida, M. Ishizuka, T. Suzuki, Y. Kubo, K. Hino, S.
Primary Central Nervous System Lymphoma with Lateral Ventricle Involvement
 The Open Medical Imaging Journal, 2012, 6, 103-107 103 Open Access Primary Central Nervous System Lymphoma with Lateral Ventricle Involvement Yumi Oie 1,*, Kazuhiro Murayama 1, Shinya Nagahisa 2, Masato
Diffusion tensor imaging of the infant brain: From technical problems to neuroscientific breakthroughs Jessica Dubois
 Diffusion tensor imaging of the infant brain: From technical problems to neuroscientific breakthroughs Jessica Dubois L. Hertz-Pannier, G. Dehaene-Lambertz, J.F. Mangin, D. Le Bihan Inserm U56, U663; NeuroSpin
MR Tumor Staging for Treatment Decision in Case of Wilms Tumor
 MR Tumor Staging for Treatment Decision in Case of Wilms Tumor G. Schneider, M.D., Ph.D.; P. Fries, M.D. Dept. of Diagnostic and Interventional Radiology, Saarland University Hospital, Homburg/Saar, Germany
Leah Militello, class of 2018
 Leah Militello, class of 2018 Objectives 1. Describe the general organization of cerebral hemispheres. 2. Describe the locations and features of the different functional areas of cortex. 3. Understand
Normal myelination: a practical pictorial review
 Normal myelination: a practical pictorial review Poster No.: C-1486 Congress: ECR 2016 Type: Authors: Keywords: DOI: Educational Exhibit M. Gaha, N. Mama, N. Arifa, H. Jemni, K. Tlili Graiess; Sousse/TN
Correlation of Myo-inositol Levels and Grading of Cerebral Astrocytomas
 AJNR Am J Neuroradiol 21:1645 1649, October 2000 Correlation of Myo-inositol Levels and Grading of Cerebral Astrocytomas Mauricio Castillo, J. Keith Smith, and Lester Kwock BACKGROUND AND PURPOSE: In a
Seamless pre-surgical fmri and DTI mapping
 Seamless pre-surgical fmri and DTI mapping Newest release Achieva 3.0T X-series and Eloquence enable efficient, real-time fmri for brain activity mapping in clinical practice at Nebraska Medical Center
Tissue-engineered medical products Evaluation of anisotropic structure of articular cartilage using DT (Diffusion Tensor)-MR Imaging
-MR Imaging") Provläsningsexemplar / Preview TECHNICAL REPORT ISO/TR 16379 First edition 2014-03-01 Tissue-engineered medical products Evaluation of anisotropic structure of articular cartilage using DT (Diffusion Tensor)-MR
Provläsningsexemplar / Preview TECHNICAL REPORT ISO/TR 16379 First edition 2014-03-01 Tissue-engineered medical products Evaluation of anisotropic structure of articular cartilage using DT (Diffusion Tensor)-MR
Clinical Trials for Adult Brain Tumors - the Imaging Perspective
 Clinical Trials for Adult Brain Tumors - the Imaging Perspective Whitney B. Pope, M.D., Ph.D. Department of Radiology David Geffen School of Medicine at UCLA August 22, 2015 1 Disclosure of Financial Relationships
Cerebro-vascular stroke
 Cerebro-vascular stroke CT Terminology Hypodense lesion = lesion of lower density than the normal brain tissue Hyperdense lesion = lesion of higher density than normal brain tissue Isodense lesion = lesion
Rapid recurrence of a malignant meningioma: case report
 Romanian Neurosurgery Volume XXXI Number 2 2017 April-June Article Rapid recurrence of a malignant meningioma: case report Oguz Baran, Sima Sayyahmeli, Taner Tanriverdi, Pamir Erdincler TURKEY DOI: 10.1515/romneu-2017-0027
High spatial resolution reveals excellent detail in pediatric neuro imaging
 Publication for the Philips MRI Community Issue 46 2012/2 High spatial resolution reveals excellent detail in pediatric neuro imaging Achieva 3.0T with 32-channel SENSE Head coil has become the system
Brain tissue and white matter lesion volume analysis in diabetes mellitus type 2
 Brain tissue and white matter lesion volume analysis in diabetes mellitus type 2 C. Jongen J. van der Grond L.J. Kappelle G.J. Biessels M.A. Viergever J.P.W. Pluim On behalf of the Utrecht Diabetic Encephalopathy
Original Research Article
 Original Research Article Comparison of Single Voxel and Multi Voxel Magnetic Resonance Spectroscopy in Evaluation of Brain Tumors Anith Alfred J 1, Abubacker Sulaiman F 2, Divya Shree 3, Ashraf Ahmed
RECENT ADVANCES IN CLINICAL MR OF ARTICULAR CARTILAGE
 In Practice RECENT ADVANCES IN CLINICAL MR OF ARTICULAR CARTILAGE By Atsuya Watanabe, MD, PhD, Director, Advanced Diagnostic Imaging Center and Associate Professor, Department of Orthopedic Surgery, Teikyo
The Significance of Lactate and Lipid Peaks for Predicting Primary Neuroepithelial Tumor Grade with Proton MR Spectroscopy
 Magn Reson Med Sci 207; XX; XXX XXX doi:0.2463/mrms.mp.207-0042 Published Online: August 6, 207 MAJOR PAPER The Significance of Lactate and Lipid Peaks for Predicting Primary Neuroepithelial Tumor Grade
CT - Brain Examination
 CT - Brain Examination Submitted by: Felemban 1 CT - Brain Examination The clinical indication of CT brain are: a) Chronic cases (e.g. headache - tumor - abscess) b) ER cases (e.g. trauma - RTA - child
Clinics in diagnostic imaging (175)
") Singapore Med J 2017; 58(3): 121-125 doi: 10.11622/smedj.2017017 CMEArticle Clinics in diagnostic imaging (175) Vijay Krishnan 1, MD, FRCR, Tze Chwan Lim 1, MBBS, FRCR, Francis Cho Hao Ho 2, MBBS, FRANZCR,
Singapore Med J 2017; 58(3): 121-125 doi: 10.11622/smedj.2017017 CMEArticle Clinics in diagnostic imaging (175) Vijay Krishnan 1, MD, FRCR, Tze Chwan Lim 1, MBBS, FRCR, Francis Cho Hao Ho 2, MBBS, FRANZCR,
NEURO IMAGING 2. Dr. Said Huwaijah Chairman of radiology Dep, Damascus Univercity
 NEURO IMAGING 2 Dr. Said Huwaijah Chairman of radiology Dep, Damascus Univercity I. EPIDURAL HEMATOMA (EDH) LOCATION Seventy to seventy-five percent occur in temporoparietal region. CAUSE Most likely caused
Anaplastic Pilocytic Astrocytoma: The fusion of good and bad
 Anaplastic Pilocytic Astrocytoma: The fusion of good and bad Alexandrina Nikova 1, Charalampos-Chrysovalantis Chytoudis-Peroudis 2, Penelope Korkolopoulou 3 and Dimitrios Kanakis 4 Abstract 5 Pilocytic
BIOL Dissection of the Sheep and Human Brain
 BIOL 2401 Dissection of the Sheep and Human Brain Laboratory Objectives After completing this lab, you should be able to: Identify the main structures in the sheep brain and to compare them with those
HEAD AND NECK IMAGING. James Chen (MS IV)
") HEAD AND NECK IMAGING James Chen (MS IV) Anatomy Course Johns Hopkins School of Medicine Sept. 27, 2011 OBJECTIVES Introduce cross sectional imaging of head and neck Computed tomography (CT) Review head
HEAD AND NECK IMAGING James Chen (MS IV) Anatomy Course Johns Hopkins School of Medicine Sept. 27, 2011 OBJECTIVES Introduce cross sectional imaging of head and neck Computed tomography (CT) Review head
Clinically focused workflow with unique ability to integrate fmri, DTI, fiber tracks and perfusion in a single, multi-layered 3D rendering
 Clinically focused workflow with unique ability to integrate fmri, DTI, fiber tracks and perfusion in a single, multi-layered 3D rendering Neurosurgeons are demanding more from neuroradiologists and increasingly
Imaging in Pediatric `neurohiv Dr Jackie Hoare Head of Liaison Psychiatry Groote Schuur Hospital, UCT
 Imaging in Pediatric `neurohiv Dr Jackie Hoare Head of Liaison Psychiatry Groote Schuur Hospital, UCT ? Spectrum of Neurocognitive disorders The adult literature on HIV related CNS damage supports a spectrum
Understanding general brain tumor pathology, Part I: The basics. Craig Horbinski, M.D., Ph.D. Department of Pathology University of Kentucky
 Understanding general brain tumor pathology, Part I: The basics Craig Horbinski, M.D., Ph.D. Department of Pathology University of Kentucky plan of attack what IS a pathologist, anyway? what s so special
CNS SESSION 3/8/ th Multidisciplinary Management of Cancers: A Case based Approach
 CNS SESSION Chair: Ruben Fragoso, MD/PhD UC Davis Fellow: Michael Cardenas, MD UC Davis Panel: Gordon Li, MD Stanford Seema Nagpal, MD Stanford Jennie Taylor, MD UCSF HPI: 46 yo right handed woman who
New Imaging Concepts in Central Nervous System Neoplasms
 New Imaging Concepts in Central Nervous System Neoplasms Maarten Lequin Department of Pediatric Radiology Wilhelmina Children s Hospital/University Medical Center Utrecht New Imaging Concepts in Central
Tracking the language pathways in edema patients: Preliminary results.
 Tracking the language pathways in edema patients: Preliminary results. Sarah M. E. Gierhan 1,2, Peter Rhone 3,4, Alfred Anwander 1, Isabel Jost 3, Clara Frydrychowicz 3, Karl-Titus Hoffmann 4, Jürgen Meixensberger
Telencephalon (Cerebral Hemisphere)
") Telencephalon (Cerebral Hemisphere) OUTLINE The Cortex - Lobes, Sulci & Gyri - Functional Subdivisions - Limbic Lobe & Limbic System The Subcortex - Basal Ganglia - White Matter (Internal Capsule) - Relations
Telencephalon (Cerebral Hemisphere) OUTLINE The Cortex - Lobes, Sulci & Gyri - Functional Subdivisions - Limbic Lobe & Limbic System The Subcortex - Basal Ganglia - White Matter (Internal Capsule) - Relations
PRINCESS MARGARET CANCER CENTRE CLINICAL PRACTICE GUIDELINES
 PRINCESS MARGARET CANCER CENTRE CLINICAL PRACTICE GUIDELINES CENTRAL NERVOUS SYSTEM LOW GRADE GLIOMAS CNS Site Group Low Grade Gliomas Author: Dr. Norm Laperriere 1. INTRODUCTION 3 2. PREVENTION 3 3. SCREENING
PDFlib PLOP: PDF Linearization, Optimization, Protection. Page inserted by evaluation version
 PDFlib PLOP: PDF Linearization, Optimization, Protection Page inserted by evaluation version www.pdflib.com sales@pdflib.com Principal Diffusion Direction in Peritumoral Fiber Tracts Color Map Patterns
Pediatric MS MRI Study Methodology
 General Pediatric MS MRI Study Methodology SCAN PREPARATION axial T2-weighted scans and/or axial FLAIR scans were obtained for all subjects when available, both T2 and FLAIR scans were scored. In order
Web Training Modules Module 13: MR Imaging for Brain Injuries
 Web Training Modules Module 13: MR Imaging for Brain Injuries 1 Introduction... 4 Mild Traumatic Brain Injuries... 5 Structural MRI... 5 Diffusion Tensor Imaging... 6 Diffusion Kurtosis Imaging... 11 Functional
FDOPA, C11Choline, C11 Methionine. Dr K.G.Kallur
 FDOPA, C11Choline, C11 Methionine Dr K.G.Kallur Why? 11C Methionine scan Had undergone resection Earlier. Post op recurrent hypercalcemia C11 Methionine Unable to see in Sestamibi scan Brain Tumor After
intracranial anomalies
 Chapter 5: Fetal Central Nervous System 84 intracranial anomalies Hydrocephaly Dilatation of ventricular system secondary to an increase in the amount of CSF. Effects of hydrocephalus include flattening
Attenuation value in HU From -500 To HU From -10 To HU From 60 To 90 HU. From 200 HU and above
 Brain Imaging Common CT attenuation values Structure Air Fat Water Brain tissue Recent hematoma Calcifications Bone Brain edema and infarction Normal liver parenchyma Attenuation value in HU From -500
Use of Diffusion Tensor Images in Glioma Growth Modeling for Radiotherapy Target Delineation
 Use of Diffusion Tensor Images in Glioma Growth Modeling for Radiotherapy Target Delineation Florian Dittmann, Bjoern Menze, Ender Konukoglu, Jan Unkelbach To cite this version: Florian Dittmann, Bjoern
Announcement. Danny to schedule a time if you are interested.
 Announcement If you need more experiments to participate in, contact Danny Sanchez (dsanchez@ucsd.edu) make sure to tell him that you are from LIGN171, so he will let me know about your credit (1 point).
First Clinical Experiences with Simultaneous Multi-Slice Accelerated Diffusion-Weighted Imaging Throughout the Body
 Clinical Oncological Imaging First Clinical Experiences with Simultaneous Multi-Slice Accelerated Diffusion-Weighted Imaging Throughout the Body Valentin Tissot, M.D. 1 ; Olivier Legeas, M.D. 1 ; Isabelle
Surgery Within and Around Critical White Matter Tracts
 Surgery Within and Around Critical White Matter Tracts Kaisorn L. Chaichana, M.D. Assistant Professor of Neurosurgery, Oncology, and Otolaryngology-Head & Neck Surgery Mayo Clinic Florida, Jacksonville,
MR Assessment of Myelination in Infants and Children: Usefulness of Marker Sites
 731 MR ssessment of Myelination in Infants and Children: Usefulness of Marker Sites C. Roger ird 1 Mary Hedberg urton P. Drayer Paul J. Keller Richard. Flom John. Hodak retrospective study was made of