Supplementary Figure 1: si-craf but not si-braf sensitizes tumor cells to radiation.
|
|
|
- Wesley Booker
- 5 years ago
- Views:
Transcription
 Embryonic fibroblasts isolated from wildtype (WT), BRAF -/-, or CRAF -/- mice were irradiated (6 Gy) and DNA damage was assessed using γh2ax staining.")
1 Supplementary Figure 1: si-craf but not si-braf sensitizes tumor cells to radiation. (a) Embryonic fibroblasts isolated from wildtype (WT), BRAF -/-, or CRAF -/- mice were irradiated (6 Gy) and DNA damage was assessed using γh2ax staining. Representative images of gh2ax foci in irradiated cells for n=6 fields per group, for two independent experiments. Scale bar = 5 µm. (b) Expression of CRAF and BRAF were silenced using sirna in HCT-116, additional sirna than those in Figure 1b were used, cells were irradiated (2 Gy) and cell survival measured using clonogenic survival assay. Graph shows mean surviving fraction ± SEM. * indicates significant P<0.05 from 2-sided t-test comparing si-craf to si-braf or si-ctrl with n=3 wells per group. Data shown is representative of two different sirnas per target, for two independent experiments. (c) Expression of CRAF and BRAF were silenced using sirna in PANC-1 cells, irradiated and DNA damage was assessed using neutral comet assay. Graph shows mean comet tail length ± SEM. * indicates significant P< from 2-sided t-test comparing WT and si-craf with n=100+ cells per group. Immunoblot to verify sirna knockdown of indicated proteins. Data shown is representative of two different sirnas per target, for two independent experiments.
2 Supplementary Figure 2: Pharmacologic inhibition of MEK does not result in radiosensitization. (a) Cultured HCT-116 cells were exposed to 6 Gy and then immunoblotted to assess levels of phospho- MEK. Data shown is representative of two independent experiments, and was repeated in three different cell lines. (b) HCT-116 cells were treated with MEK inhibitors U0126 or PD03259, exposed to 6 Gy, and then DNA double strand breaks were measured using the comet tail assay. Graph shows mean comet tail length ± SEM for n=100+ cells per group. Immunoblot to p-erk to confirm MEK inhibition. Data shown is representative of two independent experiments.

3 Supplementary Figure 3: DNA damage results in accumulation of ps338 CRAF. (a) Immunoblotting for CRAF ps338 in irradiated PANC-1 cells. Data shown is representative of two independent experiments in two different cell lines. (b) Cultured HCT-116 and U87 cells were treated with increasing concentrations of etoposide and confocal analysis to assess levels of CRAF ps338 (green). Nuclei counterstained with DAPI (blue). Graphs show mean area fraction of CRAF ps338 per cell. Data shown is representative of two independent experiments with n=5 fields per group.
. Scale bar = 10 µm. Data shown is representative of n=5 fields per group for two independent experiments.")
4 Supplementary Figure 4: KG5 inhibits ps338 CRAF and radiosensitizes PANC-1 cells. (a) Immunostaining for CRAF ps338 (green) in PANC-1 cells treated with KG5 (1 µm) overnight then irradiated (6 Gy). Nuclei were counterstained with DAPI (blue). Scale bar = 10 µm. Data shown is representative of n=5 fields per group for two independent experiments. (b) KG5 reduced surviving fraction (clonogenic survival assay, P=0.004, n=3 wells per group), DNA double strand breaks (comet tail assay, P<0.0001, n=100+ cells per group), and DNA damage (mean γh2ax foci per cell, P=0.02, n=6 fields per group). Graphs show mean ± SEM, *P < 0.05 vs. using 2-sided t-test comparing vehicle control and KG5. Data shown is representative of two independent experiments.

5 Supplementary Figure 5: S338D CRAF radioprotects compared to parental or WT CRAF expressing HCT-116 cells. Non-transfected parental cells or stable expressing WT and S338D CRAF cells were irradiated and DNA damage measured by neutral comet assay. Comet tail following radiation for each cell line was normalized to non-irradiated cells, for n=100+ cells per group. Data is plotted mean comet tail length, representative of two independent experiments.
 or the CRAF kinase-dead, phospho-mimetic double mutant (S338D/K375M).")
6 Supplementary Figure 6: S338D/K375M double CRAF mutant acts as a dominant negative. U87 cells were transfected to express FLAG-tagged wildtype CRAF (WT) or the CRAF kinase-dead, phospho-mimetic double mutant (S338D/K375M). (a) Cells were exposed to 6 Gy radiation and lysates were immunoblotted for phospho-mek, total MEK, and FLAG. Data shown is representative of two independent experiments. (b) Cells were exposed to 2 Gy radiation and DNA damage was assessed by clonogenic survival assay. Graph shows mean ± SEM for n=3 wells per group. Data shown is representative of two independent experiments.
. DNA damage was assessed using γh2ax staining.")
7 Supplementary Figure 7: CRAF -/- MEFs are radioprotected by S338D but not S338A or K375M CRAF expression. CRAF -/- MEFs were transfected with GFP tagged S338A or S338D CRAF for 72 hrs and then irradiated (6 Gy). DNA damage was assessed using γh2ax staining. Representative images of 50+ cells per field for γh2ax foci in irradiated cells. GFP tagged CRAF mutant expression (green), γh2ax staining (red) and nuclei stained with DAPI (blue). Scale bar = 20 µm. Data shown is representative of three independent experiments.

8 TaqMan probes p53 Hs _m1 TREX1 Hs _s1 NBN Hs _m1 MRE11A Hs _m1 RAD51 Hs _m1 RAD50 Hs _m1 CHEK2 Hs _m1 HUS1 Hs _m1 ATM Hs _m1 BRCA1 Hs _m1 BRCA2 Hs _m1 ATR Hs _m1 RAD17 Hs _m1 POLK Hs _m1 GAPDH Hs _g1 Supplementary Figure 8: DNA damage response following IR in WT or phospho-mimetic S338 expressing cells U87 human glioblastoma cells were transfected to express wildtype CRAF (WT) or the CRAF kinase-dead, phospho-mimetic double mutant (S338D/K375M). RNA was extracted and processed for an RT-PCR panel of genes associated with DNA damage. Changes in expression for the top 14 candidates were validated by individual RT-PCR reactions using the TaqMan probes listed (Applied Biosystems). The bar graph shows the fold-change in mrna expression levels between U87 cells expressing WT CRAF vs. the S338D/K375M double mutant.
. Lysates were immunoprecipitated for FLAG and blotted for CHK2 and FLAG.")
9 Supplementary Figure 9: Phospho-mimetic S338 CRAF has increased association with CHK2 U87 cells were transfected to express FLAG-tagged wildtype CRAF (WT) or the CRAF kinase-dead, phospho-mimetic double mutant (S338D/K375M). Lysates were immunoprecipitated for FLAG and blotted for CHK2 and FLAG. Data shown is representative of two independent experiments.


10 Supplementary Figure 10: Uncropped blots

11 Supplementary Figure 10: Uncropped blots (continued)

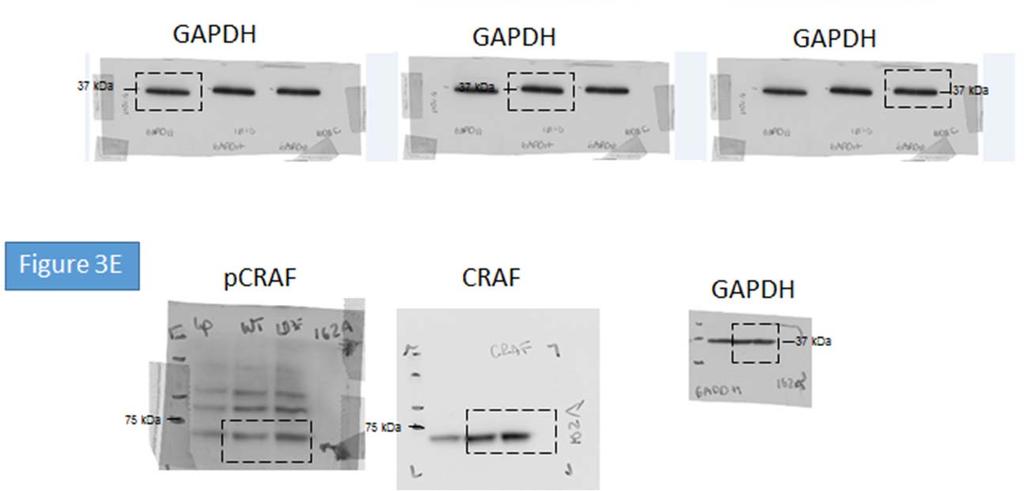
12 Supplementary Figure 10: Uncropped blots (continued)

13 Supplementary Figure 10: Uncropped blots (continued)
14 Supplementary Table 1: Antibodies for immunostaining, blotting, or immunoprecipitation Primary Antibody Vendor Catalog # Dilution H2AX (ps139) Abcam :1000 FLAG Sigma-Aldrich F9291 1:1000 CRAF (pser338) Santa Cruz Biotechnology :500 MEK (pser217/221) Cell Signaling :1000 CRAF (pser301) Abcam :1000 CRAF (pser259) Assay Biotech A7206 1:1000 BRAF (pthr599) Bioss Antibodies BS-12557R 1:1000 CHK2 (pthr68) Cell Signaling :500 CHK1 (pser345) Cell Signaling :500 CRAF BD Transduction Labs :1000 MEK1 Santa Cruz Biotechnology :5000 CHK2 Cell Signaling :1000 CHK1 Cell Signaling :1000 PAK1 Cell Signaling :1000 PAK2 Cell Signaling :1000 PAK4 Cell Signaling :1000 PAK1/2/3 (ps141) Invitrogen 44940G 1:1000 HSP90 Santa Cruz Biotechnology :10000 GAPDH Cell Signaling :10000 Secondary Antibodies Vendor Catalog # Dilution Goat Anti-Mouse IgG light chain Jackson ImmunoResearch :1000 Goat Anti-Rabbit HRP BioRad :5000 Goat Anti-Mouse HRP BioRad :5000 Nuclear Markers Vendor Catalog # Dilution TOPRO3 Invitrogen T3605 1:5000 DAPI Santa Cruz Biotechnology :5000
(a) Significant biological processes (upper panel) and disease biomarkers (lower panel)
 Significant biological processes (upper panel) and disease biomarkers (lower panel)") Supplementary Figure 1. Functional enrichment analyses of secretomic proteins. (a) Significant biological processes (upper panel) and disease biomarkers (lower panel) 2 involved by hrab37-mediated secretory
Supplementary Figure 1. Functional enrichment analyses of secretomic proteins. (a) Significant biological processes (upper panel) and disease biomarkers (lower panel) 2 involved by hrab37-mediated secretory
SUPPLEMENTAL FIGURE LEGENDS
 SUPPLEMENTAL FIGURE LEGENDS Supplemental Figure S1: Endogenous interaction between RNF2 and H2AX: Whole cell extracts from 293T were subjected to immunoprecipitation with anti-rnf2 or anti-γ-h2ax antibodies
Supplementary Figure 1
 Supplementary Figure 1 Supplementary Figure 1. Neither the activation nor suppression of the MAPK pathway affects the ASK1/Vif interaction. (a, b) HEK293 cells were cotransfected with plasmids encoding
SUPPLEMENTARY INFORMATION
 Supplementary Discussion The cell cycle machinery and the DNA damage response network are highly interconnected and co-regulated in assuring faithful duplication and partition of genetic materials into
Nature Structural & Molecular Biology: doi: /nsmb Supplementary Figure 1. Differential expression of mirnas from the pri-mir-17-92a locus.
 Supplementary Figure 1 Differential expression of mirnas from the pri-mir-17-92a locus. (a) The mir-17-92a expression unit in the third intron of the host mir-17hg transcript. (b,c) Impact of knockdown
Supplementary Information Supplementary Fig. 1. Elevated Usp9x in melanoma and NRAS mutant melanoma cells are dependent on NRAS for 3D growth.
 Supplementary Information Supplementary Fig. 1. Elevated Usp9x in melanoma and NRAS mutant melanoma cells are dependent on NRAS for 3D growth. a. Immunoblot for Usp9x protein in NRAS mutant melanoma cells
Supplementary Figure 1
 Supplementary Figure 1 a γ-h2ax MDC1 RNF8 FK2 BRCA1 U2OS Cells sgrna-1 ** 60 sgrna 40 20 0 % positive Cells (>5 foci per cell) b ** 80 sgrna sgrna γ-h2ax MDC1 γ-h2ax RNF8 FK2 MDC1 BRCA1 RNF8 FK2 BRCA1
Supplementary Fig. 1. GPRC5A post-transcriptionally down-regulates EGFR expression. (a) Plot of the changes in steady state mrna levels versus
 Plot of the changes in steady state mrna levels versus") Supplementary Fig. 1. GPRC5A post-transcriptionally down-regulates EGFR expression. (a) Plot of the changes in steady state mrna levels versus changes in corresponding proteins between wild type and Gprc5a-/-
Supplementary Fig. 1. GPRC5A post-transcriptionally down-regulates EGFR expression. (a) Plot of the changes in steady state mrna levels versus changes in corresponding proteins between wild type and Gprc5a-/-
Supplemental Information
 Supplemental Information Tobacco-specific Carcinogen Induces DNA Methyltransferases 1 Accumulation through AKT/GSK3β/βTrCP/hnRNP-U in Mice and Lung Cancer patients Ruo-Kai Lin, 1 Yi-Shuan Hsieh, 2 Pinpin
SUPPLEMENTARY INFORMATION. Supplementary Figures S1-S9. Supplementary Methods
 SUPPLEMENTARY INFORMATION SUMO1 modification of PTEN regulates tumorigenesis by controlling its association with the plasma membrane Jian Huang 1,2#, Jie Yan 1,2#, Jian Zhang 3#, Shiguo Zhu 1, Yanli Wang
Supplemental Figure 1. Western blot analysis indicated that MIF was detected in the fractions of
 Supplemental Figure Legends Supplemental Figure 1. Western blot analysis indicated that was detected in the fractions of plasma membrane and cytosol but not in nuclear fraction isolated from Pkd1 null
Supplementary Figure 1 Role of Raf-1 in TLR2-Dectin-1-mediated cytokine expression
 Supplementary Figure 1 Supplementary Figure 1 Role of Raf-1 in TLR2-Dectin-1-mediated cytokine expression. Quantitative real-time PCR of indicated mrnas in DCs stimulated with TLR2-Dectin-1 agonist zymosan
Supplementary Figure 1.TRIM33 binds β-catenin in the nucleus. a & b, Co-IP of endogenous TRIM33 with β-catenin in HT-29 cells (a) and HEK 293T cells
 and HEK 293T cells") Supplementary Figure 1.TRIM33 binds β-catenin in the nucleus. a & b, Co-IP of endogenous TRIM33 with β-catenin in HT-29 cells (a) and HEK 293T cells (b). TRIM33 was immunoprecipitated, and the amount of
Supplementary Figure 1.TRIM33 binds β-catenin in the nucleus. a & b, Co-IP of endogenous TRIM33 with β-catenin in HT-29 cells (a) and HEK 293T cells (b). TRIM33 was immunoprecipitated, and the amount of
Supplementary Figure 1. The CagA-dependent wound healing or transwell migration of gastric cancer cell. AGS cells transfected with vector control or
 Supplementary Figure 1. The CagA-dependent wound healing or transwell migration of gastric cancer cell. AGS cells transfected with vector control or 3xflag-CagA expression vector were wounded using a pipette
(A) SW480, DLD1, RKO and HCT116 cells were treated with DMSO or XAV939 (5 µm)
 SW480, DLD1, RKO and HCT116 cells were treated with DMSO or XAV939 (5 µm)") Supplementary Figure Legends Figure S1. Tankyrase inhibition suppresses cell proliferation in an axin/β-catenin independent manner. (A) SW480, DLD1, RKO and HCT116 cells were treated with DMSO or XAV939
Supplementary Figure Legends Figure S1. Tankyrase inhibition suppresses cell proliferation in an axin/β-catenin independent manner. (A) SW480, DLD1, RKO and HCT116 cells were treated with DMSO or XAV939
Supplementary Information for. A cancer-associated BRCA2 mutation reveals masked nuclear. export signals controlling localization
 Supplementary Information for A cancer-associated BRCA2 mutation reveals masked nuclear export signals controlling localization Anand D Jeyasekharan 1, Yang Liu 1, Hiroyoshi Hattori 1,3, Venkat Pisupati
Supplementary Table 1. Characterization of HNSCC PDX models established at MSKCC
 Supplementary Table 1. Characterization of HNSCC PDX models established at MSKCC Supplementary Table 2. Drug content and loading efficiency estimated with F-NMR and UV- Vis Supplementary Table 3. Complete
Supplementary Figure 1: Hsp60 / IEC mice are embryonically lethal (A) Light microscopic pictures show mouse embryos at developmental stage E12.
 Light microscopic pictures show mouse embryos at developmental stage E12.") Supplementary Figure 1: Hsp60 / IEC mice are embryonically lethal (A) Light microscopic pictures show mouse embryos at developmental stage E12.5 and E13.5 prepared from uteri of dams and subsequently genotyped.
Supplementary Figure 1: Hsp60 / IEC mice are embryonically lethal (A) Light microscopic pictures show mouse embryos at developmental stage E12.5 and E13.5 prepared from uteri of dams and subsequently genotyped.
(a) Schematic diagram of the FS mutation of UVRAG in exon 8 containing the highly instable
 Schematic diagram of the FS mutation of UVRAG in exon 8 containing the highly instable") Supplementary Figure 1. Frameshift (FS) mutation in UVRAG. (a) Schematic diagram of the FS mutation of UVRAG in exon 8 containing the highly instable A 10 DNA repeat, generating a premature stop codon
Supplementary Figure 1. Frameshift (FS) mutation in UVRAG. (a) Schematic diagram of the FS mutation of UVRAG in exon 8 containing the highly instable A 10 DNA repeat, generating a premature stop codon
TRAF6 ubiquitinates TGFβ type I receptor to promote its cleavage and nuclear translocation in cancer
 Supplementary Information TRAF6 ubiquitinates TGFβ type I receptor to promote its cleavage and nuclear translocation in cancer Yabing Mu, Reshma Sundar, Noopur Thakur, Maria Ekman, Shyam Kumar Gudey, Mariya
hexahistidine tagged GRP78 devoid of the KDEL motif (GRP78-His) on SDS-PAGE. This
 on SDS-PAGE. This") SUPPLEMENTAL FIGURE LEGEND Fig. S1. Generation and characterization of. (A) Coomassie staining of soluble hexahistidine tagged GRP78 devoid of the KDEL motif (GRP78-His) on SDS-PAGE. This protein was expressed
SUPPLEMENTAL FIGURE LEGEND Fig. S1. Generation and characterization of. (A) Coomassie staining of soluble hexahistidine tagged GRP78 devoid of the KDEL motif (GRP78-His) on SDS-PAGE. This protein was expressed
File Name: Supplementary Information Description: Supplementary Figures and Supplementary Tables. File Name: Peer Review File Description:
 File Name: Supplementary Information Description: Supplementary Figures and Supplementary Tables File Name: Peer Review File Description: Primer Name Sequence (5'-3') AT ( C) RT-PCR USP21 F 5'-TTCCCATGGCTCCTTCCACATGAT-3'
Supplementary Figure 1 Induction of cellular senescence and isolation of exosome. a to c, Pre-senescent primary normal human diploid fibroblasts
 Supplementary Figure 1 Induction of cellular senescence and isolation of exosome. a to c, Pre-senescent primary normal human diploid fibroblasts (TIG-3 cells) were rendered senescent by either serial passage
Supplementary Figure 1. Normal T lymphocyte populations in Dapk -/- mice. (a) Normal thymic development in Dapk -/- mice. Thymocytes from WT and Dapk
 Normal thymic development in Dapk -/- mice. Thymocytes from WT and Dapk") Supplementary Figure 1. Normal T lymphocyte populations in Dapk -/- mice. (a) Normal thymic development in Dapk -/- mice. Thymocytes from WT and Dapk -/- mice were stained for expression of CD4 and CD8.
Supplementary Figure 1. Normal T lymphocyte populations in Dapk -/- mice. (a) Normal thymic development in Dapk -/- mice. Thymocytes from WT and Dapk -/- mice were stained for expression of CD4 and CD8.
GPR120 *** * * Liver BAT iwat ewat mwat Ileum Colon. UCP1 mrna ***
 a GPR120 GPR120 mrna/ppia mrna Arbitrary Units 150 100 50 Liver BAT iwat ewat mwat Ileum Colon b UCP1 mrna Fold induction 20 15 10 5 - camp camp SB202190 - - - H89 - - - - - GW7647 Supplementary Figure
SUPPLEMENTARY INFORMATION
 SUPPLEMENTARY INFORMATION doi:10.1038/nature11429 S1a 6 7 8 9 Nlrc4 allele S1b Nlrc4 +/+ Nlrc4 +/F Nlrc4 F/F 9 Targeting construct 422 bp 273 bp FRT-neo-gb-PGK-FRT 3x.STOP S1c Nlrc4 +/+ Nlrc4 F/F casp1
SUPPLEMENTARY INFORMATION
 DOI:.38/ncb2822 a MTC02 FAO cells EEA1 b +/+ MEFs /DAPI -/- MEFs /DAPI -/- MEFs //DAPI c HEK 293 cells WCE N M C P AKT TBC1D7 Lamin A/C EEA1 VDAC d HeLa cells WCE N M C P AKT Lamin A/C EEA1 VDAC Figure
Tumor suppressor Spred2 interaction with LC3 promotes autophagosome maturation and induces autophagy-dependent cell death
 www.impactjournals.com/oncotarget/ Oncotarget, Supplementary Materials 2016 Tumor suppressor Spred2 interaction with LC3 promotes autophagosome maturation and induces autophagy-dependent cell death Supplementary
Boucher et al NCOMMS B
 1 Supplementary Figure 1 (linked to Figure 1). mvegfr1 constitutively internalizes in endothelial cells. (a) Immunoblot of mflt1 from undifferentiated mouse embryonic stem (ES) cells with indicated genotypes;
Supplementary Figure 1. mir124 does not change neuron morphology and synaptic
 Supplementary Figure 1. mir124 does not change neuron morphology and synaptic density. Hippocampal neurons were transfected with mir124 (containing DsRed) or DsRed as a control. 2 d after transfection,
Supplementary Figure 1. A. Bar graph representing the expression levels of the 19 indicated genes in the microarrays analyses comparing human lung
 Supplementary Figure 1. A. Bar graph representing the expression levels of the 19 indicated genes in the microarrays analyses comparing human lung immortalized broncho-epithelial cells (AALE cells) expressing
condition. Left panel, the HCT-116 cells were lysed with RIPA buffer containing 0.1%
 FIGURE LEGENDS Supplementary Fig 1 (A) sumoylation pattern detected under denaturing condition. Left panel, the HCT-116 cells were lysed with RIPA buffer containing 0.1% SDS in the presence and absence
Supplementary Data Cyclophilin B Supports Myc and Mutant p53 Dependent Survival of Glioblastoma Multiforme Cells
 Supplementary Data Cyclophilin B Supports Myc and Mutant p53 Dependent Survival of Glioblastoma Multiforme Cells Jae Won Choi, Mark A. Schroeder, Jann N. Sarkaria, and Richard J. Bram 1 Figure S1. Pharmacological
c Ischemia (30 min) Reperfusion (8 w) Supplementary Figure bp 300 bp Ischemia (30 min) Reperfusion (4 h) Dox 20 mg/kg i.p.
 Reperfusion (8 w) Supplementary Figure bp 300 bp Ischemia (30 min) Reperfusion (4 h) Dox 20 mg/kg i.p.") a Marker Ripk3 +/ 5 bp 3 bp b Ischemia (3 min) Reperfusion (4 h) d 2 mg/kg i.p. 1 w 5 w Sacrifice for IF size A subset for echocardiography and morphological analysis c Ischemia (3 min) Reperfusion (8
a Marker Ripk3 +/ 5 bp 3 bp b Ischemia (3 min) Reperfusion (4 h) d 2 mg/kg i.p. 1 w 5 w Sacrifice for IF size A subset for echocardiography and morphological analysis c Ischemia (3 min) Reperfusion (8
Supplementary Figure 1. Confocal immunofluorescence showing mitochondrial translocation of Drp1. Cardiomyocytes treated with H 2 O 2 were prestained
 Supplementary Figure 1. Confocal immunofluorescence showing mitochondrial translocation of Drp1. Cardiomyocytes treated with H 2 O 2 were prestained with MitoTracker (red), then were immunostained with
SUPPLEMENTARY FIGURES AND TABLE
 SUPPLEMENTARY FIGURES AND TABLE Supplementary Figure S1: Characterization of IRE1α mutants. A. U87-LUC cells were transduced with the lentiviral vector containing the GFP sequence (U87-LUC Tet-ON GFP).
SUPPLEMENTARY FIGURES
 SUPPLEMENTARY FIGURES Supplementary Figure 1. (A) Left, western blot analysis of ISGylated proteins in Jurkat T cells treated with 1000U ml -1 IFN for 16h (IFN) or left untreated (CONT); right, western
SUPPLEMENTARY FIGURES
 SUPPLEMENTARY FIGURES Figure S1. Clinical significance of ZNF322A overexpression in Caucasian lung cancer patients. (A) Representative immunohistochemistry images of ZNF322A protein expression in tissue
Supplementary Figure S1: Defective heterochromatin repair in HGPS progeroid cells
 Supplementary Figure S1: Defective heterochromatin repair in HGPS progeroid cells Immunofluorescence staining of H3K9me3 and 53BP1 in PH and HGADFN003 (HG003) cells at 24 h after γ-irradiation. Scale bar,
Supplementary Figure 1
 Supplementary Figure 1 Dox Cis Cam Pac 0 15 1 15 1 15 1 15 1 15 µmole/l Ub p53 Cytotoxic anticancer agents increase p53 levels but do not generally promote the accumulation of ubiquitinated. Western blots
Reason for Dissection. Pleomorphic adenoma. Tongue base adenocarcinoma
 Supplementary Table S1 Human Patients Patient Sample No. Gender Age Additional Medication Treatment 1 Reason for Dissection Total Irradiation Dose Estimated Irradiation Dose to SG Gland Time of Resection
Peli1 negatively regulates T-cell activation and prevents autoimmunity
 Peli1 negatively regulates T-cell activation and prevents autoimmunity Mikyoung Chang 1,*, Wei Jin 1,5,*, Jae-Hoon Chang 1, Yi-chuan Xiao 1, George Brittain 1, Jiayi Yu 1, Xiaofei Zhou 1, Yi-Hong Wang
Predictive PP1Ca binding region in BIG3 : 1,228 1,232aa (-KAVSF-) HEK293T cells *** *** *** KPL-3C cells - E E2 treatment time (h)
 HEK293T cells *** *** *** KPL-3C cells - E E2 treatment time (h)") Relative expression ERE-luciferase activity activity (pmole/min) activity (pmole/min) activity (pmole/min) activity (pmole/min) MCF-7 KPL-3C ZR--1 BT-474 T47D HCC15 KPL-1 HBC4 activity (pmole/min) a d
Relative expression ERE-luciferase activity activity (pmole/min) activity (pmole/min) activity (pmole/min) activity (pmole/min) MCF-7 KPL-3C ZR--1 BT-474 T47D HCC15 KPL-1 HBC4 activity (pmole/min) a d
Supplementary fig. 1. Crystals induce necroptosis does not involve caspases, TNF receptor or NLRP3. A. Mouse tubular epithelial cells were pretreated
 Supplementary fig. 1. Crystals induce necroptosis does not involve caspases, TNF receptor or NLRP3. A. Mouse tubular epithelial cells were pretreated with zvad-fmk (10µM) and exposed to calcium oxalate
Supplementary Figure 1 IMQ-Induced Mouse Model of Psoriasis. IMQ cream was
 Supplementary Figure 1 IMQ-Induced Mouse Model of Psoriasis. IMQ cream was painted on the shaved back skin of CBL/J and BALB/c mice for consecutive days. (a, b) Phenotypic presentation of mouse back skin
SUPPLEMENTARY FIGURE LEGENDS
 SUPPLEMENTARY FIGURE LEGENDS Supplementary Figure 1. Hippocampal sections from new-born Pten+/+ and PtenFV/FV pups were stained with haematoxylin and eosin (H&E) and were imaged at (a) low and (b) high
Supplemental Materials. STK16 regulates actin dynamics to control Golgi organization and cell cycle
 Supplemental Materials STK16 regulates actin dynamics to control Golgi organization and cell cycle Juanjuan Liu 1,2,3, Xingxing Yang 1,3, Binhua Li 1, Junjun Wang 1,2, Wenchao Wang 1, Jing Liu 1, Qingsong
SUPPLEMENTARY INFORMATION
 DOI: 1.138/ncb222 / b. WB anti- WB anti- ulin Mitotic index (%) 14 1 6 2 T (h) 32 48-1 1 2 3 4 6-1 4 16 22 28 3 33 e. 6 4 2 Time (min) 1-6- 11-1 > 1 % cells Figure S1 depletion leads to mitotic defects
Supplement Figure S1. Real Time PCR analysis of mrna levels of C/EBPα and PU.1 in wild type (WT) and NQO1-null (NQO1-/-) mice.
 and NQO1-null (NQO1-/-) mice.") competes with 20S proteasome for binding with C/EBP leading to its stabilization and Relative mrna levels Supplement Figure S1. Real Time PCR analysis of mrna levels of C/EBPα and PU.1 in wild type (WT)
competes with 20S proteasome for binding with C/EBP leading to its stabilization and Relative mrna levels Supplement Figure S1. Real Time PCR analysis of mrna levels of C/EBPα and PU.1 in wild type (WT)
Supplementary Figure 1. PD-L1 is glycosylated in cancer cells. (a) Western blot analysis of PD-L1 in breast cancer cells. (b) Western blot analysis
 Western blot analysis of PD-L1 in breast cancer cells. (b) Western blot analysis") Supplementary Figure 1. PD-L1 is glycosylated in cancer cells. (a) Western blot analysis of PD-L1 in breast cancer cells. (b) Western blot analysis of PD-L1 in ovarian cancer cells. (c) Western blot analysis
Supplementary Figure 1. PD-L1 is glycosylated in cancer cells. (a) Western blot analysis of PD-L1 in breast cancer cells. (b) Western blot analysis of PD-L1 in ovarian cancer cells. (c) Western blot analysis
SUPPLEMENTARY LEGENDS...
 TABLE OF CONTENTS SUPPLEMENTARY LEGENDS... 2 11 MOVIE S1... 2 FIGURE S1 LEGEND... 3 FIGURE S2 LEGEND... 4 FIGURE S3 LEGEND... 5 FIGURE S4 LEGEND... 6 FIGURE S5 LEGEND... 7 FIGURE S6 LEGEND... 8 FIGURE
SUPPLEMENTARY INFORMATION
 DOI: 10.1038/ncb2566 Figure S1 CDKL5 protein expression pattern and localization in mouse brain. (a) Multiple-tissue western blot from a postnatal day (P) 21 mouse probed with an antibody against CDKL5.
marker. DAPI labels nuclei. Flies were 20 days old. Scale bar is 5 µm. Ctrl is
 Supplementary Figure 1. (a) Nos is detected in glial cells in both control and GFAP R79H transgenic flies (arrows), but not in deletion mutant Nos Δ15 animals. Repo is a glial cell marker. DAPI labels
SUPPLEMENTARY INFORMATION
 doi:10.1038/nature12652 Supplementary Figure 1. PRDM16 interacts with endogenous EHMT1 in brown adipocytes. Immunoprecipitation of PRDM16 complex by flag antibody (M2) followed by Western blot analysis
SUPPLEMENTARY INFORMATION
 DOI: 10.1038/ncb2607 Figure S1 Elf5 loss promotes EMT in mammary epithelium while Elf5 overexpression inhibits TGFβ induced EMT. (a, c) Different confocal slices through the Z stack image. (b, d) 3D rendering
a b G75 G60 Sw-2 Sw-1 Supplementary Figure 1. Structure predictions by I-TASSER Server.
 a b G75 2 2 G60 Sw-2 Sw-1 Supplementary Figure 1. Structure predictions by I-TASSER Server. a. Overlay of top 10 models generated by I-TASSER illustrates the potential effect of 7 amino acid insertion
Supplementary data Supplementary Figure 1 Supplementary Figure 2
 Supplementary data Supplementary Figure 1 SPHK1 sirna increases RANKL-induced osteoclastogenesis in RAW264.7 cell culture. (A) RAW264.7 cells were transfected with oligocassettes containing SPHK1 sirna
Legends for Supplemental Figures.
 1 Legends for Supplemental Figures. Supplemental Figure 1. Proteasome Inhibition does not abrogate the expression of FA core complex proteins or formation of the FA core complex. (Full-length blots are
Supplementary Table 1. The primers used for quantitative RT-PCR. Gene name Forward (5 > 3 ) Reverse (5 > 3 )
 Reverse (5 > 3 )") 770 771 Supplementary Table 1. The primers used for quantitative RT-PCR. Gene name Forward (5 > 3 ) Reverse (5 > 3 ) Human CXCL1 GCGCCCAAACCGAAGTCATA ATGGGGGATGCAGGATTGAG PF4 CCCCACTGCCCAACTGATAG TTCTTGTACAGCGGGGCTTG
770 771 Supplementary Table 1. The primers used for quantitative RT-PCR. Gene name Forward (5 > 3 ) Reverse (5 > 3 ) Human CXCL1 GCGCCCAAACCGAAGTCATA ATGGGGGATGCAGGATTGAG PF4 CCCCACTGCCCAACTGATAG TTCTTGTACAGCGGGGCTTG
Supplementary Figure S1 Supplementary Figure S2
 Supplementary Figure S A) The blots shown in Figure B were qualified by using Gel-Pro analyzer software (Rockville, MD, USA). The ratio of LC3II/LC3I to actin was then calculated. The data are represented
Supplementary Information Titles Journal: Nature Medicine
 Supplementary Information Titles Journal: Nature Medicine Article Title: Corresponding Author: Supplementary Item & Number Supplementary Fig.1 Fig.2 Fig.3 Fig.4 Fig.5 Fig.6 Fig.7 Fig.8 Fig.9 Fig. Fig.11
Effects of UBL5 knockdown on cell cycle distribution and sister chromatid cohesion
 Supplementary Figure S1. Effects of UBL5 knockdown on cell cycle distribution and sister chromatid cohesion A. Representative examples of flow cytometry profiles of HeLa cells transfected with indicated
Supplementary Materials
 Supplementary Materials Supplementary Figure S1 Regulation of Ubl4A stability by its assembly partner A, The translation rate of Ubl4A is not affected in the absence of Bag6. Control, Bag6 and Ubl4A CRISPR
A dual PI3 kinase/mtor inhibitor reveals emergent efficacy in glioma
 Supplemental data A dual PI3 kinase/mtor inhibitor reveals emergent efficacy in glioma Qi-Wen Fan, Zachary A. Knight, David D. Goldenberg, Wei Yu, Keith E. Mostov, David Stokoe, Kevan M. Shokat, and William
Supplementary information
 Supplementary information Human Cytomegalovirus MicroRNA mir-us4-1 Inhibits CD8 + T Cell Response by Targeting ERAP1 Sungchul Kim, Sanghyun Lee, Jinwook Shin, Youngkyun Kim, Irini Evnouchidou, Donghyun
Supplemental Information. Increased 4E-BP1 Expression Protects. against Diet-Induced Obesity and Insulin. Resistance in Male Mice
 Cell Reports, Volume 16 Supplemental Information Increased 4E-BP1 Expression Protects against Diet-Induced Obesity and Insulin Resistance in Male Mice Shih-Yin Tsai, Ariana A. Rodriguez, Somasish G. Dastidar,
Intracellular MHC class II molecules promote TLR-triggered innate. immune responses by maintaining Btk activation
 Intracellular MHC class II molecules promote TLR-triggered innate immune responses by maintaining Btk activation Xingguang Liu, Zhenzhen Zhan, Dong Li, Li Xu, Feng Ma, Peng Zhang, Hangping Yao and Xuetao
Supplementary Figure 1. HOPX is hypermethylated in NPC. (a) Methylation levels of HOPX in Normal (n = 24) and NPC (n = 24) tissues from the
 Methylation levels of HOPX in Normal (n = 24) and NPC (n = 24) tissues from the") Supplementary Figure 1. HOPX is hypermethylated in NPC. (a) Methylation levels of HOPX in Normal (n = 24) and NPC (n = 24) tissues from the genome-wide methylation microarray data. Mean ± s.d.; Student
Supplementary Figure 1. HOPX is hypermethylated in NPC. (a) Methylation levels of HOPX in Normal (n = 24) and NPC (n = 24) tissues from the genome-wide methylation microarray data. Mean ± s.d.; Student
supplementary information
 DOI: 10.1038/ncb2153 Figure S1 Ectopic expression of HAUSP up-regulates REST protein. (a) Immunoblotting showed that ectopic expression of HAUSP increased REST protein levels in ENStemA NPCs. (b) Immunofluorescent
p = formed with HCI-001 p = Relative # of blood vessels that formed with HCI-002 Control Bevacizumab + 17AAG Bevacizumab 17AAG
 A.. Relative # of ECs associated with HCI-001 1.4 1.2 1.0 0.8 0.6 0.4 0.2 0.0 ol b p < 0.001 Relative # of blood vessels that formed with HCI-001 1.4 1.2 1.0 0.8 0.6 0.4 0.2 0.0 l b p = 0.002 Control IHC:
Figure S1. Reduction in glomerular mir-146a levels correlate with progression to higher albuminuria in diabetic patients.
 Supplementary Materials Supplementary Figures Figure S1. Reduction in glomerular mir-146a levels correlate with progression to higher albuminuria in diabetic patients. Figure S2. Expression level of podocyte
Supplementary Figure 1 Cell line TRIB2 status. Supplementary Figure 2 TRIB2 status has no impact on the cell cycle after PI3K inhibition. a. b.
 Supplementary Figure 1 Cell line TRIB2 status. TRIB2 protein expression to determine endogenous expression and to determine the effectiveness of each of our TRIB2 knockdown constructs. Supplementary Figure
Supplementary Figure 1: Characterisation of phospho-fgfr-y463 antibody. (A)
") Supplementary Figure 1: Characterisation of phospho-fgfr-y463 antibody. (A) Cells over-expressing hfgfr1-pcdna3 (+) or pcdna3 (-) were stimulated for 10 minutes with 50ng/ml FGF2 and lysates immunoblotted
Supplementary Figure 1: Characterisation of phospho-fgfr-y463 antibody. (A) Cells over-expressing hfgfr1-pcdna3 (+) or pcdna3 (-) were stimulated for 10 minutes with 50ng/ml FGF2 and lysates immunoblotted
SUPPLEMENTARY INFORMATION
 Figure S1 Treatment with both Sema6D and Plexin-A1 sirnas induces the phenotype essentially identical to that induced by treatment with Sema6D sirna alone or Plexin-A1 sirna alone. (a,b) The cardiac tube
Supplementary Figures
 Supplementary Figures Supplementary Figure 1 Characterization of stable expression of GlucB and sshbira in the CT26 cell line (a) Live cell imaging of stable CT26 cells expressing green fluorescent protein
Nature Structural and Molecular Biology: doi: /nsmb Supplementary Figure 1
 Supplementary Figure 1 Mutational analysis of the SA2-Scc1 interaction in vitro and in human cells. (a) Autoradiograph (top) and Coomassie stained gel (bottom) of 35 S-labeled Myc-SA2 proteins (input)
SUPPLEMENTARY INFORMATION
 Supplementary Figures Supplementary Figure S1. Binding of full-length OGT and deletion mutants to PIP strips (Echelon Biosciences). Supplementary Figure S2. Binding of the OGT (919-1036) fragments with
Dynamic Interaction of Stress Granule, DDX3X and IKK-α Mediates Multiple Functions in
 Dynamic Interaction of Stress Granule, and Mediates Multiple Functions in Hepatitis C Virus Infection Véronique Pène, Qisheng Li#, Catherine Sodroski, Ching-Sheng Hsu, T. Jake Liang# Liver Diseases Branch,
2.5. AMPK activity
 Supplement Fig. A 3 B phos-ampk 2.5 * Control AICAR AMPK AMPK activity (Absorbance at 45 nm) 2.5.5 Control AICAR Supplement Fig. Effects of AICAR on AMPK activation in macrophages. J774. macrophages were
Supplementary Figure 1. Spatial distribution of LRP5 and β-catenin in intact cardiomyocytes. (a) and (b) Immunofluorescence staining of endogenous
 and (b) Immunofluorescence staining of endogenous") Supplementary Figure 1. Spatial distribution of LRP5 and β-catenin in intact cardiomyocytes. (a) and (b) Immunofluorescence staining of endogenous LRP5 in intact adult mouse ventricular myocytes (AMVMs)
Supplementary Figure 1. Spatial distribution of LRP5 and β-catenin in intact cardiomyocytes. (a) and (b) Immunofluorescence staining of endogenous LRP5 in intact adult mouse ventricular myocytes (AMVMs)
A Hepatocyte Growth Factor Receptor (Met) Insulin Receptor hybrid governs hepatic glucose metabolism SUPPLEMENTARY FIGURES, LEGENDS AND METHODS
 Insulin Receptor hybrid governs hepatic glucose metabolism SUPPLEMENTARY FIGURES, LEGENDS AND METHODS") A Hepatocyte Growth Factor Receptor (Met) Insulin Receptor hybrid governs hepatic glucose metabolism Arlee Fafalios, Jihong Ma, Xinping Tan, John Stoops, Jianhua Luo, Marie C. DeFrances and Reza Zarnegar
A Hepatocyte Growth Factor Receptor (Met) Insulin Receptor hybrid governs hepatic glucose metabolism Arlee Fafalios, Jihong Ma, Xinping Tan, John Stoops, Jianhua Luo, Marie C. DeFrances and Reza Zarnegar
Supplementary Figure 1. Characterization of NMuMG-ErbB2 and NIC breast cancer cells expressing shrnas targeting LPP. NMuMG-ErbB2 cells (a) and NIC
 and NIC") Supplementary Figure 1. Characterization of NMuMG-ErbB2 and NIC breast cancer cells expressing shrnas targeting LPP. NMuMG-ErbB2 cells (a) and NIC cells (b) were engineered to stably express either a LucA-shRNA
Supplementary Figure 1. Characterization of NMuMG-ErbB2 and NIC breast cancer cells expressing shrnas targeting LPP. NMuMG-ErbB2 cells (a) and NIC cells (b) were engineered to stably express either a LucA-shRNA
PKCζ Promotes Breast Cancer Invasion by Regulating Expression of E-cadherin and Zonula Occludens-1 (ZO-1) via NFκB-p65
 via NFκB-p65") SUPPLEMENTARY INFORMATION TITLE: PKCζ Promotes Breast Cancer Invasion by Regulating Expression of E-cadherin and Zonula Occludens-1 (ZO-1) via NFκB-p65 RUNNING TITLE: PKCζ-NFκB Signaling in Breast Cancer
SUPPLEMENTARY INFORMATION TITLE: PKCζ Promotes Breast Cancer Invasion by Regulating Expression of E-cadherin and Zonula Occludens-1 (ZO-1) via NFκB-p65 RUNNING TITLE: PKCζ-NFκB Signaling in Breast Cancer
Fang et al. NMuMG. PyVmT unstained Anti-CCR2-PE MDA-MB MCF MCF10A
 A NMuMG PyVmT 16.5+.5 47.+7.2 Fang et al. unstained Anti-CCR2-PE 4T1 Control 37.6+6.3 56.1+.65 MCF1A 16.1+3. MCF-7 3.1+5.4 MDA-M-231 42.1+5.5 unstained Secondary antibody only Anti-CCR2 SUPPLEMENTAL FIGURE
RAW264.7 cells stably expressing control shrna (Con) or GSK3b-specific shrna (sh-
 or GSK3b-specific shrna (sh-") 1 a b Supplementary Figure 1. Effects of GSK3b knockdown on poly I:C-induced cytokine production. RAW264.7 cells stably expressing control shrna (Con) or GSK3b-specific shrna (sh- GSK3b) were stimulated
1 a b Supplementary Figure 1. Effects of GSK3b knockdown on poly I:C-induced cytokine production. RAW264.7 cells stably expressing control shrna (Con) or GSK3b-specific shrna (sh- GSK3b) were stimulated
Prolonged mitotic arrest induces a caspase-dependent DNA damage
 SUPPLEMENTARY INFORMATION Prolonged mitotic arrest induces a caspase-dependent DNA damage response at telomeres that determines cell survival Karolina O. Hain, Didier J. Colin, Shubhra Rastogi, Lindsey
SUPPLEMENTARY INFORMATION
 DOI: 10.1038/ncb2988 Supplementary Figure 1 Kif7 L130P encodes a stable protein that does not localize to cilia tips. (a) Immunoblot with KIF7 antibody in cell lysates of wild-type, Kif7 L130P and Kif7
Nature Medicine: doi: /nm.4322
 1 2 3 4 5 6 7 8 9 10 11 Supplementary Figure 1. Predicted RNA structure of 3 UTR and sequence alignment of deleted nucleotides. (a) Predicted RNA secondary structure of ZIKV 3 UTR. The stem-loop structure
(A) RT-PCR for components of the Shh/Gli pathway in normal fetus cell (MRC-5) and a
 RT-PCR for components of the Shh/Gli pathway in normal fetus cell (MRC-5) and a") Supplementary figure legends Supplementary Figure 1. Expression of Shh signaling components in a panel of gastric cancer. (A) RT-PCR for components of the Shh/Gli pathway in normal fetus cell (MRC-5) and
Supplementary figure legends Supplementary Figure 1. Expression of Shh signaling components in a panel of gastric cancer. (A) RT-PCR for components of the Shh/Gli pathway in normal fetus cell (MRC-5) and
hemodynamic stress. A. Echocardiographic quantification of cardiac dimensions and function in
 SUPPLEMENTAL FIGURE LEGENDS Supplemental Figure 1. Fbn1 C1039G/+ hearts display normal cardiac function in the absence of hemodynamic stress. A. Echocardiographic quantification of cardiac dimensions and
Supplementary Material
 Supplementary Material accompanying the manuscript Interleukin 37 is a fundamental inhibitor of innate immunity Marcel F Nold, Claudia A Nold-Petry, Jarod A Zepp, Brent E Palmer, Philip Bufler & Charles
Supplementary Figure 1 Expression of Crb3 in mouse sciatic nerve: biochemical analysis (a) Schematic of Crb3 isoforms, ERLI and CLPI, indicating the
 Schematic of Crb3 isoforms, ERLI and CLPI, indicating the") Supplementary Figure 1 Expression of Crb3 in mouse sciatic nerve: biochemical analysis (a) Schematic of Crb3 isoforms, ERLI and CLPI, indicating the location of the transmembrane (TM), FRM binding (FB)
Supplementary Figure 1 Expression of Crb3 in mouse sciatic nerve: biochemical analysis (a) Schematic of Crb3 isoforms, ERLI and CLPI, indicating the location of the transmembrane (TM), FRM binding (FB)
") Supplementary Figure 1 (Mu) SBP (mmhg) 2 18 16 p
Supplementary Figure 1 (Mu) SBP (mmhg) 2 18 16 p SUPPLEMENTARY INFORMATION
 Supplementary Figure 1. Behavioural effects of ketamine in non-stressed and stressed mice. Naive C57BL/6 adult male mice (n=10/group) were given a single dose of saline vehicle or ketamine (3.0 mg/kg,
Supplementary Figure S1
 Supplementary Figure S1 Supplementary Figure S1. PARP localization patterns using GFP-PARP and PARP-specific antibody libraries GFP-PARP localization in non-fixed (A) and formaldehyde fixed (B) GFP-PARPx
SUPPLEMENTARY FIGURES
 SUPPLEMENTARY FIGURES 1 Supplementary Figure 1, Adult hippocampal QNPs and TAPs uniformly express REST a-b) Confocal images of adult hippocampal mouse sections showing GFAP (green), Sox2 (red), and REST
supplementary information
 DOI: 10.1038/ncb1875 Figure S1 (a) The 79 surgical specimens from NSCLC patients were analysed by immunohistochemistry with an anti-p53 antibody and control serum (data not shown). The normal bronchi served
S1a S1b S1c. S1d. S1f S1g S1h SUPPLEMENTARY FIGURE 1. - si sc Il17rd Il17ra bp. rig/s IL-17RD (ng) -100 IL-17RD
 -100 IL-17RD") SUPPLEMENTARY FIGURE 1 0 20 50 80 100 IL-17RD (ng) S1a S1b S1c IL-17RD β-actin kda S1d - si sc Il17rd Il17ra rig/s15-574 - 458-361 bp S1f S1g S1h S1i S1j Supplementary Figure 1. Knockdown of IL-17RD enhances
SUPPLEMENTARY FIGURE 1 0 20 50 80 100 IL-17RD (ng) S1a S1b S1c IL-17RD β-actin kda S1d - si sc Il17rd Il17ra rig/s15-574 - 458-361 bp S1f S1g S1h S1i S1j Supplementary Figure 1. Knockdown of IL-17RD enhances
Islet viability assay and Glucose Stimulated Insulin Secretion assay RT-PCR and Western Blot
 Islet viability assay and Glucose Stimulated Insulin Secretion assay Islet cell viability was determined by colorimetric (3-(4,5-dimethylthiazol-2-yl)-2,5- diphenyltetrazolium bromide assay using CellTiter
X P. Supplementary Figure 1. Nature Medicine: doi: /nm Nilotinib LSK LT-HSC. Cytoplasm. Cytoplasm. Nucleus. Nucleus
 a b c Supplementary Figure 1 c-kit-apc-eflu780 Lin-FITC Flt3-Linc-Kit-APC-eflu780 LSK Sca-1-PE-Cy7 d e f CD48-APC LT-HSC CD150-PerCP-cy5.5 g h i j Cytoplasm RCC1 X Exp 5 mir 126 SPRED1 SPRED1 RAN P SPRED1