Supplementary Figure 1. IHC and proliferation analysis of pten-deficient mammary tumors
|
|
|
- Peter Hamilton
- 5 years ago
- Views:
Transcription
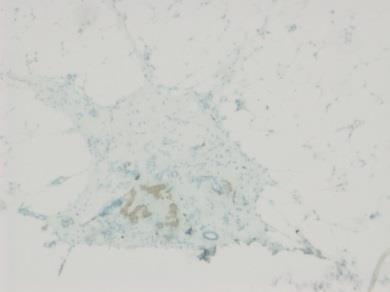
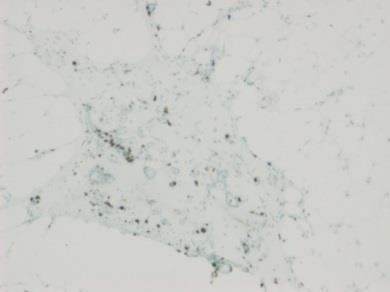
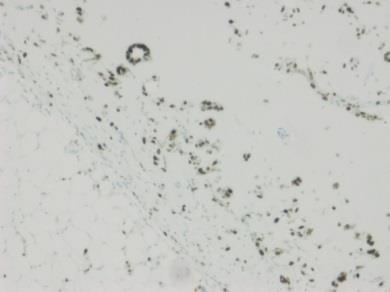
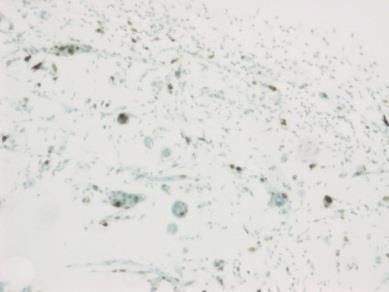
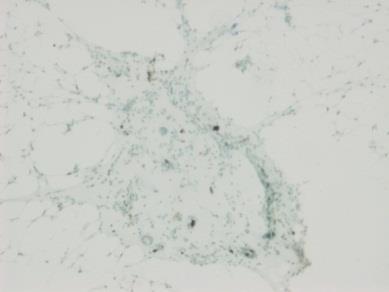
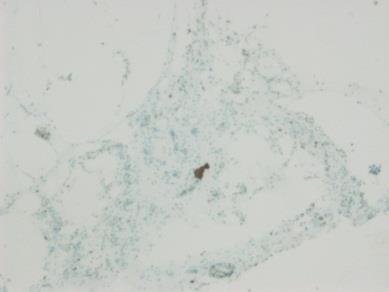
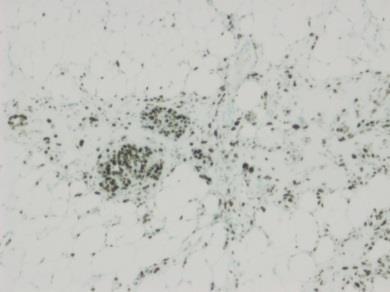
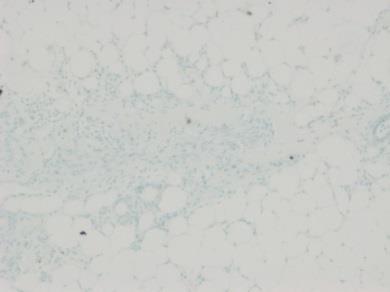
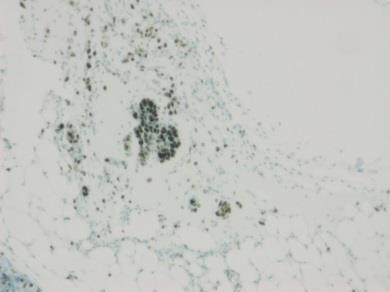
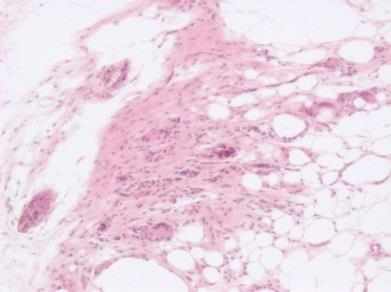
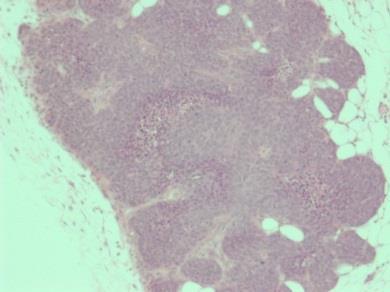
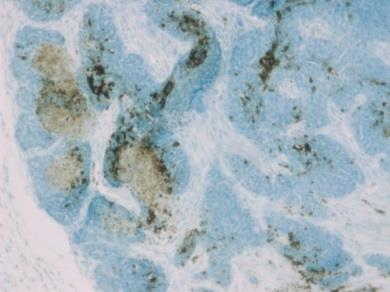
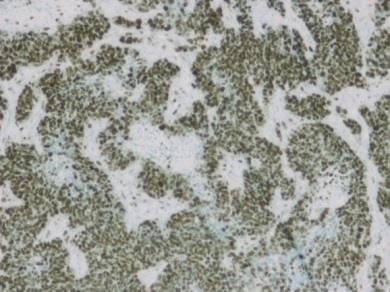
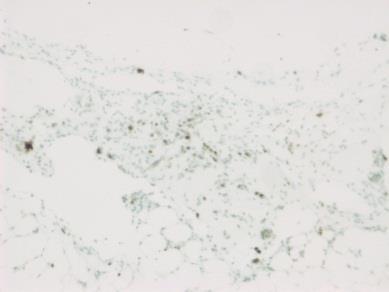
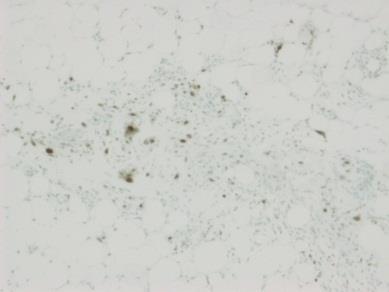
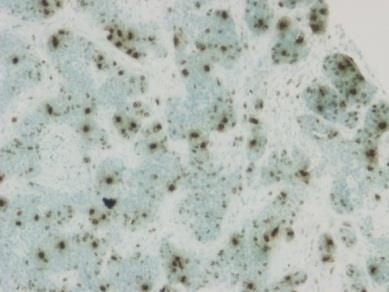
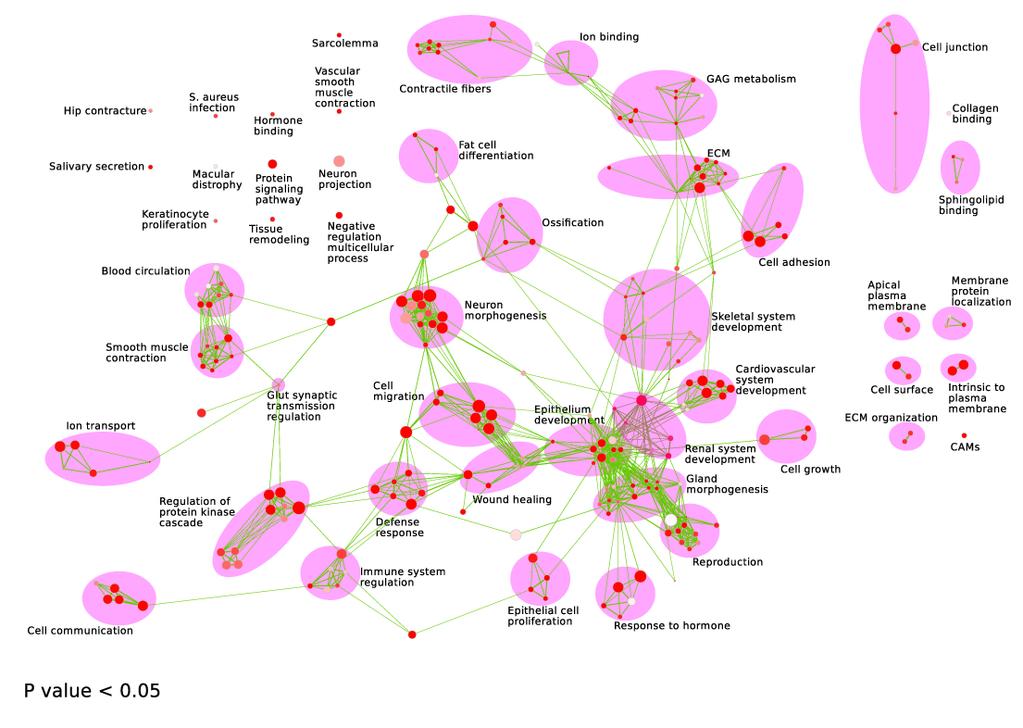
1 Wang et al LEGENDS TO SUPPLEMENTARY INFORMATION Supplementary Figure 1. IHC and proliferation analysis of pten-deficient mammary tumors A. Induced expression of estrogen receptor α (ERα) in AME vs PDA tumors. Student s t test, p=.5, n 3. B. Induced expression of Ki67 in PDAs vs AMEs. Student s t test, p=.31, n 3. C. Enlarged immunohistochemistry images of AMEs and PDAs shown in Figure 1I. N=6. D. In vitro growth curves of independent AME tumor cell lines incubated with indicated concentrations of β-estradiol. Student s t test, *p<.5, **p<.1; ***p<.1, n=2. Supplementary Figure 2. Proliferation and apoptosis analyses of AME and PDA cells following orthotopic transplantation into NOD/SCID mice Shown are representative IHC images of phospho-h3, Ki67 and activated caspase 3 of mammary glands injected with AME or PDA cells at indicated time points. n 3. Supplementary Figure 3. GSEA reveals distinct pathways in PDAs versus AMEs Complete GSEA of AMEs (blue) versus PDAs (red) using canonical pathways (c2.all, v4., Broad Institute) visualized using Cytoscape Enrichment Map. Green lines connect overlapping pathways. Size of the circles corresponds with levels of enrichment (normalized enrichment score) whereas thickness of lines corresponds with degree of overlap. p<.1, FDR<.1. PDA n=8, AME n=13. Supplementary Figure 4. g:profiler analysis of AMEs versus PDAs. p<.5. PDA n=8, AME n=13. 61
2 Wang et al Supplementary Figure 5. acgh analysis showing distinct genetic alterations in PDAs versus AMEs Shown is a list of genes with significant copy number changes in PDAs versus AMEs including chromosomal location and frequency of alterations. PDA n=5, AME n=5. Supplementary Figure 6. Schematic representation of Cul9 (a) and Cbl (b), and relative location (asterisks) of mutations identified in PDAs. PDA n=7, AME n=3. Supplementary Figure 7. Kaplan-Meier survival analysis for patients with mir-145-low/pten-low expression showing a trend toward significantly worse DFS compared to patients with mir-145- high/pten-low expression. Supplementary Figure 8. mir-143/145 knockdown cooperates with pten loss by activating the Ras pathway A. In vitro growth curves of independent AME tumor cell lines transduced with mir-143/145 decoy. n 5. B. Epithelial marker analysis of AME and PDA tumors for ERα, K18 and K14. n 3. C. Representative Western Blot analysis of PTEN knockdown by lentiviral shrna. n 3. D. In vitro growth curves of HC11 cells transduced with mir-143/145 decoy, pten shrna or both. n 3. E. Western blot quantification showing elevated phospho-erk levels in HC11 cells treated with both mir-143/145 decoy and pten shrna compared to cells transduced with only mir- 143/145 decoy, or only pten shrna. n 8. 62
3 Wang et al F. Quantitative RT-PCR analysis of indicated predicted mir-143/145 targets following mir- 143/145 overexpression. n=3. Supplementary Figure 9. Distinct levels of activation of 18 signaling pathways in AMEs vs PDAs * denotes significant differences. Red induction in PDAs; green induction in AMEs. PDA n=8, AME n=13. 63

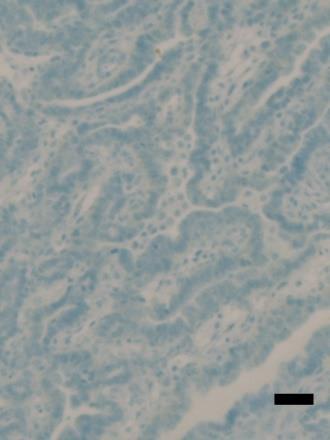

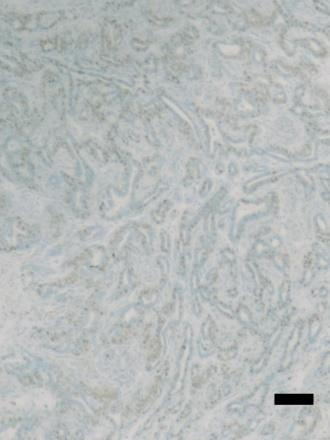
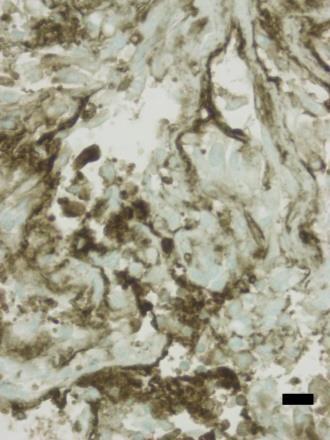
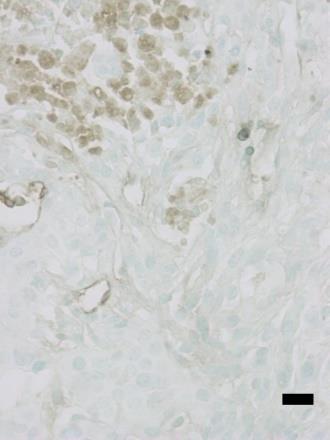
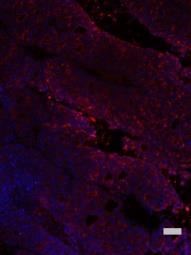
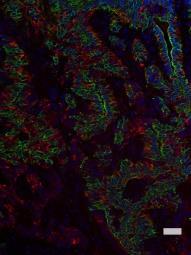
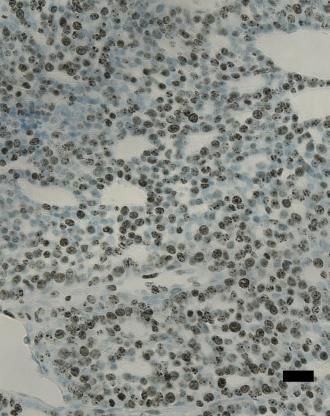
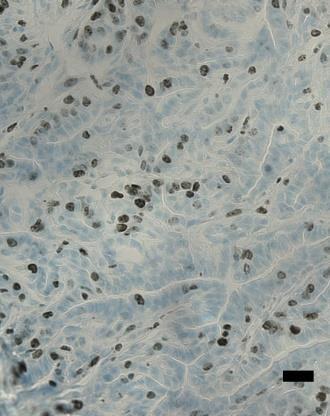
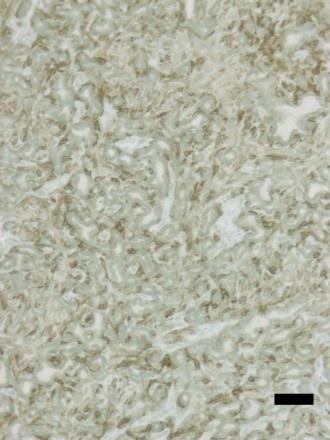
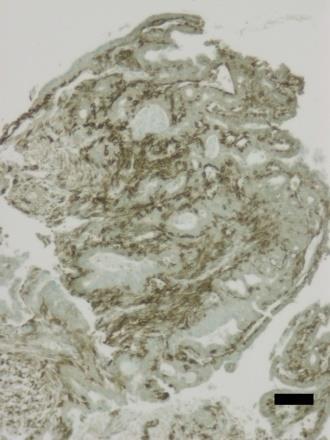
4 Vimentin ERα K14/K18/DAPI K5 Ki67 Her2 % ER positive cells %Ki67 positive cells Figure S1 A p=.5 Data 5 B p= PDA AME 2 1 PDA AME C AME PDA AME PDA AME
5 Cell growth Cell growth D.8 * ** * * **.3 *** estradiol (nm) estradiol (nm)


6 Day 27 Day 6 Day 3 Day 18 Day 6 Day 3 Figure S2 Phospho-H3 Ki67 Activated caspase 3 AME PDA
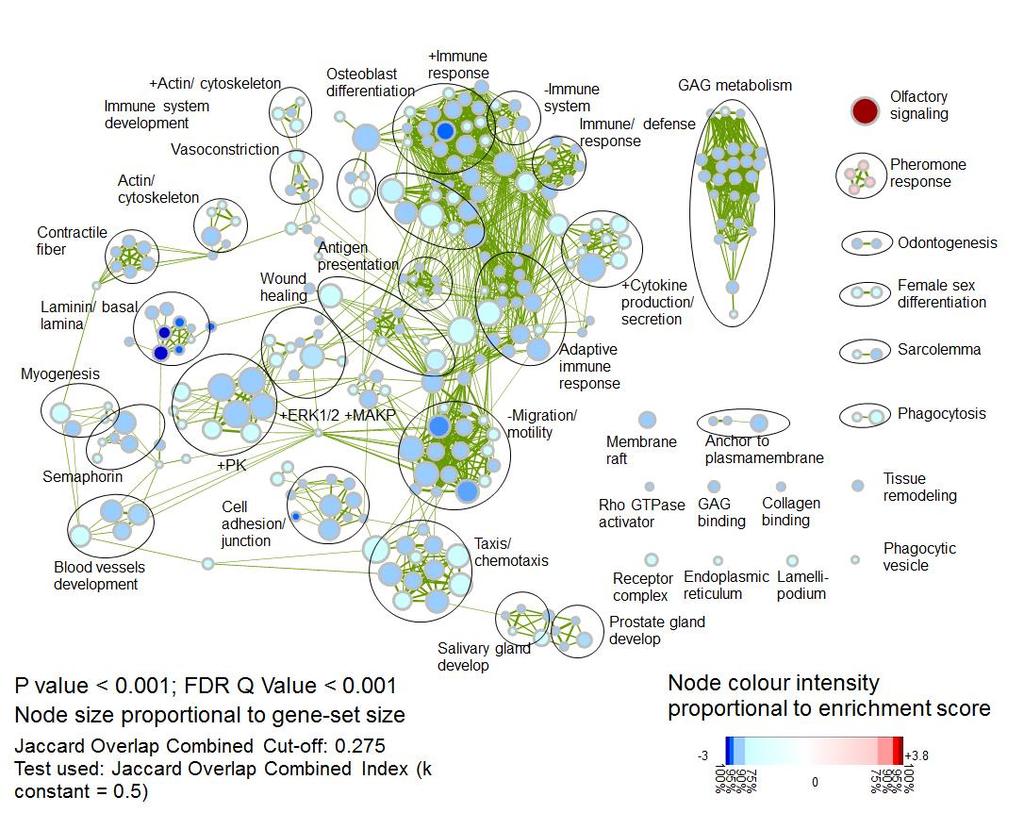
7 Figure S3
8 Figure S4
9 Figure S5 Region Event Freq. in Freq. in PDA (%) AME (%) Gene Symbols chr4:14,989,635-14,992,922 CN Loss 8 Gm694 chr6:125,678,52-125,697,798 CN Gain 8 Ano2 chr6:13,334,179-13,413,964 CN Gain 8 Klra1 chr6:137,128, ,132,525 CN Gain 8 chr6:137,792, ,87,44 CN Gain 8 chr12:79,949,645-79,962,242 CN Gain 8 Atp6v1d chr12:114,659, ,668,491 CN Loss 8 Igh-A (1g2), Gm16844, Igh, Ighg, V821, abparts chr12:114,668, ,676,477 CN Loss 1 abparts chr12:114,715, ,722,266 CN Gain 8 abparts chr12:117,668,3-117,679,572 CN Gain 2 1 Ncapg2 chr13:36,129,995-36,14,576 CN Loss 8 Lyrm4 chr14:51,574,375-51,586,687 CN Gain 8 Pnp2 chr14:52,494,38-52,52,775 CN Gain 8 chr14:52,575,12-52,593,14 CN Gain 8 chr19:17,165,722-17,173,735 CN Loss 8 Prune2
10 Figure S6 A Cul9 E2467 E2467 E2467 E2467 N Cul17 APC1 Cullin IBR * C B N CBL G848D S873T A895T G848D S873T A895T A895T S873T * * * TKB domain RING Proline-rich UBA/LZ C
11 Figure S7 Disease free survival A Months Mir145-high:PTEN-high n = 19 Mir145-low:PTEN-high n = 42 Mir145-high:PTEN-low n = 15 Mir145-low:PTEN-low n = 13 HR: 1.8 P =.248 HR: 1.94 P =.685 HR: 2.39 P =.55


12 Relative Expression AME+ Empty Vector Relative cell number AME+ mir Decoy Relative cell number Relative cell number A B Figure S p< p<.1 6 p< p<.1 p<.1 2 Day 1 Day 2 Day 3 Day 4 Day 1 Day 2 Day 3 Day 4 ERα K K14 Day 1 Day 2 Day 3 Day 4 D p<.5 15 p<.1 8 p<.1 p<.1 Day 1 Day 2 Day 3 Day C Day 1 Day 2 Day 3 Day 4 Pten shrna Pten - + Empty vector + - Tubulin PTEN shrna+mirna Decoy mirna Decoy PTEN shrna p< Empty Vector p<.43 p<.42 2 E Double infection vs. Pten shrna Double infection vs. mir Decoy 1 5 Day 1 Day 2 Day 3 Day Efna1b Fli1 Gng7 Rasal1 F 25 2 Empty Vector mir overexpression
13 Figure S9 Pathway AMEs PDAs p value AKT β-catenin E2F EGFR ER* E-5 Her IFNα* IFN gamma Myc p p PI3K PR Ras* Src STAT TGFβ* TNFα*
microrna-143/145 loss induces Ras signaling to promote aggressive Pten-deficient basal-like breast cancer
 microrna-143/145 loss induces Ras signaling to promote aggressive Pten-deficient basal-like breast cancer Sharon Wang,, Gary D. Bader, Eldad Zacksenhaus JCI Insight. 2017;2(15):e93313.. Research Article
EPIGENETIC RE-EXPRESSION OF HIF-2α SUPPRESSES SOFT TISSUE SARCOMA GROWTH
 EPIGENETIC RE-EXPRESSION OF HIF-2α SUPPRESSES SOFT TISSUE SARCOMA GROWTH Supplementary Figure 1. Supplementary Figure 1. Characterization of KP and KPH2 autochthonous UPS tumors. a) Genotyping of KPH2
Supplementary Figure 1. A. Bar graph representing the expression levels of the 19 indicated genes in the microarrays analyses comparing human lung
 Supplementary Figure 1. A. Bar graph representing the expression levels of the 19 indicated genes in the microarrays analyses comparing human lung immortalized broncho-epithelial cells (AALE cells) expressing
SUPPLEMENTARY INFORMATION
 DOI: 10.1038/ncb2607 Figure S1 Elf5 loss promotes EMT in mammary epithelium while Elf5 overexpression inhibits TGFβ induced EMT. (a, c) Different confocal slices through the Z stack image. (b, d) 3D rendering
Supplementary Figure 1. Basal level EGFR across a panel of ESCC lines. Immunoblots demonstrate the expression of phosphorylated and total EGFR as
 Supplementary Figure 1. Basal level EGFR across a panel of ESCC lines. Immunoblots demonstrate the expression of phosphorylated and total EGFR as well as their downstream effectors across a panel of ESCC
SUPPLEMENTARY FIGURES AND TABLE
 SUPPLEMENTARY FIGURES AND TABLE Supplementary Figure S1: Characterization of IRE1α mutants. A. U87-LUC cells were transduced with the lentiviral vector containing the GFP sequence (U87-LUC Tet-ON GFP).
Supplemental Figure 1. Intracranial transduction of a modified ptomo lentiviral vector in the mouse
 Supplemental figure legends Supplemental Figure 1. Intracranial transduction of a modified ptomo lentiviral vector in the mouse hippocampus targets GFAP-positive but not NeuN-positive cells. (A) Stereotaxic
Layered-IHC (L-IHC): A novel and robust approach to multiplexed immunohistochemistry So many markers and so little tissue
: A novel and robust approach to multiplexed immunohistochemistry So many markers and so little tissue") Page 1 The need for multiplex detection of tissue biomarkers. There is a constant and growing demand for increased biomarker analysis in human tissue specimens. Analysis of tissue biomarkers is key to
Page 1 The need for multiplex detection of tissue biomarkers. There is a constant and growing demand for increased biomarker analysis in human tissue specimens. Analysis of tissue biomarkers is key to
Supplementary Figure 1: STAT3 suppresses Kras-induced lung tumorigenesis
 Supplementary Figure 1: STAT3 suppresses Kras-induced lung tumorigenesis (a) Immunohistochemical (IHC) analysis of tyrosine 705 phosphorylation status of STAT3 (P- STAT3) in tumors and stroma (all-time
Targeted mass spectrometry (LC/MS/MS) for Olaparib pharmacokinetics. For LC/MS/MS of Olaparib pharmacokinetics metabolites were extracted from
 for Olaparib pharmacokinetics. For LC/MS/MS of Olaparib pharmacokinetics metabolites were extracted from") Supplementary Methods: Targeted mass spectrometry (LC/MS/MS) for Olaparib pharmacokinetics For LC/MS/MS of Olaparib pharmacokinetics metabolites were extracted from mouse tumor samples and analyzed as
Supplementary Methods: Targeted mass spectrometry (LC/MS/MS) for Olaparib pharmacokinetics For LC/MS/MS of Olaparib pharmacokinetics metabolites were extracted from mouse tumor samples and analyzed as
(A) SW480, DLD1, RKO and HCT116 cells were treated with DMSO or XAV939 (5 µm)
 SW480, DLD1, RKO and HCT116 cells were treated with DMSO or XAV939 (5 µm)") Supplementary Figure Legends Figure S1. Tankyrase inhibition suppresses cell proliferation in an axin/β-catenin independent manner. (A) SW480, DLD1, RKO and HCT116 cells were treated with DMSO or XAV939
Supplementary Figure Legends Figure S1. Tankyrase inhibition suppresses cell proliferation in an axin/β-catenin independent manner. (A) SW480, DLD1, RKO and HCT116 cells were treated with DMSO or XAV939
Bhatnagar et al, 2010 Cell Death and Disease Manuscript # CDDIS T
 Bhatnagar et al, Cell Death and Disease Manuscript # CDDIS--98-T Supplemental Materials. Supplemental Figure Legends Supplemental Figure (A) WPE-NA and WPE-NB6 cells were treated with 4 nm of Docetaxel
Supplementary Figure 1:
 Supplementary Figure 1: (A) Whole aortic cross-sections stained with Hematoxylin and Eosin (H&E), 7 days after porcine-pancreatic-elastase (PPE)-induced AAA compared to untreated, healthy control aortas
Hunk is required for HER2/neu-induced mammary tumorigenesis
 Research article Hunk is required for HER2/neu-induced mammary tumorigenesis Elizabeth S. Yeh, 1 Thomas W. Yang, 1 Jason J. Jung, 1 Heather P. Gardner, 1 Robert D. Cardiff, 2 and Lewis A. Chodosh 1 1 Department
Supplementary Figures
 Supplementary Figures Supplementary Figure 1 DOT1L regulates the expression of epithelial and mesenchymal markers. (a) The expression levels and cellular localizations of EMT markers were confirmed by
5K ALDEFLUOR-positive/ CXCR1-negative. 5K ALDEFLUOR-positive/ CXCR1-positive BAAA BAAA CXCR1-APC BAAA BAAA CXCR1-APC
 A +DEAB -DEAB K ALDEFLUOR-positive/ CXCR-negative BAAA BAAA CXCR-APC B +DEAB -DEAB K ALDEFLUOR-positive/ CXCR-positive BAAA BAAA CXCR-APC C Supplemental Figure. Tumorigenicity of the ALDEFLUOR-positive/CXCR-positive
SUPPLEMENTARY FIGURES
 SUPPLEMENTARY FIGURES Figure S1. Clinical significance of ZNF322A overexpression in Caucasian lung cancer patients. (A) Representative immunohistochemistry images of ZNF322A protein expression in tissue
Research progress on the use of estrogen receptor agonist for treatment of spinal cord injury
 Research progress on the use of estrogen receptor agonist for treatment of spinal cord injury Swapan K. Ray, PhD Professor, Department of Pathology, Microbiology, and Immunology USC School of Medicine,
Type of file: PDF Size of file: 0 KB Title of file for HTML: Supplementary Information Description: Supplementary Figures
 Type of file: PDF Size of file: 0 KB Title of file for HTML: Supplementary Information Description: Supplementary Figures Supplementary Figure 1 mir-128-3p is highly expressed in chemoresistant, metastatic
Supplementary Figure 1: Comparison of acgh-based and expression-based CNA analysis of tumors from breast cancer GEMMs.
 Supplementary Figure 1: Comparison of acgh-based and expression-based CNA analysis of tumors from breast cancer GEMMs. (a) CNA analysis of expression microarray data obtained from 15 tumors in the SV40Tag
Supplementary Figure 1.TRIM33 binds β-catenin in the nucleus. a & b, Co-IP of endogenous TRIM33 with β-catenin in HT-29 cells (a) and HEK 293T cells
 and HEK 293T cells") Supplementary Figure 1.TRIM33 binds β-catenin in the nucleus. a & b, Co-IP of endogenous TRIM33 with β-catenin in HT-29 cells (a) and HEK 293T cells (b). TRIM33 was immunoprecipitated, and the amount of
Supplementary Figure 1.TRIM33 binds β-catenin in the nucleus. a & b, Co-IP of endogenous TRIM33 with β-catenin in HT-29 cells (a) and HEK 293T cells (b). TRIM33 was immunoprecipitated, and the amount of
Supplementary Figure 1 Cell line TRIB2 status. Supplementary Figure 2 TRIB2 status has no impact on the cell cycle after PI3K inhibition. a. b.
 Supplementary Figure 1 Cell line TRIB2 status. TRIB2 protein expression to determine endogenous expression and to determine the effectiveness of each of our TRIB2 knockdown constructs. Supplementary Figure
Supplementary Figure 1. The mir-182 binding site of SMAD7 3 UTR and the. mutated sequence.
 Supplementary Figure 1. The mir-182 binding site of SMAD7 3 UTR and the mutated sequence. 1 Supplementary Figure 2. Expression of mir-182 and SMAD7 in various cell lines. (A) Basal levels of mir-182 expression
Dox. R26-rtTA Tyr-CreERT2. any ink/arf, no rtta (n=8) ink/arf +/+ (n=5) Day 0 Day 11 Day 18 Day 28
 ink/arf +/+ (n=5) Day 0 Day 11 Day 18 Day 28") A 4OHT Dox hraf iip tumors inras ddh 2 O -RT Ink/Arf / Pten l/ l R26-lsl-rtTA Tyr-reERT2 TetO-hRAF V6E Ink/Arf / Pten / R26-rtTA Tyr-reERT2 TetO-hRAF V6E Ink/Arf / Pten / R26-rtTA Tyr-reERT2 TetO-hRAF
A 4OHT Dox hraf iip tumors inras ddh 2 O -RT Ink/Arf / Pten l/ l R26-lsl-rtTA Tyr-reERT2 TetO-hRAF V6E Ink/Arf / Pten / R26-rtTA Tyr-reERT2 TetO-hRAF V6E Ink/Arf / Pten / R26-rtTA Tyr-reERT2 TetO-hRAF
AP VP DLP H&E. p-akt DLP
 A B AP VP DLP H&E AP AP VP DLP p-akt wild-type prostate PTEN-null prostate Supplementary Fig. 1. Targeted deletion of PTEN in prostate epithelium resulted in HG-PIN in all three lobes. (A) The anatomy
fl/+ KRas;Atg5 fl/+ KRas;Atg5 fl/fl KRas;Atg5 fl/fl KRas;Atg5 Supplementary Figure 1. Gene set enrichment analyses. (a) (b)
 (b)") KRas;At KRas;At KRas;At KRas;At a b Supplementary Figure 1. Gene set enrichment analyses. (a) GO gene sets (MSigDB v3. c5) enriched in KRas;Atg5 fl/+ as compared to KRas;Atg5 fl/fl tumors using gene set
KRas;At KRas;At KRas;At KRas;At a b Supplementary Figure 1. Gene set enrichment analyses. (a) GO gene sets (MSigDB v3. c5) enriched in KRas;Atg5 fl/+ as compared to KRas;Atg5 fl/fl tumors using gene set
(a) Significant biological processes (upper panel) and disease biomarkers (lower panel)
 Significant biological processes (upper panel) and disease biomarkers (lower panel)") Supplementary Figure 1. Functional enrichment analyses of secretomic proteins. (a) Significant biological processes (upper panel) and disease biomarkers (lower panel) 2 involved by hrab37-mediated secretory
Supplementary Figure 1. Functional enrichment analyses of secretomic proteins. (a) Significant biological processes (upper panel) and disease biomarkers (lower panel) 2 involved by hrab37-mediated secretory
Supplementary Figure 1. PD-L1 is glycosylated in cancer cells. (a) Western blot analysis of PD-L1 in breast cancer cells. (b) Western blot analysis
 Western blot analysis of PD-L1 in breast cancer cells. (b) Western blot analysis") Supplementary Figure 1. PD-L1 is glycosylated in cancer cells. (a) Western blot analysis of PD-L1 in breast cancer cells. (b) Western blot analysis of PD-L1 in ovarian cancer cells. (c) Western blot analysis
Supplementary Figure 1. PD-L1 is glycosylated in cancer cells. (a) Western blot analysis of PD-L1 in breast cancer cells. (b) Western blot analysis of PD-L1 in ovarian cancer cells. (c) Western blot analysis
EGFR shrna A: CCGGCGCAAGTGTAAGAAGTGCGAACTCGAGTTCGCACTTCTTACACTTGCG TTTTTG. EGFR shrna B: CCGGAGAATGTGGAATACCTAAGGCTCGAGCCTTAGGTATTCCACATTCTCTT TTTG
 Supplementary Methods Sequence of oligonucleotides used for shrna targeting EGFR EGFR shrna were obtained from the Harvard RNAi consortium. The following oligonucleotides (forward primer) were used to
Supplementary Figure S1 Expression of mir-181b in EOC (A) Kaplan-Meier
 Kaplan-Meier") Supplementary Figure S1 Expression of mir-181b in EOC (A) Kaplan-Meier curves for progression-free survival (PFS) and overall survival (OS) in a cohort of patients (N=52) with stage III primary ovarian
Supplementary Figure S1 Expression of mir-181b in EOC (A) Kaplan-Meier curves for progression-free survival (PFS) and overall survival (OS) in a cohort of patients (N=52) with stage III primary ovarian
Supplementary Fig. 1: ATM is phosphorylated in HER2 breast cancer cell lines. (A) ATM is phosphorylated in SKBR3 cells depending on ATM and HER2
 ATM is phosphorylated in SKBR3 cells depending on ATM and HER2") Supplementary Fig. 1: ATM is phosphorylated in HER2 breast cancer cell lines. (A) ATM is phosphorylated in SKBR3 cells depending on ATM and HER2 activity. Upper panel: Representative histograms for FACS
Supplementary Fig. 1: ATM is phosphorylated in HER2 breast cancer cell lines. (A) ATM is phosphorylated in SKBR3 cells depending on ATM and HER2 activity. Upper panel: Representative histograms for FACS
TEB. Id4 p63 DAPI Merge. Id4 CK8 DAPI Merge
 a Duct TEB b Id4 p63 DAPI Merge Id4 CK8 DAPI Merge c d e Supplementary Figure 1. Identification of Id4-positive MECs and characterization of the Comma-D model. (a) IHC analysis of ID4 expression in the
Supplementary Materials for
 www.sciencesignaling.org/cgi/content/full/8/364/ra18/dc1 Supplementary Materials for The tyrosine phosphatase (Pez) inhibits metastasis by altering protein trafficking Leila Belle, Naveid Ali, Ana Lonic,
SUPPLEMENTARY INFORMATION
 DOI: 1.138/ncb3355 a S1A8 + cells/ total.1.8.6.4.2 b S1A8/?-Actin c % T-cell proliferation 3 25 2 15 1 5 T cells Supplementary Figure 1 Inter-tumoral heterogeneity of MDSC accumulation in mammary tumor
SUPPLEMENTARY INFORMATION. Supp. Fig. 1. Autoimmunity. Tolerance APC APC. T cell. T cell. doi: /nature06253 ICOS ICOS TCR CD28 TCR CD28
 Supp. Fig. 1 a APC b APC ICOS ICOS TCR CD28 mir P TCR CD28 P T cell Tolerance Roquin WT SG Icos mrna T cell Autoimmunity Roquin M199R SG Icos mrna www.nature.com/nature 1 Supp. Fig. 2 CD4 + CD44 low CD4
microrna-200b and microrna-200c promote colorectal cancer cell proliferation via
 Supplementary Materials microrna-200b and microrna-200c promote colorectal cancer cell proliferation via targeting the reversion-inducing cysteine-rich protein with Kazal motifs Supplementary Table 1.
Supplementary Information
 Supplementary Information Figure S1. Int6 gene silencing efficiency. (A) Western Blot analysis of Int6 expression at different times after sirna transfection. Int6 expression is strongly silenced in Int6
IL-24 AND ITS ROLE IN WOUND HEALING
 IL-24 AND ITS ROLE IN WOUND HEALING Nancy J. Poindexter, Ryan Williams, Garth Powis, Sunil Chada, and Elizabeth A. Grimm & Introgen Therapeutics, Inc., Houston, TX IL-24/MDA 24/MDA-77 is a Tumor Suppressor
Supplementary Figure 1. Characterization of ALDH-positive cell population in MCF-7 cells. (a) Expression level of stem cell markers in MCF-7 cells or
 Expression level of stem cell markers in MCF-7 cells or") Supplementary Figure 1. Characterization of ALDH-positive cell population in MCF-7 cells. (a) Expression level of stem cell markers in MCF-7 cells or ALDH-positive cell population by qpcr. Data represent
Supplementary Figure 1. Characterization of ALDH-positive cell population in MCF-7 cells. (a) Expression level of stem cell markers in MCF-7 cells or ALDH-positive cell population by qpcr. Data represent
Supplemental Figure 1. Western blot analysis indicated that MIF was detected in the fractions of
 Supplemental Figure Legends Supplemental Figure 1. Western blot analysis indicated that was detected in the fractions of plasma membrane and cytosol but not in nuclear fraction isolated from Pkd1 null
Plasma exposure levels from individual mice 4 hours post IP administration at the
 Supplemental Figure Legends Figure S1. Plasma exposure levels of MKC-3946 in mice. Plasma exposure levels from individual mice 4 hours post IP administration at the indicated dose mg/kg. Data represent
Supplementary Figure 1. Genotyping strategies for Mcm3 +/+, Mcm3 +/Lox and Mcm3 +/- mice and luciferase activity in Mcm3 +/Lox mice. A.
 Supplementary Figure 1. Genotyping strategies for Mcm3 +/+, Mcm3 +/Lox and Mcm3 +/- mice and luciferase activity in Mcm3 +/Lox mice. A. Upper part, three-primer PCR strategy at the Mcm3 locus yielding
Supplementary Information. Induction of p53-independent apoptosis by ectopic expression of HOXA5
 Supplementary Information Induction of p53-independent apoptosis by ectopic expression of in human liposarcomas Dhong Hyun Lee 1, *, Charles Forscher 1, Dolores Di Vizio 2, 3, and H. Phillip Koeffler 1,
Supplementary Information
 Supplementary Information - chimeric fusion transcript in human gastric cancer promotes tumorigenesis through activation of PI3K/AKT signaling Sun Mi Yun, Kwiyeom Yoon, Sunghoon Lee, Eunjeong Kim, Seong-Ho
Supplementary Figure 1. Experimental paradigm. A combination of genome and exome sequencing coupled with array-comparative genome hybridization was
 Supplementary Figure 1. Experimental paradigm. A combination of genome and exome sequencing coupled with array-comparative genome hybridization was performed on a total of 85 SS patients. Data filtration
Supplementary Figure 1. The CagA-dependent wound healing or transwell migration of gastric cancer cell. AGS cells transfected with vector control or
 Supplementary Figure 1. The CagA-dependent wound healing or transwell migration of gastric cancer cell. AGS cells transfected with vector control or 3xflag-CagA expression vector were wounded using a pipette
Supplementary Material
 Supplementary Material The Androgen Receptor is a negative regulator of eif4e Phosphorylation at S209: Implications for the use of mtor inhibitors in advanced prostate cancer Supplementary Figures Supplemental
(A) PCR primers (arrows) designed to distinguish wild type (P1+P2), targeted (P1+P2) and excised (P1+P3)14-
 PCR primers (arrows) designed to distinguish wild type (P1+P2), targeted (P1+P2) and excised (P1+P3)14-") 1 Supplemental Figure Legends Figure S1. Mammary tumors of ErbB2 KI mice with 14-3-3σ ablation have elevated ErbB2 transcript levels and cell proliferation (A) PCR primers (arrows) designed to distinguish
1 Supplemental Figure Legends Figure S1. Mammary tumors of ErbB2 KI mice with 14-3-3σ ablation have elevated ErbB2 transcript levels and cell proliferation (A) PCR primers (arrows) designed to distinguish
Soft Agar Assay. For each cell pool, 100,000 cells were resuspended in 0.35% (w/v)
") SUPPLEMENTARY MATERIAL AND METHODS Soft Agar Assay. For each cell pool, 100,000 cells were resuspended in 0.35% (w/v) top agar (LONZA, SeaKem LE Agarose cat.5004) and plated onto 0.5% (w/v) basal agar.
SUPPLEMENTARY MATERIAL AND METHODS Soft Agar Assay. For each cell pool, 100,000 cells were resuspended in 0.35% (w/v) top agar (LONZA, SeaKem LE Agarose cat.5004) and plated onto 0.5% (w/v) basal agar.
SUPPLEMENTARY INFORMATION
 doi:10.1038/nature11700 Figure 1: RIP3 as a potential Sirt2 interacting protein. Transfected Flag-tagged Sirt2 was immunoprecipitated from cells and eluted from the Sepharose beads using Flag peptide.
Supplementary Fig. 1. GPRC5A post-transcriptionally down-regulates EGFR expression. (a) Plot of the changes in steady state mrna levels versus
 Plot of the changes in steady state mrna levels versus") Supplementary Fig. 1. GPRC5A post-transcriptionally down-regulates EGFR expression. (a) Plot of the changes in steady state mrna levels versus changes in corresponding proteins between wild type and Gprc5a-/-
Supplementary Fig. 1. GPRC5A post-transcriptionally down-regulates EGFR expression. (a) Plot of the changes in steady state mrna levels versus changes in corresponding proteins between wild type and Gprc5a-/-
Supplementary Figure 1: Neuregulin 1 increases the growth of mammary organoids compared to EGF. (a) Mammary epithelial cells were freshly isolated,
 Mammary epithelial cells were freshly isolated,") 1 2 3 4 5 6 7 8 9 10 Supplementary Figure 1: Neuregulin 1 increases the growth of mammary organoids compared to EGF. (a) Mammary epithelial cells were freshly isolated, embedded in matrigel and exposed
1 2 3 4 5 6 7 8 9 10 Supplementary Figure 1: Neuregulin 1 increases the growth of mammary organoids compared to EGF. (a) Mammary epithelial cells were freshly isolated, embedded in matrigel and exposed
Supplementary Figure 1: Tissue of Origin analysis on 152 cell lines. (a) Heatmap representation of the 30 Tissue scores for the 152 cell lines.
 Heatmap representation of the 30 Tissue scores for the 152 cell lines.") Supplementary Figure 1: Tissue of Origin analysis on 152 cell lines. (a) Heatmap representation of the 30 Tissue scores for the 152 cell lines. The scores summarize the global expression of the tissue
Supplementary Figure 1: Tissue of Origin analysis on 152 cell lines. (a) Heatmap representation of the 30 Tissue scores for the 152 cell lines. The scores summarize the global expression of the tissue
Supplementary Materials for
 advances.sciencemag.org/cgi/content/full/1/8/e1500296/dc1 Supplementary Materials for Transcriptional regulation of APOBEC3 antiviral immunity through the CBF- /RUNX axis This PDF file includes: Brett
The mir-199a/brm/egr1 axis is a determinant of anchorage-independent growth in epithelial tumor cell lines
 Supplementary information Supplementary Figure -9 Supplementary Table -4 The mir-99a/brm/egr axis is a determinant of anchorage-independent growth in epithelial tumor cell lines Kazuyoshi Kobayashi, Kouhei
Lung Met 1 Lung Met 2 Lung Met Lung Met H3K4me1. Lung Met H3K27ac Primary H3K4me1
 a Gained Met-VELs 1.5 1.5 -.5 Lung Met 1 Lung Met Lung Met 3 1. Lung Met H3K4me1 Lung Met H3K4me1 1 Lung Met H3K4me1 Lung Met H3K7ac 1.5 Lung Met H3K7ac Lung Met H3K7ac.8 Primary H3K4me1 Primary H3K7ac
Nature Neuroscience: doi: /nn Supplementary Figure 1
 Supplementary Figure 1 EGFR inhibition activates signaling pathways (a-b) EGFR inhibition activates signaling pathways (a) U251EGFR cells were treated with erlotinib (1µM) for the indicated times followed
Supplementary Figure 1
 Supplementary Figure 1 Constitutive EGFR signaling does not activate canonical EGFR signals (a) U251EGFRInd cells with or without tetracycline exposure (24h, 1µg/ml) were treated with EGF for 15 minutes
Supplementary Figure 1
 Supplementary Figure 1 6 HE-50 HE-116 E-1 HE-108 Supplementary Figure 1. Targeted drug response curves of endometrial cancer cells. Endometrial cancer cell lines were incubated with serial dilutions of
Type of file: PDF Title of file for HTML: Supplementary Information Description: Supplementary Figures
 Type of file: PDF Title of file for HTML: Supplementary Information Description: Supplementary Figures Type of file: MOV Title of file for HTML: Supplementary Movie 1 Description: NLRP3 is moving along
SUPPLEMENTARY INFORMATION
 DOI: 10.1038/ncb3021 Supplementary figure 1 Characterisation of TIMPless fibroblasts. a) Relative gene expression of TIMPs1-4 by real time quantitative PCR (RT-qPCR) in WT or ΔTimp fibroblasts (mean ±
mtor plays critical roles in pancreatic cancer stem cells through specific and stemness-related functions
 Supplementary Information mtor plays critical roles in pancreatic cancer stem cells through specific and stemness-related functions Shyuichiro Matsubara 1, Qiang Ding 1, Yumi Miyazaki 1, Taisaku Kuwahata
Supplemental Data. TGF-β-mediated mir-181a expression promotes breast cancer metastasis by targeting Bim.
 Supplemental Data TGF-β-mediated mir-181a expression promotes breast cancer metastasis by targeting Bim. Molly A. Taylor 1, Khalid Sossey-Alaoui 2, Cheryl L. Thompson 3, David Danielpour 4, and William
Nature Genetics: doi: /ng Supplementary Figure 1. Details of sequencing analysis.
 Supplementary Figure 1 Details of sequencing analysis. (a) Flow chart showing which patients fall into each category and were used for analysis. (b) Graph showing the average and median coverage for all
(A) RT-PCR for components of the Shh/Gli pathway in normal fetus cell (MRC-5) and a
 RT-PCR for components of the Shh/Gli pathway in normal fetus cell (MRC-5) and a") Supplementary figure legends Supplementary Figure 1. Expression of Shh signaling components in a panel of gastric cancer. (A) RT-PCR for components of the Shh/Gli pathway in normal fetus cell (MRC-5) and
Supplementary figure legends Supplementary Figure 1. Expression of Shh signaling components in a panel of gastric cancer. (A) RT-PCR for components of the Shh/Gli pathway in normal fetus cell (MRC-5) and
An epithelial-to-mesenchymal transition-inducing potential of. granulocyte macrophage colony-stimulating factor in colon. cancer
 An epithelial-to-mesenchymal transition-inducing potential of granulocyte macrophage colony-stimulating factor in colon cancer Yaqiong Chen, Zhi Zhao, Yu Chen, Zhonglin Lv, Xin Ding, Renxi Wang, He Xiao,
gliomas. Fetal brain expected who each low-
 Supplementary Figure S1. Grade-specificity aberrant expression of HOXA genes in gliomas. (A) Representative RT-PCR analyses of HOXA gene expression in human astrocytomas. Exemplified glioma samples include
Supplementary Figure 1. Spatial distribution of LRP5 and β-catenin in intact cardiomyocytes. (a) and (b) Immunofluorescence staining of endogenous
 and (b) Immunofluorescence staining of endogenous") Supplementary Figure 1. Spatial distribution of LRP5 and β-catenin in intact cardiomyocytes. (a) and (b) Immunofluorescence staining of endogenous LRP5 in intact adult mouse ventricular myocytes (AMVMs)
Supplementary Figure 1. Spatial distribution of LRP5 and β-catenin in intact cardiomyocytes. (a) and (b) Immunofluorescence staining of endogenous LRP5 in intact adult mouse ventricular myocytes (AMVMs)
Color Key PCA. mir- 15a let-7c 106b let-7b let-7a 16 10b 99a 26a 20b 374b 19b 135b 125b a-5p 199b-5p 93 92b MES PN.
 1123 83 528 816 84 2 17 718 Comp3 3 2 1 1 2 3 4 Comp2 a b Color Key MES PN PCA 3 2 1 1 2 3 4 Comp1 1 2 3 1 2 3 4-2 -1 1 2 mi- 15a let-7c 16b let-7b let-7a 16 1b 99a 26a 2b 374b 19b 135b 125b 9 34 125a-5p
Figure S1. Reduction in glomerular mir-146a levels correlate with progression to higher albuminuria in diabetic patients.
 Supplementary Materials Supplementary Figures Figure S1. Reduction in glomerular mir-146a levels correlate with progression to higher albuminuria in diabetic patients. Figure S2. Expression level of podocyte
mir-509-5p and mir-1243 increase the sensitivity to gemcitabine by inhibiting
 mir-509-5p and mir-1243 increase the sensitivity to gemcitabine by inhibiting epithelial-mesenchymal transition in pancreatic cancer Hidekazu Hiramoto, M.D. 1,3, Tomoki Muramatsu, Ph.D. 1, Daisuke Ichikawa,
SUPPLEMENTARY FIGURE LEGENDS. atypical adenomatous hyperplasias (AAH); Grade II: adenomas; Grade III: adenocarcinomas;
; Grade II: adenomas; Grade III: adenocarcinomas;") SUPPLEMENTARY FIGURE LEGENDS Supplementary Figure S1: Tumor grades in Ras G12D ; p53 / lung tumors. Representative histology (H&E) of K-Ras G12D ; p53 / lung tumors 13 weeks after tumor initiation. Grade
SUPPLEMENTARY FIGURE LEGENDS Supplementary Figure S1: Tumor grades in Ras G12D ; p53 / lung tumors. Representative histology (H&E) of K-Ras G12D ; p53 / lung tumors 13 weeks after tumor initiation. Grade
Supplementary Table S1. Tumor samples used for analysis Tumor size (cm) BNG (grade) ERα PR. pn-
 BNG (grade) ERα PR. pn-") Supplementary Table S1. Tumor samples used for analysis Sample# Age Tumor size (cm) pn- Stage Stage BNG (grade) ERα PR HER2 (FISH) Triple negative T1 46 3 N1a III 2 Pos Neg N T2 58 1 N(i-) I 3 Pos Neg
Supplementary Table S1. Tumor samples used for analysis Sample# Age Tumor size (cm) pn- Stage Stage BNG (grade) ERα PR HER2 (FISH) Triple negative T1 46 3 N1a III 2 Pos Neg N T2 58 1 N(i-) I 3 Pos Neg
Supplementary Fig. 1. Delivery of mirnas via Red Fluorescent Protein.
 prfp-vector RFP Exon1 Intron RFP Exon2 prfp-mir-124 mir-93/124 RFP Exon1 Intron RFP Exon2 Untransfected prfp-vector prfp-mir-93 prfp-mir-124 Supplementary Fig. 1. Delivery of mirnas via Red Fluorescent
Loss of RhoA promotes skin tumor formation. Supplementary Figure 1. Loss of RhoA does not impair F-actin organization.
 Supplementary Figure Legends Supplementary Figure 1. Loss of RhoA does not impair F-actin organization. a. Representative IF images of F-actin staining of big and small control (left) and RhoA ko tumors
A263 A352 A204. Pan CK. pstat STAT3 pstat3 STAT3 pstat3. Columns Columns 1-6 Positive control. Omentum. Rectosigmoid A195.
 pstat3 75 Pan CK A A263 A352 A24 B Columns 1-6 Positive control A195 A22 A24 A183 Rectal Nodule STAT3 pstat3 STAT3 pstat3 Columns 7-12 Omentum Rectosigmoid Left Ovary Right Ovary Omentum Uterus Uterus
Supplementary fig. 1. Crystals induce necroptosis does not involve caspases, TNF receptor or NLRP3. A. Mouse tubular epithelial cells were pretreated
 Supplementary fig. 1. Crystals induce necroptosis does not involve caspases, TNF receptor or NLRP3. A. Mouse tubular epithelial cells were pretreated with zvad-fmk (10µM) and exposed to calcium oxalate
Supplementary Figure 1
 Combination index (CI) Supplementary Figure 1 2. 1.5 1. Ishikawa AN3CA Nou-1 Hec-18.5...2.4.6.8 1. Fraction affected (Fa) Supplementary Figure 1. The synergistic effect of PARP inhibitor and PI3K inhibitor
SHREE ET AL, SUPPLEMENTAL MATERIALS. (A) Workflow for tumor cell line derivation and orthotopic implantation.
 Workflow for tumor cell line derivation and orthotopic implantation.") SHREE ET AL, SUPPLEMENTAL MATERIALS SUPPLEMENTAL FIGURE AND TABLE LEGENDS Supplemental Figure 1. Derivation and characterization of TS1-TGL and TS2-TGL PyMT cell lines and development of an orthotopic
SHREE ET AL, SUPPLEMENTAL MATERIALS SUPPLEMENTAL FIGURE AND TABLE LEGENDS Supplemental Figure 1. Derivation and characterization of TS1-TGL and TS2-TGL PyMT cell lines and development of an orthotopic
Peli1 negatively regulates T-cell activation and prevents autoimmunity
 Peli1 negatively regulates T-cell activation and prevents autoimmunity Mikyoung Chang 1,*, Wei Jin 1,5,*, Jae-Hoon Chang 1, Yi-chuan Xiao 1, George Brittain 1, Jiayi Yu 1, Xiaofei Zhou 1, Yi-Hong Wang
Supplementary Figure 1. Characterization of NMuMG-ErbB2 and NIC breast cancer cells expressing shrnas targeting LPP. NMuMG-ErbB2 cells (a) and NIC
 and NIC") Supplementary Figure 1. Characterization of NMuMG-ErbB2 and NIC breast cancer cells expressing shrnas targeting LPP. NMuMG-ErbB2 cells (a) and NIC cells (b) were engineered to stably express either a LucA-shRNA
Supplementary Figure 1. Characterization of NMuMG-ErbB2 and NIC breast cancer cells expressing shrnas targeting LPP. NMuMG-ErbB2 cells (a) and NIC cells (b) were engineered to stably express either a LucA-shRNA
Supplemental Figure 1
 Supplemental Figure 1 A S100A4: SFLGKRTDEAAFQKLMSNLDSNRDNEVDFQEYCVFLSCIAMMCNEFFEGFPDK Overlap: SF G DE KLM LD N D VDFQEY VFL I M N FF G PD S100A2: SFVGEKVDEEGLKKLMGSLDENSDQQVDFQEYAVFLALITVMCNDFFQGCPDR
SUPPLEMENTARY FIGURES
 SUPPLEMENTARY FIGURES Supplementary Figure S1: Fibroblast-induced elongation of cancer cells requires direct contact with living fibroblasts. A. Representative images of HT29-GFP cultured in the presence
Supplementary Figure 1. HOPX is hypermethylated in NPC. (a) Methylation levels of HOPX in Normal (n = 24) and NPC (n = 24) tissues from the
 Methylation levels of HOPX in Normal (n = 24) and NPC (n = 24) tissues from the") Supplementary Figure 1. HOPX is hypermethylated in NPC. (a) Methylation levels of HOPX in Normal (n = 24) and NPC (n = 24) tissues from the genome-wide methylation microarray data. Mean ± s.d.; Student
Supplementary Figure 1. HOPX is hypermethylated in NPC. (a) Methylation levels of HOPX in Normal (n = 24) and NPC (n = 24) tissues from the genome-wide methylation microarray data. Mean ± s.d.; Student
(a) Schematic diagram of the FS mutation of UVRAG in exon 8 containing the highly instable
 Schematic diagram of the FS mutation of UVRAG in exon 8 containing the highly instable") Supplementary Figure 1. Frameshift (FS) mutation in UVRAG. (a) Schematic diagram of the FS mutation of UVRAG in exon 8 containing the highly instable A 10 DNA repeat, generating a premature stop codon
Supplementary Figure 1. Frameshift (FS) mutation in UVRAG. (a) Schematic diagram of the FS mutation of UVRAG in exon 8 containing the highly instable A 10 DNA repeat, generating a premature stop codon
Tbk1-TKO! DN cells (%)! 15! 10!
! 15! 10!") a! T Cells! TKO! B Cells! TKO! b! CD4! 8.9 85.2 3.4 2.88 CD8! Tbk1-TKO! 1.1 84.8 2.51 2.54 c! DN cells (%)! 4 3 2 1 DP cells (%)! 9 8 7 6 CD4 + SP cells (%)! 5 4 3 2 1 5 TKO! TKO! TKO! TKO! 15 1 5 CD8
a! T Cells! TKO! B Cells! TKO! b! CD4! 8.9 85.2 3.4 2.88 CD8! Tbk1-TKO! 1.1 84.8 2.51 2.54 c! DN cells (%)! 4 3 2 1 DP cells (%)! 9 8 7 6 CD4 + SP cells (%)! 5 4 3 2 1 5 TKO! TKO! TKO! TKO! 15 1 5 CD8
Supplemental Information
 Supplemental Information Tobacco-specific Carcinogen Induces DNA Methyltransferases 1 Accumulation through AKT/GSK3β/βTrCP/hnRNP-U in Mice and Lung Cancer patients Ruo-Kai Lin, 1 Yi-Shuan Hsieh, 2 Pinpin
Differential effects of oncogenic K-Ras and N-Ras on proliferation, differentiation, and tumor progression in the colon
 SUPPLEMENTARY INFORMATION Differential effects of oncogenic K-Ras and N-Ras on proliferation, differentiation, and tumor progression in the colon Kevin M. Haigis, Krystle Kendall, Yufang Wang, Ann Cheung,
Supplementary Figure 1
 A B D Relative TAp73 mrna p73 Supplementary Figure 1 25 2 15 1 5 p63 _-tub. MDA-468 HCC1143 HCC38 SUM149 MDA-468 HCC1143 HCC38 SUM149 HCC-1937 MDA-MB-468 ΔNp63_ TAp73_ TAp73β E C Relative ΔNp63 mrna TAp73
SUPPLEMENTARY INFORMATION
 doi:10.1038/nature12652 Supplementary Figure 1. PRDM16 interacts with endogenous EHMT1 in brown adipocytes. Immunoprecipitation of PRDM16 complex by flag antibody (M2) followed by Western blot analysis
Breeding scheme, transgenes, histological analysis and site distribution of SB-mutagenized osteosarcoma.
 Supplementary Figure 1 Breeding scheme, transgenes, histological analysis and site distribution of SB-mutagenized osteosarcoma. (a) Breeding scheme. R26-LSL-SB11 homozygous mice were bred to Trp53 LSL-R270H/+
Supplementary methods:
 Supplementary methods: Primers sequences used in real-time PCR analyses: β-actin F: GACCTCTATGCCAACACAGT β-actin [11] R: AGTACTTGCGCTCAGGAGGA MMP13 F: TTCTGGTCTTCTGGCACACGCTTT MMP13 R: CCAAGCTCATGGGCAGCAACAATA
File Name: Supplementary Information Description: Supplementary Figures and Supplementary Table. File Name: Peer Review File Description:
 File Name: Supplementary Information Description: Supplementary Figures and Supplementary Table File Name: Peer Review File Description: Supplementary Table 1 Primers and taqman probes used were the following:
Supplemental Figure 1. Signature gene expression in in vitro differentiated Th0, Th1, Th2, Th17 and Treg cells. (A) Naïve CD4 + T cells were cultured
 Naïve CD4 + T cells were cultured") Supplemental Figure 1. Signature gene expression in in vitro differentiated Th0, Th1, Th2, Th17 and Treg cells. (A) Naïve CD4 + T cells were cultured under Th0, Th1, Th2, Th17, and Treg conditions. mrna
Supplemental Figure 1. Signature gene expression in in vitro differentiated Th0, Th1, Th2, Th17 and Treg cells. (A) Naïve CD4 + T cells were cultured under Th0, Th1, Th2, Th17, and Treg conditions. mrna
Supplementary Figure 1
 Supplementary Figure 1 14 12 SEM4C PLXN2 8 SEM4C C 3 Cancer Cell Non Cancer Cell Expression 1 8 6 6 4 log2 ratio Expression 2 1 4 2 2 p value.1 D Supplementary Figure 1. Expression of Sema4C and Plexin2
Crosstalk between Adiponectin and IGF-IR in breast cancer. Prof. Young Jin Suh Department of Surgery The Catholic University of Korea
 Crosstalk between Adiponectin and IGF-IR in breast cancer Prof. Young Jin Suh Department of Surgery The Catholic University of Korea Obesity Chronic, multifactorial disorder Hypertrophy and hyperplasia
SUPPLEMENTARY INFORMATION
 doi:10.1038/nature12215 Supplementary Figure 1. The effects of full and dissociated GR agonists in supporting BFU-E self-renewal divisions. BFU-Es were cultured in self-renewal medium with indicated GR
Supplementary Materials for
 www.sciencesignaling.org/cgi/content/full/2/1/ra81/dc1 Supplementary Materials for Delivery of MicroRNA-126 by Apoptotic Bodies Induces CXCL12- Dependent Vascular Protection Alma Zernecke,* Kiril Bidzhekov,
Supplementary Information
 Supplementary Information Supplementary Figure 1. Effect of mir mimics and anti-mirs on DTPs a, Representative fluorescence microscopy images of GFP vector control or mir mimicexpressing parental and DTP
Supplementary Materials for
 www.sciencesignaling.org/cgi/content/full/7/322/ra38/dc1 Supplementary Materials for Dynamic Reprogramming of Signaling Upon Met Inhibition Reveals a Mechanism of Drug Resistance in Gastric Cancer Andrea