Nature Methods: doi: /nmeth.4257
|
|
|
- Myrtle Black
- 5 years ago
- Views:
Transcription
1
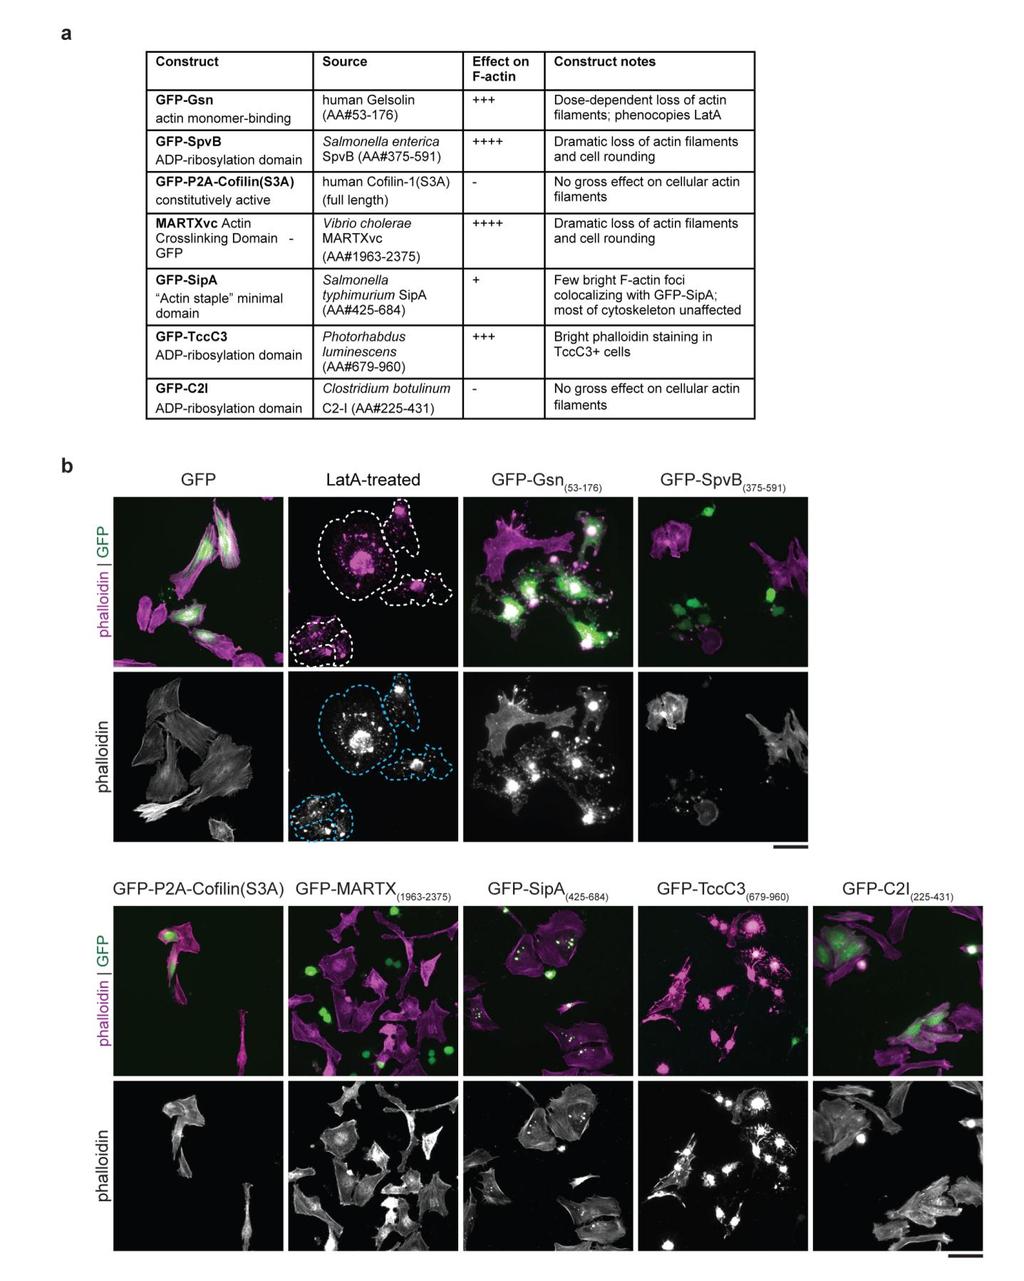
2 Supplementary Figure 1 Screen for polypeptides that affect cellular actin filaments. (a) Table summarizing results from all polypeptides tested. Source shows organism, gene, and amino acid numbers used. Effect on F- actin is qualitative analysis of gross changes in cellular phalloidin intensity and distribution. In addition to human Gelsolin-GS1 and Salmonella SpvB described in this paper candidate proteins included: GFP-P2A (self-cleavable peptide) tagged constitutively active human Cofilin(S3A) (ref. 26), Vibrio cholerae MARTX VC actin crosslinking domain (refs. 20,21), Salmonella SipA actin crosslinking minimal domain (ref. 22), Photorhabdus luminescens TccC3 actin stabilizing ADP ribosylation domain (ref. 23), and Clostridium botulinum C2I ADP ribosylation domain (refs. 24,25). (b) Representative micrographs from the screen. HeLa cells were transiently transfected with GFP-tagged constructs or latrunculin A then fixed and stained for actin filaments (594-phalloidin, red) and nuclei (DAPI, blue). Due to these being transient transfections, expression levels varied from cell to cell. N = 1 (cofilin, MARTX VC), 2 (SipA), or 4 (TccC3, C2I) independent experiments. Scale, 50 m.
 conserved in all actin homologs.")
3 Supplementary Figure 2 SpvB targets a conserved residue on actin. SpvB ADP-ribosylates a conserved arginine on actin monomers (R177 in human beta actin)(ref. 8). Lineup shows cytoplasmic and muscle actins from diverse eukaryotes, with this residue (highlighted in yellow) conserved in all actin homologs. Accordingly, DeAct- SpvB functions in all eukaryotes we have tested thus far. NCBI Reference sequence numbers are shown in parentheses.
4
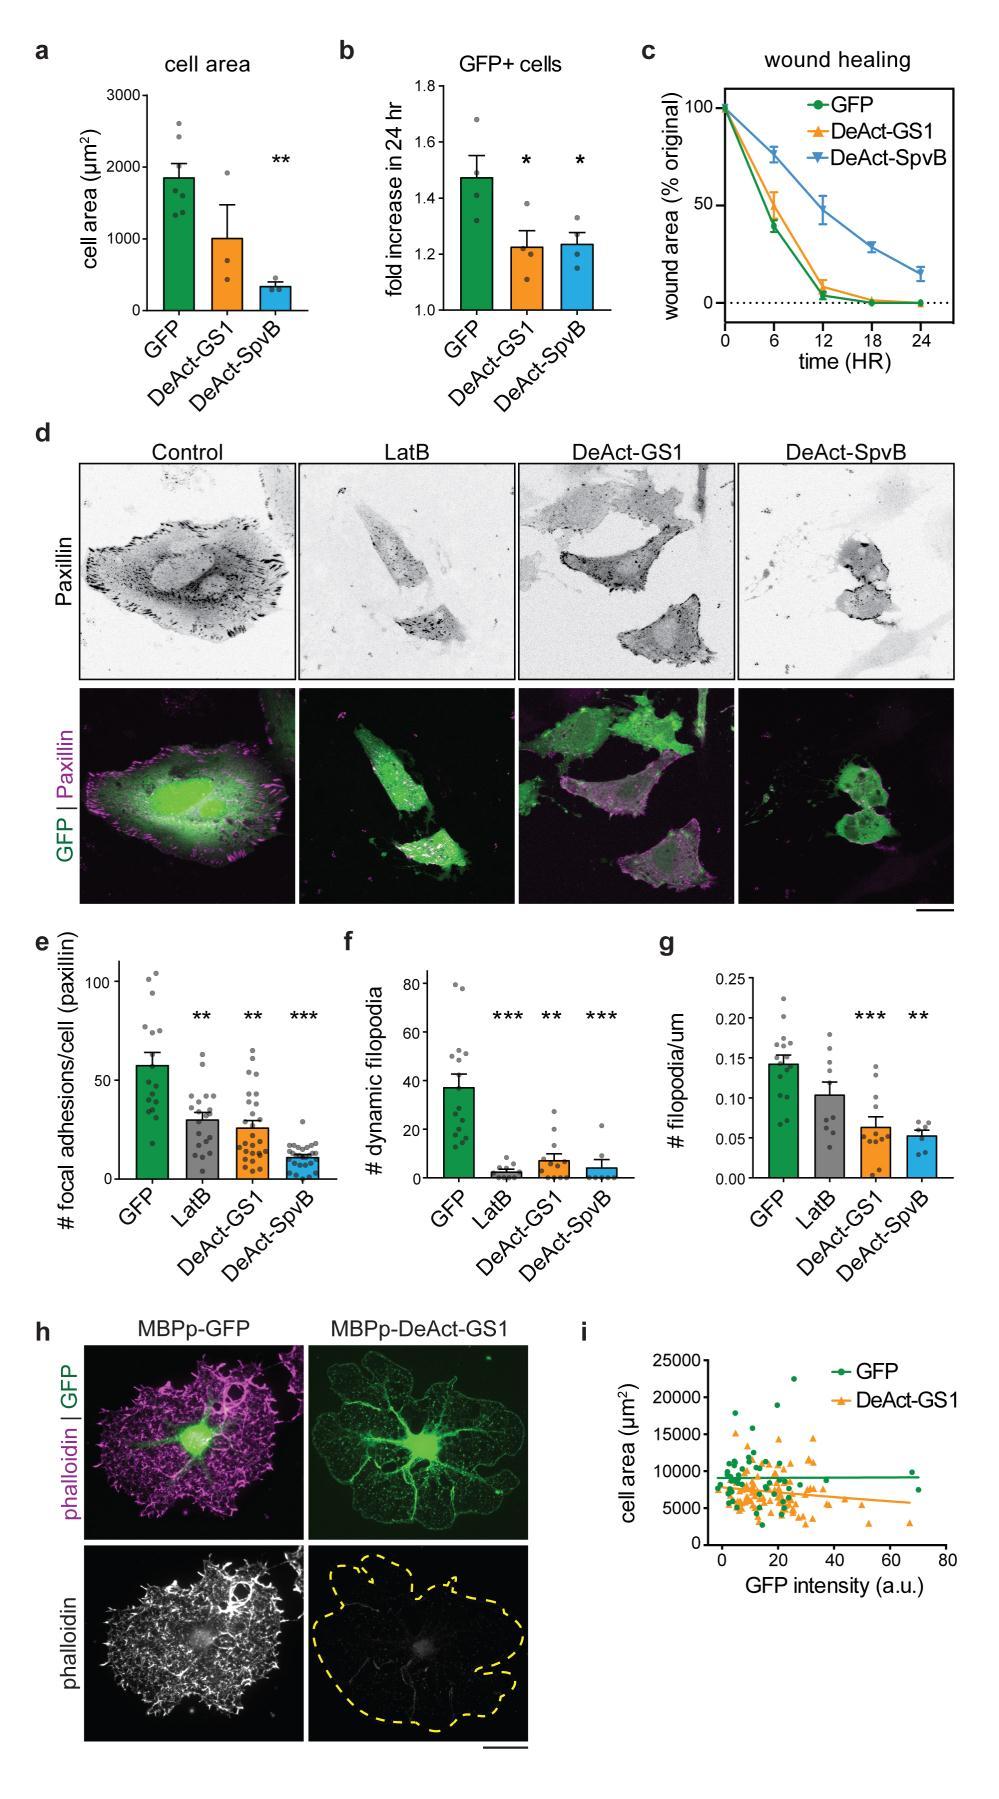
5 Supplementary Figure 3 Expression of DeActs in cultured cells. (a) DeActs decrease average cell surface area in HeLa cells. Graphs shows mean ± SEM. Statistical significance: one-way ANOVA and Dunn s multiple comparison post hoc test, **p<0.01; N = 3 independent experiments. (b) Live cell imaging to count HeLa cells expressing GFP, DeAct-GS1 or DeAct-SpvB at 24hr and 48hr post-transfection. Fold increase in GFP+ cells reflects the combination of proliferation and new expression minus cell death. *p<0.05, N = 4 independent experiments ( GFP+ cells per experiment). (c) Wound healing of rat embryonic fibroblasts transiently transfected with DeActs or GFP control and scratch-wounded at time zero. Note that no defect in would healing is observed upon DeAct-GS1 transfection, most probably due to the fraction of untransfected and low DeAct-GS1 expressing cells. N = 2 independent experiments. (d) HeLa cells co-expressing the focal adhesion marker tagrfp-paxillin (red; ref. 28) and GFP, DeAct-GS1 or DeAct-SpvB (green). GFP expressing cells were treated with 10 µm latrunculin B for 30 minutes. Scale, 20 µm. (e) DeActs decrease the number of focal adhesions per cell, visualized by paxillin overexpression. Treatment with latrunculin B has the same effect. Graphs show mean ± SEM. Statistical significance: one-way ANOVA and Dunn s multiple comparison post hoc test, ***p<0.001, **p<0.01 (N = 2 independent experiments for all conditions, n = 17, 20, 27, 28 cells, left to right). (f-g) Live-imaging of HeLa cells co-expressing GFP, DeAct-GS1 or DeAct-SpvB and MARCKS-tagRFP-T shows that DeActs decrease the number of dynamic filopodia (e) and the total number of filopodia per cell (f). Graphs show mean ± SEM. Statistical significance: one-way ANOVA and Dunn s multiple comparison post hoc test, ***p<0.001, **p<0.01, (N = 3, 2, 2, 2 independent experiments, n = 16, 10, 12, 7 cells, left to right). (see also Supplementary Video 1). (h-i) DeAct-GS1 induced loss of actin filaments in mature OLs does not affect cell area. Trend lines in i shows nonlinear (exponential) fit; each data point is one cell. Data are from a single experiment representative of N = 3 independent experiments.
6
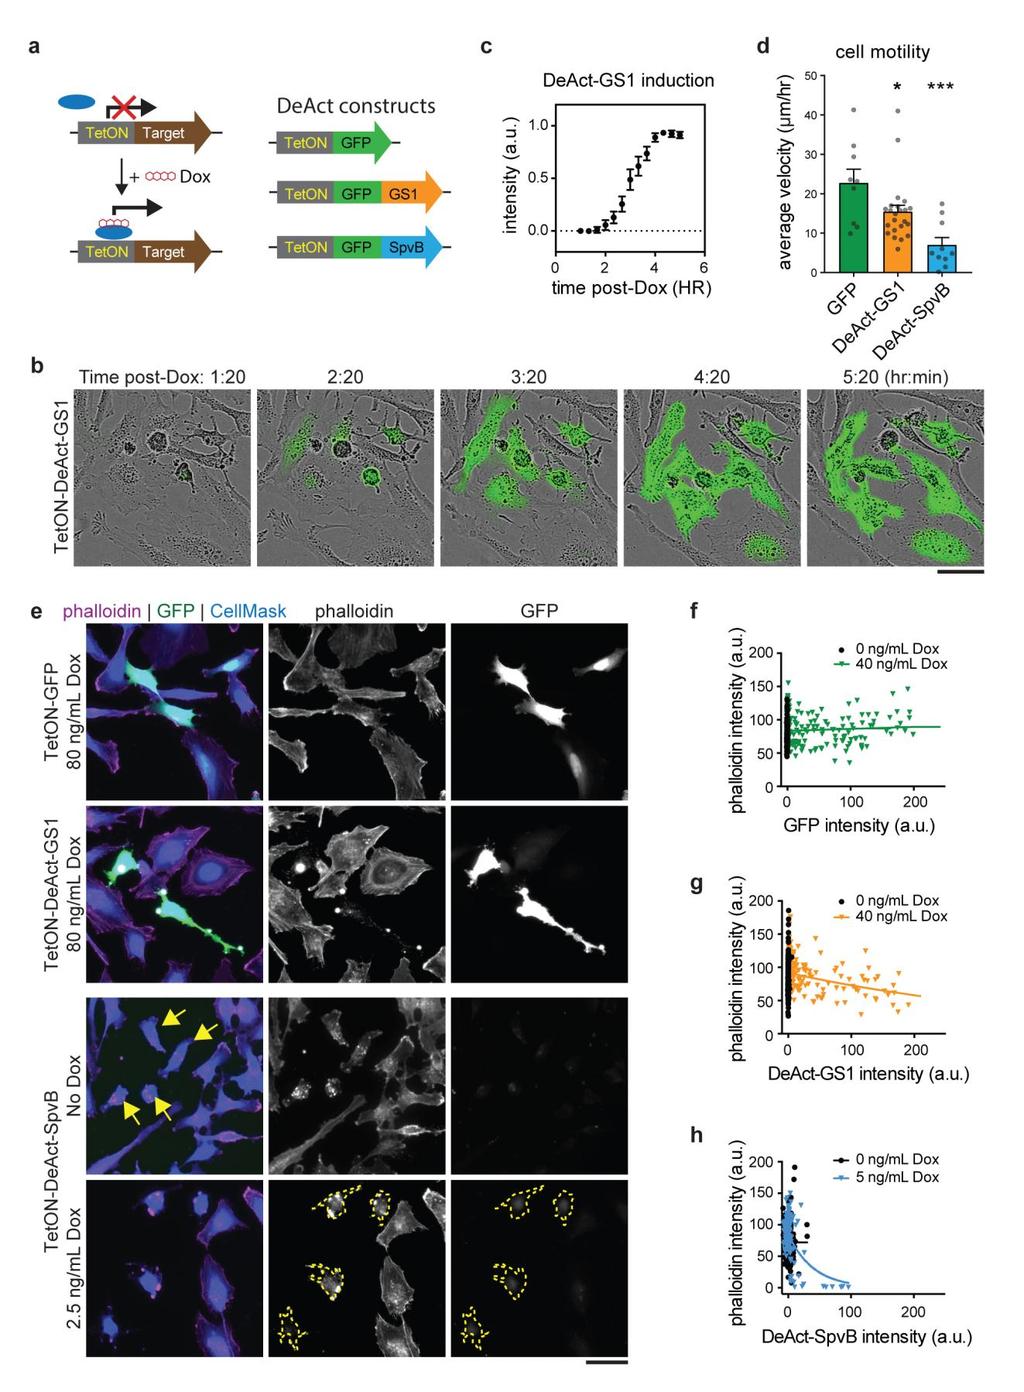
7 Supplementary Figure 4 Rapid induction of DeActs with third-generation TetON promoter. (a) Mechanism of action and construct design for doxycycline/tet-inducible DeActs using Clontech Tet-On 3G inducible expression vector. In presence of the tetracycline-regulated transactivator (Tet-On 3G, blue), doxycycline (Dox) induces dose-dependent expression from the TetON 3G promoter. Tet-On 3G HeLa cells (stably expressing Tet-On 3G transactivator; Clontech) were transfected with Tet-ON_GFP, TetON_DeAct-GS1, or TetON_DeAct-SpvB in (b-h). (b-c) Rapid induction of DeAct-Gsn expression. 24 hr post transfection, expression of TetON_DeAct-GS1 was induced by addition of 100 ng/ml Dox, and cells were imaged every 20 minutes. (b) shows frames from live cell imaging. (c) shows normalized GFP fluorescence following addition of Dox at time 0; average of 10 cells from one representative experiment of N = 3 independent experiments. (d) Live cell imaging of HeLa cells expressing TetON DeActs. Rate of single cell motility was measured after detection of GFP expression, imaging every 20 min for at least 3 hr. Statistical significance: one-way ANOVA and Dunnett s multiple comparison post hoc test, ***p<0.001, *p<0.05, n = 9, 23, 10 GFP+ cells, left to right. (e) Representative micrographs of cells expressing TetON DeActs. 24 hr post transfection, cells were treated with or without Dox as noted for 6 hr, then fixed and stained with Alexa 594-phalloidin and CellMask Blue to visualize cell morphology. (f-h) Cells were transfected with TetON_GFP (f), TetON_DeAct-Gsn (g) or TetON_DeAct-SpvB (h) as above and treated with or without Dox as noted overnight, then fixed and stained with Alexa 594-phalloidin. Scatter plots show actin filament level (phalloidin) as a function of DeAct expression; each data point is a single cell from one representative experiment of N = 2 independent experiments. Note that DeAct-SpvB expression intensities (h) are not comparable to GFP and DeAct-GS1 (f,g) due to low expression induced by 5 ng/ml Dox. Graphs in c,d show mean ± SEM. All scale bars, 50 m.
 Construct design for dual-promoter constructs with constitutive mcherry expression (CMV promoter) and inducible DeAct expression on the opposite strand.")
8 Supplementary Figure 5 Identification of transfected cells with dual-promoter, inducible DeActs. (a) Construct design for dual-promoter constructs with constitutive mcherry expression (CMV promoter) and inducible DeAct expression on the opposite strand. Left, dual-promoter TetON_DeAct-GS1; right, TetON_SpvB tagged with Escherichia coli dihydrofolate reductase destabilization domain (DHFRdd) with R12Y, G67S, Y100I mutations (ref. 11). (b-c) HeLa TetON 3G cells (stably expressing Tet transactivator protein) were transfected with dual-promoter CMV_mCherry/TetON_DeAct-GS1 (b) or CMV_mCherry/TetON_DHFRdd-SpvB constructs (c). After 24 hr DeAct expression was induced with 100 ng/ml Dox, then cells were fixed after 18 hr and stained for actin filaments with Alexa 647-phalloidin. (d-e) HeLa Tet-On 3G transfected as above were imaged every hour after addition of Dox. Note rapid induction of DeAct-GS1 visualized by GFP expression (d), and induction of attenuated (DHFRdd-tagged) SpvB demonstrated by rapid cell rounding (e). All scale bars, 50 m. b-e are representative micrographs from N = 3 independent experiments.
. Scale, 10 µm.")
9 Supplementary Figure 6 Expression of DeActs in neurons (a) A representative example of dynamic axonal branches from a 5 minute time lapse acquisition. Closed arrow heads indicate growth and open arrow heads represent no growth or retraction (see also Supplementary Video 3). Scale, 10 µm. (b-c) Cortical neuronal migration after in utero electroporation with GFP, DeAct-GS1, or DeAct-SpvB. Scale, 50 µm. (c) Quantification of neuronal morphologies of GFP-positive neurons which migrated past the IZ. 1, leading and trailing process; 2, leading process only; 3, no processes; 4, trailing process only (N = 3 embryos from 3 different litters, n = 104, 135, 38 cells GFP, DeAct-GS1, or DeAct- SpvB). Graphs show mean ± SEM. Statistical significance: one-way ANOVA and Dunnett s multiple comparison post hoc test, *p<0.05.
SUPPLEMENTARY INFORMATION
 Figure S1. Loss of Ena/VASP proteins inhibits filopodia and neuritogenesis. (a) Bar graph of filopodia number per stage 1 control and mmvvee (Mena/ VASP/EVL-null) neurons at 40hrs in culture. Loss of all
Supplementary Figure S1
 Supplementary Figure S1 Supplementary Figure S1. PARP localization patterns using GFP-PARP and PARP-specific antibody libraries GFP-PARP localization in non-fixed (A) and formaldehyde fixed (B) GFP-PARPx
SUPPLEMENTARY INFORMATION
 SUPPLEMENTARY INFORMATION Advances in pancreatic islet monolayer culture on glass surfaces enable superresolution microscopy and insights into beta cell ciliogenesis and proliferation Edward A. Phelps,
Supplementary information. The Light Intermediate Chain 2 Subpopulation of Dynein Regulates Mitotic. Spindle Orientation
 Supplementary information The Light Intermediate Chain 2 Subpopulation of Dynein Regulates Mitotic Spindle Orientation Running title: Dynein LICs distribute mitotic functions. Sagar Mahale a, d, *, Megha
Figure S1. HP1α localizes to centromeres in mitosis and interacts with INCENP. (A&B) HeLa
 HeLa") SUPPLEMENTARY FIGURES Figure S1. HP1α localizes to centromeres in mitosis and interacts with INCENP. (A&B) HeLa tet-on cells that stably express HP1α-CFP, HP1β-CFP, or HP1γ-CFP were monitored with livecell
SUPPLEMENTARY FIGURES Figure S1. HP1α localizes to centromeres in mitosis and interacts with INCENP. (A&B) HeLa tet-on cells that stably express HP1α-CFP, HP1β-CFP, or HP1γ-CFP were monitored with livecell
a 0,8 Figure S1 8 h 12 h y = 0,036x + 0,2115 y = 0,0366x + 0,206 Labeling index Labeling index ctrl shrna Time (h) Time (h) ctrl shrna S G2 M G1
 Time (h) ctrl shrna S G2 M G1") (GFP+ BrdU+)/GFP+ Labeling index Labeling index Figure S a, b, y =,x +, y =,x +,,,,,,,, Time (h) - - Time (h) c d S G M G h M G S G M G S G h Time of BrdU injection after electroporation (h) M G S G M
(GFP+ BrdU+)/GFP+ Labeling index Labeling index Figure S a, b, y =,x +, y =,x +,,,,,,,, Time (h) - - Time (h) c d S G M G h M G S G M G S G h Time of BrdU injection after electroporation (h) M G S G M
Supplementary Figure 1
 Supplementary Figure 1 Kif1a RNAi effect on basal progenitor differentiation Related to Figure 2. Representative confocal images of the VZ and SVZ of rat cortices transfected at E16 with scrambled or Kif1a
Effects of UBL5 knockdown on cell cycle distribution and sister chromatid cohesion
 Supplementary Figure S1. Effects of UBL5 knockdown on cell cycle distribution and sister chromatid cohesion A. Representative examples of flow cytometry profiles of HeLa cells transfected with indicated
SUPPLEMENTARY LEGENDS...
 TABLE OF CONTENTS SUPPLEMENTARY LEGENDS... 2 11 MOVIE S1... 2 FIGURE S1 LEGEND... 3 FIGURE S2 LEGEND... 4 FIGURE S3 LEGEND... 5 FIGURE S4 LEGEND... 6 FIGURE S5 LEGEND... 7 FIGURE S6 LEGEND... 8 FIGURE
genome edited transient transfection, CMV promoter
 Supplementary Figure 1. In the absence of new protein translation, overexpressed caveolin-1-gfp is degraded faster than caveolin-1-gfp expressed from the endogenous caveolin 1 locus % loss of total caveolin-1-gfp
Supplemental Materials Molecular Biology of the Cell
 Supplemental Materials Molecular Biology of the Cell Gilberti et al. SUPPLEMENTAL FIGURE LEGENDS: Figure S1: The effect of pharmacological inhibitors on particle uptake. The data presented in Figure 1
Supplemental Materials. STK16 regulates actin dynamics to control Golgi organization and cell cycle
 Supplemental Materials STK16 regulates actin dynamics to control Golgi organization and cell cycle Juanjuan Liu 1,2,3, Xingxing Yang 1,3, Binhua Li 1, Junjun Wang 1,2, Wenchao Wang 1, Jing Liu 1, Qingsong
MII. Supplement Figure 1. CapZ β2. Merge. 250ng. 500ng DIC. Merge. Journal of Cell Science Supplementary Material. GFP-CapZ β2 DNA
 A GV GVBD MI DNA CapZ β2 CapZ β2 Merge B DIC GFP-CapZ β2 Merge CapZ β2-gfp 250ng 500ng Supplement Figure 1. MII A early MI late MI Control RNAi CapZαβ DNA Actin Tubulin B Phalloidin Intensity(A.U.) n=10
Supplementary Materials
 Supplementary Materials Supplementary Figure S1 Regulation of Ubl4A stability by its assembly partner A, The translation rate of Ubl4A is not affected in the absence of Bag6. Control, Bag6 and Ubl4A CRISPR
Supplemental Materials Molecular Biology of the Cell
 Supplemental Materials Molecular Biology of the Cell Garcia-Alvarez et al. Supplementary Figure Legends Figure S1.Expression and RNAi-mediated silencing of STIM1 in hippocampal neurons (DIV, days in vitro).
Supplementary Figure 1. Properties of various IZUMO1 monoclonal antibodies and behavior of SPACA6. (a) (b) (c) (d) (e) (f) (g) .
 (b) (c) (d) (e) (f) (g) .") Supplementary Figure 1. Properties of various IZUMO1 monoclonal antibodies and behavior of SPACA6. (a) The inhibitory effects of new antibodies (Mab17 and Mab18). They were investigated in in vitro fertilization
Supplementary Figure 1. Properties of various IZUMO1 monoclonal antibodies and behavior of SPACA6. (a) The inhibitory effects of new antibodies (Mab17 and Mab18). They were investigated in in vitro fertilization
Supplementary Figure 1: GFAP positive nerves in patients with adenocarcinoma of
 SUPPLEMENTARY FIGURES AND MOVIE LEGENDS Supplementary Figure 1: GFAP positive nerves in patients with adenocarcinoma of the pancreas. (A) Images of nerves stained for GFAP (green), S100 (red) and DAPI
El Azzouzi et al., http ://www.jcb.org /cgi /content /full /jcb /DC1
 Supplemental material JCB El Azzouzi et al., http ://www.jcb.org /cgi /content /full /jcb.201510043 /DC1 THE JOURNAL OF CELL BIOLOGY Figure S1. Acquisition of -phluorin correlates negatively with podosome
Supplementary Figure 1. Characterization of NMuMG-ErbB2 and NIC breast cancer cells expressing shrnas targeting LPP. NMuMG-ErbB2 cells (a) and NIC
 and NIC") Supplementary Figure 1. Characterization of NMuMG-ErbB2 and NIC breast cancer cells expressing shrnas targeting LPP. NMuMG-ErbB2 cells (a) and NIC cells (b) were engineered to stably express either a LucA-shRNA
Supplementary Figure 1. Characterization of NMuMG-ErbB2 and NIC breast cancer cells expressing shrnas targeting LPP. NMuMG-ErbB2 cells (a) and NIC cells (b) were engineered to stably express either a LucA-shRNA
Type of file: PDF Title of file for HTML: Supplementary Information Description: Supplementary Figures
 Type of file: PDF Title of file for HTML: Supplementary Information Description: Supplementary Figures Type of file: MOV Title of file for HTML: Supplementary Movie 1 Description: NLRP3 is moving along
Nature Structural and Molecular Biology: doi: /nsmb Supplementary Figure 1
 Supplementary Figure 1 Mutational analysis of the SA2-Scc1 interaction in vitro and in human cells. (a) Autoradiograph (top) and Coomassie stained gel (bottom) of 35 S-labeled Myc-SA2 proteins (input)
T H E J O U R N A L O F C E L L B I O L O G Y
 T H E J O U R N A L O F C E L L B I O L O G Y Supplemental material Dunsch et al., http://www.jcb.org/cgi/content/full/jcb.201202112/dc1 Figure S1. Characterization of HMMR and CHICA antibodies. (A) HeLa
MCB Topic 19 Regulation of Actin Assembly- Prof. David Rivier
 MCB 252 -Topic 19 Regulation of Actin Assembly- Prof. David Rivier MCB 252 Spring 2017 MCB 252 Cell Biology Topic 19 Regulation of Actin Assembly Reading: Lodish 17.2-17.3, 17.7 MCB 252 Actin Cytoskeleton
(a) Schematic diagram of the FS mutation of UVRAG in exon 8 containing the highly instable
 Schematic diagram of the FS mutation of UVRAG in exon 8 containing the highly instable") Supplementary Figure 1. Frameshift (FS) mutation in UVRAG. (a) Schematic diagram of the FS mutation of UVRAG in exon 8 containing the highly instable A 10 DNA repeat, generating a premature stop codon
Supplementary Figure 1. Frameshift (FS) mutation in UVRAG. (a) Schematic diagram of the FS mutation of UVRAG in exon 8 containing the highly instable A 10 DNA repeat, generating a premature stop codon
Serafino et al. Thymosin α1 activates complement receptor-mediated phagocytosis in human monocyte-derived macrophages. SUPPLEMENTARY FIGURES
 Supplementary Fig. S1. Evaluation of the purity and maturation of macrophage cultures tested by flow cytometry. The lymphocytic/monocytic cellular fraction was isolated from buffy coats of healthy donors
Supplementary Materials for
 www.sciencetranslationalmedicine.org/cgi/content/full/4/117/117ra8/dc1 Supplementary Materials for Notch4 Normalization Reduces Blood Vessel Size in Arteriovenous Malformations Patrick A. Murphy, Tyson
SUPPLEMENTARY FIGURES
 SUPPLEMENTARY FIGURES Supplementary Figure S1: Fibroblast-induced elongation of cancer cells requires direct contact with living fibroblasts. A. Representative images of HT29-GFP cultured in the presence
SUPPLEMENTARY INFORMATION
 DOI: 10.1038/ncb2988 Supplementary Figure 1 Kif7 L130P encodes a stable protein that does not localize to cilia tips. (a) Immunoblot with KIF7 antibody in cell lysates of wild-type, Kif7 L130P and Kif7
Supplementary Figure 1. Microglia do not show signs of classical immune activation following MD a-b. Images showing immunoreactivity for MHCII (a)
") 1 Supplementary Figure 1. Microglia do not show signs of classical immune activation following MD a-b. Images showing immunoreactivity for MHCII (a) and CD45 (b) in fixed sections of binocular visual cortex
1 Supplementary Figure 1. Microglia do not show signs of classical immune activation following MD a-b. Images showing immunoreactivity for MHCII (a) and CD45 (b) in fixed sections of binocular visual cortex
A. Generation and characterization of Ras-expressing autophagycompetent
 Supplemental Material Supplemental Figure Legends Fig. S1 A. Generation and characterization of Ras-expressing autophagycompetent and -deficient cell lines. HA-tagged H-ras V12 was stably expressed in
Supplementary figure legends
 Supplementary figure legends Supplementary Figure 1. Exposure of CRT occurs independently from the apoptosisassociated loss of the mitochondrial membrane potential (MMP). (A) HeLa cells treated with MTX
Figure S1: Effects on haptotaxis are independent of effects on cell velocity A)
") Supplemental Figures Figure S1: Effects on haptotaxis are independent of effects on cell velocity A) Velocity of MV D7 fibroblasts expressing different GFP-tagged Ena/VASP family proteins in the haptotaxis
Supplemental Figures Figure S1: Effects on haptotaxis are independent of effects on cell velocity A) Velocity of MV D7 fibroblasts expressing different GFP-tagged Ena/VASP family proteins in the haptotaxis
Supplementary Figure 1: si-craf but not si-braf sensitizes tumor cells to radiation.
 Supplementary Figure 1: si-craf but not si-braf sensitizes tumor cells to radiation. (a) Embryonic fibroblasts isolated from wildtype (WT), BRAF -/-, or CRAF -/- mice were irradiated (6 Gy) and DNA damage
293T cells were transfected with indicated expression vectors and the whole-cell extracts were subjected
 SUPPLEMENTARY INFORMATION Supplementary Figure 1. Formation of a complex between Slo1 and CRL4A CRBN E3 ligase. (a) HEK 293T cells were transfected with indicated expression vectors and the whole-cell
Nature Neuroscience: doi: /nn Supplementary Figure 1. Neuron class-specific arrangements of Khc::nod::lacZ label in dendrites.
 Supplementary Figure 1 Neuron class-specific arrangements of Khc::nod::lacZ label in dendrites. Staining with fluorescence antibodies to detect GFP (Green), β-galactosidase (magenta/white). (a, b) Class
SUPPLEMENTARY INFORMATION
 DOI: 10.1038/ncb3443 In the format provided by the authors and unedited. Supplementary Figure 1 TC and SC behaviour during ISV sprouting. (a) Predicted outcome of TC division and competitive Dll4-Notch-mediated
SUPPLEMENTARY INFORMATION
 DOI: 10.1038/ncb3076 Supplementary Figure 1 btrcp targets Cep68 for degradation during mitosis. a) Cep68 immunofluorescence in interphase and metaphase. U-2OS cells were transfected with control sirna
Fig. S1. Subcellular localization of overexpressed LPP3wt-GFP in COS-7 and HeLa cells. Cos7 (top) and HeLa (bottom) cells expressing for 24 h human
 and HeLa (bottom) cells expressing for 24 h human") Fig. S1. Subcellular localization of overexpressed LPP3wt-GFP in COS-7 and HeLa cells. Cos7 (top) and HeLa (bottom) cells expressing for 24 h human LPP3wt-GFP, fixed and stained for GM130 (A) or Golgi97
Fig. S1. Subcellular localization of overexpressed LPP3wt-GFP in COS-7 and HeLa cells. Cos7 (top) and HeLa (bottom) cells expressing for 24 h human LPP3wt-GFP, fixed and stained for GM130 (A) or Golgi97
SUPPLEMENTARY INFORMATION
 DOI:.38/ncb3399 a b c d FSP DAPI 5mm mm 5mm 5mm e Correspond to melanoma in-situ Figure a DCT FSP- f MITF mm mm MlanaA melanoma in-situ DCT 5mm FSP- mm mm mm mm mm g melanoma in-situ MITF MlanaA mm mm
Supplementary Figure S1 Expression of mir-181b in EOC (A) Kaplan-Meier
 Kaplan-Meier") Supplementary Figure S1 Expression of mir-181b in EOC (A) Kaplan-Meier curves for progression-free survival (PFS) and overall survival (OS) in a cohort of patients (N=52) with stage III primary ovarian
Supplementary Figure S1 Expression of mir-181b in EOC (A) Kaplan-Meier curves for progression-free survival (PFS) and overall survival (OS) in a cohort of patients (N=52) with stage III primary ovarian
Supplementary Materials for
 www.sciencesignaling.org/cgi/content/full/7/308/ra4/dc1 Supplementary Materials for Antipsychotics Activate mtorc1-dependent Translation to Enhance Neuronal Morphological Complexity Heather Bowling, Guoan
Nature Medicine: doi: /nm.4322
 1 2 3 4 5 6 7 8 9 10 11 Supplementary Figure 1. Predicted RNA structure of 3 UTR and sequence alignment of deleted nucleotides. (a) Predicted RNA secondary structure of ZIKV 3 UTR. The stem-loop structure
Supplementary Figure 1
 Supplementary Figure 1 Supplementary Figure 1 SNARE Probes for FRET/2pFLIM Analysis Used in the Present Study. mturquoise (mtq) and Venus (Ven) are in blue and yellow, respectively. The soluble N-ethylmaleimide-sensitive
Nature Biotechnology: doi: /nbt.3828
 Supplementary Figure 1 Development of a FRET-based MCS. (a) Linker and MA2 modification are indicated by single letter amino acid code. indicates deletion of amino acids and N or C indicate the terminus
SUPPLEMENTARY INFORMATION
 sirna pool: Control Tetherin -HA-GFP HA-Tetherin -Tubulin Supplementary Figure S1. Knockdown of HA-tagged tetherin expression by tetherin specific sirnas. HeLa cells were cotransfected with plasmids expressing
Supplementary Figure 1. Electroporation of a stable form of β-catenin causes masses protruding into the IV ventricle. HH12 chicken embryos were
 Supplementary Figure 1. Electroporation of a stable form of β-catenin causes masses protruding into the IV ventricle. HH12 chicken embryos were electroporated with β- Catenin S33Y in PiggyBac expression
SUPPLEMENTARY INFORMATION
 Figure S1 Treatment with both Sema6D and Plexin-A1 sirnas induces the phenotype essentially identical to that induced by treatment with Sema6D sirna alone or Plexin-A1 sirna alone. (a,b) The cardiac tube
Prolonged mitotic arrest induces a caspase-dependent DNA damage
 SUPPLEMENTARY INFORMATION Prolonged mitotic arrest induces a caspase-dependent DNA damage response at telomeres that determines cell survival Karolina O. Hain, Didier J. Colin, Shubhra Rastogi, Lindsey
nature methods Organelle-specific, rapid induction of molecular activities and membrane tethering
 nature methods Organelle-specific, rapid induction of molecular activities and membrane tethering Toru Komatsu, Igor Kukelyansky, J Michael McCaffery, Tasuku Ueno, Lidenys C Varela & Takanari Inoue Supplementary
Supplementary Information
 Supplementary Information Title Degeneration and impaired regeneration of gray matter oligodendrocytes in amyotrophic lateral sclerosis Authors Shin H. Kang, Ying Li, Masahiro Fukaya, Ileana Lorenzini,
SUPPLEMENTARY INFORMATION
 doi: 10.1038/nature06994 A phosphatase cascade by which rewarding stimuli control nucleosomal response A. Stipanovich*, E. Valjent*, M. Matamales*, A. Nishi, J.H. Ahn, M. Maroteaux, J. Bertran-Gonzalez,
Interleukin-6 promotes pancreatic cancer cell migration by rapidly activating the small GTPase CDC42
 Interleukin-6 promotes pancreatic cancer cell migration by rapidly activating the small GTPase CDC42 Gina L. Razidlo, Kevin M. Burton, and Mark A. McNiven SUPPORTING INFORMATION Figure S1. IL-6 promotes
ERK1/2/MAPK pathway-dependent regulation of the telomeric factor TRF2
 ERK1/2/MAPK pathway-dependent regulation of the telomeric factor TRF2 SUPPLEMENTARY FIGURES AND TABLE Supplementary Figure S1: Conservation of the D domain throughout evolution. Alignment of TRF2 sequences
SUPPLEMENT. Materials and methods
 SUPPLEMENT Materials and methods Cell culture and reagents Cell media and reagents were from Invitrogen unless otherwise indicated. Antibiotics and Tet-certified serum were from Clontech. In experiments
SUPPLEMENTARY INFORMATION
 doi:10.1038/nature12652 Supplementary Figure 1. PRDM16 interacts with endogenous EHMT1 in brown adipocytes. Immunoprecipitation of PRDM16 complex by flag antibody (M2) followed by Western blot analysis
SUPPLEMENTARY INFORMATION
 In the format provided by the authors and unedited. 2 3 4 DOI: 10.1038/NMAT4893 EGFR and HER2 activate rigidity sensing only on rigid matrices Mayur Saxena 1,*, Shuaimin Liu 2,*, Bo Yang 3, Cynthia Hajal
Influenza virus exploits tunneling nanotubes for cell-to-cell spread
 Supplementary Information Influenza virus exploits tunneling nanotubes for cell-to-cell spread Amrita Kumar 1, Jin Hyang Kim 1, Priya Ranjan 1, Maureen G. Metcalfe 2, Weiping Cao 1, Margarita Mishina 1,
Santulli G. et al. A microrna-based strategy to suppress restenosis while preserving endothelial function
 ONLINE DATA SUPPLEMENTS Santulli G. et al. A microrna-based strategy to suppress restenosis while preserving endothelial function Supplementary Figures Figure S1 Effect of Ad-p27-126TS on the expression
Rapid blue-light mediated induction of protein interactions in living cells
 Nature Methods Rapid blue-light mediated induction of protein interactions in living cells Matthew J Kennedy, Robert M Hughes, Leslie A Peteya, Joel W Schwartz, Michael D Ehlers & Chandra L Tucker Supplementary
The subcortical maternal complex controls symmetric division of mouse zygotes by
 The subcortical maternal complex controls symmetric division of mouse zygotes by regulating F-actin dynamics Xing-Jiang Yu 1,2, Zhaohong Yi 1, Zheng Gao 1,2, Dan-dan Qin 1,2, Yanhua Zhai 1, Xue Chen 1,
Near-infrared fluorescent proteins
 nature methods Near-infrared fluorescent proteins Dmitry Shcherbo, Irina I Shemiakina, Anastasiya V Ryabova, Kathryn E Luker, Bradley T Schmidt, Ekaterina A Souslova, Tatiana V Gorodnicheva, Lydia Strukova,
Rapid parallel measurements of macroautophagy and mitophagy in
 Supplemental Figures Rapid parallel measurements of macroautophagy and mitophagy in mammalian cells using a single fluorescent biosensor Sargsyan A, Cai J, Fandino LB, Labasky ME, Forostyan T, Colosimo
SUPPLEMENTARY FIGURE LEGENDS
 SUPPLEMENTARY FIGURE LEGENDS Supplemental FIG. 1. Localization of myosin Vb in cultured neurons varies with maturation stage. A and B, localization of myosin Vb in cultured hippocampal neurons. A, in DIV
Supplementary Figure 1. EC-specific Deletion of Snail1 Does Not Affect EC Apoptosis. (a,b) Cryo-sections of WT (a) and Snail1 LOF (b) embryos at
 Cryo-sections of WT (a) and Snail1 LOF (b) embryos at") Supplementary Figure 1. EC-specific Deletion of Snail1 Does Not Affect EC Apoptosis. (a,b) Cryo-sections of WT (a) and Snail1 LOF (b) embryos at E10.5 were double-stained for TUNEL (red) and PECAM-1 (green).
Supplementary Figure 1. EC-specific Deletion of Snail1 Does Not Affect EC Apoptosis. (a,b) Cryo-sections of WT (a) and Snail1 LOF (b) embryos at E10.5 were double-stained for TUNEL (red) and PECAM-1 (green).
SUPPLEMENTARY INFORMATION
 DOI:.38/ncb2822 a MTC02 FAO cells EEA1 b +/+ MEFs /DAPI -/- MEFs /DAPI -/- MEFs //DAPI c HEK 293 cells WCE N M C P AKT TBC1D7 Lamin A/C EEA1 VDAC d HeLa cells WCE N M C P AKT Lamin A/C EEA1 VDAC Figure
NLRX1: 5 -GCTCCATGGCTTAGAGCATC-3 (forward) 5 -AACTCCTCCTCCGTCCTGAT-3 (reverse) β-actin
 5 -AACTCCTCCTCCGTCCTGAT-3 (reverse) β-actin") NLRX1 β-actin 1 2 3 4 5 6 1 2 3 4 5 6 NLRX1 (667 bp) β-actin (523 bp) Supplementary Figure 1: Expression of NLRX1 in human cell lines. 1: HeLa, 2: HEK293T, 3: MCF-7, 4:Ramos, 5:Jurkat, 6: THP1. The following
NLRX1 β-actin 1 2 3 4 5 6 1 2 3 4 5 6 NLRX1 (667 bp) β-actin (523 bp) Supplementary Figure 1: Expression of NLRX1 in human cell lines. 1: HeLa, 2: HEK293T, 3: MCF-7, 4:Ramos, 5:Jurkat, 6: THP1. The following
A. List of selected proteins with high SILAC (H/L) ratios identified in mass
 ratios identified in mass") Supplementary material Figure S1. Interaction between UBL5 and FANCI A. List of selected proteins with high SILAC (H/L) ratios identified in mass spectrometry (MS)-based analysis of UBL5-interacting proteins,
Supplementary material Figure S1. Interaction between UBL5 and FANCI A. List of selected proteins with high SILAC (H/L) ratios identified in mass spectrometry (MS)-based analysis of UBL5-interacting proteins,
SUPPLEMENTARY FIGURES AND TABLE
 SUPPLEMENTARY FIGURES AND TABLE Supplementary Figure S1: Characterization of IRE1α mutants. A. U87-LUC cells were transduced with the lentiviral vector containing the GFP sequence (U87-LUC Tet-ON GFP).
JCB. Supplemental material. Gu et al.,
 Supplemental material Gu et al., http://www.jcb.org/cgi/content/full/jcb.201010075/dc1 T H E J O U R N A L O F C E L L B I O L O G Y Figure S1. S1P directly induces actin assembly. Actin assembly at the
Figure S1. (A) SDS-PAGE separation of GST-fusion proteins purified from E.coli BL21 strain is shown. An equal amount of GST-tag control, LRRK2 LRR
 SDS-PAGE separation of GST-fusion proteins purified from E.coli BL21 strain is shown. An equal amount of GST-tag control, LRRK2 LRR") Figure S1. (A) SDS-PAGE separation of GST-fusion proteins purified from E.coli BL21 strain is shown. An equal amount of GST-tag control, LRRK2 LRR and LRRK2 WD40 GST fusion proteins (5 µg) were loaded
Figure S1. (A) SDS-PAGE separation of GST-fusion proteins purified from E.coli BL21 strain is shown. An equal amount of GST-tag control, LRRK2 LRR and LRRK2 WD40 GST fusion proteins (5 µg) were loaded
Dramatic increase in SHP2 binding activity of Helicobacter. pylori Western CagA by EPIYA-C duplication: its
 Supplementary Information Dramatic increase in SHP2 binding activity of Helicobacter pylori Western CagA by EPIYA-C duplication: its implications in gastric carcinogenesis Lisa Nagase, Takeru Hayashi,
Supplementary Figure 1. Normal T lymphocyte populations in Dapk -/- mice. (a) Normal thymic development in Dapk -/- mice. Thymocytes from WT and Dapk
 Normal thymic development in Dapk -/- mice. Thymocytes from WT and Dapk") Supplementary Figure 1. Normal T lymphocyte populations in Dapk -/- mice. (a) Normal thymic development in Dapk -/- mice. Thymocytes from WT and Dapk -/- mice were stained for expression of CD4 and CD8.
Supplementary Figure 1. Normal T lymphocyte populations in Dapk -/- mice. (a) Normal thymic development in Dapk -/- mice. Thymocytes from WT and Dapk -/- mice were stained for expression of CD4 and CD8.
Tumor suppressor Spred2 interaction with LC3 promotes autophagosome maturation and induces autophagy-dependent cell death
 www.impactjournals.com/oncotarget/ Oncotarget, Supplementary Materials 2016 Tumor suppressor Spred2 interaction with LC3 promotes autophagosome maturation and induces autophagy-dependent cell death Supplementary
Cofilin is one crucial mediator of actin cytoskeletal dynamics
 Chronophin coordinates cell leading edge dynamics by controlling active cofilin levels Violaine Delorme-Walker a,b, Ji-Yeon Seo a,b, Antje Gohla c, Bruce Fowler a,b, Ben Bohl a,b, and Céline DerMardirossian
Supplementary Figure 1 Maschalidi et al.
 a 1% 5% % 1% 5% % OVAb βgal activity A.U. (x1 4 ) 2 1 5 βgal activity A.U. (x1 4 ) 2 1 BSAb 2 hours 4 hours OVAb BSAb OVAb BSAb,1 1 1 1 SIINFEKL (ng/ml) CFSE b Beads Alexa488 (%) 8 6 4 2 ** ** 1:1 5:1
Supplementary Figure 1
 Supplementary Figure 1 Asymmetrical function of 5p and 3p arms of mir-181 and mir-30 families and mir-142 and mir-154. (a) Control experiments using mirna sensor vector and empty pri-mirna overexpression
SUPPLEMENTARY FIGURES
 SUPPLEMENTARY FIGURES 1 Supplementary Figure 1, Adult hippocampal QNPs and TAPs uniformly express REST a-b) Confocal images of adult hippocampal mouse sections showing GFAP (green), Sox2 (red), and REST
Supplementary Figure 1. Nature Neuroscience: doi: /nn.4547
 Supplementary Figure 1 Characterization of the Microfetti mouse model. (a) Gating strategy for 8-color flow analysis of peripheral Ly-6C + monocytes from Microfetti mice 5-7 days after TAM treatment. Living
Supplementary Materials for
 www.sciencesignaling.org/cgi/content/full/10/487/eaag2476/dc1 Supplementary Materials for Gene expression profiles of brain endothelial cells during embryonic development at bulk and single-cell levels
Supplementary Figure 1 Expression of Crb3 in mouse sciatic nerve: biochemical analysis (a) Schematic of Crb3 isoforms, ERLI and CLPI, indicating the
 Schematic of Crb3 isoforms, ERLI and CLPI, indicating the") Supplementary Figure 1 Expression of Crb3 in mouse sciatic nerve: biochemical analysis (a) Schematic of Crb3 isoforms, ERLI and CLPI, indicating the location of the transmembrane (TM), FRM binding (FB)
Supplementary Figure 1 Expression of Crb3 in mouse sciatic nerve: biochemical analysis (a) Schematic of Crb3 isoforms, ERLI and CLPI, indicating the location of the transmembrane (TM), FRM binding (FB)
SUPPLEMENTARY INFORMATION
 b 350 300 250 200 150 100 50 0 E0 E10 E50 E0 E10 E50 E0 E10 E50 E0 E10 E50 Number of organoids per well 350 300 250 200 150 100 50 0 R0 R50 R100 R500 1st 2nd 3rd Noggin 100 ng/ml Noggin 10 ng/ml Noggin
SUPPLEMENTARY INFORMATION
 DOI: 10.1038/ncb2638 Figure S1 Morphological characteristics of fetal testes and ovaries from 6.5-20 developmental weeks. Representative images of Hematoxylin and Eosin staining of testes and ovaries over
supplementary information
 DOI: 10.1038/ncb2133 Figure S1 Actomyosin organisation in human squamous cell carcinoma. (a) Three examples of actomyosin organisation around the edges of squamous cell carcinoma biopsies are shown. Myosin
Social deficits in Shank3-deficient mouse models of autism are rescued by histone deacetylase (HDAC) inhibition
 inhibition") SUPPLEMENTARY INFORMATION Articles https://doi.org/10.1038/s41593-018-0110-8 In the format provided by the authors and unedited. Social deficits in Shank3-deficient mouse models of autism are rescued by
SUPPLEMENTARY INFORMATION Articles https://doi.org/10.1038/s41593-018-0110-8 In the format provided by the authors and unedited. Social deficits in Shank3-deficient mouse models of autism are rescued by
Supplementary Materials for
 www.sciencesignaling.org/cgi/content/full/6/283/ra57/dc1 Supplementary Materials for JNK3 Couples the Neuronal Stress Response to Inhibition of Secretory Trafficking Guang Yang,* Xun Zhou, Jingyan Zhu,
Supplementary Figure 1. Quantile-quantile (Q-Q) plots. (Panel A) Q-Q plot graphical
 plots. (Panel A) Q-Q plot graphical") Supplementary Figure 1. Quantile-quantile (Q-Q) plots. (Panel A) Q-Q plot graphical representation using all SNPs (n= 13,515,798) including the region on chromosome 1 including SORT1 which was previously
Supplementary Figure 1. Quantile-quantile (Q-Q) plots. (Panel A) Q-Q plot graphical representation using all SNPs (n= 13,515,798) including the region on chromosome 1 including SORT1 which was previously
Supplementary Information
 Supplementary Information Supplementary Figure 1: cholesterol manipulation alters the positioning of autophagosomes in cells, related to figure 1. (a) HeLa cells were treated for 24h under conditions reducing
a Anti-Dab2 RGD Merge
 a Anti-Da Merge *** ** Percentage of cells adhered 8 6 4 RGE RAD RGE RAD Supplementary Figure Da are localized at clusters. (a) Endogenous Da is localized at clusters. (), ut not RGE nor RAD peptides can
SUPPLEMENTARY INFORMATION
 doi:10.1038/nature10188 Supplementary Figure 1. Embryonic epicardial genes are down-regulated from midgestation stages and barely detectable post-natally. Real time qrt-pcr revealed a significant down-regulation
(A) SW480, DLD1, RKO and HCT116 cells were treated with DMSO or XAV939 (5 µm)
 SW480, DLD1, RKO and HCT116 cells were treated with DMSO or XAV939 (5 µm)") Supplementary Figure Legends Figure S1. Tankyrase inhibition suppresses cell proliferation in an axin/β-catenin independent manner. (A) SW480, DLD1, RKO and HCT116 cells were treated with DMSO or XAV939
Supplementary Figure Legends Figure S1. Tankyrase inhibition suppresses cell proliferation in an axin/β-catenin independent manner. (A) SW480, DLD1, RKO and HCT116 cells were treated with DMSO or XAV939
Boucher et al NCOMMS B
 1 Supplementary Figure 1 (linked to Figure 1). mvegfr1 constitutively internalizes in endothelial cells. (a) Immunoblot of mflt1 from undifferentiated mouse embryonic stem (ES) cells with indicated genotypes;
F-actin VWF Vinculin. F-actin. Vinculin VWF
 a F-actin VWF Vinculin b F-actin VWF Vinculin Supplementary Fig. 1. WPBs in HUVECs are located along stress fibers and at focal adhesions. (a) Immunofluorescence images of f-actin (cyan), VWF (yellow),
Title: Vectorization of biomacromolecules into cells using extracellular vesicles with enhanced internalization induced by macropinocytosis
 Scientific Reports Supplementary information Title: Vectorization of biomacromolecules into cells using extracellular vesicles with enhanced internalization induced by macropinocytosis Authors: Ikuhiko
Supplemental Information. Menin Deficiency Leads to Depressive-like. Behaviors in Mice by Modulating. Astrocyte-Mediated Neuroinflammation
 Neuron, Volume 100 Supplemental Information Menin Deficiency Leads to Depressive-like Behaviors in Mice by Modulating Astrocyte-Mediated Neuroinflammation Lige Leng, Kai Zhuang, Zeyue Liu, Changquan Huang,
Nature Biotechnology: doi: /nbt Supplementary Figure 1. Diagram of BBB and brain chips.
 Supplementary Figure 1 Diagram of BBB and brain chips. (a) Schematic of the BBB Chip demonstrates the 3 parts of the chip, Top PDMS channel, membrane and Bottom PDMS channel; (b) Image of 2 BBB Chips,
Structural basis for the role of inhibition in facilitating adult brain plasticity
 Structural basis for the role of inhibition in facilitating adult brain plasticity Jerry L. Chen, Walter C. Lin, Jae Won Cha, Peter T. So, Yoshiyuki Kubota & Elly Nedivi SUPPLEMENTARY FIGURES 1-6 a b M
Supplementary Table 1. List of primers used in this study
 Supplementary Table 1. List of primers used in this study Gene Forward primer Reverse primer Rat Met 5 -aggtcgcttcatgcaggt-3 5 -tccggagacacaggatgg-3 Rat Runx1 5 -cctccttgaaccactccact-3 5 -ctggatctgcctggcatc-3
Appendix. Table of Contents
 Appendix Table of Contents Appendix Figures Figure S1: Gp78 is not required for the degradation of mcherry-cl1 in Hela Cells. Figure S2: Indel formation in the MARCH6 sgrna targeted HeLa clones. Figure
Supplementary Figure 1 Madm is not required in GSCs and hub cells. (a,b) Act-Gal4-UAS-GFP (a), Act-Gal4-UAS- GFP.nls (b,c) is ubiquitously expressed
 Act-Gal4-UAS-GFP (a), Act-Gal4-UAS- GFP.nls (b,c) is ubiquitously expressed") Supplementary Figure 1 Madm is not required in GSCs and hub cells. (a,b) Act-Gal4-UAS-GFP (a), Act-Gal4-UAS- GFP.nls (b,c) is ubiquitously expressed in the testes. The testes were immunostained with GFP
Supplementary Figure 1 Madm is not required in GSCs and hub cells. (a,b) Act-Gal4-UAS-GFP (a), Act-Gal4-UAS- GFP.nls (b,c) is ubiquitously expressed in the testes. The testes were immunostained with GFP
Suppl Video: Tumor cells (green) and monocytes (white) are seeded on a confluent endothelial
 and monocytes (white) are seeded on a confluent endothelial") Supplementary Information Häuselmann et al. Monocyte induction of E-selectin-mediated endothelial activation releases VE-cadherin junctions to promote tumor cell extravasation in the metastasis cascade
Supplementary Information Häuselmann et al. Monocyte induction of E-selectin-mediated endothelial activation releases VE-cadherin junctions to promote tumor cell extravasation in the metastasis cascade