Longitudinal tracking of single live cancer cells to understand cell cycle effects of the
|
|
|
- Helena Short
- 5 years ago
- Views:
Transcription
1 Longitudinal tracking of single live cancer cells to understand cell cycle effects of the nuclear export inhibitor, selinexor Joshua M. Marcus 1, Russell T. Burke 1, John A. DeSisto 1, Yosef Landesman 2, and James D. Orth 1* 1
2 Supplementary Figure S1 2
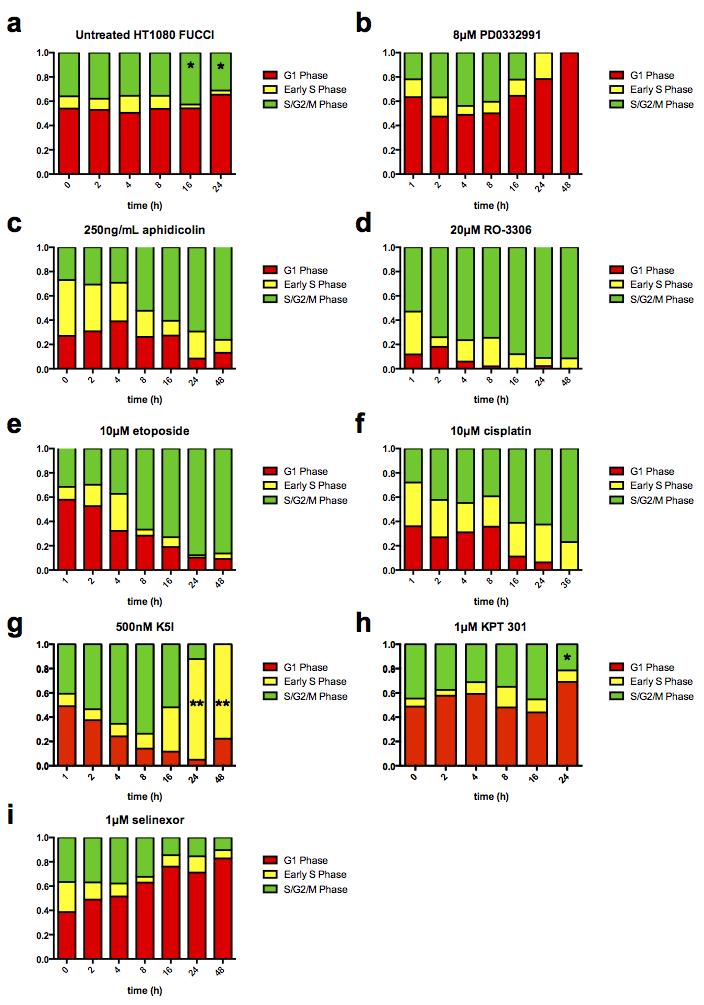
3 Supplementary Figure S1. Fraction of FUCCI status measured over time for each condition. Cells were treated at 50-60% density for all conditions. a) Untreated control cells become confluent by 16 h, resulting in a change in FUCCI distribution (asterisk). b) 8μM PD Some cells initially treated red, cycle through and divide and the daughter cells arrest, which is evident by the initial loss in red population between 1 and 2 h post treatment. c) 250ng/mL aphidicolin results in strong early (yellow) and late (green) S-phase arrest and 90% yellow or green cells at 48 h. d) 20μM RO-3306 results in strong G2-phase arrest and 90% green cells at 48 h. e) 10μM etoposide results in strong late (green) S-phase arrest and >80% of surviving cells are green cells at 48 h. f) 10μM cisplatin results in strong early (yellow) and late (green) S-phase arrest and nearly all surviving cells are yellow or green cells at 36 h. g) 500nM K5I does not block progression through interphase, cells accumulate prolonged mitotic arrest that is initially green by 4-8 h, and regain some red fluorescence during arrest, resulting in a large yellow population as cells die from mitotic arrest (double asterisk). At 48 h the few surviving interphase cells are yellow or red. h) 1μM of the inactive SINE KPT 301 has no effects; cells become confluent at 24 h (asterisk). i) 1μM selinexor results in complex responses (see text), and cells are 80% red by 16 h and the distribution remains that way until 48 h indicating little continued proliferation. Cells continue to be lost (Fig. 6a, b) and 80% of survivors that are non-proliferative (Supplementary Fig. 5, 6 online) at 48 h are red. Over 50 cells scored for each condition. 3
 After 72 h of being maintained in 0.")
4 Supplementary Figure S2 Supplementary Figure S2. FUCCI cells shift to a less proliferative, red distribution in low serum conditions. a) Immediately after cells are placed in 0.2% FBS medium, they show a high proliferative state with approximately 40% red, 30% yellow and 30% green nuclei. b) After 72 h of being maintained in 0.2% FBS medium, the population is mainly red, indicating a lack of proliferation with approximately 70% red, 25% yellow and only 5% green. Bars = 10µm. Over 100 cells scored for each condition. 4
 Before selinexor treatment, control cells show a predominantly cytoplasmic localization of the fluorescent fusion protein. b- d) Like for RanBP1, as soon as 0.")
5 Supplementary Figure S3 Supplementary Figure S3. Selinexor causes rapid inhibition of nuclear export and nuclear sequestration of pmturquoise2-nes. a) Before selinexor treatment, control cells show a predominantly cytoplasmic localization of the fluorescent fusion protein. b- d) Like for RanBP1, as soon as 0.5 h after 1µM selinexor and thereafter, the cargo protein becomes sequestered in the nucleus indicating inhibition of nuclear export. * mark nuclei. Bar = 10µm. 5
6 Supplementary Figure S4 6
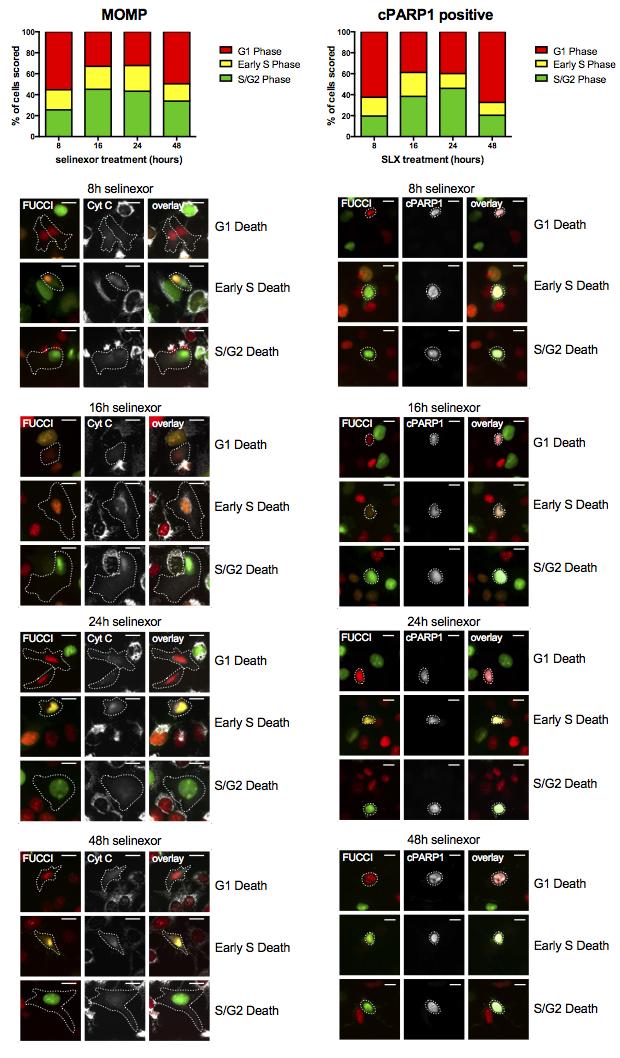
7 Supplementary Figure S4. HT1080 FUCCI cells treated with 1µM selinexor for 8, 16, 24 and 48 h show more association with G1- and early S-phase apoptosis. a) Treated cells were stained with a cytochrome C antibody to reveal cells that had undergone MOMP. At all time-points, cells showing MOMP are predominantly G1- and early S-phase. At the 8 and 48 h time-points over 50% of MOMP cells indicate G1-phase. Representative images of MOMP cells in G1-, early S-, and S/G2-phase are shown for each time-point. b) Treated cells were stained with a cleaved PARP1 antibody (cparp1) to reveal cells that had undergone apoptosis. Like for MOMP cells, at all time-points, cells showing cparp1 are predominantly G1- and early S-phase. At the 8 and 48 h timepoints over 50% of cparp1 cells indicate G1-phase. Representative images of cparp1 cells in G1-, early S-, and S/G2-phase are shown for each time-point. DNA staining with DAPI and phase-contrast microscopy were also imaged to confirm the apoptosis phenotype. Over 80 cells were scored for each condition. 7
8 Supplementary Figure S5. Supplementary Figure S5. HT1080 FUCCI cells in G2-phase do not arrest upon inhibition of nuclear export. Cells were synchronized in G2-phase, and released into normal medium or medium containing selinexor. a) Mitotic index was scored over time from 1 to 8 h after release. There was no evident effect of selinexor on release from G2- phase synchrony into mitosis. b) All cells were tracked longitudinally and scored for progression through mitosis after release into normal medium or 1µM selinexor % of cells divide by 6 h release, and essentially all trackable cells in both conditions divide by 12 h. Over 60 cells tracked for each condition. 8
9 Supplementary Figure S6 Supplementary Figure S6. Recovery of HT1080 FUCCI cells after 24 or 48 h of selinexor treatment is poor. a) Ten-thousand cells for each condition were re-plated into gridded glass-bottom dishes and quantified daily during recovery. Untreated control cells grew as colonies and showed a FUCCI green/red ratio of approximately and they completely filled the dish by 5 days. 24 and 48 h show decreased green/red ratio indicating cell cycle effects of nuclear export inhibition that remained lower through 7 days. b) Recovery is determined by normalization to control cell number when confluent. Control cells are confluent by 5 days (dashed line), where cells treated with selinexor for 24 and 48 h are severely affected and show very little proliferative recovery, in 9
10 agreement with the constant and comparatively low green/red ratios (a). c) Thirty thousand cells were plated into gridded glass-bottom dishes and grown for two days before treatment with 1 µm selinexor. Cells were then treated for 24 or 48 h or left untreated. After treatment, cells were imaged and they were imaged and quantified daily during recovery. Untreated control cells grew immediately and showed a green/red ratio of and they completely filled the dish by 3 days. After 24 and 48 h treatment, the green/red ration was decreased, especially after 48 h, indicating growth arrest as observed by time-lapse microscopy. For 24 and 48 h, the green/red ration remained lower through 7 days. After 5 days there were no cells remaining in the 48 h treated sample (dashed line). d) Control cells are confluent by 3 days (dashed line), where cells treated with selinexor for 24 and 48 h are severely affected and show very little proliferative recovery, in agreement with the constant and comparatively low green/red ratios (c). We note that in this assay we observe cell loss by 48 h treatment before wash-out, and the loss continues after selinexor wash-out. 10
 Untreated control cells show high Ki67 staining in over 90% of cells, and over 8% mitotic index.")
11 Supplementary Figure S7 Supplementary Figure S7. HT1080 cells lack proliferation markers upon 48 h of inhibited nuclear export. a, c, d) Untreated control cells show high Ki67 staining in over 90% of cells, and over 8% mitotic index. c, d) 24 h treated cells show high remaining Ki67 likely due to protein half-life, but a reduced mitotic index of 3%. b-d) By 48 h treatment, Ki67 cells are dramatically reduced and the mitotic index is significantly less than 0.5%, indicating low proliferative capacity of cells in this condition. Bar = 10µm. Over 100 cells scored for each condition. 11
12 Supplementary video legends: All videos captured with 20X 0.7 or 0.75NA objective. Images acquired every 10 minutes except videos S4, 7, and 9 which were acquired every 5 minutes. Representative cell is in center of each field. Supplementary video S1. HT1080 FUCCI cell tracked from early mitosis (green) through the cell cycle to a second round of mitosis. This cell shows transition through each cell cycle phase. Supplementary video S2. HT1080 FUCCI cell treated with 8µM PD Cell was treated in late G2-phase or early mitosis (green), divides normally and remains in G1-phase (red) for the balance of the video, indicating arrest. Supplementary video S3. HT1080 FUCCI cell treated with 8µM PD Cell was treated in G1-phase (red), progresses through the G1/S-phase checkpoint to late S/G2-phase (green), then transitions back to a red state after about 24 h and is arrested red for the balance of the movie. Supplementary video S4. 12
13 HT1080 FUCCI cell treated with 250ng/ml of the DNA polymerase δ and ε inhibitor, aphidicolin. Cell was treated in G1-phase and progresses to S/G2-phase (green) for the balance of the movie indicating arrest. Supplementary video S5. HT1080 FUCCI cell treated with 20µM of the CDK1 inhibitor, RO Cell was treated in G1-phase and progresses to S/G2-phase (green) for the balance of the movie indicating arrest. Supplementary video S6. HT1080 FUCCI cell treated with 10µM etoposide. Cell was treated in G1-phase, transitions to early S-phase (yellow), then S/G2-phase (green), and dies while green. Supplementary video S7. HT1080 FUCCI cell treated with 10µM cisplatin. Cell is treated in G1-phase, transitions to early S-phase (yellow), then S/G2-phase (green), and dies while green. Phase-contrast unavailable. Supplementary video S8. HT1080 FUCCI cell treated with 500nM K5I. Cell is treated in G1-phase, progresses through to mitosis with normal kinetics, arrests in mitosis, becomes yellow after 3 h of arrest due to increased red fluorescence, remains arrested in mitosis and eventually dies. 13
14 Supplementary video S9. HT1080 FUCCI cell treated with 100nM Taxol. A S/G2-phase cell 19 h after Taxol treatment progresses through to mitosis, arrests in mitosis, becomes yellow after 2 h 30 min of arrest due to increased red fluorescence, remains arrested in mitosis and eventually dies. Supplementary video S10. HT1080 FUCCI cell treated with 1µM KPT 301 tracked from very early mitosis, through to a second round of mitosis. This cell shows transition through each cell cycle phase. Supplementary video S11. HT1080 FUCCI cell treated with 1µM selinexor that is born into G1-phase. Cell enters G1-phase, remains there for many hours, and dies in G1-phase. Corresponds to Fig. 4c. Phase-contrast unavailable. Supplementary video S12. HT1080 FUCCI cell treated with 1µM selinexor that is born into G1-phase. Cell enters G1-phase (red), remains red for many hours, enters early S-phase (yellow), and dies. Corresponds to Fig. 4d. Phase-contrast unavailable. Supplementary video S13. 14
15 HT1080 FUCCI cell treated with 1µM selinexor that is born into G1-phase. Cell enters G1-phase, remains red for many hours, transitions to S/G2-phase, and dies. Corresponds to Fig. 4e. Phase-contrast unavailable. Supplementary video S14. HT1080 FUCCI cell treated with 1µM selinexor that is born into G1-phase. After division, this cell enters G1-phase, and remains red and does not die. Supplementary video S15. HT1080 FUCCI cell treated with 1µM selinexor in G1-phase (red). Cell remains in G1- phase and dies after a long period of G1-phase. Supplementary video S16. HT1080 FUCCI cell treated with 1µM selinexor in G1-phase (red). Cell progresses to S/G2-phase and dies. Supplementary video S17. HT1080 FUCCI cell treated with 1µM selinexor in G1-phase (red). Cell remains red and does not die indicating arrest. Supplementary video S18. HT1080 FUCCI cell treated with 1µM selinexor in early S-phase (yellow). Cell progresses to S/G2-phase and dies. 15
Prolonged mitotic arrest induces a caspase-dependent DNA damage
 SUPPLEMENTARY INFORMATION Prolonged mitotic arrest induces a caspase-dependent DNA damage response at telomeres that determines cell survival Karolina O. Hain, Didier J. Colin, Shubhra Rastogi, Lindsey
T H E J O U R N A L O F C E L L B I O L O G Y
 T H E J O U R N A L O F C E L L B I O L O G Y Supplemental material Lu et al., http://www.jcb.org/cgi/content/full/jcb.201012063/dc1 Figure S1. Kinetics of nuclear envelope assembly, recruitment of Nup133
Supplementary Figure S1
 Supplementary Figure S1 Supplementary Figure S1. PARP localization patterns using GFP-PARP and PARP-specific antibody libraries GFP-PARP localization in non-fixed (A) and formaldehyde fixed (B) GFP-PARPx
With or Without You: Studying the Requirement of p53 for Anti-Cancer Responses to Nuclear Export Inhibitors
 University of Colorado, Boulder CU Scholar Undergraduate Honors Theses Honors Program Spring 2016 With or Without You: Studying the Requirement of p53 for Anti-Cancer Responses to Nuclear Export Inhibitors
T H E J O U R N A L O F C E L L B I O L O G Y
 T H E J O U R N A L O F C E L L B I O L O G Y Supplemental material Dunsch et al., http://www.jcb.org/cgi/content/full/jcb.201202112/dc1 Figure S1. Characterization of HMMR and CHICA antibodies. (A) HeLa
SUPPLEMENTARY INFORMATION
 DOI: 10.1038/ncb3311 A B TSC2 -/- MEFs C Rapa Hours WCL 0 6 12 24 36 pakt.s473 AKT ps6k S6K CM IGF-1 Recipient WCL - + - + - + pigf-1r IGF-1R pakt ps6 AKT D 1 st SILAC 2 nd SILAC E GAPDH FGF21 ALKPGVIQILGVK
Supplementary Information for. Shi and King, Chromosome Nondisjunction Yields Tetraploid Rather than Aneuploid Cells in Human Cell Lines.
 Supplementary Information for Shi and King, Chromosome Nondisjunction Yields Tetraploid Rather than Aneuploid Cells in Human Cell Lines Contains Supplementary Methods Supplementary Figures 1-7 Supplementary
Nature Methods: doi: /nmeth Supplementary Figure 1
 Supplementary Figure 1 Finite-element analysis of cell cluster dynamics in different cluster trap architectures. (a) Cluster-Chip (b) Filter (c) A structure identical to the Cluster-Chip except that one
T H E J O U R N A L O F C E L L B I O L O G Y
 Supplemental material Edens and Levy, http://www.jcb.org/cgi/content/full/jcb.201406004/dc1 T H E J O U R N A L O F C E L L B I O L O G Y Figure S1. Nuclear shrinking does not depend on the cytoskeleton
Postn MCM Smad2 fl/fl Postn MCM Smad3 fl/fl Postn MCM Smad2/3 fl/fl. Postn MCM. Tgfbr1/2 fl/fl TAC
 A Smad2 fl/fl Smad3 fl/fl Smad2/3 fl/fl Tgfbr1/2 fl/fl 1. mm B Tcf21 MCM Tcf21 MCM Smad3 fl/fl Tcf21 MCM Smad2/3 fl/fl Tcf21 MCM Tgfbr1/2 fl/fl αmhc MCM C 1. mm 1. mm D Smad2 fl/fl Smad3 fl/fl Smad2/3
Cell cycle and apoptosis
 Cell cycle and apoptosis Cell cycle Definition Stages and steps Cell cycle Interphase (G1/G0, S, and G2) Mitosis (prophase, metaphase, anaphase, telophase, karyokinesis, cytokinesis) Control checkpoints
A Precise Bicoid Gradient is Nonessential During Cycles for Precise Patterning in the Drosophila Blastoderm
 Supporting Information for A Precise Bicoid Gradient is Nonessential During Cycles 11-13 for Precise Patterning in the Drosophila Blastoderm Elena M. Lucchetta, Meghan E. Vincent and Rustem F. Ismagilov*
The Cell Cycle. Dr. SARRAY Sameh, Ph.D
 The Cell Cycle Dr. SARRAY Sameh, Ph.D Overview When an organism requires additional cells (either for growth or replacement of lost cells), new cells are produced by cell division (mitosis) Somatic cells
human epithelial cells were pretreated with control sirna (50 nm) or GSK-3β sirna (50 nm)
 or GSK-3β sirna (50 nm)") GSK3β facilitates IFNγ signaling Supplementary Figure Legends Figure S1. The effects of inhibiting GSK3β on IFNγinduced TNFα expression. A, A549 human epithelial cells were pretreated with control sirna
GSK3β facilitates IFNγ signaling Supplementary Figure Legends Figure S1. The effects of inhibiting GSK3β on IFNγinduced TNFα expression. A, A549 human epithelial cells were pretreated with control sirna
Figure S1. HP1α localizes to centromeres in mitosis and interacts with INCENP. (A&B) HeLa
 HeLa") SUPPLEMENTARY FIGURES Figure S1. HP1α localizes to centromeres in mitosis and interacts with INCENP. (A&B) HeLa tet-on cells that stably express HP1α-CFP, HP1β-CFP, or HP1γ-CFP were monitored with livecell
SUPPLEMENTARY FIGURES Figure S1. HP1α localizes to centromeres in mitosis and interacts with INCENP. (A&B) HeLa tet-on cells that stably express HP1α-CFP, HP1β-CFP, or HP1γ-CFP were monitored with livecell
2014 Pearson Education, Inc.
 2 The Cell Cycle CAMPBELL BIOLOGY TENTH EDITION Reece Urry Cain Wasserman Minorsky Jackson The Key Roles of Cell Division The ability of organisms to produce more of their own kind best distinguishes living
Supplementary information. The Light Intermediate Chain 2 Subpopulation of Dynein Regulates Mitotic. Spindle Orientation
 Supplementary information The Light Intermediate Chain 2 Subpopulation of Dynein Regulates Mitotic Spindle Orientation Running title: Dynein LICs distribute mitotic functions. Sagar Mahale a, d, *, Megha
Influenza virus exploits tunneling nanotubes for cell-to-cell spread
 Supplementary Information Influenza virus exploits tunneling nanotubes for cell-to-cell spread Amrita Kumar 1, Jin Hyang Kim 1, Priya Ranjan 1, Maureen G. Metcalfe 2, Weiping Cao 1, Margarita Mishina 1,
Protocol for A-549 VIM RFP (ATCC CCL-185EMT) TGFβ1 EMT Induction and Drug Screening
 TGFβ1 EMT Induction and Drug Screening") Protocol for A-549 VIM RFP (ATCC CCL-185EMT) TGFβ1 EMT Induction and Drug Screening Introduction: Vimentin (VIM) intermediate filament (IF) proteins are associated with EMT in lung cancer and its metastatic
Protocol for A-549 VIM RFP (ATCC CCL-185EMT) TGFβ1 EMT Induction and Drug Screening Introduction: Vimentin (VIM) intermediate filament (IF) proteins are associated with EMT in lung cancer and its metastatic
BIOLOGY. The Cell Cycle CAMPBELL. Reece Urry Cain Wasserman Minorsky Jackson. Lecture Presentation by Nicole Tunbridge and Kathleen Fitzpatrick
 CAMPBELL BIOLOGY TENTH EDITION Reece Urry Cain Wasserman Minorsky Jackson 12 The Cell Cycle Lecture Presentation by Nicole Tunbridge and Kathleen Fitzpatrick The Key Roles of Cell Division The ability
SUPPLEMENTARY INFORMATION
 DOI: 10.1038/ncb2988 Supplementary Figure 1 Kif7 L130P encodes a stable protein that does not localize to cilia tips. (a) Immunoblot with KIF7 antibody in cell lysates of wild-type, Kif7 L130P and Kif7
 Supplementary Figure Legends Supplementary Figure S1. Aurora-A is essential for SAC establishment in early mitosis. (a-c) RPE cells were treated with DMSO (a), MLN8237 (b) or BI2536 (c) for Two hours.
SD-1 SD-1: Cathepsin B levels in TNF treated hch
 SD-1 SD-1: Cathepsin B levels in TNF treated hch. A. RNA and B. protein extracts from TNF treated and untreated human chondrocytes (hch) were analyzed via qpcr (left) and immunoblot analyses (right) for
Supplementary figure legends
 Supplementary figure legends Supplementary Figure 1. Exposure of CRT occurs independently from the apoptosisassociated loss of the mitochondrial membrane potential (MMP). (A) HeLa cells treated with MTX
Supplementary Figure 1. Mother centrioles can reduplicate while in the close association
 C1-GFP distance (nm) C1-GFP distance (nm) a arrested HeLa cell expressing C1-GFP and Plk1TD-RFP -3 s 1 2 3 4 5 6 7 8 9 11 12 13 14 16 17 18 19 2 21 22 23 24 26 27 28 29 3 b 9 8 7 6 5 4 3 2 arrested HeLa
NLRX1: 5 -GCTCCATGGCTTAGAGCATC-3 (forward) 5 -AACTCCTCCTCCGTCCTGAT-3 (reverse) β-actin
 5 -AACTCCTCCTCCGTCCTGAT-3 (reverse) β-actin") NLRX1 β-actin 1 2 3 4 5 6 1 2 3 4 5 6 NLRX1 (667 bp) β-actin (523 bp) Supplementary Figure 1: Expression of NLRX1 in human cell lines. 1: HeLa, 2: HEK293T, 3: MCF-7, 4:Ramos, 5:Jurkat, 6: THP1. The following
NLRX1 β-actin 1 2 3 4 5 6 1 2 3 4 5 6 NLRX1 (667 bp) β-actin (523 bp) Supplementary Figure 1: Expression of NLRX1 in human cell lines. 1: HeLa, 2: HEK293T, 3: MCF-7, 4:Ramos, 5:Jurkat, 6: THP1. The following
Supplemental Figure 1. Western blot analysis indicated that MIF was detected in the fractions of
 Supplemental Figure Legends Supplemental Figure 1. Western blot analysis indicated that was detected in the fractions of plasma membrane and cytosol but not in nuclear fraction isolated from Pkd1 null
HCC1937 is the HCC1937-pcDNA3 cell line, which was derived from a breast cancer with a mutation
 SUPPLEMENTARY INFORMATION Materials and Methods Human cell lines and culture conditions HCC1937 is the HCC1937-pcDNA3 cell line, which was derived from a breast cancer with a mutation in exon 20 of BRCA1
Mitosis. AND Cell DiVISION
 Mitosis AND Cell DiVISION Cell Division Characteristic of living things: ability to reproduce their own kind. Cell division purpose: When unicellular organisms such as amoeba divide to form offspring reproduction
Human neutrophils phagocytose and kill Acinetobacter baumannii and A. pittii
 Human neutrophils phagocytose and kill Acinetobacter baumannii and A. pittii María Lázaro-Díez, Itziar Chapartegui-González, Santiago Redondo-Salvo, Chike Leigh, David Merino, David San Segundo, Jesús
Nature Immunology: doi: /ni eee Supplementary Figure 1
 eee Supplementary Figure 1 Hyphae induce NET release, but yeast do not. (a) NET release by human peripheral neutrophils stimulated with a hgc1 yeast-locked C. albicans mutant (yeast) or pre-formed WT C.
SUPPLEMENTARY LEGENDS...
 TABLE OF CONTENTS SUPPLEMENTARY LEGENDS... 2 11 MOVIE S1... 2 FIGURE S1 LEGEND... 3 FIGURE S2 LEGEND... 4 FIGURE S3 LEGEND... 5 FIGURE S4 LEGEND... 6 FIGURE S5 LEGEND... 7 FIGURE S6 LEGEND... 8 FIGURE
The Enhancement of Anti-Tumor Activities of Selinexor when Combined with Immune Checkpoint Inhibitors
 The Enhancement of Anti-Tumor Activities of Selinexor when Combined with Immune Checkpoint Inhibitors Trinayan Kashyap, Karyopharm Therapeutics Yu-Tzu Tai and Kenneth Anderson, Dana Farber Boston Matthew
General Biology. Overview: The Key Roles of Cell Division The continuity of life is based upon the reproduction of cells, or cell division
 General Biology Course No: BNG2003" Credits: 3.00 " " " 8. The Cell Cycle Prof. Dr. Klaus Heese Overview: The Key Roles of Cell Division The continuity of life is based upon the reproduction of cells,
General Biology. Overview: The Key Roles of Cell Division. Unicellular organisms
 General Biology Course No: BNG2003 Credits: 3.00 8. The Cell Cycle Prof. Dr. Klaus Heese Overview: The Key Roles of Cell Division The continuity of life is based upon the reproduction of cells, or cell
Ahtiainen et al., http :// /cgi /content /full /jcb /DC1
 Supplemental material JCB Ahtiainen et al., http ://www.jcb.org /cgi /content /full /jcb.201512074 /DC1 THE JOURNAL OF CELL BIOLOGY Figure S1. Distinct distribution of different cell cycle phases in the
Campbell Biology in Focus (Urry) Chapter 9 The Cell Cycle. 9.1 Multiple-Choice Questions
 Chapter 9 The Cell Cycle. 9.1 Multiple-Choice Questions") Campbell Biology in Focus (Urry) Chapter 9 The Cell Cycle 9.1 Multiple-Choice Questions 1) Starting with a fertilized egg (zygote), a series of five cell divisions would produce an early embryo with how
Campbell Biology in Focus (Urry) Chapter 9 The Cell Cycle 9.1 Multiple-Choice Questions 1) Starting with a fertilized egg (zygote), a series of five cell divisions would produce an early embryo with how
T H E J O U R N A L O F C E L L B I O L O G Y
 T H E J O U R N A L O F C E L L B I O L O G Y Supplemental material Courtheoux et al., http://www.jcb.org/cgi/content/full/jcb.200902093/dc1 S1 Figure S2. Visualization of multiple merotelic attachments.
Regulators of Cell Cycle Progression
 Regulators of Cell Cycle Progression Studies of Cdk s and cyclins in genetically modified mice reveal a high level of plasticity, allowing different cyclins and Cdk s to compensate for the loss of one
Cell Cycle, Mitosis, and Microtubules. LS1A Final Exam Review Friday 1/12/07. Processes occurring during cell cycle
 Cell Cycle, Mitosis, and Microtubules LS1A Final Exam Review Friday 1/12/07 Processes occurring during cell cycle Replicate chromosomes Segregate chromosomes Cell divides Cell grows Cell Growth 1 The standard
The Cell Cycle. Chapter 12. Key Concepts in Chapter 12. Overview: The Key Roles of Cell Division. Video: Sea Urchin Embryonic Development (time-lapse)
") Chapter 12 The Cell Cycle Dr. Wendy era Houston Community College Biology 1406 Key Concepts in Chapter 12 1. Most cell division results in genetically identical daughter cells. 2. The mitotic phase alternates
Chapter 12 The Cell Cycle Dr. Wendy era Houston Community College Biology 1406 Key Concepts in Chapter 12 1. Most cell division results in genetically identical daughter cells. 2. The mitotic phase alternates
Cell Division and Mitosis
 Chromatin-Uncoiled DNA during interphase Cell Division and Mitosis Chromosomes-Tightly coiled DNA Chromatid-One half of a duplicated chromosome. Each is identical and called sister chromatids Centromere-The
University of Groningen
 University of Groningen Mechanisms of Hemagglutinin Targeted Influenza Virus Neutralization Brandenburg, Boerries; Koudstaal, Wouter; Goudsmit, Jaap; Klaren, Vincent; Tang, Chan; Bujny, Miriam V.; Korse,
Lab title: Cell Division author: Dr. Ruth Dahlquist-Willard (modified by D. Bell)
") Corresponding Readings: Lab title: Cell Division author: Dr. Ruth Dahlquist-Willard (modified by D. Bell) Campbell Ch. 8 BIOL-100L Safety Information: We will be using laboratory glassware such as microscope
Corresponding Readings: Lab title: Cell Division author: Dr. Ruth Dahlquist-Willard (modified by D. Bell) Campbell Ch. 8 BIOL-100L Safety Information: We will be using laboratory glassware such as microscope
To determine the effect of over-expression and/or ligand activation of. PPAR / on cell cycle, cell lines were cultured as described above until ~80%
 Supplementary Materials and Methods Cell cycle analysis To determine the effect of over-expression and/or ligand activation of PPAR / on cell cycle, cell lines were cultured as described above until ~80%
Variable Response to Chemotherapeutics by a Subpopulation of MCF-7 Breast Cancer Cells
 Variable Response to Chemotherapeutics by a Subpopulation of MCF-7 Breast Cancer Cells JULIE MARIE DORLAND BIOMEDICAL ENGINEERING AND PLAN II HONORS MAY 17, 2016 ENGINEERING HONORS UNDERGRADUATE THESIS
Supplementary material Legends to Supplementary Figures Figure S1. Figure S2. Figure S3.
 Supplementary material Legends to Supplementary Figures. Figure S1. Expression of BICD-N-MTS fusion does not affect the distribution of the Golgi and endosomes. HeLa cells were transfected with GFP-BICD-N-MTS
T H E J O U R N A L O F C E L L B I O L O G Y
 Supplemental material Beck et al., http://www.jcb.org/cgi/content/full/jcb.201011027/dc1 T H E J O U R N A L O F C E L L B I O L O G Y Figure S1. Membrane binding of His-tagged proteins to Ni-liposomes.
Cell Cycle - Introduction
 Cell Cycle - Introduction Key Concepts Cell division results in two identical cells During cell division the ability to organize DNA in time and space (location in the cell) is critical! The mitotic phase
Inhibition of exportin-1 function results in rapid cell cycleassociated DNA damage in cancer cells
 /, Advance Publications 2017 Inhibition of exportin-1 function results in rapid cell cycleassociated DNA damage in cancer cells Russell T. Burke 1, Joshua M. Marcus 1,2 and James D. Orth 1 1 Department
Nature Medicine: doi: /nm.4322
 1 2 3 4 5 6 7 8 9 10 11 Supplementary Figure 1. Predicted RNA structure of 3 UTR and sequence alignment of deleted nucleotides. (a) Predicted RNA secondary structure of ZIKV 3 UTR. The stem-loop structure
Chapter 12. The Cell Cycle
 Chapter 12 The Cell Cycle The Key Roles of Cell Division The ability of organisms to produce more of their own kind is the one characteristic that best distinguishes living things from nonliving things.
Outline Interphase Mitotic Stage Cell Cycle Control Apoptosis Mitosis Mitosis in Animal Cells Cytokinesis Cancer Prokaryotic Cell Division
 The Cell Cycle and Cellular Reproduction Chapter 9 Outline Interphase Mitotic Stage Cell Cycle Control Apoptosis Mitosis Mitosis in Animal Cells Cytokinesis Cancer Prokaryotic Cell Division 1 2 Interphase
Cell Division Mitosis Notes
 Cell Division Mitosis Notes Cell Division process by which a cell divides into 2 new cells Why do cells need to divide? 1.Living things grow by producing more cells, NOT because each cell increases in
Supplemental Information. 3D-CLEM Reveals that a Major Portion. of Mitotic Chromosomes Is Not Chromatin
 Molecular Cell, Volume 64 Supplemental Information 3D-CLEM Reveals that a Major Portion of Mitotic Chromosomes Is Not Chromatin Daniel G. Booth, Alison J. Beckett, Oscar Molina, Itaru Samejima, Hiroshi
Name Date Class. Interphase. (1) The. grows. DNA is duplicated.
 The. grows. DNA is duplicated.") Concept Mapping The Cell Cycle Complete the cycle map about the cell cycle. These terms may be used more than once: cell, cytoplasm, metaphase, nuclear membrane, nucleoli, poles. (1) The Interphase grows.
Concept Mapping The Cell Cycle Complete the cycle map about the cell cycle. These terms may be used more than once: cell, cytoplasm, metaphase, nuclear membrane, nucleoli, poles. (1) The Interphase grows.
SUPPLEMENTARY INFORMATION
 SUPPLEMENTARY INFORMATION Advances in pancreatic islet monolayer culture on glass surfaces enable superresolution microscopy and insights into beta cell ciliogenesis and proliferation Edward A. Phelps,
Supplementary Figure 1.TRIM33 binds β-catenin in the nucleus. a & b, Co-IP of endogenous TRIM33 with β-catenin in HT-29 cells (a) and HEK 293T cells
 and HEK 293T cells") Supplementary Figure 1.TRIM33 binds β-catenin in the nucleus. a & b, Co-IP of endogenous TRIM33 with β-catenin in HT-29 cells (a) and HEK 293T cells (b). TRIM33 was immunoprecipitated, and the amount of
Supplementary Figure 1.TRIM33 binds β-catenin in the nucleus. a & b, Co-IP of endogenous TRIM33 with β-catenin in HT-29 cells (a) and HEK 293T cells (b). TRIM33 was immunoprecipitated, and the amount of
Supplementary Figure S1 (a) (b)
 (b)") Supplementary Figure S1: IC87114 does not affect basal Ca 2+ level nor nicotineinduced Ca 2+ influx. (a) Bovine chromaffin cells were loaded with Fluo-4AM (1 μm) in buffer A containing 0.02% of pluronic
Supplementary Figure S1: IC87114 does not affect basal Ca 2+ level nor nicotineinduced Ca 2+ influx. (a) Bovine chromaffin cells were loaded with Fluo-4AM (1 μm) in buffer A containing 0.02% of pluronic
SUPPLEMENTARY FIGURES
 SUPPLEMENTARY FIGURES 1 2 3 4 SUPPLEMENTARY TABLES Supplementary Table S1. Brain Tumors used in the study Code Tumor Classification Age Gender HuTuP51 Glioblastoma 57 Male HuTuP52 Glioblastoma 53 Male
Early cell death (FGF) B No RunX transcription factor produced Yes No differentiation
 B No RunX transcription factor produced Yes No differentiation") Solution Key - Practice Questions Question 1 a) A recent publication has shown that the fat stem cells (FSC) can act as bone stem cells to repair cavities in the skull, when transplanted into immuno-compromised
Solution Key - Practice Questions Question 1 a) A recent publication has shown that the fat stem cells (FSC) can act as bone stem cells to repair cavities in the skull, when transplanted into immuno-compromised
CELL CYCLE REGULATION AND CANCER. Cellular Reproduction II
 CELL CYCLE REGULATION AND CANCER Cellular Reproduction II THE CELL CYCLE Interphase G1- gap phase 1- cell grows and develops S- DNA synthesis phase- cell replicates each chromosome G2- gap phase 2- cell
Cells and reagents. Synaptopodin knockdown (1) and dynamin knockdown (2)
 and dynamin knockdown (2)") Supplemental Methods Cells and reagents. Synaptopodin knockdown (1) and dynamin knockdown (2) podocytes were cultured as described previously. Staurosporine, angiotensin II and actinomycin D were all obtained
Supplemental Methods Cells and reagents. Synaptopodin knockdown (1) and dynamin knockdown (2) podocytes were cultured as described previously. Staurosporine, angiotensin II and actinomycin D were all obtained
(i) List these events in the correct order, starting with D.... (1)... (1)... (1)
 List these events in the correct order, starting with D.... (1)... (1)... (1)") Q1. (a) Boxes A to E show some of the events of the cell cycle. A Chromatids seperate B Nuclear envelopes disappears C Cytoplasm divides D Chromosomes condense and become visible E Chromosomes on the equator
Q1. (a) Boxes A to E show some of the events of the cell cycle. A Chromatids seperate B Nuclear envelopes disappears C Cytoplasm divides D Chromosomes condense and become visible E Chromosomes on the equator
Focus Application. Compound-Induced Cytotoxicity
 xcelligence System Real-Time Cell Analyzer Focus Application Compound-Induced Cytotoxicity Featured Study: Using the Time Resolving Function of the xcelligence System to Optimize Endpoint Viability and
Supporting Information. FADD regulates NF-кB activation and promotes ubiquitination of cflip L to induce. apoptosis
 1 2 Supporting Information 3 4 5 FADD regulates NF-кB activation and promotes ubiquitination of cflip L to induce apoptosis 6 7 Kishu Ranjan and Chandramani Pathak* 8 9 Department of Cell Biology, School
Change in frequency of radiation induced micronuclei during interphase of four-cell mouse embryos in vitro
 Radiat Environ Biophys (1986) 25:195-199 Radiation and Environmental Biophysics Springer-Verlag 1986 Change in frequency of radiation induced micronuclei during interphase of four-cell mouse embryos in
SLX4 + MUS81 SLX4 + GEN1 SLX4 CONTROL SLX4
 GEN MUS8 GEN MUS8 GEN MUS8 GEN MUS8 GEN C LM MUS8 XPF (loading control) D H2AX Frequency of -positive bridges (% of anaphase cells) 6 4 2 p =.8 x -4 GM855 p =.27 PSNF5 E H2AX Figure S. Analysis of anaphase
(a) Reproduction. (b) Growth and development. (c) Tissue renewal
 Reproduction. (b) Growth and development. (c) Tissue renewal") 100 µm 200 µm 20 µm (a) Reproduction (b) Growth and development (c) Tissue renewal 1 20 µm 2 0.5 µm Chromosomes DNA molecules Chromosome arm Centromere Chromosome duplication (including DNA synthesis)
100 µm 200 µm 20 µm (a) Reproduction (b) Growth and development (c) Tissue renewal 1 20 µm 2 0.5 µm Chromosomes DNA molecules Chromosome arm Centromere Chromosome duplication (including DNA synthesis)
Mitosis and Cytokinesis
 B-2.6 Summarize the characteristics of the cell cycle: interphase (called G1, S, G2); the phases of mitosis (called prophase, metaphase, anaphase, and telophase); and plant and animal cytokinesis. The
Essential Questions. Why are cells relatively small? What are the primary stages of the cell cycle? What are the stages of interphase?
 Essential Questions Why are cells relatively small? What are the primary stages of the cell cycle? What are the stages of interphase? Cellular Growth Vocabulary Review selective permeability New cell cycle
Multiple mechanisms underlying acquired resistance to taxanes in selected docetaxelresistant MCF-7 breast cancer cells
 Wang et al. BMC Cancer 2014, 14:37 RESEARCH ARTICLE Multiple mechanisms underlying acquired resistance to taxanes in selected docetaxelresistant MCF-7 breast cancer cells Harris Wang 1, The Vo 1, Ali Hajar
Cell Division Mitosis Notes
 Cell Division Mitosis Notes Cell Division process by which a cell divides into 2 new cells Why do cells need to divide? 1.Living things grow by producing more cells, NOT because each cell increases in
nature methods Organelle-specific, rapid induction of molecular activities and membrane tethering
 nature methods Organelle-specific, rapid induction of molecular activities and membrane tethering Toru Komatsu, Igor Kukelyansky, J Michael McCaffery, Tasuku Ueno, Lidenys C Varela & Takanari Inoue Supplementary
10.2 The Cell Cycle *
 OpenStax-CNX module: m52672 1 10.2 The Cell Cycle * Shannon McDermott Based on The Cell Cycle by OpenStax This work is produced by OpenStax-CNX and licensed under the Creative Commons Attribution License
GFP-LC3 +/+ CLU -/- kda CLU GFP. Actin. GFP-LC3 +/+ CLU -/- kda CLU GFP. Actin
 Supplementary Fig. 1 a CQ treatment ScrB OGX11 MG132 I II AZD5363 I II b GFP / / GFP / / GFP / / GFP / / GFP GFP Actin Actin ctrl CQ GFP / / GFP / / GFP / / GFP / / GFP GFP Actin Actin rapamycin rapamycincq
Supplementary material. Supplementary Figure legends
 Supplementary material Supplementary Figure legends Supplementary Figure 1: Senescence-associated proliferation stop in response to oncogenic N-RAS expression Proliferation of NHEM cells without (ctrl.)
Tumour growth environment modulates Chk1 signalling pathways and sensitivity to Chk1 inhibition
 Tumour growth environment modulates Chk1 signalling pathways and sensitivity to Chk1 inhibition Andrew J Massey Supplementary Information Supplementary Figure S1. Related to Fig. 1. (a) HT29 or U2OS cells
The Cell Cycle. Chapter 12. Biology Eighth Edition Neil Campbell and Jane Reece. PowerPoint Lecture Presentations for
 Chapter 12 The Cell Cycle PowerPoint Lecture Presentations for Biology Eighth Edition Neil Campbell and Jane Reece Lectures by Chris Romero, updated by Erin Barley with contributions from Joan Sharp Copyright
SUPPLEMENTARY INFORMATION
 DOI: 10.1038/ncb3076 Supplementary Figure 1 btrcp targets Cep68 for degradation during mitosis. a) Cep68 immunofluorescence in interphase and metaphase. U-2OS cells were transfected with control sirna
The Cellular Basis of Reproduction and Inheritance
 Chapter 8 The Cellular Basis of Reproduction and Inheritance PowerPoint Lectures for! Biology: Concepts and Connections, Fifth Edition! Campbell, Reece, Taylor, and Simon Lectures by Chris Romero Objective:
SUPPLEMENTARY INFORMATION
 SUPPLEMENTARY INFORMATION doi:1.138/nature9814 a A SHARPIN FL B SHARPIN ΔNZF C SHARPIN T38L, F39V b His-SHARPIN FL -1xUb -2xUb -4xUb α-his c Linear 4xUb -SHARPIN FL -SHARPIN TF_LV -SHARPINΔNZF -SHARPIN
SUPPLEMENTAL INFORMATION FOR. PAX7 expression defines germline stem cells in the adult testis
 SUPPLEMENTAL INFORMATION FOR PAX7 expression defines germline stem cells in the adult testis Gina M. Aloisio, Yuji Nakada, Hatice D. Saatcioglu, Christopher G. Peña, Michael D. Baker, Edward D. Tarnawa,
Control of Cell Cycle. Unit 2 Part f III
 Control of Cell Cycle Unit 2 Part f III How often do cells divide and why? The timing and rate of cell division in different parts of the plant or animals are crucial to normal growth, development and
This colorized scanning electron micrograph is showing a white blood cell undergoing cell division.
 10 1 Cell Growth Why are cells small? This colorized scanning electron micrograph is showing a white blood cell undergoing cell division. This relates to cell theory because this is HOW all cells come
Supplementary Figure 1 Expression of Crb3 in mouse sciatic nerve: biochemical analysis (a) Schematic of Crb3 isoforms, ERLI and CLPI, indicating the
 Schematic of Crb3 isoforms, ERLI and CLPI, indicating the") Supplementary Figure 1 Expression of Crb3 in mouse sciatic nerve: biochemical analysis (a) Schematic of Crb3 isoforms, ERLI and CLPI, indicating the location of the transmembrane (TM), FRM binding (FB)
Supplementary Figure 1 Expression of Crb3 in mouse sciatic nerve: biochemical analysis (a) Schematic of Crb3 isoforms, ERLI and CLPI, indicating the location of the transmembrane (TM), FRM binding (FB)
Santulli G. et al. A microrna-based strategy to suppress restenosis while preserving endothelial function
 ONLINE DATA SUPPLEMENTS Santulli G. et al. A microrna-based strategy to suppress restenosis while preserving endothelial function Supplementary Figures Figure S1 Effect of Ad-p27-126TS on the expression
The Cell Cycle 4/10/12. Chapter 12. Overview: The Key Roles of Cell Division
 LECTURE PRESENTATIONS For CAMPBELL BIOLOGY, NINTH EDITION Jane B. Reece, Lisa A. Urry, Michael L. Cain, Steven A. Wasserman, Peter V. Minorsky, Robert B. Jackson Chapter 12 The Cell Cycle Lectures by Erin
Unit 4 Student Notes Cell Cycle
 Name Date Unit 4 Student Notes Cell Cycle B-2.6 Summarize the characteristics of the cell cycle: interphase (called G1, S, G2); the phases of mitosis (called prophase, metaphase, anaphase, and telophase);
Biology Cell Division Quiz
 Word List biphase cell membrane cell wall checkpoint chromosome cytoplasm daughter cell diffusion DNA nuclear membrane nucleus osmosis spindle telomere vacuole Cells reproduce in a process called, which
Bis2A 15.0 The Cell Cycle *
 OpenStax-CNX module: m56084 1 Bis2A 15.0 The Cell Cycle * Mitch Singer Based on The Cell Cycle by OpenStax This work is produced by OpenStax-CNX and licensed under the Creative Commons Attribution License
Lecture 14 - The cell cycle and cell death
 02.17.10 Lecture 14 - The cell cycle and cell death The cell cycle: cells duplicate their contents and divide The cell cycle may be divided into 4 phases The cell cycle triggers essential processes (DNA
Stages of Mitosis. Introduction
 Name: Due: Stages of Mitosis Introduction Mitosis, also called karyokinesis, is division of the nucleus and its chromosomes. It is followed by division of the cytoplasm known as cytokinesis. Both mitosis
Supplemental Figure 1. Quantification of proliferation in thyroid of WT, Ctns -/- and grafted
 Supplemental Figure 1. Quantification of proliferation in thyroid of WT, Ctns -/- and grafted Ctns -/- mice. Cells immunolabeled for the proliferation marker (Ki-67) were counted in sections (n=3 WT, n=4
Loss of RhoA promotes skin tumor formation. Supplementary Figure 1. Loss of RhoA does not impair F-actin organization.
 Supplementary Figure Legends Supplementary Figure 1. Loss of RhoA does not impair F-actin organization. a. Representative IF images of F-actin staining of big and small control (left) and RhoA ko tumors
The Cell Cycle CHAPTER 12
 The Cell Cycle CHAPTER 12 The Key Roles of Cell Division cell division = reproduction of cells All cells come from pre-exisiting cells Omnis cellula e cellula Unicellular organisms division of 1 cell reproduces
Unit 5 Section 1. Evidence 1: Why aren t all organisms made of just one cell? Why do cells divide, instead of simply growing larger?
 Unit 5 Section 1 Evidence 1: Why aren t all organisms made of just one cell? Why do cells divide, instead of simply growing larger? Cell Theory states the following 1. All organisms are made of cells 2.
SUPPLEMENTAL EXPERIMENTAL PROCEDURES
 SUPPLEMENTAL EXPERIMENTAL PROCEDURES Crystal violet assay Cells were seeded in 24-well plates and cultured in media supplemented with % FBS for 7 days. Media were then removed, plates were briefly washed
The Cell Cycle MITOSIS
 The Cell Cycle MITOSIS Outcomes 1. Explain the events of the cell cycle Interphase Mitosis Prophase Metaphase Anaphase Telophase Cytokinesis 2. Use a simulation to demonstrate the behaviour of chromosomes
Fig. S1. Subcellular localization of overexpressed LPP3wt-GFP in COS-7 and HeLa cells. Cos7 (top) and HeLa (bottom) cells expressing for 24 h human
 and HeLa (bottom) cells expressing for 24 h human") Fig. S1. Subcellular localization of overexpressed LPP3wt-GFP in COS-7 and HeLa cells. Cos7 (top) and HeLa (bottom) cells expressing for 24 h human LPP3wt-GFP, fixed and stained for GM130 (A) or Golgi97
Fig. S1. Subcellular localization of overexpressed LPP3wt-GFP in COS-7 and HeLa cells. Cos7 (top) and HeLa (bottom) cells expressing for 24 h human LPP3wt-GFP, fixed and stained for GM130 (A) or Golgi97