Supplemental Figure S1. RANK expression on human lung cancer cells.
|
|
|
- Jack Kelley
- 5 years ago
- Views:
Transcription
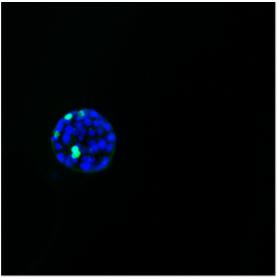
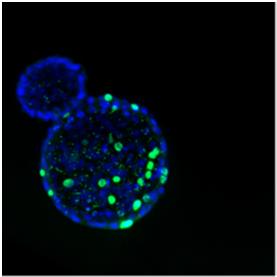
1 Supplemental Figure S1. RANK expression on human lung cancer cells. (A) Incidence and H-Scores of RANK expression determined from IHC in the indicated primary lung cancer subgroups. The overall expression was generated using the H-scoring method which is the sum of the products of percentage of cells multiplied the intensity (0-3). Incidence was scored as the percent of tumors that showed any positive IHC signal. () Representative flow cytometry to detect RANK cell surface expression on EpCAM H1299 cells that do not express RANK, EpCAM + PC3 cells as RANK expressing positive control cells, and an EpCAM + resected primary NSCLC adenocarcinoma. Isotype control stainings are shown in the left panels. (C) Positive correlation between RANK flow cytometry results and IHC analysis on a subset of disaggregated primary human lung tumors (n=33). To confirm RANK flow cytometry results and to better understand the distribution of RANK expression, IHC was performed using a validated internal RANK IHC assay. H-Scores ranged from 0 to 260. (D) Representative images of RANK expression in a primary dissected NSCLC adenocarcinoma and a squamous lung tumor, using samples from a second lung cancer cohort (Graz cohort). Scale bars, 50μm and in insets, 20μm. (E) Detection of TRAP levels in the serum of PS or OPG-Fc [10mg/kg] treated PDX mice assessed at study termination. TRAP levels indicate osteoclast activity. Data for individual mice are shown. Statistical comparisons were performed using Chi-square test. Supplemental Figure S2. Deletion of RANK has no apparent effect on lung structures or lung function. (A) Immunofluorescence staining to detect RANK protein expression in normal lung tissue. Note RANK protein (green) is primarily expressed in bronchial epithelial cells. DAPI (blue) was used 1
2 to counterstain for nuclei. Scale bars, 100µm. () Representative histological images of lung tissues isolated from SP-C Cre;KRas;rank +/+ and SP-C Cre;KRas;rank f/f mice. Scale bars, upper panels, 2mm; lower panels 500 m. (C) qpcr analysis of RANK mrna levels in primary pneumocytes purified from SP-C Cre; KRas;rank +/+ and SP-C Cre;KRas;rank f/f mice. ***p<0.001 (Unpaired, two-sided t-test). (D) Comparison of average O2 consumption and CO2 production between SP-C Cre;KRas;rank +/+ and SP-C Cre;KRas;rank f/f mice using the PhenoMaster module for indirect gas calorimetry. No significant differences were detected in O2 consumption and CO2 production; as a consequence the respiratory exchange rate (RQ) was also comparable between SP-C Cre;KRas;rank +/+ and SP-C Cre;KRas;rank f/f mice. (E) Immunofluorescence staining to detect RANK protein expression (green) in lung tumors from KRas;rank +/+ and KRas;rank fl/fl littermate mice 28 weeks after AdCre injections. Asterix indicates RANK expression in KRas;rank +/+ tumor tissue. Note RANK expression in the bronchial epithelium (arrow) adjacent to the RANK deficient lung tumor in the KRas;rank fl/fl mouse. DAPI (blue) was used to counterstain for nuclei. Scale bars, 100 m. Supplemental Figure S3. Epithelial deletion of RANK but not RANKL controls Kras G12D -driven lung tumorigenesis. (A) Representative 3D microct movies of lung tumors of KRas;rank +/+ and KRas;rank fl/fl littermate mice assayed 25 weeks after AdCre inhalation. The movies have been separately deposited, please click the links. () Kaplan Meier survival curves for KRas;rankl +/+ (n=26, median survival=205 days) and KRas;rankl fl/fl (n=17, median survival=231 days) littermate mice injected intranasally with AdCre ( PFU). There was no statistically significant difference 2
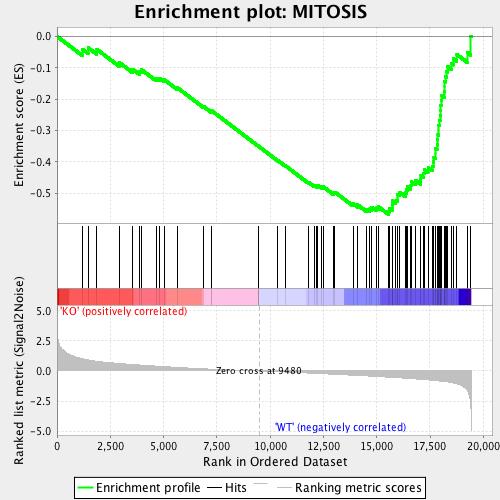
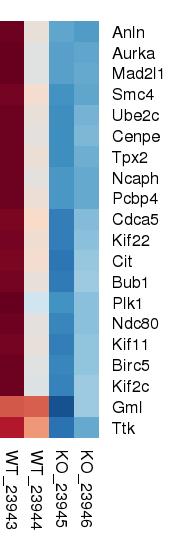
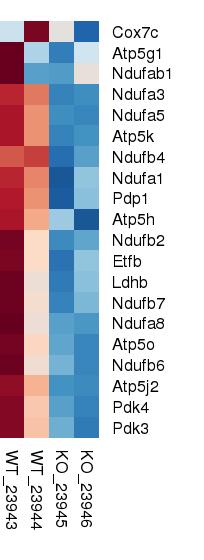
3 between the two cohorts (log rank test). (C) Representative histological images of lung tumors in KRas;rankl +/+ and KRas;rank fl/fl mice, 6 and 30 weeks after AdCre inhalation. Scale bars, 2mm. Supplemental Figure S4. Deletion of RANK has no apparent effect on intratumoral immune cells populations. Comparative immunoprofiling of the early lung lesions from both KRas;rank +/+ and KRas;rank fl/fl mice using flow cytometry 6 weeks after Ad-Cre inhalation. No significant difference was observed in in the assessed populations of T cells and NK cells (A), Foxp3 + regulatory T cells (), cells (C), inflammatory T cells (D) and different myeloid cell subsets (E). Supplemental Figure S5. Gene expression profiling of KRas;rank +/+ and KRas;rank fl/fl pneumocytes. (A) qpcr analysis to control for RANK mrna expression in primary pneumocytes isolated from KRas;rank +/+ and KRas;rank fl/fl mice. Purified pneumocytes were infected with AdCre to induce mutant KRas and to delete RANK in cells with rank fl/fl alleles. Relative expression levels (+/- SEM) are shown as compared to RANK expressing KRas;rank +/+ control cells (values set to 1). ( and C) Gene sets enriched in primary KRas;rank +/+ and KRas;rank fl/fl pneumocytes using GSEA (normalized enrichment score (NES). Left, GSEA enrichment plot of the enrichment score (ES; y- axis) reflecting the degree of the gene sets overrepresentation in KRas;rank +/+ and KRas;rank fl/fl pneumocytes at the extreme left or right of the entire ranked list. Solid bars represent genes of the 3
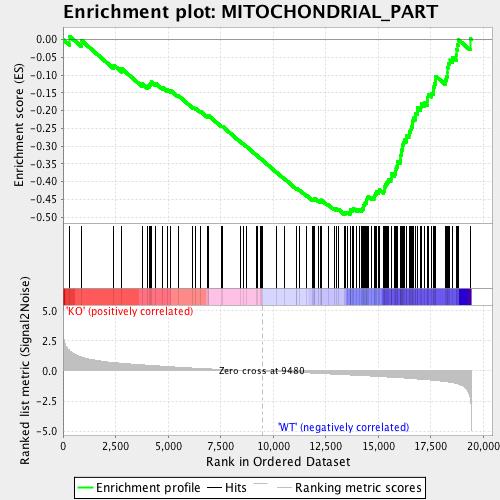
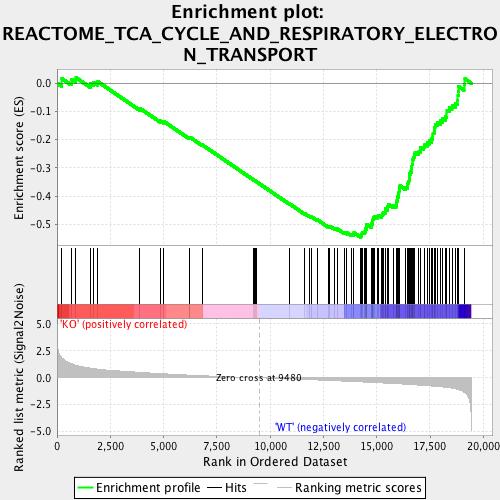
4 gene set. Right, GSEA-derived heatmap illustrating gene expression profiles of the leading edge subset. () Examples of gene sets over-represented in KRas;rank fl/fl pneumocytes (cell adhesion) or overrepresented in control KRas;rank +/+ pneumocytes (mitosis). (C) Examples of enrichment for mitochondrial structure and mitochondrial respiration genes in KRas;rank +/+ as compared to KRas;rank fl/fl pneumocytes. Supplemental Figure S6. RANKL/RANK couple to mitochondrial respiration in primary pneumocytes and murine and human lung cancer cells. (A) ATP production, basal respiration, maximal respiration and spare respiratory capacity (mean values +/- SEM) based on bioenergetics Seahorse profiling of purified primary pneumocytes from KRas;rank +/+ and KRas;rank fl/fl mice. Purified pneumocytes were infected with AdCre to induce mutant KRas and to delete RANK in cells with rank fl/fl alleles; these KRas;rank +/+ and KRas;rank fl/fl cells were then treated with RANKL [1 g/ml] for 24 hours and as controls left without RANKL treatment. A minimum of 5 replicates were analyzed for each condition and pneumocytes purified from 3 different mice were used independently. *p<0.05, **p<0.01 (Unpaired, two-sided t-test). () ATP production, basal respiration, maximal respiration, and spare respiratory capacity (mean values +/- SEM) based on bioenergetics profiling of purified primary lung tumor cells from KRas;rank +/+ and KRas;rank fl/fl mice 18 weeks after in vivo AdCre inhalation. A minimum of 5 replicates (OCR +/- SEM) were analyzed for each condition and purified primary lung tumor cells from 3 different mice were used independently. See also Extended Fig. 3d. ***p<0.001 (Unpaired, two-sided t-test). (C) qrt-pcr analysis to determine RANK mrna expression in the indicated human lung cancer cell lines. Relative RANK mrna 4
5 expression levels (+/- SEM, n = 3) are shown as compared to human peripheral blood mononuclear cells (value arbitrarily set at 1). (D) ioenergetics OCR profiling of ATP production, basal respiration, maximal respiration and spare respiratory capacity based on bioenergetics Seahorse profiling of the indicated human lung cancer cell lines. Cells were stimulated with RANKL [1 g/ml] for 2 hours (red lines and bars) and as controls left without RANKL treatment (black lines and bars). Data are all shown as mean values +/- SEM. A minimum of 6 replicates were analyzed for each condition and lung cancer cell line; experiments were independently repeated 3 times. *p<0.05, **p<0.01 (Unpaired, two-sided t-test). Supplemental Figure S7. RANKL/RANK triggers lung cancer stem-like cells proliferation and mitochondrial homeostasis. (A) Western blotting of A427 human lung cancer cells to determine activation of the indicated signaling pathway in response to RANKL stimulation [1 g/ml]. Activation was determined at the indicated time points using phospho-specific Abs to detect p65 NF-, AKT and p38-mapk. The respective total proteins are shown to control for protein expression. -actin is shown as a loading control. () Western blot analysis of purified KRas;rank +/+ and KRas;rank fl/fl tumor cells to determine activation of the PGC1 in response to RANKL (1 g/ml) stimulation, analysed at indicated time points. -actin is shown as a loading control. (C) Determination of PGC1 protein expression in purified KRas;rank +/+ and KRas;rank fl/fl tumor cells stimulated with RANKL or RANKL plus inhibitors of AKT, P38 and NF-, respectively. (D) 3D tumor spheroids assay of purified KRas;rank +/+ tumor cells treated with RANKL or RANKL plus inhibitors of AKT, P38 5
6 and NF-, respectively primary tumor cells were seeded. Experiments were performed with 6 replicates for each condition and repeated with 3 different KRas;rank +/+ mice. Scale bars, 1mm. (E) Quantification (mean values +/- SEM) of tumor spheroids numbers as shown in the representative images in (D). **p<0.01, ***p<0.001 (Unpaired, two-sided t-test). Supplemental Figure S8. RANKL stimulation does not induce enhanced tumor sphere formation in KRas;rank fl/fl mutant tumor cells. (A) 3D tumor spheroids assay of purified KRas;rank fl/fl tumor cells treated with RANKL [1 g/ml] or oligomycin alone [low dose is 0.05 g/ml, high dose is 0.5 g/ml] or RANKL plus different oligomycin concentrations primary tumor cells were seeded. Experiments were performed with 6 replicates for each condition and repeated with 3 different KRas;rank fl/fl mice. Scale bars, 1mm. () Quantifications (mean +/- SEM) of tumor spheroids numbers of (A) N.S, not significant (Unpaired, two-sided t-test). (C) Representative images for rdu staining of tumor spheroids derived from KRas;rank fl/fl primary lung tumor cells, which received no treatment, or were treated with RANKL alone [1 g/ml], oligomycin alone [low dose is 0.05 g/ml, high dose is 0.5 g/ml] and RANKL plus different oligomycin concentrations primary tumor cells were seeded. rdu labelling [10 M/ml] was performed for 2 hours. Experiments were performed with 6 replicates for each condition and repeated with 3 different KRas;rank fl/fl mice. Sections were counter-stained with DAPI. (D) Quantifications (mean +/- SEM) rdu + cells within tumor spheroids as shown in (C). N.S, not significant (Unpaired, two-sided t-test). Scale bars, 50 m. 6
7 Supplemental Figure S9. RANKL, RANK, and OPG expression in human lung cancer. (A) Prediction of overall survival probability in males versus females in the human Affymetrix lung adenocarcinoma dataset stratified for high (red lines) and low (black lines) RANK, RANKL, and OPG mrna expression based on the best fit algorithm for. Data presented were obtained using KM plotter. P values (log rank test) and total numbers of patients with either low (black lines) or high (red lines) RANK, RANKL and OPG expression, respectively, are indicated. () Cross-correlation matrixes to compare RANKL and RANK protein expression (determined by IHC) on human lung tumors with gender. n = 364, Uppsala cohort with early stage treatmentnaïve resected lung cancer, including SCC, AC, SCLC and LCC. P values are indicated, calculated using the Fisher s Exact test. Supplemental Table S1. Significantly enriched c5/go gene sets (FDR <0.1) from a GSEA analysis of KRas;rank fl/fl versus KRas;rank +/+ pneumocytes. 7


8 A Non-small Cell Lung Cancer Adenocarcinoma Squamous Cell Carcinoma Rao_Supplemental Fig S1 Small Cell Carcinoma RANK # of samples % positive Mean H-score # of samples % positive Mean H-score # of samples % positive Mean H-score H1299 negative control C RANK IHCHScore E TRAP U/L P< Cell counts Isotype RANK PC3 positive control RANK + human lung tumor D RANK Flow Cytometry Measurement (Fold Change Over Isotype) RANK - IHC Adenocarcinoma Squamous tumor


![consumption [ml/h/kg]](/docs-images/88/114889367/images/9-2.jpg "0 SP-C Cre;KRas;rank")


![production [ml/h/kg]](/docs-images/88/114889367/images/9-5.jpg "1.2 1 0.8 0.6 0.4 0.")


9 Rao_Supplemental Fig S2 A Control RANK C D average O2 consumption [ml/h/kg] 0 SP-C Cre;KRas;rank +/+ SP-C Cre;KRas;rank f/f average CO2 production [ml/h/kg] *** 0 SP-C Cre;rank +/+ SP-C Cre;rank f/f E RANK - IF KRas;rank fl/fl KRas;rank +/+ Relative RANK mrna expression


10 A KRas;rank +/+ Rao_Supplemental Fig S3 KRas;rankl +/+ n=26 KRas;rankl fl/fl n=17 Percent survival KRas;rank fl/fl C Days post AdCre inhalation KRas;rankl +/ % KRas;rankl f/f 4.93% 6 weeks after AdCre inhalation 30 weeks after AdCre inhalation
11 A T cells and NK cells C D E Rao_Supplemental Fig S4 KRas;rank +/+ KRas;rank fl/fl %CD cells %CD45 + cells %CD45 + cells %Foxp3 + of CD4 + T cells


12 A KRas;rank +/+ C Rao_Supplemental Fig S5 KRas;rank fl/fl


")


 OCR(pmol/min) ATP")
13 A KRas;rank +/+ pneumocytes ** * * Control RANKL C Rao_Supplemental Fig S6 Human lung cancer cells KRas;rank fl/fl pneumocytes ATP production ATP production asal respiration Murine primary lung cancer cells asal respiration *** *** Maximum respiration KRas;rank +/+ KRas;rank fl/fl Spare respiratory capacity D A427 H1437 OCR(pmol/min) OCR(pmol/min) Human lung cancer cells ** ** ** ** * Control RANKL Spare respiratory capacity *** Max. respiration *** H2122 H460 OCR(pmol/min) OCR(pmol/min) ATP production asal respiration Max. respiration Spare Respiratory capacity


14 A RANKL P-p65 NF-k p65 NF-k P-AKT AKT P-p38 p38 A min C KRas;rank +/+ KRas;rank fl/fl w/o +RANKL iakt ip38 inf- PGC1- actin PGC1- actin E # Tumor spheres Rao_Supplemental Fig S7 ** 100 ** *** actin RANKL D Control RANKL RANKL w/o 1h 12h 24h KRas;rank +/+ PGC1- actin RANKL+iAKT RANKL+iP38 RANKL+iNF- KRas;rank fl/fl PGC1- actin

 05 g/ml)")


15 Rao_Supplemental Fig S8 A Control Oligomycin (0.5 g/ml) Oligomycin (0.05 g/ml) C Control Oligomycin (0.5 g/ml) Oligomycin (0.05 g/ml) RANKL Control RANKL Control # tumor spheres N.S KRas;rank fl/fl N.S N.S D % rdu + cells 10% 8% 6% 4% 2% N.S KRas;rank fl/fl N.S N.S 0 RANKL high high low low Oligomycin 0% RANKL high high low low Oligomycin
16 A RANK females RANK males Rao_Supplemental Fig S9 Gender Survival probability p=0.16 n = 715 p=0.1 n = 1100 Male Female RANK 113 (60.4 %) 92 (56.1%) RANK+ 74 (39.6 %) 72 (43.9 %) Male Female Time (month) Time (month) RANKL 87 (46.5 %) 55 (33.5 %) RANKL+ 100 (53.5 %) 109 (66.5 %) Survival probability RANKL females p= n = 715 RANKL - males p=0.038 n = 1100 Fisher s exact test: p = for RANK and gender and p = for RANKL and females. Time (month) Time (month) OPG females OPG males Survival probability p=1.4e 06 n = 715 p= n = 1100 Time (month) Time (month)
fl/+ KRas;Atg5 fl/+ KRas;Atg5 fl/fl KRas;Atg5 fl/fl KRas;Atg5 Supplementary Figure 1. Gene set enrichment analyses. (a) (b)
 (b)") KRas;At KRas;At KRas;At KRas;At a b Supplementary Figure 1. Gene set enrichment analyses. (a) GO gene sets (MSigDB v3. c5) enriched in KRas;Atg5 fl/+ as compared to KRas;Atg5 fl/fl tumors using gene set
KRas;At KRas;At KRas;At KRas;At a b Supplementary Figure 1. Gene set enrichment analyses. (a) GO gene sets (MSigDB v3. c5) enriched in KRas;Atg5 fl/+ as compared to KRas;Atg5 fl/fl tumors using gene set
Supplementary Figure 1. A. Bar graph representing the expression levels of the 19 indicated genes in the microarrays analyses comparing human lung
 Supplementary Figure 1. A. Bar graph representing the expression levels of the 19 indicated genes in the microarrays analyses comparing human lung immortalized broncho-epithelial cells (AALE cells) expressing
Supplementary Figure 1: STAT3 suppresses Kras-induced lung tumorigenesis
 Supplementary Figure 1: STAT3 suppresses Kras-induced lung tumorigenesis (a) Immunohistochemical (IHC) analysis of tyrosine 705 phosphorylation status of STAT3 (P- STAT3) in tumors and stroma (all-time
stability and tumor suppression
 Supplementary information The stress kinase MKK7 couples oncogenic stress to p53 stability and tumor suppression Daniel Schramek 1, Athanassios Kotsinas 2, Arabella Meixner 1, Teiji Wada 1, Ulrich Elling
Supplementary Figures
 Supplementary Figures Supplementary Fig. 1. Galectin-3 is present within tumors. (A) mrna expression levels of Lgals3 (galectin-3) and Lgals8 (galectin-8) in the four classes of cell lines as determined
TEB. Id4 p63 DAPI Merge. Id4 CK8 DAPI Merge
 a Duct TEB b Id4 p63 DAPI Merge Id4 CK8 DAPI Merge c d e Supplementary Figure 1. Identification of Id4-positive MECs and characterization of the Comma-D model. (a) IHC analysis of ID4 expression in the
AP VP DLP H&E. p-akt DLP
 A B AP VP DLP H&E AP AP VP DLP p-akt wild-type prostate PTEN-null prostate Supplementary Fig. 1. Targeted deletion of PTEN in prostate epithelium resulted in HG-PIN in all three lobes. (A) The anatomy
Supplementary Figure S1 Expression of mir-181b in EOC (A) Kaplan-Meier
 Kaplan-Meier") Supplementary Figure S1 Expression of mir-181b in EOC (A) Kaplan-Meier curves for progression-free survival (PFS) and overall survival (OS) in a cohort of patients (N=52) with stage III primary ovarian
Supplementary Figure S1 Expression of mir-181b in EOC (A) Kaplan-Meier curves for progression-free survival (PFS) and overall survival (OS) in a cohort of patients (N=52) with stage III primary ovarian
Supplementary Figures
 Supplementary Figures Supplementary Figure 1. Confirmation of Dnmt1 conditional knockout out mice. a, Representative images of sorted stem (Lin - CD49f high CD24 + ), luminal (Lin - CD49f low CD24 + )
SOPten flox/flox (KO) Pten flox/flox (WT) flox allele 6.0 kb. Pten. Actin. ! allele 2.3 kb. Supplementary Figure S1. Yanagi, et al.
 Pten flox/flox (WT) flox allele 6.0 kb. Pten. Actin. ! allele 2.3 kb. Supplementary Figure S1. Yanagi, et al.") s1 A Pten flox/flox () SOPten flox/flox () flox allele 6. kb B Pten flox/flox () SOPten flox/flox () Pten Actin! allele 2.3 kb Supplementary Figure S1. Yanagi, et al. A B BrdU BrdU positive cells ( ) 3
s1 A Pten flox/flox () SOPten flox/flox () flox allele 6. kb B Pten flox/flox () SOPten flox/flox () Pten Actin! allele 2.3 kb Supplementary Figure S1. Yanagi, et al. A B BrdU BrdU positive cells ( ) 3
SUPPLEMENTARY INFORMATION
 Supplemental Figure 1. Furin is efficiently deleted in CD4 + and CD8 + T cells. a, Western blot for furin and actin proteins in CD4cre-fur f/f and fur f/f Th1 cells. Wild-type and furin-deficient CD4 +
(a) Significant biological processes (upper panel) and disease biomarkers (lower panel)
 Significant biological processes (upper panel) and disease biomarkers (lower panel)") Supplementary Figure 1. Functional enrichment analyses of secretomic proteins. (a) Significant biological processes (upper panel) and disease biomarkers (lower panel) 2 involved by hrab37-mediated secretory
Supplementary Figure 1. Functional enrichment analyses of secretomic proteins. (a) Significant biological processes (upper panel) and disease biomarkers (lower panel) 2 involved by hrab37-mediated secretory
SUPPLEMENTARY FIGURE LEGENDS. atypical adenomatous hyperplasias (AAH); Grade II: adenomas; Grade III: adenocarcinomas;
; Grade II: adenomas; Grade III: adenocarcinomas;") SUPPLEMENTARY FIGURE LEGENDS Supplementary Figure S1: Tumor grades in Ras G12D ; p53 / lung tumors. Representative histology (H&E) of K-Ras G12D ; p53 / lung tumors 13 weeks after tumor initiation. Grade
SUPPLEMENTARY FIGURE LEGENDS Supplementary Figure S1: Tumor grades in Ras G12D ; p53 / lung tumors. Representative histology (H&E) of K-Ras G12D ; p53 / lung tumors 13 weeks after tumor initiation. Grade
Supplementary Figure 1. Efficiency of Mll4 deletion and its effect on T cell populations in the periphery. Nature Immunology: doi: /ni.
 Supplementary Figure 1 Efficiency of Mll4 deletion and its effect on T cell populations in the periphery. Expression of Mll4 floxed alleles (16-19) in naive CD4 + T cells isolated from lymph nodes and
Supplementary Fig. 1. GPRC5A post-transcriptionally down-regulates EGFR expression. (a) Plot of the changes in steady state mrna levels versus
 Plot of the changes in steady state mrna levels versus") Supplementary Fig. 1. GPRC5A post-transcriptionally down-regulates EGFR expression. (a) Plot of the changes in steady state mrna levels versus changes in corresponding proteins between wild type and Gprc5a-/-
Supplementary Fig. 1. GPRC5A post-transcriptionally down-regulates EGFR expression. (a) Plot of the changes in steady state mrna levels versus changes in corresponding proteins between wild type and Gprc5a-/-
SUPPLEMENTARY INFORMATION
 DOI: 1.138/ncb3355 a S1A8 + cells/ total.1.8.6.4.2 b S1A8/?-Actin c % T-cell proliferation 3 25 2 15 1 5 T cells Supplementary Figure 1 Inter-tumoral heterogeneity of MDSC accumulation in mammary tumor
Type of file: PDF Size of file: 0 KB Title of file for HTML: Supplementary Information Description: Supplementary Figures
 Type of file: PDF Size of file: 0 KB Title of file for HTML: Supplementary Information Description: Supplementary Figures Supplementary Figure 1 mir-128-3p is highly expressed in chemoresistant, metastatic
Supplemental Table S1
 Supplemental Table S. Tumorigenicity and metastatic potential of 44SQ cell subpopulations a Tumorigenicity b Average tumor volume (mm ) c Lung metastasis d CD high /4 8. 8/ CD low /4 6./ a Mice were injected
Bezzi et al., Supplementary Figure 1 *** Nature Medicine: doi: /nm Pten pc-/- ;Zbtb7a pc-/- Pten pc-/- ;Pml pc-/- Pten pc-/- ;Trp53 pc-/-
 Gr-1 Gr-1 Gr-1 Bezzi et al., Supplementary Figure 1 a Gr1-CD11b 3 months Spleen T cells 3 months Spleen B cells 3 months Spleen Macrophages 3 months Spleen 15 4 8 6 c CD11b+/Gr1+ cells [%] 1 5 b T cells
Supplementary Figure 1. Identification of tumorous sphere-forming CSCs and CAF feeder cells. The LEAP (Laser-Enabled Analysis and Processing)
") Supplementary Figure 1. Identification of tumorous sphere-forming CSCs and CAF feeder cells. The LEAP (Laser-Enabled Analysis and Processing) platform with laser manipulation to efficiently purify lung
Supplementary Figure 1. Identification of tumorous sphere-forming CSCs and CAF feeder cells. The LEAP (Laser-Enabled Analysis and Processing) platform with laser manipulation to efficiently purify lung
SUPPLEMENTARY FIGURES
 SUPPLEMENTARY FIGURES 1 Supplementary Figure 1, Adult hippocampal QNPs and TAPs uniformly express REST a-b) Confocal images of adult hippocampal mouse sections showing GFAP (green), Sox2 (red), and REST
SUPPLEMENTARY INFORMATION
 1. Supplementary Figures and Legends Supplementary Fig. 1. S1P-mediated transcriptional regulation of integrins expressed in OP/monocytoid cells. Real-time quantitative PCR analyses of mrna for two integrins,
Supplemental Information. Metabolic Maturation during Muscle Stem Cell. Differentiation Is Achieved by mir-1/133a-mediated
 Cell Metabolism, Volume 27 Supplemental Information Metabolic Maturation during Muscle Stem Cell Differentiation Is Achieved by mir-1/133a-mediated Inhibition of the Dlk1-Dio3 Mega Gene Cluster Stas Wüst,
(A) Cells grown in monolayer were fixed and stained for surfactant protein-c (SPC,
 Cells grown in monolayer were fixed and stained for surfactant protein-c (SPC,") Supplemental Figure Legends Figure S1. Cell line characterization (A) Cells grown in monolayer were fixed and stained for surfactant protein-c (SPC, green) and co-stained with DAPI to visualize the nuclei.
Supplemental Figure Legends Figure S1. Cell line characterization (A) Cells grown in monolayer were fixed and stained for surfactant protein-c (SPC, green) and co-stained with DAPI to visualize the nuclei.
Supplemental Information. NRF2 Is a Major Target of ARF. in p53-independent Tumor Suppression
 Molecular Cell, Volume 68 Supplemental Information NRF2 Is a Major Target of ARF in p53-independent Tumor Suppression Delin Chen, Omid Tavana, Bo Chu, Luke Erber, Yue Chen, Richard Baer, and Wei Gu Figure
SUPPLEMENTARY INFORMATION
 DOI: 10.1038/ncb2607 Figure S1 Elf5 loss promotes EMT in mammary epithelium while Elf5 overexpression inhibits TGFβ induced EMT. (a, c) Different confocal slices through the Z stack image. (b, d) 3D rendering
ANGPTL2 increases bone metastasis of breast cancer cells through. Tetsuro Masuda, Motoyoshi Endo, Yutaka Yamamoto, Haruki Odagiri, Tsuyoshi
 Masuda et al. Supplementary information for ANGPTL2 increases bone metastasis of breast cancer cells through enhancing CXCR4 signaling Tetsuro Masuda, Motoyoshi Endo, Yutaka Yamamoto, Haruki Odagiri, Tsuyoshi
Supplementary Figure 1
 Supplementary Figure 1 14 12 SEM4C PLXN2 8 SEM4C C 3 Cancer Cell Non Cancer Cell Expression 1 8 6 6 4 log2 ratio Expression 2 1 4 2 2 p value.1 D Supplementary Figure 1. Expression of Sema4C and Plexin2
SUPPLEMENTARY INFORMATION
 DOI: 10.1038/ncb2638 Figure S1 Morphological characteristics of fetal testes and ovaries from 6.5-20 developmental weeks. Representative images of Hematoxylin and Eosin staining of testes and ovaries over
Supplementary Figure 1. Double-staining immunofluorescence analysis of invasive colon and breast cancers. Specimens from invasive ductal breast
 Supplementary Figure 1. Double-staining immunofluorescence analysis of invasive colon and breast cancers. Specimens from invasive ductal breast carcinoma (a) and colon adenocarcinoma (b) were staining
SOD1 inhibition reduces non-small cell lung cancer by inducing cell death
 SUPPLEMENTAL INFORMATION SOD1 inhibition reduces non-small cell lung cancer by inducing cell death Andrea Glasauer, Laura A. Sena, Lauren P. Diebold, Andrew P. Mazar & Navdeep S. Chandel Inventory of Supplemental
Supplemental Figure 1
 Supplemental Figure 1 1a 1c PD-1 MFI fold change 6 5 4 3 2 1 IL-1α IL-2 IL-4 IL-6 IL-1 IL-12 IL-13 IL-15 IL-17 IL-18 IL-21 IL-23 IFN-α Mut Human PD-1 promoter SBE-D 5 -GTCTG- -1.2kb SBE-P -CAGAC- -1.kb
Supplementary Figure S1. Generation of LSL-EZH2 conditional transgenic mice.
 Downstream Col1A locus S P P P EP Genotyping with P1, P2 frt PGKneopA + frt hygro-pa Targeting vector Genotyping with P3, P4 P1 pcag-flpe P2 P3 P4 frt SApA CAG LSL PGKATG frt hygro-pa C. D. E. ormal KRAS
sequences of a styx mutant reveals a T to A transversion in the donor splice site of intron 5
 sfigure 1 Styx mutant mice recapitulate the phenotype of SHIP -/- mice. (A) Analysis of the genomic sequences of a styx mutant reveals a T to A transversion in the donor splice site of intron 5 (GTAAC
Supplemental Figure 1. Intracranial transduction of a modified ptomo lentiviral vector in the mouse
 Supplemental figure legends Supplemental Figure 1. Intracranial transduction of a modified ptomo lentiviral vector in the mouse hippocampus targets GFAP-positive but not NeuN-positive cells. (A) Stereotaxic
Supplementary Figure 1: Expression of NFAT proteins in Nfat2-deleted B cells (a+b) Protein expression of NFAT2 (a) and NFAT1 (b) in isolated splenic
 Protein expression of NFAT2 (a) and NFAT1 (b) in isolated splenic") Supplementary Figure 1: Expression of NFAT proteins in Nfat2-deleted B cells (a+b) Protein expression of NFAT2 (a) and NFAT1 (b) in isolated splenic B cells from WT Nfat2 +/+, TCL1 Nfat2 +/+ and TCL1 Nfat2
Supplementary Figure 1: Expression of NFAT proteins in Nfat2-deleted B cells (a+b) Protein expression of NFAT2 (a) and NFAT1 (b) in isolated splenic B cells from WT Nfat2 +/+, TCL1 Nfat2 +/+ and TCL1 Nfat2
Figure S1: Effects on haptotaxis are independent of effects on cell velocity A)
") Supplemental Figures Figure S1: Effects on haptotaxis are independent of effects on cell velocity A) Velocity of MV D7 fibroblasts expressing different GFP-tagged Ena/VASP family proteins in the haptotaxis
Supplemental Figures Figure S1: Effects on haptotaxis are independent of effects on cell velocity A) Velocity of MV D7 fibroblasts expressing different GFP-tagged Ena/VASP family proteins in the haptotaxis
EPIGENETIC RE-EXPRESSION OF HIF-2α SUPPRESSES SOFT TISSUE SARCOMA GROWTH
 EPIGENETIC RE-EXPRESSION OF HIF-2α SUPPRESSES SOFT TISSUE SARCOMA GROWTH Supplementary Figure 1. Supplementary Figure 1. Characterization of KP and KPH2 autochthonous UPS tumors. a) Genotyping of KPH2
Supplementary Figure 1. Deletion of Smad3 prevents B16F10 melanoma invasion and metastasis in a mouse s.c. tumor model.
 A B16F1 s.c. Lung LN Distant lymph nodes Colon B B16F1 s.c. Supplementary Figure 1. Deletion of Smad3 prevents B16F1 melanoma invasion and metastasis in a mouse s.c. tumor model. Highly invasive growth
marker. DAPI labels nuclei. Flies were 20 days old. Scale bar is 5 µm. Ctrl is
 Supplementary Figure 1. (a) Nos is detected in glial cells in both control and GFAP R79H transgenic flies (arrows), but not in deletion mutant Nos Δ15 animals. Repo is a glial cell marker. DAPI labels
Postn MCM Smad2 fl/fl Postn MCM Smad3 fl/fl Postn MCM Smad2/3 fl/fl. Postn MCM. Tgfbr1/2 fl/fl TAC
 A Smad2 fl/fl Smad3 fl/fl Smad2/3 fl/fl Tgfbr1/2 fl/fl 1. mm B Tcf21 MCM Tcf21 MCM Smad3 fl/fl Tcf21 MCM Smad2/3 fl/fl Tcf21 MCM Tgfbr1/2 fl/fl αmhc MCM C 1. mm 1. mm D Smad2 fl/fl Smad3 fl/fl Smad2/3
hexahistidine tagged GRP78 devoid of the KDEL motif (GRP78-His) on SDS-PAGE. This
 on SDS-PAGE. This") SUPPLEMENTAL FIGURE LEGEND Fig. S1. Generation and characterization of. (A) Coomassie staining of soluble hexahistidine tagged GRP78 devoid of the KDEL motif (GRP78-His) on SDS-PAGE. This protein was expressed
SUPPLEMENTAL FIGURE LEGEND Fig. S1. Generation and characterization of. (A) Coomassie staining of soluble hexahistidine tagged GRP78 devoid of the KDEL motif (GRP78-His) on SDS-PAGE. This protein was expressed
SUPPLEMENTARY INFORMATION
 doi:10.1038/nature10866 a b 1 2 3 4 5 6 7 Match No Match 1 2 3 4 5 6 7 Turcan et al. Supplementary Fig.1 Concepts mapping H3K27 targets in EF CBX8 targets in EF H3K27 targets in ES SUZ12 targets in ES
Supplementary Table 1. The primers used for quantitative RT-PCR. Gene name Forward (5 > 3 ) Reverse (5 > 3 )
 Reverse (5 > 3 )") 770 771 Supplementary Table 1. The primers used for quantitative RT-PCR. Gene name Forward (5 > 3 ) Reverse (5 > 3 ) Human CXCL1 GCGCCCAAACCGAAGTCATA ATGGGGGATGCAGGATTGAG PF4 CCCCACTGCCCAACTGATAG TTCTTGTACAGCGGGGCTTG
770 771 Supplementary Table 1. The primers used for quantitative RT-PCR. Gene name Forward (5 > 3 ) Reverse (5 > 3 ) Human CXCL1 GCGCCCAAACCGAAGTCATA ATGGGGGATGCAGGATTGAG PF4 CCCCACTGCCCAACTGATAG TTCTTGTACAGCGGGGCTTG
Supplementary. properties of. network types. randomly sampled. subsets (75%
 Supplementary Information Gene co-expression network analysis reveals common system-level prognostic genes across cancer types properties of Supplementary Figure 1 The robustness and overlap of prognostic
Title: Smooth muscle cell-specific Tgfbr1 deficiency promotes aortic aneurysm formation by stimulating multiple signaling events
 Title: Smooth muscle cell-specific Tgfbr1 deficiency promotes aortic aneurysm formation by stimulating multiple signaling events Pu Yang 1, 3, radley M. Schmit 1, Chunhua Fu 1, Kenneth DeSart 1, S. Paul
Supplemental Figure 1. (A) The localization of Cre DNA recombinase in the testis of Cyp19a1-Cre mice was detected by immunohistchemical analyses
 The localization of Cre DNA recombinase in the testis of Cyp19a1-Cre mice was detected by immunohistchemical analyses") Supplemental Figure 1. (A) The localization of Cre DNA recombinase in the testis of Cyp19a1-Cre mice was detected by immunohistchemical analyses using an anti-cre antibody; testes at 1 week (left panel),
Supplemental Figure 1. (A) The localization of Cre DNA recombinase in the testis of Cyp19a1-Cre mice was detected by immunohistchemical analyses using an anti-cre antibody; testes at 1 week (left panel),
Figure S1. (A) Schematic diagram of dnrar transgene allele. (B) X-Gal staining of testis from
 Schematic diagram of dnrar transgene allele. (B) X-Gal staining of testis from") Figure S1. (A) Schematic diagram of dnrar transgene allele. (B) X-Gal staining of testis from germ cell mutants (dnrar flox/flox, Stra8-Cre +, RARElacZ) (A ), controls (dnrar flox/flox, RARElacZ) (B ),
Figure S1. (A) Schematic diagram of dnrar transgene allele. (B) X-Gal staining of testis from germ cell mutants (dnrar flox/flox, Stra8-Cre +, RARElacZ) (A ), controls (dnrar flox/flox, RARElacZ) (B ),
Figure S1, related to Figure 1. Escaper p38a-expressing cancer cells repopulate the tumors (A) Scheme of the mt/mg reporter that expresses a
 Scheme of the mt/mg reporter that expresses a") Cancer Cell, Volume 33 Supplemental Information Targeting p38a Increases DNA Damage, Chromosome Instability, and the Anti-tumoral Response to Taxanes in Breast Cancer Cells Begoña Cánovas, Ana Igea, Alessandro
Cancer Cell, Volume 33 Supplemental Information Targeting p38a Increases DNA Damage, Chromosome Instability, and the Anti-tumoral Response to Taxanes in Breast Cancer Cells Begoña Cánovas, Ana Igea, Alessandro
Nature Medicine: doi: /nm.4078
 Supplementary Figure 1. Cetuximab induces ER stress response in DiFi cells. (a) Scheme of SILAC proteome. (b) MS-base read out of SILAC experiment. The histogram of log 2 -transformed normalized H/L ratios
Supplementary Information Titles Journal: Nature Medicine
 Supplementary Information Titles Journal: Nature Medicine Article Title: Corresponding Author: Supplementary Item & Number Supplementary Fig.1 Fig.2 Fig.3 Fig.4 Fig.5 Fig.6 Fig.7 Fig.8 Fig.9 Fig. Fig.11
Supplemental Table 1. Primer sequences for transcript analysis
 Supplemental Table 1. Primer sequences for transcript analysis Primer Sequence (5 3 ) Primer Sequence (5 3 ) Mmp2 Forward CCCGTGTGGCCCTC Mmp15 Forward CGGGGCTGGCT Reverse GCTCTCCCGGTTTC Reverse CCTGGTGTGCCTGCTC
SSM signature genes are highly expressed in residual scar tissues after preoperative radiotherapy of rectal cancer.
 Supplementary Figure 1 SSM signature genes are highly expressed in residual scar tissues after preoperative radiotherapy of rectal cancer. Scatter plots comparing expression profiles of matched pretreatment
Supplementary Figure 1: Hsp60 / IEC mice are embryonically lethal (A) Light microscopic pictures show mouse embryos at developmental stage E12.
 Light microscopic pictures show mouse embryos at developmental stage E12.") Supplementary Figure 1: Hsp60 / IEC mice are embryonically lethal (A) Light microscopic pictures show mouse embryos at developmental stage E12.5 and E13.5 prepared from uteri of dams and subsequently genotyped.
Supplementary Figure 1: Hsp60 / IEC mice are embryonically lethal (A) Light microscopic pictures show mouse embryos at developmental stage E12.5 and E13.5 prepared from uteri of dams and subsequently genotyped.
SUPPLEMENTARY INFORMATION
 doi:10.1038/nature12652 Supplementary Figure 1. PRDM16 interacts with endogenous EHMT1 in brown adipocytes. Immunoprecipitation of PRDM16 complex by flag antibody (M2) followed by Western blot analysis
SUPPLEMENTARY INFORMATION
 DOI:.38/ncb3399 a b c d FSP DAPI 5mm mm 5mm 5mm e Correspond to melanoma in-situ Figure a DCT FSP- f MITF mm mm MlanaA melanoma in-situ DCT 5mm FSP- mm mm mm mm mm g melanoma in-situ MITF MlanaA mm mm
SUPPLEMENTARY INFORMATION
 Supplementary Figure 1. Behavioural effects of ketamine in non-stressed and stressed mice. Naive C57BL/6 adult male mice (n=10/group) were given a single dose of saline vehicle or ketamine (3.0 mg/kg,
Supplementary Figure 1. Normal T lymphocyte populations in Dapk -/- mice. (a) Normal thymic development in Dapk -/- mice. Thymocytes from WT and Dapk
 Normal thymic development in Dapk -/- mice. Thymocytes from WT and Dapk") Supplementary Figure 1. Normal T lymphocyte populations in Dapk -/- mice. (a) Normal thymic development in Dapk -/- mice. Thymocytes from WT and Dapk -/- mice were stained for expression of CD4 and CD8.
Supplementary Figure 1. Normal T lymphocyte populations in Dapk -/- mice. (a) Normal thymic development in Dapk -/- mice. Thymocytes from WT and Dapk -/- mice were stained for expression of CD4 and CD8.
well for 2 h at rt. Each dot represents an individual mouse and bar is the mean ±
 Supplementary data: Control DC Blimp-1 ko DC 8 6 4 2-2 IL-1β p=.5 medium 8 6 4 2 IL-2 Medium p=.16 8 6 4 2 IL-6 medium p=.3 5 4 3 2 1-1 medium IL-1 n.s. 25 2 15 1 5 IL-12(p7) p=.15 5 IFNγ p=.65 4 3 2 1
SUPPLEMENTARY INFORMATION
 SUPPLEMENTARY INFORMATION Supplementary Figure 1. The expression of ephrin-b2 H2BGFP persists in the post-hearingonset organ of Corti and is specifically restricted to supporting cells. Sox2 immunolabeling
Supplemental Table 1 Molecular Profile of the SCLC Cell Line Panel
 Supplemental Table 1 Molecular Profile of the SCLC Cell Line Panel p53 RB Myc Cell Line Mutation A Mutation A Amplification B COR-L103 C p.y234c p.d584e L-Myc NCI-H526 p.s33_splice None N-Myc NCI-H1048
X P. Supplementary Figure 1. Nature Medicine: doi: /nm Nilotinib LSK LT-HSC. Cytoplasm. Cytoplasm. Nucleus. Nucleus
 a b c Supplementary Figure 1 c-kit-apc-eflu780 Lin-FITC Flt3-Linc-Kit-APC-eflu780 LSK Sca-1-PE-Cy7 d e f CD48-APC LT-HSC CD150-PerCP-cy5.5 g h i j Cytoplasm RCC1 X Exp 5 mir 126 SPRED1 SPRED1 RAN P SPRED1
Supplementary Materials
 Supplementary Materials Supplementary figure 1. Taxonomic representation summarized at genus level. Fecal microbiota from a separate set of Jackson and Harlan mice prior to irradiation. A taxon was included
(A) PCR primers (arrows) designed to distinguish wild type (P1+P2), targeted (P1+P2) and excised (P1+P3)14-
 PCR primers (arrows) designed to distinguish wild type (P1+P2), targeted (P1+P2) and excised (P1+P3)14-") 1 Supplemental Figure Legends Figure S1. Mammary tumors of ErbB2 KI mice with 14-3-3σ ablation have elevated ErbB2 transcript levels and cell proliferation (A) PCR primers (arrows) designed to distinguish
1 Supplemental Figure Legends Figure S1. Mammary tumors of ErbB2 KI mice with 14-3-3σ ablation have elevated ErbB2 transcript levels and cell proliferation (A) PCR primers (arrows) designed to distinguish
7SK ChIRP-seq is specifically RNA dependent and conserved between mice and humans.
 Supplementary Figure 1 7SK ChIRP-seq is specifically RNA dependent and conserved between mice and humans. Regions targeted by the Even and Odd ChIRP probes mapped to a secondary structure model 56 of the
T H E J O U R N A L O F C E L L B I O L O G Y
 T H E J O U R N A L O F C E L L B I O L O G Y Supplemental material Amelio et al., http://www.jcb.org/cgi/content/full/jcb.201203134/dc1 Figure S1. mir-24 regulates proliferation and by itself induces
Balancing intestinal and systemic inflammation through cell type-specific expression of
 Supplementary Information Balancing intestinal and systemic inflammation through cell type-specific expression of the aryl hydrocarbon receptor repressor Olga Brandstätter 1,2,6, Oliver Schanz 1,6, Julia
Pathologic Stage. Lymph node Stage
 ASC ASC a c Patient ID BMI Age Gleason score Non-obese PBMC 1 22.1 81 6 (3+3) PBMC 2 21.9 6 6 (3+3) PBMC 3 22 84 8 (4+4) PBMC 4 24.6 68 7 (3+4) PBMC 24. 6 (3+3) PBMC 6 24.7 73 7 (3+4) PBMC 7 23. 67 7 (3+4)
Supplementary Figure 1. Lkb1-deficient lung ADC progressively transdifferentiates into SCC. (a) A scheme showing the progression pattern of atypical
 A scheme showing the progression pattern of atypical") Supplementary Figure 1. Lkb1-deficient lung ADC progressively transdifferentiates into SCC. (a) A scheme showing the progression pattern of atypical adenomatous hyperplasia/epithelial hyperplasia (AAH/EH),
Supplementary Figure 1. Lkb1-deficient lung ADC progressively transdifferentiates into SCC. (a) A scheme showing the progression pattern of atypical adenomatous hyperplasia/epithelial hyperplasia (AAH/EH),
SUPPLEMENTARY INFORMATION
 doi:1.138/nature1554 a TNF-α + in CD4 + cells [%] 1 GF SPF 6 b IL-1 + in CD4 + cells [%] 5 4 3 2 1 Supplementary Figure 1. Effect of microbiota on cytokine profiles of T cells in GALT. Frequencies of TNF-α
Supplementary Figures
 Supplementary Figures Supplementary Figure 1 Correlation between LKB1 and YAP expression in human lung cancer samples. (a) Representative photos showing LKB1 and YAP immunohistochemical staining in human
BRaf V600E cooperates with Pten silencing to elicit metastatic melanoma (Nature Genetics Supplementary Information)
") BRaf V600E cooperates with Pten silencing to elicit metastatic melanoma (Nature Genetics Supplementary Information) David Dankort, David P. Curley, Robert A. Cartlidge, Betsy Nelson, Anthony N. Karnezis,
BRaf V600E cooperates with Pten silencing to elicit metastatic melanoma (Nature Genetics Supplementary Information) David Dankort, David P. Curley, Robert A. Cartlidge, Betsy Nelson, Anthony N. Karnezis,
Loss of RhoA promotes skin tumor formation. Supplementary Figure 1. Loss of RhoA does not impair F-actin organization.
 Supplementary Figure Legends Supplementary Figure 1. Loss of RhoA does not impair F-actin organization. a. Representative IF images of F-actin staining of big and small control (left) and RhoA ko tumors
Expanded View Figures
 Shao-Ming Shen et al Role of I in MT of cancers MO reports xpanded View igures igure V1. nalysis of the expression of I isoforms in cancer cells and their interaction with PTN. RT PR detection of Ish and
Supplementary Figure 1. BMS enhances human T cell activation in vitro in a
 Supplementary Figure 1. BMS98662 enhances human T cell activation in vitro in a concentration-dependent manner. Jurkat T cells were activated with anti-cd3 and anti-cd28 antibody in the presence of titrated
Supplementary Figure 1:
 Supplementary Figure 1: (A) Whole aortic cross-sections stained with Hematoxylin and Eosin (H&E), 7 days after porcine-pancreatic-elastase (PPE)-induced AAA compared to untreated, healthy control aortas
Supplementary Figure 1. Genotyping strategies for Mcm3 +/+, Mcm3 +/Lox and Mcm3 +/- mice and luciferase activity in Mcm3 +/Lox mice. A.
 Supplementary Figure 1. Genotyping strategies for Mcm3 +/+, Mcm3 +/Lox and Mcm3 +/- mice and luciferase activity in Mcm3 +/Lox mice. A. Upper part, three-primer PCR strategy at the Mcm3 locus yielding
Supplementary Figure 1: GFAP positive nerves in patients with adenocarcinoma of
 SUPPLEMENTARY FIGURES AND MOVIE LEGENDS Supplementary Figure 1: GFAP positive nerves in patients with adenocarcinoma of the pancreas. (A) Images of nerves stained for GFAP (green), S100 (red) and DAPI
Breeding scheme, transgenes, histological analysis and site distribution of SB-mutagenized osteosarcoma.
 Supplementary Figure 1 Breeding scheme, transgenes, histological analysis and site distribution of SB-mutagenized osteosarcoma. (a) Breeding scheme. R26-LSL-SB11 homozygous mice were bred to Trp53 LSL-R270H/+
Ductal pancreatic cancer modeling and drug screening using human pluripotent stem cell and patient-derived tumor organoids
 Ductal pancreatic cancer modeling and drug screening using human pluripotent stem cell and patient-derived tumor organoids Ling Huang 1, Audrey Holtzinger 1,2,11, Ishaan Jagan 1,11, Michael BeGora 1, Ines
SUPPLEMENTARY INFORMATION
 DOI: 10.1038/ncb2697 Figure S1 Cytokeratin 5 is a specific marker for basal and intermediate cells in all mouse prostate lobes. (a) Immunofluorescence staining showing co-localization of YFP with p63 in
SUPPLEMENTARY FIGURES
 SUPPLEMENTARY FIGURES Figure S1. Clinical significance of ZNF322A overexpression in Caucasian lung cancer patients. (A) Representative immunohistochemistry images of ZNF322A protein expression in tissue
Supplementary Table 1
 Supplementary Table 1 Flow Cytometry Antibodies Antibody Fluorochrome Clone Vendor CD45 PE-cyanine 7 30-F11 D ioscience CD3 Pacific lue 17A2 iolegend (San Diego, CA) CD11b APC M1/70 iolegend (San Diego,
Supplemental Figure 1. Western blot analysis indicated that MIF was detected in the fractions of
 Supplemental Figure Legends Supplemental Figure 1. Western blot analysis indicated that was detected in the fractions of plasma membrane and cytosol but not in nuclear fraction isolated from Pkd1 null
Supplementary Figure 1. Characterization of basophils after reconstitution of SCID mice
 Supplementary figure legends Supplementary Figure 1. Characterization of after reconstitution of SCID mice with CD4 + CD62L + T cells. (A-C) SCID mice (n = 6 / group) were reconstituted with 2 x 1 6 CD4
Supplemental Information. Menin Deficiency Leads to Depressive-like. Behaviors in Mice by Modulating. Astrocyte-Mediated Neuroinflammation
 Neuron, Volume 100 Supplemental Information Menin Deficiency Leads to Depressive-like Behaviors in Mice by Modulating Astrocyte-Mediated Neuroinflammation Lige Leng, Kai Zhuang, Zeyue Liu, Changquan Huang,
Suppl Video: Tumor cells (green) and monocytes (white) are seeded on a confluent endothelial
 and monocytes (white) are seeded on a confluent endothelial") Supplementary Information Häuselmann et al. Monocyte induction of E-selectin-mediated endothelial activation releases VE-cadherin junctions to promote tumor cell extravasation in the metastasis cascade
Supplementary Information Häuselmann et al. Monocyte induction of E-selectin-mediated endothelial activation releases VE-cadherin junctions to promote tumor cell extravasation in the metastasis cascade
Alan G. Casson FRCSC Professor of Surgery & VP Integrated Health Services University of Saskatchewan & Saskatoon Health Region
 Identification and Characterization of Stem-like Cells in Human Esophageal Adenocarcinoma and Normal Epithelial Cell Lines No disclosures / conflict of interest Alan G. Casson FRCSC Professor of Surgery
File Name: Supplementary Information Description: Supplementary Figures and Supplementary Table. File Name: Peer Review File Description:
 File Name: Supplementary Information Description: Supplementary Figures and Supplementary Table File Name: Peer Review File Description: Supplementary Table 1 Primers and taqman probes used were the following:
Supplementary Figure 1. EC-specific Deletion of Snail1 Does Not Affect EC Apoptosis. (a,b) Cryo-sections of WT (a) and Snail1 LOF (b) embryos at
 Cryo-sections of WT (a) and Snail1 LOF (b) embryos at") Supplementary Figure 1. EC-specific Deletion of Snail1 Does Not Affect EC Apoptosis. (a,b) Cryo-sections of WT (a) and Snail1 LOF (b) embryos at E10.5 were double-stained for TUNEL (red) and PECAM-1 (green).
Supplementary Figure 1. EC-specific Deletion of Snail1 Does Not Affect EC Apoptosis. (a,b) Cryo-sections of WT (a) and Snail1 LOF (b) embryos at E10.5 were double-stained for TUNEL (red) and PECAM-1 (green).
SHREE ET AL, SUPPLEMENTAL MATERIALS. (A) Workflow for tumor cell line derivation and orthotopic implantation.
 Workflow for tumor cell line derivation and orthotopic implantation.") SHREE ET AL, SUPPLEMENTAL MATERIALS SUPPLEMENTAL FIGURE AND TABLE LEGENDS Supplemental Figure 1. Derivation and characterization of TS1-TGL and TS2-TGL PyMT cell lines and development of an orthotopic
SHREE ET AL, SUPPLEMENTAL MATERIALS SUPPLEMENTAL FIGURE AND TABLE LEGENDS Supplemental Figure 1. Derivation and characterization of TS1-TGL and TS2-TGL PyMT cell lines and development of an orthotopic
MicroRNA-31 initiates lung tumorigenesis and promotes mutant KRAS-driven lung cancer
 The Journal of Clinical Investigation Research article MicroRNA-31 initiates lung tumorigenesis and promotes mutant KRAS-driven lung cancer Mick D. Edmonds, 1 Kelli L. Boyd, 1 Tamara Moyo, 2 Ramkrishna
Supplementary Figure 1. The mir-182 binding site of SMAD7 3 UTR and the. mutated sequence.
 Supplementary Figure 1. The mir-182 binding site of SMAD7 3 UTR and the mutated sequence. 1 Supplementary Figure 2. Expression of mir-182 and SMAD7 in various cell lines. (A) Basal levels of mir-182 expression
Supplementary Table 1. Classification of pathogenic BRCA1 mutations in prophylactic mastectomy samples
 Supplementary Table 1. Classification of pathogenic BRCA1 mutations in prophylactic mastectomy samples Patient ID Age (yrs) BIC classification * HGVS classification # 1 2 BRCA1 del exon BRCA1g.71598-?_71681+?del
Supplementary Figure 1. Repression of hepcidin expression in the liver of mice treated with
 Supplementary Figure 1. Repression of hepcidin expression in the liver of mice treated with DMN Immunohistochemistry for hepcidin and H&E staining (left). qrt-pcr assays for hepcidin in the liver (right).
Akt and mtor pathways differentially regulate the development of natural and inducible. T H 17 cells
 Akt and mtor pathways differentially regulate the development of natural and inducible T H 17 cells Jiyeon S Kim, Tammarah Sklarz, Lauren Banks, Mercy Gohil, Adam T Waickman, Nicolas Skuli, Bryan L Krock,
Supplemental Table S1. Primers used in qrt-pcr analyses. Supplemental Figure S1, related to Figure 4. Extracellular matrix proteins
 Supplemental Material PDGFRb regulates craniofacial development through homodimers and functional heterodimers with PDGFRa Katherine A. Fantauzzo and Philippe Soriano Supplemental materials provided: Supplemental
SUPPLEMENTARY LEGENDS...
 TABLE OF CONTENTS SUPPLEMENTARY LEGENDS... 2 11 MOVIE S1... 2 FIGURE S1 LEGEND... 3 FIGURE S2 LEGEND... 4 FIGURE S3 LEGEND... 5 FIGURE S4 LEGEND... 6 FIGURE S5 LEGEND... 7 FIGURE S6 LEGEND... 8 FIGURE
Supplementary Figure 1 IMQ-Induced Mouse Model of Psoriasis. IMQ cream was
 Supplementary Figure 1 IMQ-Induced Mouse Model of Psoriasis. IMQ cream was painted on the shaved back skin of CBL/J and BALB/c mice for consecutive days. (a, b) Phenotypic presentation of mouse back skin
Supplementary Materials for
 www.sciencesignaling.org/cgi/content/full/8/385/ra70/dc1 Supplementary Materials for The interaction of heparan sulfate proteoglycans with endothelial transglutaminase-2 limits VEGF 165 -induced angiogenesis