Prolonged mitotic arrest induces a caspase-dependent DNA damage
|
|
|
- Jemimah Walton
- 5 years ago
- Views:
Transcription
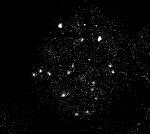
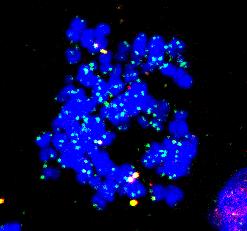
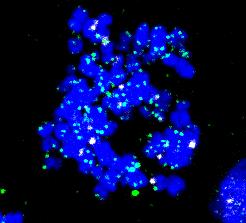
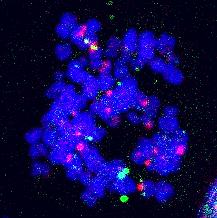
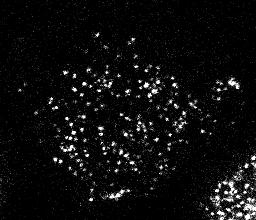
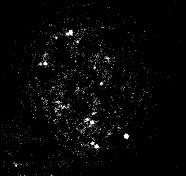
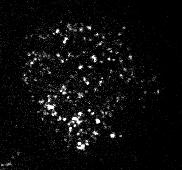
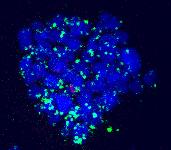
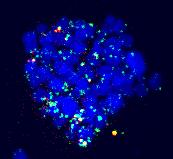
1 SUPPLEMENTARY INFORMATION Prolonged mitotic arrest induces a caspase-dependent DNA damage response at telomeres that determines cell survival Karolina O. Hain, Didier J. Colin, Shubhra Rastogi, Lindsey A. Allan and Paul R. Clarke* SUPPLEMENTARY FIGURE LEGENDS Supplementary Figure. Mitotic telomere damage is conserved and dependent on caspase-3/7 and DNA-PK. A. Mitotic DNA damage is also present in a cell line expressing telomerase. A549 cells were treated with nocodazole for two hours and mitotic cells were washed off and collected (N2M) or replated in nocodazole for further 4 h (N6M). The cells were treated with nocodazole alone or also with zvad-fmk or DNA-PKi (NU744). Mitotic cells were spun onto glass slides and stained with an antibody against γh2ax and foci were counted. B. Caspase-dependent mitotic DNA damage is due to the period of mitotic arrest and is independent of the use of a microtubule poison. U2OS cells with expression of MAD2 induced by doxycycline for -2 h were washed to remove mitotic cells, which were discarded, then 2 hours later additional mitotic cells were collected (2M) or replated for a further 4 hours (6M) +/- zvad-fmk before samples were prepared for microscopy. For
2 comparison, cells without doxycycline-induction of MAD2 were treated with nocodazole for 2 hours and replated in nocodazole for further 4 hours (N6M). Supplementary Figure 2. caspase activation during mitotic arrest. A. Schematic illustration of the detection of caspase-3/7 activity by NucView. The nonfluorescent DEVD-NucView 488 substrate is cleaved by active caspase 3/7, resulting in the nuclear migration and DNA binding of the NucView 488 dye, activating its fluorescent properties. This probe does not covalently bind and inhibit caspases allowing a sensitive and cumulative measurement of caspase activity. B. Analysis of caspase-3/7 activity by flow cytometry. Asynchronous U2OS cells untreated (As) or pre-treated with actinomycin D for 24 h (ActD) were incubated with the fluorescent caspase-3/7 substrate DEVD-NucView 488 (NucView) or without substrate (no probe) for 4 h and analysed by flow cytometry. As depicted, sub-apoptotic and apoptotic cells were gated on the DEVD-NucView 488 / Side Scatter (FL/SSC) channels for precision. Subapoptoticand apoptotic-associated caspase 3/7 activity is indicated. C. Cell cycle phase-dependent sensitivity to Navitoclax. Asynchronous cells (As) or cells arrested in mitosis for 2 h with nocodazole (N2M) were incubated with Navitoclax (Navi) at the concentration shown or zvad-fmk (zvad) for a further 4 h with further addition of nocodazole in the case of N2M samples. Samples were analysed by flow cytometry after incubation for 4h with DEVD-NucView 488 (NucView) and background fluorescence was acquired in samples not treated with the probe (Ctrl). The graph (right) shows relative mean fluorescence intensities in sub-apoptotic cells ± SD from 3 independent experiments, one of which is shown (left). D. Time-dependent induction of sub-apoptotic caspase-3/7 activity by nocodazole is enhanced by Navitoclax. Asynchronous cells (As) or cells arrested in mitosis for 2 h with 2
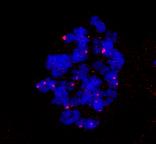
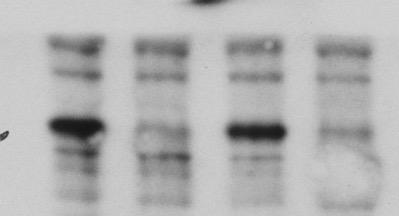
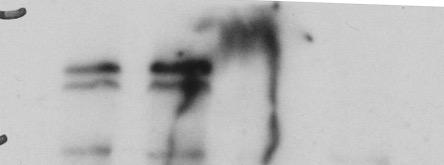
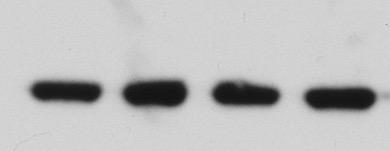
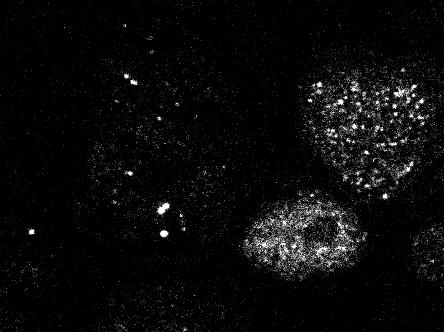
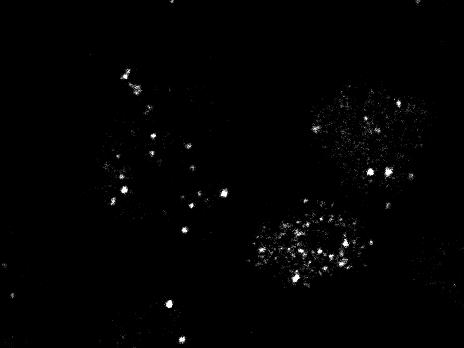
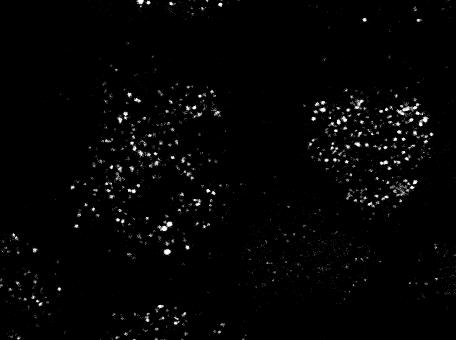
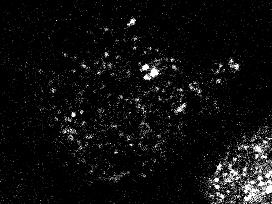
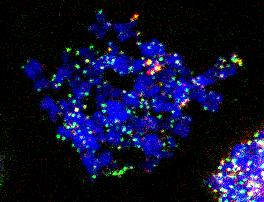
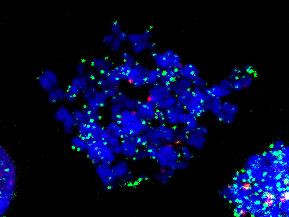
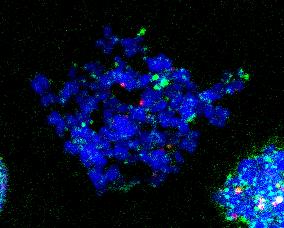
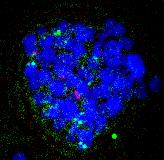
3 nocodazole (N2M) were incubated with Navitoclax (Navi) alone or together with zvad-fmk where indicated for a further 2, 4 or 8 h with further addition of nocodazole in the case of N2M samples. Upper panels: caspase-3/7 activity was assayed by flow cytometry using DEVD-NucView 488 (NucView). Control cells were incubated without NucView to obtain background fluorescence for each condition (Ctrl). Lower panel: relative mean fluorescence intensities ± SD from duplicate wells of a representative experiment. Supplementary Figure 3. Role of TRF2 and CAD in telomere damage during mitotic arrest. A. Caspase-dependent TRF2 loss is determined by the period of mitotic arrest. U2OS cells were treated with nocodazole for 2 h +/- zvad-fmk. Mitotic cells were then washed off and either collected (N2M) or replated in nocodazole containing medium for a further 4 h (N6M). Mitotic cells were stained with antibodies against TRF2, γh2ax and a telomere probe (TTAGGG) and the number of foci per cell was counted. Scale bar, µm. B. TRF2 loss is not due to telomere loss. U2OS cells were treated with nocodazole for 2 hours and mitotic cells were washed off and collected (N2M) or replated in nocodazole for further 4 h (N6M). Some cells were also treated with zvad-fmk at the same time as nocodazole (N6M zvad). Normal mitotic cells (M) were also washed off from asynchronous cultures. Mitotic cells were spun onto glass slides and stained with a telomere probe and telomeric foci were counted. The graph shows the results from three independent experiments. Data were normalised to N6M samples. C. sirna depletion of CAD and TRF2. U2OS cells were transfected with sirnas targeting CAD, TRF2 or CAD and TRF2 together. After 36 hours the cells were collected and lysed and processed for Western blotting with the indicated antibodies. 3
4 D. Overexpression of TRF2 prevents the formation of γh2ax foci during mitotic arrest. Mitotic U2OS cells expressing GFP-TRF2 or GFP alone treated with nocodazole were collected at indicated timepoints. Cells were spun onto microscopy slides and analysed for γh2ax foci. The graph shows mean numbers of foci per cell +/- SD from three independent experiments; * p<.5. Supplementary Figure 4. DNA-PK and ATM are required for cell survival after mitotic arrest. U2OS cells were treated with ng/ml nocodazole for 2 h and then mitotic cells were washed off and re-plated in nocodazole containing medium +/- chemical inhibitors of DNA-PK (NU744, PKi), ATM (KU55933, ATMi) or caspase-3/7 (zvad-fmk, zvad) for further two hours (N4M). The mean number of colonies surviving after -4 days +/-SD in three independent experiments is shown. 4
5 Supplementary Figure A γh2ax foci/cell A549 cells p=.5 5 p= Ctrl. Ctrl. zvad PKi N2M N6M B H2AX in MAD2 cells 2 p= M 6M 6M zvad N6M MAD2 +Dox no Dox
6 A Supplementary Figure 2 DEVD NucView Caspase 3/7 activity DEVD + NucView Migration to nucleus NucView DNA B 4 As + 4 h 4 ActD 3 3 Count 2 2 DEVD-NucView 488 C As + 4 h N2M + 4 h 5 D Count Navi 5 nm z-vad DMSO DEVD-NucView 488 Navi 5 nm z-vad DMSO caspase 3/7 activity (A.U.) DMSO z-vad Navi 5 nm Navi nm Navi 2 nm As + 4 h DMSO z-vad Navi 5 nm Navi nm Navi 2 nm N2M + 4 h As + 8h z-vad N2M + 8h z-vad As + 4 h z-vad N2M + 4 h z-vad Count As + 2 h z-vad N2M + 2 h z-vad As + 8 h N2M + 8 h As + 4 h N2M + 4 h As + 2 h N2M + 2 h As + 8h Navi µm + z-vad N2M + 8h Navi 5 nm + z-vad As + 4 h Navi µm + z-vad N2M + 4 h Navi 5 nm + z-vad Count As + 2 h Navi µm + z-vad As + 8 h Navi µm N2M + 2 h Navi 5 nm + z-vad N2M + 8 h Navi 5 nm As + 4 h Navi µm N2M + 4 h Navi 5 nm DEVD-NucView 488 As + 2 h Navi µm N2M + 2 h Navi 5 nm
7 Supplementary Figure 3 A TRF2 H2AX Probe TRF2 / Probe H2AX / Probe /DNA H2AX / TRF2 /DNA N2M N6M N6M zvad B Normalised number of telomere foci C si CAD: si TRF2: MW kda TRF2 CAD D γh2ax M N2M N6M N6M zvad GFP-TRF2 merge + DAPI actin N8M GFP-TRF2 N8M control
8 Supplementary Figure 4 Relative number of colonies p=.2 * ns M N4M
Relative SOD1 activity. Relative SOD2 activity. Relative SOD activity (Infected:Mock) + CP + DDC
 + CP + DDC") Supplementary Figure 1. SOD1 activity is significantly increased relative to SOD1 levels. SOD1 and SOD2 activities in the infected mork13 cells are shown normalised to their corresponding levels and relative
Supplementary Figure 1. SOD1 activity is significantly increased relative to SOD1 levels. SOD1 and SOD2 activities in the infected mork13 cells are shown normalised to their corresponding levels and relative
Supplementary Figure 1
 Supplementary Figure 1 a γ-h2ax MDC1 RNF8 FK2 BRCA1 U2OS Cells sgrna-1 ** 60 sgrna 40 20 0 % positive Cells (>5 foci per cell) b ** 80 sgrna sgrna γ-h2ax MDC1 γ-h2ax RNF8 FK2 MDC1 BRCA1 RNF8 FK2 BRCA1
Effects of UBL5 knockdown on cell cycle distribution and sister chromatid cohesion
 Supplementary Figure S1. Effects of UBL5 knockdown on cell cycle distribution and sister chromatid cohesion A. Representative examples of flow cytometry profiles of HeLa cells transfected with indicated
Supplementary figure legends
 Supplementary figure legends Supplementary Figure 1. Exposure of CRT occurs independently from the apoptosisassociated loss of the mitochondrial membrane potential (MMP). (A) HeLa cells treated with MTX
Supplementary Figure S1
 Supplementary Figure S1 Supplementary Figure S1. PARP localization patterns using GFP-PARP and PARP-specific antibody libraries GFP-PARP localization in non-fixed (A) and formaldehyde fixed (B) GFP-PARPx
SUPPLEMENT. Materials and methods
 SUPPLEMENT Materials and methods Cell culture and reagents Cell media and reagents were from Invitrogen unless otherwise indicated. Antibiotics and Tet-certified serum were from Clontech. In experiments
Supplemental Materials. STK16 regulates actin dynamics to control Golgi organization and cell cycle
 Supplemental Materials STK16 regulates actin dynamics to control Golgi organization and cell cycle Juanjuan Liu 1,2,3, Xingxing Yang 1,3, Binhua Li 1, Junjun Wang 1,2, Wenchao Wang 1, Jing Liu 1, Qingsong
Supplementary material. Supplementary Figure legends
 Supplementary material Supplementary Figure legends Supplementary Figure 1: Senescence-associated proliferation stop in response to oncogenic N-RAS expression Proliferation of NHEM cells without (ctrl.)
Longitudinal tracking of single live cancer cells to understand cell cycle effects of the
 Longitudinal tracking of single live cancer cells to understand cell cycle effects of the nuclear export inhibitor, selinexor Joshua M. Marcus 1, Russell T. Burke 1, John A. DeSisto 1, Yosef Landesman
SUPPLEMENTARY INFORMATION
 Figure S1 Induction of non-apoptotic death of SV40-transformed and primary DKO MEFs, and DKO thymocytes. (A-F) STS-induced non-apoptotic death of DKO MEF. (A, B) Reduced viability of DKO MEFs after exposure
ERK1/2/MAPK pathway-dependent regulation of the telomeric factor TRF2
 ERK1/2/MAPK pathway-dependent regulation of the telomeric factor TRF2 SUPPLEMENTARY FIGURES AND TABLE Supplementary Figure S1: Conservation of the D domain throughout evolution. Alignment of TRF2 sequences
A. List of selected proteins with high SILAC (H/L) ratios identified in mass
 ratios identified in mass") Supplementary material Figure S1. Interaction between UBL5 and FANCI A. List of selected proteins with high SILAC (H/L) ratios identified in mass spectrometry (MS)-based analysis of UBL5-interacting proteins,
Supplementary material Figure S1. Interaction between UBL5 and FANCI A. List of selected proteins with high SILAC (H/L) ratios identified in mass spectrometry (MS)-based analysis of UBL5-interacting proteins,
Supplementary Figure 1 Induction of cellular senescence and isolation of exosome. a to c, Pre-senescent primary normal human diploid fibroblasts
 Supplementary Figure 1 Induction of cellular senescence and isolation of exosome. a to c, Pre-senescent primary normal human diploid fibroblasts (TIG-3 cells) were rendered senescent by either serial passage
supplementary information
 DOI: 10.1038/ncb2133 Figure S1 Actomyosin organisation in human squamous cell carcinoma. (a) Three examples of actomyosin organisation around the edges of squamous cell carcinoma biopsies are shown. Myosin
SUPPLEMENTARY FIGURES AND TABLE
 SUPPLEMENTARY FIGURES AND TABLE Supplementary Figure S1: Characterization of IRE1α mutants. A. U87-LUC cells were transduced with the lentiviral vector containing the GFP sequence (U87-LUC Tet-ON GFP).
T H E J O U R N A L O F C E L L B I O L O G Y
 T H E J O U R N A L O F C E L L B I O L O G Y Supplemental material Dunsch et al., http://www.jcb.org/cgi/content/full/jcb.201202112/dc1 Figure S1. Characterization of HMMR and CHICA antibodies. (A) HeLa
SUPPLEMENTARY INFORMATION
 DOI: 10.1038/ncb3076 Supplementary Figure 1 btrcp targets Cep68 for degradation during mitosis. a) Cep68 immunofluorescence in interphase and metaphase. U-2OS cells were transfected with control sirna
Supplementary Figure 1. Mother centrioles can reduplicate while in the close association
 C1-GFP distance (nm) C1-GFP distance (nm) a arrested HeLa cell expressing C1-GFP and Plk1TD-RFP -3 s 1 2 3 4 5 6 7 8 9 11 12 13 14 16 17 18 19 2 21 22 23 24 26 27 28 29 3 b 9 8 7 6 5 4 3 2 arrested HeLa
Supplementary Information POLO-LIKE KINASE 1 FACILITATES LOSS OF PTEN-INDUCED PROSTATE CANCER FORMATION
 Supplementary Information POLO-LIKE KINASE 1 FACILITATES LOSS OF PTEN-INDUCED PROSTATE CANCER FORMATION X. Shawn Liu 1, 3, Bing Song 2, 3, Bennett D. Elzey 3, 4, Timothy L. Ratliff 3, 4, Stephen F. Konieczny
Rapid parallel measurements of macroautophagy and mitophagy in
 Supplemental Figures Rapid parallel measurements of macroautophagy and mitophagy in mammalian cells using a single fluorescent biosensor Sargsyan A, Cai J, Fandino LB, Labasky ME, Forostyan T, Colosimo
Figure S1. PMVs from THP-1 cells expose phosphatidylserine and carry actin. A) Flow
 Flow") SUPPLEMENTARY DATA Supplementary Figure Legends Figure S1. PMVs from THP-1 cells expose phosphatidylserine and carry actin. A) Flow cytometry analysis of PMVs labelled with annexin-v-pe (Guava technologies)
SUPPLEMENTARY DATA Supplementary Figure Legends Figure S1. PMVs from THP-1 cells expose phosphatidylserine and carry actin. A) Flow cytometry analysis of PMVs labelled with annexin-v-pe (Guava technologies)
Supplementary information. The Light Intermediate Chain 2 Subpopulation of Dynein Regulates Mitotic. Spindle Orientation
 Supplementary information The Light Intermediate Chain 2 Subpopulation of Dynein Regulates Mitotic Spindle Orientation Running title: Dynein LICs distribute mitotic functions. Sagar Mahale a, d, *, Megha
SUPPLEMENTAL FIGURE LEGENDS
 SUPPLEMENTAL FIGURE LEGENDS Supplemental Figure S1: Endogenous interaction between RNF2 and H2AX: Whole cell extracts from 293T were subjected to immunoprecipitation with anti-rnf2 or anti-γ-h2ax antibodies
Supplementary Figure 1: si-craf but not si-braf sensitizes tumor cells to radiation.
 Supplementary Figure 1: si-craf but not si-braf sensitizes tumor cells to radiation. (a) Embryonic fibroblasts isolated from wildtype (WT), BRAF -/-, or CRAF -/- mice were irradiated (6 Gy) and DNA damage
SUPPLEMENTARY INFORMATION
 SUPPLEMENTARY INFORMATION doi:1.138/nature9814 a A SHARPIN FL B SHARPIN ΔNZF C SHARPIN T38L, F39V b His-SHARPIN FL -1xUb -2xUb -4xUb α-his c Linear 4xUb -SHARPIN FL -SHARPIN TF_LV -SHARPINΔNZF -SHARPIN
 Supplementary Figure Legends Supplementary Figure S1. Aurora-A is essential for SAC establishment in early mitosis. (a-c) RPE cells were treated with DMSO (a), MLN8237 (b) or BI2536 (c) for Two hours.
T H E J O U R N A L O F C E L L B I O L O G Y
 T H E J O U R N A L O F C E L L B I O L O G Y Supplemental material Krenn et al., http://www.jcb.org/cgi/content/full/jcb.201110013/dc1 Figure S1. Levels of expressed proteins and demonstration that C-terminal
Studying apoptosis in DT40 cells
 Studying apoptosis in DT40 cells Sandrine Ruchaud E12.5! Acridine Orange! Role of apoptosis in sculpting the mouse paw E13.5! E14.5! gift of William Wood & Paul Martin! University College, London! Normal
Supporting Information
 Supporting Information ou et al..73/pnas.08791112 dd Thymidine Release & transfection dd Thymidine Release dd MG132 Fix and IF -14 h 0 h 8 h 24 h 34 h 36 h siontrol simps1-1 simps1-1 simps1-1 simps1-2
Page 39 of 44. 8h LTA & AT h PepG & AT h LTA
 Page 39 of 44 Fig. S1 A: B: C: D: 8h LTA 8h LTA & AT7519 E: F: 8h PepG G: 8h PepG & AT7519 Fig. S1. AT7519 overrides the survival effects of lipoteichoic acid (LTA) and peptidoglycan (PepG). (A) Human
(A) RT-PCR for components of the Shh/Gli pathway in normal fetus cell (MRC-5) and a
 RT-PCR for components of the Shh/Gli pathway in normal fetus cell (MRC-5) and a") Supplementary figure legends Supplementary Figure 1. Expression of Shh signaling components in a panel of gastric cancer. (A) RT-PCR for components of the Shh/Gli pathway in normal fetus cell (MRC-5) and
Supplementary figure legends Supplementary Figure 1. Expression of Shh signaling components in a panel of gastric cancer. (A) RT-PCR for components of the Shh/Gli pathway in normal fetus cell (MRC-5) and
SLX4 + MUS81 SLX4 + GEN1 SLX4 CONTROL SLX4
 GEN MUS8 GEN MUS8 GEN MUS8 GEN MUS8 GEN C LM MUS8 XPF (loading control) D H2AX Frequency of -positive bridges (% of anaphase cells) 6 4 2 p =.8 x -4 GM855 p =.27 PSNF5 E H2AX Figure S. Analysis of anaphase
T H E J O U R N A L O F C E L L B I O L O G Y
 Supplemental material Edens and Levy, http://www.jcb.org/cgi/content/full/jcb.201406004/dc1 T H E J O U R N A L O F C E L L B I O L O G Y Figure S1. Nuclear shrinking does not depend on the cytoskeleton
Supplementary Figure 1
 S U P P L E M E N TA R Y I N F O R M AT I O N DOI: 10.1038/ncb2896 Supplementary Figure 1 Supplementary Figure 1. Sequence alignment of TERB1 homologs in vertebrates. M. musculus TERB1 was derived from
Supplementary Figure 1. PD-L1 is glycosylated in cancer cells. (a) Western blot analysis of PD-L1 in breast cancer cells. (b) Western blot analysis
 Western blot analysis of PD-L1 in breast cancer cells. (b) Western blot analysis") Supplementary Figure 1. PD-L1 is glycosylated in cancer cells. (a) Western blot analysis of PD-L1 in breast cancer cells. (b) Western blot analysis of PD-L1 in ovarian cancer cells. (c) Western blot analysis
Supplementary Figure 1. PD-L1 is glycosylated in cancer cells. (a) Western blot analysis of PD-L1 in breast cancer cells. (b) Western blot analysis of PD-L1 in ovarian cancer cells. (c) Western blot analysis
Figure S1. HP1α localizes to centromeres in mitosis and interacts with INCENP. (A&B) HeLa
 HeLa") SUPPLEMENTARY FIGURES Figure S1. HP1α localizes to centromeres in mitosis and interacts with INCENP. (A&B) HeLa tet-on cells that stably express HP1α-CFP, HP1β-CFP, or HP1γ-CFP were monitored with livecell
SUPPLEMENTARY FIGURES Figure S1. HP1α localizes to centromeres in mitosis and interacts with INCENP. (A&B) HeLa tet-on cells that stably express HP1α-CFP, HP1β-CFP, or HP1γ-CFP were monitored with livecell
SUPPLEMENTARY FIGURES AND TABLES
 SUPPLEMENTARY FIGURES AND TABLES Supplementary Figure S1: CaSR expression in neuroblastoma models. A. Proteins were isolated from three neuroblastoma cell lines and from the liver metastasis of a MYCN-non
Supplementary Table 1. Characterization of HNSCC PDX models established at MSKCC
 Supplementary Table 1. Characterization of HNSCC PDX models established at MSKCC Supplementary Table 2. Drug content and loading efficiency estimated with F-NMR and UV- Vis Supplementary Table 3. Complete
(A) Dose response curves of HMLE_shGFP (blue circle), HMLE_shEcad (red square),
 Dose response curves of HMLE_shGFP (blue circle), HMLE_shEcad (red square),") Supplementary Figures and Tables Figure S1. Validation of EMT-selective small molecules (A) Dose response curves of HMLE_shGFP (blue circle), HMLE_shEcad (red square), and HMLE_Twist (black diamond) cells
Supplementary Figures and Tables Figure S1. Validation of EMT-selective small molecules (A) Dose response curves of HMLE_shGFP (blue circle), HMLE_shEcad (red square), and HMLE_Twist (black diamond) cells
Type of file: PDF Title of file for HTML: Supplementary Information Description: Supplementary Figures
 Type of file: PDF Title of file for HTML: Supplementary Information Description: Supplementary Figures Type of file: MOV Title of file for HTML: Supplementary Movie 1 Description: NLRP3 is moving along
NLRX1: 5 -GCTCCATGGCTTAGAGCATC-3 (forward) 5 -AACTCCTCCTCCGTCCTGAT-3 (reverse) β-actin
 5 -AACTCCTCCTCCGTCCTGAT-3 (reverse) β-actin") NLRX1 β-actin 1 2 3 4 5 6 1 2 3 4 5 6 NLRX1 (667 bp) β-actin (523 bp) Supplementary Figure 1: Expression of NLRX1 in human cell lines. 1: HeLa, 2: HEK293T, 3: MCF-7, 4:Ramos, 5:Jurkat, 6: THP1. The following
NLRX1 β-actin 1 2 3 4 5 6 1 2 3 4 5 6 NLRX1 (667 bp) β-actin (523 bp) Supplementary Figure 1: Expression of NLRX1 in human cell lines. 1: HeLa, 2: HEK293T, 3: MCF-7, 4:Ramos, 5:Jurkat, 6: THP1. The following
s u p p l e m e n ta ry i n f o r m at i o n
 Figure S1 Characterization of tet-off inducible cell lines expressing GFPprogerin and GFP-wt lamin A. a, Western blot analysis of GFP-progerin- or GFP-wt lamin A- expressing cells before induction (0d)
Tumor suppressor Spred2 interaction with LC3 promotes autophagosome maturation and induces autophagy-dependent cell death
 www.impactjournals.com/oncotarget/ Oncotarget, Supplementary Materials 2016 Tumor suppressor Spred2 interaction with LC3 promotes autophagosome maturation and induces autophagy-dependent cell death Supplementary
SUPPLEMENTARY LEGENDS...
 TABLE OF CONTENTS SUPPLEMENTARY LEGENDS... 2 11 MOVIE S1... 2 FIGURE S1 LEGEND... 3 FIGURE S2 LEGEND... 4 FIGURE S3 LEGEND... 5 FIGURE S4 LEGEND... 6 FIGURE S5 LEGEND... 7 FIGURE S6 LEGEND... 8 FIGURE
T H E J O U R N A L O F C E L L B I O L O G Y
 T H E J O U R N A L O F C E L L B I O L O G Y Supplemental material Lu et al., http://www.jcb.org/cgi/content/full/jcb.201012063/dc1 Figure S1. Kinetics of nuclear envelope assembly, recruitment of Nup133
Supplementary Figure S I: Effects of D4F on body weight and serum lipids in apoe -/- mice.
 Supplementary Figures: Supplementary Figure S I: Effects of D4F on body weight and serum lipids in apoe -/- mice. Male apoe -/- mice were fed a high-fat diet for 8 weeks, and given PBS (model group) or
mtor Inhibition Specifically Sensitizes Colorectal Cancers with KRAS or BRAF Mutations to BCL-2/BCL-
 Supplementary Material for mtor Inhibition Specifically Sensitizes Colorectal Cancers with KRAS or BRAF Mutations to BCL-2/BCL- XL Inhibition by Suppressing MCL-1 Anthony C. Faber 1,2 *, Erin M. Coffee
Programmed necrosis, not apoptosis, is a key mediator of cell loss and DAMP-mediated inflammation in dsrna-induced retinal degeneration
 Programmed necrosis, not apoptosis, is a key mediator of cell loss and DAMP-mediated inflammation in dsrna-induced retinal degeneration The Harvard community has made this article openly available. Please
File Name: Supplementary Information Description: Supplementary Figures and Supplementary Tables. File Name: Peer Review File Description:
 File Name: Supplementary Information Description: Supplementary Figures and Supplementary Tables File Name: Peer Review File Description: Primer Name Sequence (5'-3') AT ( C) RT-PCR USP21 F 5'-TTCCCATGGCTCCTTCCACATGAT-3'
A. Generation and characterization of Ras-expressing autophagycompetent
 Supplemental Material Supplemental Figure Legends Fig. S1 A. Generation and characterization of Ras-expressing autophagycompetent and -deficient cell lines. HA-tagged H-ras V12 was stably expressed in
Supplementary Figure 1. SA-β-Gal positive senescent cells in various cancer tissues. Representative frozen sections of breast, thyroid, colon and
 Supplementary Figure 1. SA-β-Gal positive senescent cells in various cancer tissues. Representative frozen sections of breast, thyroid, colon and stomach cancer were stained with SA-β-Gal and nuclear fast
Interleukin-6 promotes pancreatic cancer cell migration by rapidly activating the small GTPase CDC42
 Interleukin-6 promotes pancreatic cancer cell migration by rapidly activating the small GTPase CDC42 Gina L. Razidlo, Kevin M. Burton, and Mark A. McNiven SUPPORTING INFORMATION Figure S1. IL-6 promotes
F-actin VWF Vinculin. F-actin. Vinculin VWF
 a F-actin VWF Vinculin b F-actin VWF Vinculin Supplementary Fig. 1. WPBs in HUVECs are located along stress fibers and at focal adhesions. (a) Immunofluorescence images of f-actin (cyan), VWF (yellow),
Supplementary Figure 1. mir124 does not change neuron morphology and synaptic
 Supplementary Figure 1. mir124 does not change neuron morphology and synaptic density. Hippocampal neurons were transfected with mir124 (containing DsRed) or DsRed as a control. 2 d after transfection,
Soft Agar Assay. For each cell pool, 100,000 cells were resuspended in 0.35% (w/v)
") SUPPLEMENTARY MATERIAL AND METHODS Soft Agar Assay. For each cell pool, 100,000 cells were resuspended in 0.35% (w/v) top agar (LONZA, SeaKem LE Agarose cat.5004) and plated onto 0.5% (w/v) basal agar.
SUPPLEMENTARY MATERIAL AND METHODS Soft Agar Assay. For each cell pool, 100,000 cells were resuspended in 0.35% (w/v) top agar (LONZA, SeaKem LE Agarose cat.5004) and plated onto 0.5% (w/v) basal agar.
X P. Supplementary Figure 1. Nature Medicine: doi: /nm Nilotinib LSK LT-HSC. Cytoplasm. Cytoplasm. Nucleus. Nucleus
 a b c Supplementary Figure 1 c-kit-apc-eflu780 Lin-FITC Flt3-Linc-Kit-APC-eflu780 LSK Sca-1-PE-Cy7 d e f CD48-APC LT-HSC CD150-PerCP-cy5.5 g h i j Cytoplasm RCC1 X Exp 5 mir 126 SPRED1 SPRED1 RAN P SPRED1
Supplementary Figure 1
 Supplementary Figure 1 AAV-GFP injection in the MEC of the mouse brain C57Bl/6 mice at 4 months of age were injected with AAV-GFP into the MEC and sacrificed at 7 days post injection (dpi). (a) Brains
Supplementary Materials for
 www.sciencesignaling.org/cgi/content/full/8/398/rs12/dc1 Supplementary Materials for Quantitative phosphoproteomics reveals new roles for the protein phosphatase PP6 in mitotic cells Scott F. Rusin, Kate
Nature Structural and Molecular Biology: doi: /nsmb Supplementary Figure 1
 Supplementary Figure 1 Mutational analysis of the SA2-Scc1 interaction in vitro and in human cells. (a) Autoradiograph (top) and Coomassie stained gel (bottom) of 35 S-labeled Myc-SA2 proteins (input)
Ginkgo biloba leaf extract induces DNA damage by inhibiting topoisomerase II activity in human hepatic cells
 Ginkgo biloba leaf extract induces DNA damage by inhibiting topoisomerase II activity in human hepatic cells Zhuhong Zhang 1, Si Chen 2, Hu Mei 3, Jiekun Xuan 2, Xiaoqing Guo 1, Letha Couch 2, Vasily N.
genome edited transient transfection, CMV promoter
 Supplementary Figure 1. In the absence of new protein translation, overexpressed caveolin-1-gfp is degraded faster than caveolin-1-gfp expressed from the endogenous caveolin 1 locus % loss of total caveolin-1-gfp
Downregulation of the small GTPase SAR1A: a key event underlying alcohol-induced Golgi fragmentation in hepatocytes
 Downregulation of the small GTPase SAR1A: a key event underlying alcohol-induced Golgi fragmentation in hepatocytes Armen Petrosyan 1*, Pi-Wan Cheng 1,3, Dahn L. Clemens 2,3 & Carol A. Casey 2,3 1 Department
Supplementary Materials for
 www.sciencetranslationalmedicine.org/cgi/content/full/8/339/339ra69/dc1 Supplementary Materials for The caspase-8 inhibitor emricasan combines with the SMAC mimetic birinapant to induce necroptosis and
Supplementary Figure 1 Expression of Crb3 in mouse sciatic nerve: biochemical analysis (a) Schematic of Crb3 isoforms, ERLI and CLPI, indicating the
 Schematic of Crb3 isoforms, ERLI and CLPI, indicating the") Supplementary Figure 1 Expression of Crb3 in mouse sciatic nerve: biochemical analysis (a) Schematic of Crb3 isoforms, ERLI and CLPI, indicating the location of the transmembrane (TM), FRM binding (FB)
Supplementary Figure 1 Expression of Crb3 in mouse sciatic nerve: biochemical analysis (a) Schematic of Crb3 isoforms, ERLI and CLPI, indicating the location of the transmembrane (TM), FRM binding (FB)
Supplementary Fig. S1. Schematic diagram of minigenome segments.
 open reading frame 1565 (segment 5) 47 (-) 3 5 (+) 76 101 125 149 173 197 221 246 287 open reading frame 890 (segment 8) 60 (-) 3 5 (+) 172 Supplementary Fig. S1. Schematic diagram of minigenome segments.
Supplementary Fig. 1 No relative growth advantage of Foxp3 negative cells.
 Supplementary Fig. 1 Supplementary Figure S1: No relative growth advantage of Foxp3 negative cells. itreg were induced from WT (A) or FIR (B) CD4 + T cells. FIR itregs were then removed from the TCR signal
Fang et al. NMuMG. PyVmT unstained Anti-CCR2-PE MDA-MB MCF MCF10A
 A NMuMG PyVmT 16.5+.5 47.+7.2 Fang et al. unstained Anti-CCR2-PE 4T1 Control 37.6+6.3 56.1+.65 MCF1A 16.1+3. MCF-7 3.1+5.4 MDA-M-231 42.1+5.5 unstained Secondary antibody only Anti-CCR2 SUPPLEMENTAL FIGURE
SD-1 SD-1: Cathepsin B levels in TNF treated hch
 SD-1 SD-1: Cathepsin B levels in TNF treated hch. A. RNA and B. protein extracts from TNF treated and untreated human chondrocytes (hch) were analyzed via qpcr (left) and immunoblot analyses (right) for
Supplementary fig. 1. Crystals induce necroptosis does not involve caspases, TNF receptor or NLRP3. A. Mouse tubular epithelial cells were pretreated
 Supplementary fig. 1. Crystals induce necroptosis does not involve caspases, TNF receptor or NLRP3. A. Mouse tubular epithelial cells were pretreated with zvad-fmk (10µM) and exposed to calcium oxalate
Cells and reagents. Synaptopodin knockdown (1) and dynamin knockdown (2)
 and dynamin knockdown (2)") Supplemental Methods Cells and reagents. Synaptopodin knockdown (1) and dynamin knockdown (2) podocytes were cultured as described previously. Staurosporine, angiotensin II and actinomycin D were all obtained
Supplemental Methods Cells and reagents. Synaptopodin knockdown (1) and dynamin knockdown (2) podocytes were cultured as described previously. Staurosporine, angiotensin II and actinomycin D were all obtained
Li et al. Journal of Experimental & Clinical Cancer Research (2018) 37:108
 37:108") Li et al. Journal of Experimental & Clinical Cancer Research (2018) 37:108 https://doi.org/10.1186/s13046-018-0774-7 CORRECTION Correction to: Novel smac mimetic APG- 1387 elicits ovarian cancer cell killing
Li et al. Journal of Experimental & Clinical Cancer Research (2018) 37:108 https://doi.org/10.1186/s13046-018-0774-7 CORRECTION Correction to: Novel smac mimetic APG- 1387 elicits ovarian cancer cell killing
Supplementary Figure 1 IMQ-Induced Mouse Model of Psoriasis. IMQ cream was
 Supplementary Figure 1 IMQ-Induced Mouse Model of Psoriasis. IMQ cream was painted on the shaved back skin of CBL/J and BALB/c mice for consecutive days. (a, b) Phenotypic presentation of mouse back skin
SUPPLEMENTARY FIGURE LEGENDS. atypical adenomatous hyperplasias (AAH); Grade II: adenomas; Grade III: adenocarcinomas;
; Grade II: adenomas; Grade III: adenocarcinomas;") SUPPLEMENTARY FIGURE LEGENDS Supplementary Figure S1: Tumor grades in Ras G12D ; p53 / lung tumors. Representative histology (H&E) of K-Ras G12D ; p53 / lung tumors 13 weeks after tumor initiation. Grade
SUPPLEMENTARY FIGURE LEGENDS Supplementary Figure S1: Tumor grades in Ras G12D ; p53 / lung tumors. Representative histology (H&E) of K-Ras G12D ; p53 / lung tumors 13 weeks after tumor initiation. Grade
SUPPLEMENTARY INFORMATION
 SUPPLEMENTARY INFORMATION doi:10.1038/nature11429 S1a 6 7 8 9 Nlrc4 allele S1b Nlrc4 +/+ Nlrc4 +/F Nlrc4 F/F 9 Targeting construct 422 bp 273 bp FRT-neo-gb-PGK-FRT 3x.STOP S1c Nlrc4 +/+ Nlrc4 F/F casp1
Supplementary Materials
 Supplementary Materials Figure S1. MTT Cell viability assay. To measure the cytotoxic potential of the oxidative treatment, the MTT [3-(4,5-dimethylthiazol- 2-yl)-2,5-diphenyl tetrazolium bromide] assay
Supplementary table 1
 Supplementary table 1 S. pombe strain list Fig. 1A JX38 h + ade6-m216 nda3-km311 PX476 PW775 PX545 PX546 h- ade6-m216 sgo2::ura4 + nda3-km311 h 9 mad2::ura4 + nda3-km311 h + ade6-m21 nda3-km311 rad21 +
Supplementary Information. Cofilin Regulates Nuclear Architecture through a Myosin-II Dependent Mechanotransduction Module
 Supplementary Information Cofilin Regulates Nuclear Architecture through a Myosin-II Dependent Mechanotransduction Module O Neil Wiggan, Bryce Schroder, Diego Krapf, James R. Bamurg and Jennifer G. DeLuca
HCC1937 is the HCC1937-pcDNA3 cell line, which was derived from a breast cancer with a mutation
 SUPPLEMENTARY INFORMATION Materials and Methods Human cell lines and culture conditions HCC1937 is the HCC1937-pcDNA3 cell line, which was derived from a breast cancer with a mutation in exon 20 of BRCA1
Supplemental Figure 1. (A) Western blot for the expression of RIPK1 in HK-2 cells treated with or without LPS (1 µg/ml) for indicated times.
 Western blot for the expression of RIPK1 in HK-2 cells treated with or without LPS (1 µg/ml) for indicated times.") Supplemental Figure 1. (A) Western blot for the expression of RIPK1 in HK-2 cells treated with or without LPS (1 µg/ml) for indicated times. Western blots shown are representative results from 3 independent
Supplemental Figure 1. (A) Western blot for the expression of RIPK1 in HK-2 cells treated with or without LPS (1 µg/ml) for indicated times. Western blots shown are representative results from 3 independent
(a) Schematic diagram of the FS mutation of UVRAG in exon 8 containing the highly instable
 Schematic diagram of the FS mutation of UVRAG in exon 8 containing the highly instable") Supplementary Figure 1. Frameshift (FS) mutation in UVRAG. (a) Schematic diagram of the FS mutation of UVRAG in exon 8 containing the highly instable A 10 DNA repeat, generating a premature stop codon
Supplementary Figure 1. Frameshift (FS) mutation in UVRAG. (a) Schematic diagram of the FS mutation of UVRAG in exon 8 containing the highly instable A 10 DNA repeat, generating a premature stop codon
Supplementary Table 1. List of primers used in this study
 Supplementary Table 1. List of primers used in this study Gene Forward primer Reverse primer Rat Met 5 -aggtcgcttcatgcaggt-3 5 -tccggagacacaggatgg-3 Rat Runx1 5 -cctccttgaaccactccact-3 5 -ctggatctgcctggcatc-3
Supplementary Information
 Supplementary Information Supplementary Figure 1. EBV-gB 23-431 mainly exists as trimer in HEK 293FT cells. (a) Western blotting analysis for DSS crosslinked FLAG-gB 23-431. HEK 293FT cells transfected
Pro-apoptotic signalling through Toll-like receptor 3 involves TRIF-dependent
 Pro-apoptotic signalling through Toll-like receptor 3 involves TRIF-dependent activation of caspase-8 and is under the control of inhibitor of apoptosis proteins in melanoma cells Arnim Weber, Zofia Kirejczyk,
Supplemental information
 Carcinoemryonic antigen-related cell adhesion molecule 6 (CEACAM6) promotes EGF receptor signaling of oral squamous cell carcinoma metastasis via the complex N-glycosylation y Chiang et al. Supplemental
Supporting Information
 Copyright WILEY-VCH Verlag GmbH & Co. KGaA, 69469 Weinheim, Germany, 212. Supporting Information for Adv. Funct. Mater., DOI:.2/adfm.2122233 MnO Nanocrystals: A Platform for Integration of MRI and Genuine
Control GST GST-RAP. α2-mg. 170 kda. b-actin. 42 kda LRP-1
 % of max Supplementary Figure 1 Control GST GST-RP 17 kda α2-mg 42 kda b-actin Gate: CD11c+ (DCs) Gate: F4/8+ (Mfs) IgG Cd11cCre + Lrp1 fl/fl LRP-1 Supplementary figure 1. () MDCs were pretreated with
Supplementary Information
 Supplementary Information Supplementary Figure 1: cholesterol manipulation alters the positioning of autophagosomes in cells, related to figure 1. (a) HeLa cells were treated for 24h under conditions reducing
Supplementary Figures
 Supplementary Figures Supplementary Figure 1 Characterization of stable expression of GlucB and sshbira in the CT26 cell line (a) Live cell imaging of stable CT26 cells expressing green fluorescent protein
Supplemental Figure 1. Western blot analysis indicated that MIF was detected in the fractions of
 Supplemental Figure Legends Supplemental Figure 1. Western blot analysis indicated that was detected in the fractions of plasma membrane and cytosol but not in nuclear fraction isolated from Pkd1 null
SUPPLEMENTARY INFORMATION
 DOI: 1.138/ncb222 / b. WB anti- WB anti- ulin Mitotic index (%) 14 1 6 2 T (h) 32 48-1 1 2 3 4 6-1 4 16 22 28 3 33 e. 6 4 2 Time (min) 1-6- 11-1 > 1 % cells Figure S1 depletion leads to mitotic defects
Electron micrograph of phosphotungstanic acid-stained exosomes derived from murine
 1 SUPPLEMENTARY INFORMATION SUPPLEMENTARY FIGURES Supplementary Figure 1. Physical properties of murine DC-derived exosomes. a, Electron micrograph of phosphotungstanic acid-stained exosomes derived from
WDR62 is associated with the spindle pole and mutated in human microcephaly
 WDR62 is associated with the spindle pole and mutated in human microcephaly Adeline K. Nicholas, Maryam Khurshid, Julie Désir, Ofélia P. Carvalho, James J. Cox, Gemma Thornton, Rizwana Kausar, Muhammad
SUPPLEMENTARY INFORMATION
 SUPPLEENTRY INFORTION DOI: 1.138/ncb2577 Early Telophase Late Telophase B icrotubules within the ICB (percent of total cells in telophase) D G ultinucleate cells (% total) 8 6 4 2 2 15 1 5 T without gaps
Supplementary Figure 1.TRIM33 binds β-catenin in the nucleus. a & b, Co-IP of endogenous TRIM33 with β-catenin in HT-29 cells (a) and HEK 293T cells
 and HEK 293T cells") Supplementary Figure 1.TRIM33 binds β-catenin in the nucleus. a & b, Co-IP of endogenous TRIM33 with β-catenin in HT-29 cells (a) and HEK 293T cells (b). TRIM33 was immunoprecipitated, and the amount of
Supplementary Figure 1.TRIM33 binds β-catenin in the nucleus. a & b, Co-IP of endogenous TRIM33 with β-catenin in HT-29 cells (a) and HEK 293T cells (b). TRIM33 was immunoprecipitated, and the amount of
Loss of RhoA promotes skin tumor formation. Supplementary Figure 1. Loss of RhoA does not impair F-actin organization.
 Supplementary Figure Legends Supplementary Figure 1. Loss of RhoA does not impair F-actin organization. a. Representative IF images of F-actin staining of big and small control (left) and RhoA ko tumors
SUPPLEMENTARY INFORMATION
 Supplementary Table 1. Cell sphingolipids and S1P bound to endogenous TRAF2. Sphingolipid Cell pmol/mg TRAF2 immunoprecipitate pmol/mg Sphingomyelin 4200 ± 250 Not detected Monohexosylceramide 311 ± 18
Supplementary Materials and Methods
 Supplementary Materials and Methods Immunoblotting Immunoblot analysis was performed as described previously (1). Due to high-molecular weight of MUC4 (~ 950 kda) and MUC1 (~ 250 kda) proteins, electrophoresis
SHREE ET AL, SUPPLEMENTAL MATERIALS. (A) Workflow for tumor cell line derivation and orthotopic implantation.
 Workflow for tumor cell line derivation and orthotopic implantation.") SHREE ET AL, SUPPLEMENTAL MATERIALS SUPPLEMENTAL FIGURE AND TABLE LEGENDS Supplemental Figure 1. Derivation and characterization of TS1-TGL and TS2-TGL PyMT cell lines and development of an orthotopic
SHREE ET AL, SUPPLEMENTAL MATERIALS SUPPLEMENTAL FIGURE AND TABLE LEGENDS Supplemental Figure 1. Derivation and characterization of TS1-TGL and TS2-TGL PyMT cell lines and development of an orthotopic
SUPPLEMENTARY INFORMATION
 DOI:.38/ncb2822 a MTC02 FAO cells EEA1 b +/+ MEFs /DAPI -/- MEFs /DAPI -/- MEFs //DAPI c HEK 293 cells WCE N M C P AKT TBC1D7 Lamin A/C EEA1 VDAC d HeLa cells WCE N M C P AKT Lamin A/C EEA1 VDAC Figure
Supplementary Figure 1: Digitoxin induces apoptosis in primary human melanoma cells but not in normal melanocytes, which express lower levels of the
 Supplementary Figure 1: Digitoxin induces apoptosis in primary human melanoma cells but not in normal melanocytes, which express lower levels of the cardiac glycoside target, ATP1A1. (a) The percentage