Predictive PP1Ca binding region in BIG3 : 1,228 1,232aa (-KAVSF-) HEK293T cells *** *** *** KPL-3C cells - E E2 treatment time (h)
|
|
|
- Spencer Johnston
- 5 years ago
- Views:
Transcription
1 Relative expression ERE-luciferase activity activity (pmole/min) activity (pmole/min) activity (pmole/min) activity (pmole/min) MCF-7 KPL-3C ZR--1 BT-474 T47D HCC15 KPL-1 HBC4 activity (pmole/min) a d b-actin ** ** siegfp si - si 5 b Predictive binding region in : 1,228 1,232aa (-KAVSF-) HA-ERa + + FLAG- WT D - - FLAG FLAG- IgG HEK293T cells KPL-3C cells FLAG- FLAG- - siegfp si si c HEK293T cells ** DNA (mg) FLAG- mock D - FLAG () FLAG () e treatment time (h) KPL-3C cells ** ** ** treatment time (h) : 24 h - f Western blotting ChIP assay MCF-7 KPL-3C tamoxifen ERAP b-actin 5-726/-74 - Input ERa IgG 5 -ERE gttcaaggccacctggccaacat tamoxifen ERAP MCF KPL-3C empty 5 -ERE PPP1CA -
2 activity (pmole/min) Binding Binding PKA activity (RLU) MCF-7 KPL-3C ZR--1 BT-474 T47D HCC15 KPL-1 HBC4 g h Position Sequence QLLYLECILSVLSSSSSSMHL VARTIYYIAAELVRLVGSVDS ELSQGKGLSEGQVQLLLLRLE GNERSLDISISVTTDTGQTTL SGSSAAKVVLTLSTQADRLFE VSQKAVSFIHDILTEVLTDWN GLIEVWIILLEQLTAAVSNCP PSSM Score b-actin 5 i ** 1 mm H nm IPs NS H IPs j 3,, 2,5, 2,, 1,5, 1,, 5, 1 mm H nm IPs ** IPs k Target site Score T S35.79 S S9.83 S S (Analysis by NetPhos 3.1) l m FLAG- FLAG--transfected HEK293T * NS * - siegfp sipka 1 nm (min) ps35-.7 ps n S35-Peptide (DHGRGSGCSCTAPALSGPVAR) + recombinant PKA for 3 min at 3 C Score Sequence GSGCSCTAPALSGPVAR GSGCSCTAPALSGPVAR Modification - 2S: Phospho 4C: Carboxymethyl 6C: Propionamide S128-Peptide (RCWSLVAPH) + recombinant PKA for 3 min at 3 C Score Sequence CWSLVAPH CWSLVAPH Modification - 1C: Propionamide 3S: Phospho Supplementary Figure 1 regulated activity through its phosphorylation by PKA. (a) Expression patterns of and in breast cancer cell lines. b-actin served as a quantitative internal control. (b) Identification of the predictive binding region in. The indicated FLAG-tagged constructs (WT; full-length, D; deleting -binding region, 1,228-KAVSF-1,232) and HA-tagged ERa construct transfected-hek293t cells were immunoprecipitated using an anti-flag antibody. (c) The inhibitory effects of overexpression on phosphatase activity of -immunoprecipitates in FLAG-tagged or D construct-transfected HEK293T cells using pnpp as a substrate. These data represent the means ± s.e.m. of three independent experiments. (d) Effects of si and si on phosphatase activity of immunoprecipitates using pnpp as a substrate in MCF-7 and KPL3C cells. These data represent the means ± s.e.m. of three independent experiments. (e) Phosphatase activity of after stimulation in MCF-7 (left) and KPL-3C (right) cells. These data represent the means ± s.e.m. of three independent experiments. (f) Positive
3 feedback regulation of PPP1CA transactivation. Left, Effects of tamoxifen on PPP1CA expression. For immunoblot analysis (upper), b-actin served as a loading control. For real-time PCR analysis (lower), the data are expressed as the fold-increase over untreated cells (set at 1.). These data represent the mean ± s.e.m. of three independent experiments. Right, ChIP assays of the transactivation of PPP1CA through an ERE motif in 5 upstream (upper), and luciferase assays of the transactivation of PPP1CA using a luciferase reporter containing an ERE motif conserved within 5 upstream of the PPP1CA gene (lower). The data represent the mean ± s.e.m. of three independent experiments. (g) The predicted PKA binding regions in, as determined using Hou et al. 24 and the PSIVER software. The bold letters indicate the potential PKA binding regions in. (h) Expression patterns of PKA protein in breast cancer cell lines. (i) Statistical analysis of PKA and binding to (right) and PKA (left) immunoprecipitates, respectively. These data are expressed as the fold-increase over untreated cells (set at 1.), and represent the mean ± s.e.m. of three independent experiments. (j) Statistical analysis of in vitro PKA activity of and PKA immunoprecipitates. These data represent the mean ± s.e.m. of three independent experiments. (k) The predicted phosphorylation sites of by PKA, as determined using NetPhos 3.1 software. (l) Phosphatase activity of in a pseudo-phosphorylation mutant of (S35E and S128E) and alanine mutant of (S35A and S128A). (m) The inhibitory effects of sipka on phosphorylation. Representative results are shown from one of two experiments. (n) 2DICAL analysis of engineered peptides representing S35 and S128 on with recombinant PKA (recpka). **P<.1, P<.1 (two-sided Student s t-test)


 Serine phosphorylation of in ERa immunoprecipitates of the nuclear fraction of after ±")
 Time course of serine phosphorylation of in after ± ERAP treatment for the indicated")
.")
 and nuclear (Nuc) fractions of the indicated (WT, S39A) and ERa")
4 a c 1 nm 1 mm ERAP pser- ERa Nucleus of ERa for 24 hr + ERAP l-ppase + + ERAP b 1 h 3 h 6 h 12 h 18 h 24 h ERAP pser- ps39- ps39- ps39-5 mm d HEK293T cells Myc- FLAG-ERa HA- WT S39A Cyto Nuc Cyto Nuc mm ERAP FLAG IgG 5 FLAG-ERa HA- FLAG-ERa HA- FLAG-ERa ps39- HA- tubulin lamin Supplementary Figure 2 is phosphorylated at S39 via PKCa. (a) Serine phosphorylation of in ERa immunoprecipitates of the nuclear fraction of after ± ERAP treatment for 24 h. (b) Time course of serine phosphorylation of in after ± ERAP treatment for the indicated time. (c) Representative immunofluorescence images of phosphorylation at S39; (green), phosphorylated S39 (red). (d) The subcellular localization of phosphorylation at S39 in the presence of in the cytoplasmic (Cyto) and nuclear (Nuc) fractions of the indicated (WT, S39A) and ERa construct-transfected HEK293T cells. a/b-tubulin (tublin) and laminin B (lamin) were used as loading controls for the cytoplasmic and nuclear fractions, respectively.
5 Free phosphate released from phospho- (A 62 ) Free phosphate released from phospho- (A 62 ) a siegfp sipka si -immunoprecipitates : 24 h - siegfp sipka si b ps35- ps128- HA-ERa + + FLAG- WT D - - HEK293T cells FLAG- ps39- FLAG- c / inhibitor (-) 5 (mm) 1 nm -immunoprecipitates (-) 1 nm / inhibitor 5 (mm) ps ps128- d (-) 1 nm H-89 okadaic ps35- ps128- ps39- e Phospho- Phospho- peptide + Phospho- YGVRESVFTVE Supplementary Figure 3 Phosphatase activity of - regulates phosphorylation. (a) Phosphatase activity (left) and Western blot analyses (right) of immunoprecipitates of - and PKA-depleted against phospho-s39 peptide. Phosphatase activity was measured using malachite green. These data represent the means ± s.e.m. of three independent experiments. (b) The inhibitory effect of on S39 phosphorylation. The indicated
6 FLAG-tagged (WT, D) and HA-tagged ERa-transfected HEK293T cells, followed by immunoprecipitation with an anti- antibody. (c) The inhibitory effect of - binding inhibitor on phosphatase activity. were treated with - binding inhibitor for 24 h in the presence of and were immunoprecipitated using antibody. (d) The effects of PKA inhibitor H-89 and inhibitor okadaic acid on phosphorylation (S35 and S128) and phosphorylation (S39). were treated with H-89 or okadaic acid for 24 h in the presence of and were immunoprecipitated using or antibody. (e) Q-TOF spectra indicating dephosphorylation of phospho--peptide by in positive ion mode. The dephosphorylation of peptide is exemplarily shown for m/z Upper, the left spectrum is an untreated control, and the right spectrum was acquired after dephosphorylation with. Lower, product ion spectrum of the peptide YGVRESVFTVE, with a precursor mass of m/z P<.1 (two-sided Student s t-test).
 6. 12.5 5.1 mg + + + + + 1 nm - + + 1 mm ERAP - - + ps39- ps39- PKCa ps39- PKCa YGVREpSVFTVE ps39- IPs + + + + + + recombinant (ng) 6. 12.5 5 (pmole).")
7 % Phosphorylation of Relative expression a b c MCF-7 KPL-3C ZR--1 PKCa PKCe CAMK2 1 nm 1 mm ERAP ps39- siegfp sipka peptide + PKCa Phospho- d e recombinant PKCa (ng) mg nm mm ERAP ps39- ps39- PKCa ps39- PKCa YGVREpSVFTVE ps39- IPs recombinant (ng) (pmole) P f % De-phosphorylation IB : PKA depletion PKCa depeltion P PKA S39 PKCa P PKA P S39 P PKCa Supplementary Figure 4 PKCa is confirmed to be responsible kinase for S39 phosphorylation. (a) Expression patterns of PKCa, PKCe, and CAMK2 in ERa-positive breast cancer cell lines (MCF-7, KPL-3C and ZR--1) using real-time PCR. (b) The inhibitory effects of sipka on phosphorylation at S39 in after ± ERAP treatment for 24 h. (c) Q-TOF spectra of direct peptide phosphorylation by PKCa in positive ion mode. The phosphorylation of peptide is exemplarily shown for m/z Upper, the left spectrum is an untreated control, and the right spectrum was acquired after phosphorylation with PKCa. Lower, product ion spectrum of the phosphor-s39 peptide YGVRE(pS)VFTVE, with a precursor mass of m/z (d) Statistical analysis of the ratio of phosphorylation at S39 in full-length by PKCa. These data are expressed as the percentage of phosphorylated band in total band and represent the mean ± s.e.m. of four independent experiments. (e) Dephosphorylation of phosphorylation at S39 immunoprecipitated by phospho-specific (S39) antibody from treated with /ERAP for 24 h. (f) Schematic illustration of -PKA- tricomplex under the depletion of PKA (left) and PKCa (right).
8 Cumulative survival Cumulative survival Intensity Cumulative survival a P <.1 n = 73 mrna 2 15 Low (47) 5 Normal Tumour Log Rank =.1 High (26) Disease-free survival (year) b protein Score (1) Score 1+ (24) c Cytoplasmic phospho- Presence (48) Score 2+ (32) Absence (34) Log Rank : P <.1 Score 3+ (16) Log Rank =.9 Disease-free survival (year) Disease-free survival (year) Supplementary Figure 5 overexpression was predictive of worse outcomes in ERa-positive breast cancer. (a) mrna expression of in patients with ERa-positive breast cancer (left) and Kaplan-Meier curves of overall survival as a function of expression (right) based on the TCGA data set. (b, c) Kaplan-Meier analysis of survival associated with protein (b) and cytoplasmic phosphorylation at S39 (c) in representative ERa-positive breast cancer specimens.


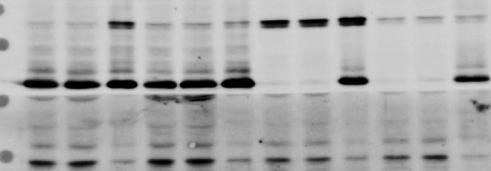
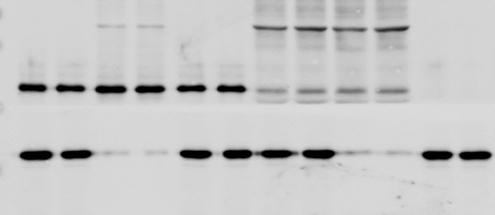
9 Uncropped images of Figure 1a Uncropped images of Figure 1b 15 IP IgG KPL-3C cells IP IgG KPL-3C cells : IP sirna Control sirna Control Uncropped images of Figure 1c 15 IP PKA catalytic IgG KPL-3C cells IP PKA catalytic IgG PKA catalytic PKA catalytic Uncropped images of Figure 1d 15 5 siegfp sipka siegfp sipka siegfp - - pser sipka siegfp sipka - - pthr siegfp sipka - - KPL-3C cells siegfp sipka - - pser- pthr- Uncropped images of Figure 1f FLAG WT - FLAG T162A S39A S689A S9A S128A S1763A WT T162A S39A S689A S9A S128A S1763A Continued on the following page
 12 24 1 nm - - + - +")


 HA-Ab 5 ps39- Uncropped images of Figure 2d")


10 Uncropped images of Figure 1g IP: Time (h) nm IP: Time (h) nm IP: IP: IgG ps35- ps128- Uncropped images of Figure 2b Uncropped images of Figure 2c 15 siegfp si Cyto Nunc Cyto Nunc HA-Ab HA- - WT S39A - WT S39A lamin tubulin Phospho- (Ser39) HA-Ab 5 ps39- Uncropped images of Figure 2d IP: IGF-1Rb FLAG Myc-ERa HA- WT S39A WT S39A 1 nm mm ERAP HEK293T cells WT S39A IGF-1Rb FLAG- Myc-ERa HA- P-IGF-1Rb (Y1135/Y1136) ps IGF-1Rb FLAG- Myc-ERa HA- Continued on the following page


11 Uncropped images of Figure 2e FLAG- 15 HEK293T cells FLAG Mock WT S35A S128A FLAG- FLAG- 15 HEK293T cells FLAG Mock WT S35A S128A FLAG ps35-15 ps128- Uncropped images of Figure 2f 15 siegfp sipka si siegfp sipka si siegfp sipka si siegfp sipka si ps35- ps ps39- siegfp sipka si siegfp sipka si Uncropped images of Figure 3a 1 nm 1 mm ERAP siegfp sipkca siegfp sipkca Cytoplasm Nucleus siegfp sipkca siegfp sipkca PKCa ERAP Cytoplasm 5 ps39- PKCa 5 lamin tubulin Nucleus 5 Continued on the following page


12 Uncropped images of Figure 3c : PKCa.1 mg recombinant PKCa (ng) P IB : IB : ps39- Uncropped images of Figure 3d Phospho recombinant (ng) P IB : IB : ps39- Uncropped images of Figure 3e 6 h IP: siegfp sipka sipkca siegfp sipka sipkca 1 nm h IP: siegfp sipka sipkca siegfp sipka sipkca 1 nm ERa ERa 5 5 PKCa PKCa 5 5 ps39- ps39- Continued on the following page


 2..5 1.")


13 MCF-7 KPL-3C ZR--1 BT-474 T47D HCC15 KPL-1 HBC4 Uncropped images of Figure 3e 24 h IP: siegfp sipka sipkca siegfp sipka sipkca 1 nm h IP: siegfp sipka sipkca siegfp sipka sipkca PKCa 5 5 ps39- ERa 5 Uncropped images of Supplementary Figure 1a Uncropped images of Supplementary Figure 1b 15 FLAG IgG HA-ERa FLAG- WT D WT D WT D FLAG b-actin 5 Uncropped images of Supplementary Figure 1c HEK293T cells FLAG- mock D - mock D - DNA (mg) FLAG- 5 Uncropped images of Supplementary Figure 1d 15 - si si - si si KPL-3C cells siegfp si si siegfp si si Continued on the following page


 15 siegfp sipka siegfp sipka 1 nm 5")


14 MCF-7 KPL-3C ZR--1 BT-474 T47D HCC15 KPL-1 HBC4 Uncropped images of Supplementary Figure 1f MCF-7 tamoxifen ERAP KPL-3C MCF KPL-3C b-actin Short exposure Long exposure Uncropped images of Supplementary Figure 1h 5 5 b-actin Uncropped images of Supplementary Figure 1m siegfp sipka siegfp sipka 1 nm (min) 15 siegfp sipka siegfp sipka 1 nm (min) 15 ps35- ps128-5 Uncropped images of Supplementary Figure 2a Uncropped images of Supplementary Figure 2b 1 nm 1 mm ERAP 5 Nucleus of ERa ERa 1 h 3 h 6 h 12 h 18 h 24 h 1 nm mm ERAP b-actin pser- 5 pser- 5 b-actin Continued on the following page


")
 1nM 5 ps35- (-)")


15 Uncropped images of Supplementary Figure 2c 5 HEK293T cells IP: FLAG Myc- + + Myc- + + FLAG-ERa + + FLAG-ERa + + HA- WT S39A HA- WT S39A Cyto Nuc Cyto Nuc Cyto Nuc Cyto Nuc 1 nm mm ERAP ERAP FLAG-ERa 5 FLAG-ERa HA- HA- IP: IgG FLAG-ERa 5 5 ps39- HA- 5 lamin tubulin Uncropped images of Supplementary Figure 3a 15 5 siegfp sipka si siegfp sipka si siegfp sipka si siegfp sipka si siegfp sipka si siegfp sipka si ps35- ps128- Uncropped images of Supplementary Figure 3b Uncropped images of Supplementary Figure 3c FLAG WT D - - HEK293T cells wt D - - FLAG- WT D - - / (-) 1nM (-) 1nM (-) 1nM -Peptide (mm) ps (-) 1nM 5 ps35- (-) 1nM 5 5 ps39- Continued on the following page


16 Uncropped images of Supplementary Figure 3d nm - 1 nm H-89 okadaic H-89 okadaic ps35- ps nm - 1 nm H-89 okadaic H-89 okadaic ps39- Uncropped images of Supplementary Figure 4b 1 nm 1 mm ERAP 5 siegfp sipka ps39-5 Uncropped images of Supplementary Figure 4d ps39-1nm mm ERAP PKCa ps39- IPs recombinant (ng) IB : P ps39- Supplementary Figure 6 Full-length images of immunoblots. Uncropped images of scanned immunoblots in Figures and Supplementary figures with size marker indications (kda)

 and CWSLVAPH (lower) found")
17 Supplementary Table 1. Mascot Search Results MS/MS Fragmentation of GSGCSCTAPALSGPVAR (upper) and CWSLVAPH (lower) found in _HUMAN in Sprot
18 Supplementary Table 2. Clinical characteristic and results of immunohistochemistry of ERa-positive breast cancer specimens. Case intensity (-3) intensity (-3) Nucleus Cytoplasm DFI (year) Recurrence Age Menopause Tumour size Lymph node metastasis Pre < 2 cm n I Post cm n I Pre < 2 cm n IIA Post cm n1 IIB Post cm n1 II Post cm n IIA Pre cm n I Post < 2 cm n IIA Post < 2 cm n IIA Pre cm n IIA Post < 2 cm n1 IIB Post < 2 cm n II Post cm n IIA Post < 2 cm n I Pre cm n I Pre cm n I Post < 2 cm n I Post cm n I Pre cm n1 I Pre cm n I Pre cm n I Post cm n IIA Pre < 2 cm n I Post < 2 cm n I Pre < 2 cm n I Post cm n I Post cm n1 IIA Pre < 2 cm n I Post < 2 cm n IIA Pre < 2 cm n1 I Post cm n I Post < 2 cm n I Post < 2 cm n1 I Post < 2 cm n I Post < 2 cm n I Post < 2 cm n I Post cm n II Pre cm n II Pre cm n1 II Pre < 2 cm n I Pre < 2 cm n I Pre cm n II Pre cm n II Pre < 2 cm n I Post < 2 cm n I Post cm n II Pre cm n II Pre < 2 cm n I Pre < 2 cm n I Post < 2 cm n I Pre < 2 cm n I Post < 2 cm n1 II Post < 2 cm n II Post cm n I Pre cm n I Post < 2 cm n II Post cm n II Post < 2 cm n I Post < 2 cm n I Pre < 2 cm n IIA Post < 2 cm n I Post < 2 cm n I Continued on the following page Post cm n II Stage
19 Pre < 2 cm n IIA Post < 2 cm n I Post < 2 cm n I Post cm n II Pre < 2 cm n I Pre cm n II Pre cm n I Pre < 2 cm n I Post cm n II Post cm n1 II Pre cm n II Post cm n II Post cm n II Post < 2 cm n I Post < 2 cm n I Post < 2 cm n I Post cm n II Pre cm n II Post < 2 cm n I Post < 2 cm n I Pre < 2 cm n I Pre cm n II Pre < 2 cm n1 I
20 Supplementary Table 3. The sequences of each primer set. Genes Sequence 5 -CGGAATTCATGGAAGAAATCCTGAGGA AGC-3 (forward) 5 -ATAGTTTAGCGGCCGCACAATGATGTCATAGACACGG-3 (reverse) Purpose mutant (T162A) mutant (S35A) mutant (S35E) mutant (S689A) mutant (S9A) mutant (S128A) mutant (S128E) mutant (S1763A) (S39A) PKCa PKCe CAMK2 5 -GTGCGGGCAGCCCTCAGTCAA-3 (forward) 5 -TTGACTGAGGGCTGCCCGCAC-3 (reverse) 5 -TCAGGCTGCGCCTGCACTGCG-3 (forward) 5 -CGCAGTGCAGGCGCAGCCTGA-3 (reverse) 5 -GGCCGAGGAGAAGGCTGCTCC-3 (forward) 5 -GGAGCAGCCTTCTCCTCGGCC-3 (reverse) 5 -CGGCTCCTGGCCCTCTCCAAT-3 (forward) 5 -ATTGGAGAGGGCCAGGAGCCG-3 (reverse) 5 -GCACGGCTGGCCTGCGCTCTA-3 (forward) 5 -TAGAGCGCAGGCCAGCCGTGC-3 (reverse) 5 -CGCTGCTGGGCCCTTGTGGCC-3 (forward) 5 -GGCCACAAGGGCCCAGCAGCG-3 (reverse) 5 -CGCTGCTGGGAACTTGTGGCC-3 (forward) 5 -GGCCACAAGTTCCCAGCAGCG-3 (reverse) 5 -AGATACATCGCCATGCAGAAC-3 (forward) 5 -GTTCTGCATGGCGATGTATCT-3 (reverse) 5 -CGGAATTCCAGACCGTGCATCATGGCCCAGAACTTGAAGGA-3 (forward) 5 -CCGCTCGAGTTTCTTACCCTTGATGAGGCTGT-3 (reverse) 5 -GTGCGCGAAGCCGTGTTCACC-3 (forward) 5 -GGTGAACACGGCTTCGCGCAC-3 (reverse) 5 -CCCAAGAATGAAAGCAAGCA-3 (forward) 5 -CCGAAACTCCAAAGGAAAGG-3 (reverse) 5 -TCAAGCAGCACCCATTCTTC-3 (forward) 5 -TCAGGGCATCAGGTCTTCAC-3 (reverse) 5 -TCAGGGCATCAGGTCTTCAC-3 (forward) 5 -GGGGAGAGAGGCAATGAAGA-3 (reverse) Real-time PCR Real-time PCR Real-time PCR b2-microglobulin 5 -AACTTAGAGGTGGGGAGCAG-3 (forward) 5 -CACAACCATGCCTTACTTTATC-3 (reverse) Real-time PCR The underlines indicate the recognition sites of restriction enzymes. Double-underlines indicate the mutation sites.
Supplementary Figure 1.TRIM33 binds β-catenin in the nucleus. a & b, Co-IP of endogenous TRIM33 with β-catenin in HT-29 cells (a) and HEK 293T cells
 and HEK 293T cells") Supplementary Figure 1.TRIM33 binds β-catenin in the nucleus. a & b, Co-IP of endogenous TRIM33 with β-catenin in HT-29 cells (a) and HEK 293T cells (b). TRIM33 was immunoprecipitated, and the amount of
Supplementary Figure 1.TRIM33 binds β-catenin in the nucleus. a & b, Co-IP of endogenous TRIM33 with β-catenin in HT-29 cells (a) and HEK 293T cells (b). TRIM33 was immunoprecipitated, and the amount of
Supplementary Figure 1. Normal T lymphocyte populations in Dapk -/- mice. (a) Normal thymic development in Dapk -/- mice. Thymocytes from WT and Dapk
 Normal thymic development in Dapk -/- mice. Thymocytes from WT and Dapk") Supplementary Figure 1. Normal T lymphocyte populations in Dapk -/- mice. (a) Normal thymic development in Dapk -/- mice. Thymocytes from WT and Dapk -/- mice were stained for expression of CD4 and CD8.
Supplementary Figure 1. Normal T lymphocyte populations in Dapk -/- mice. (a) Normal thymic development in Dapk -/- mice. Thymocytes from WT and Dapk -/- mice were stained for expression of CD4 and CD8.
RAW264.7 cells stably expressing control shrna (Con) or GSK3b-specific shrna (sh-
 or GSK3b-specific shrna (sh-") 1 a b Supplementary Figure 1. Effects of GSK3b knockdown on poly I:C-induced cytokine production. RAW264.7 cells stably expressing control shrna (Con) or GSK3b-specific shrna (sh- GSK3b) were stimulated
1 a b Supplementary Figure 1. Effects of GSK3b knockdown on poly I:C-induced cytokine production. RAW264.7 cells stably expressing control shrna (Con) or GSK3b-specific shrna (sh- GSK3b) were stimulated
Supplementary Fig. 1. GPRC5A post-transcriptionally down-regulates EGFR expression. (a) Plot of the changes in steady state mrna levels versus
 Plot of the changes in steady state mrna levels versus") Supplementary Fig. 1. GPRC5A post-transcriptionally down-regulates EGFR expression. (a) Plot of the changes in steady state mrna levels versus changes in corresponding proteins between wild type and Gprc5a-/-
Supplementary Fig. 1. GPRC5A post-transcriptionally down-regulates EGFR expression. (a) Plot of the changes in steady state mrna levels versus changes in corresponding proteins between wild type and Gprc5a-/-
Table S1. Primer sequences used for qrt-pcr. CACCATTGGCAATGAGCGGTTC AGGTCTTTGCGGATGTCCACGT ACTB AAGTCCATGTGCTGGCAGCACT ATCACCACTCCGAAGTCCGTCT LCOR
 Table S1. Primer sequences used for qrt-pcr. ACTB LCOR KLF6 CTBP1 CDKN1A CDH1 ATF3 PLAU MMP9 TFPI2 CACCATTGGCAATGAGCGGTTC AGGTCTTTGCGGATGTCCACGT AAGTCCATGTGCTGGCAGCACT ATCACCACTCCGAAGTCCGTCT CGGCTGCAGGAAAGTTTACA
SUPPLEMENTARY INFORMATION
 DOI:.38/ncb2822 a MTC02 FAO cells EEA1 b +/+ MEFs /DAPI -/- MEFs /DAPI -/- MEFs //DAPI c HEK 293 cells WCE N M C P AKT TBC1D7 Lamin A/C EEA1 VDAC d HeLa cells WCE N M C P AKT Lamin A/C EEA1 VDAC Figure
**! Yuan et al., Supplemental Figure 1, related to Figure 1! EYA2 modulates the transcriptional activity of ERb, but not ERa! -DPN! +DPN!
 Yuan et al., Supplemental Figure 1, related to Figure 1! EY2 modulates the transcriptional activity of ERb, but not ERa!! B! -DPN! +DPN! * ERb GPDH MCF7 MD-MB-231 Primary BC - KD - KD #1 #2 #3 Relative
Supplementary Figure 1. PD-L1 is glycosylated in cancer cells. (a) Western blot analysis of PD-L1 in breast cancer cells. (b) Western blot analysis
 Western blot analysis of PD-L1 in breast cancer cells. (b) Western blot analysis") Supplementary Figure 1. PD-L1 is glycosylated in cancer cells. (a) Western blot analysis of PD-L1 in breast cancer cells. (b) Western blot analysis of PD-L1 in ovarian cancer cells. (c) Western blot analysis
Supplementary Figure 1. PD-L1 is glycosylated in cancer cells. (a) Western blot analysis of PD-L1 in breast cancer cells. (b) Western blot analysis of PD-L1 in ovarian cancer cells. (c) Western blot analysis
Supplementary Figure 1
 Supplementary Figure 1 a γ-h2ax MDC1 RNF8 FK2 BRCA1 U2OS Cells sgrna-1 ** 60 sgrna 40 20 0 % positive Cells (>5 foci per cell) b ** 80 sgrna sgrna γ-h2ax MDC1 γ-h2ax RNF8 FK2 MDC1 BRCA1 RNF8 FK2 BRCA1
TRAF6 ubiquitinates TGFβ type I receptor to promote its cleavage and nuclear translocation in cancer
 Supplementary Information TRAF6 ubiquitinates TGFβ type I receptor to promote its cleavage and nuclear translocation in cancer Yabing Mu, Reshma Sundar, Noopur Thakur, Maria Ekman, Shyam Kumar Gudey, Mariya
Supplementary Figure 1: si-craf but not si-braf sensitizes tumor cells to radiation.
 Supplementary Figure 1: si-craf but not si-braf sensitizes tumor cells to radiation. (a) Embryonic fibroblasts isolated from wildtype (WT), BRAF -/-, or CRAF -/- mice were irradiated (6 Gy) and DNA damage
Supplementary Materials for
 www.sciencesignaling.org/cgi/content/full/9/439/ra78/dc1 Supplementary Materials for Small heterodimer partner mediates liver X receptor (LXR) dependent suppression of inflammatory signaling by promoting
SUPPLEMENTARY FIGURES
 SUPPLEMENTARY FIGURES Figure S1. Clinical significance of ZNF322A overexpression in Caucasian lung cancer patients. (A) Representative immunohistochemistry images of ZNF322A protein expression in tissue
File Name: Supplementary Information Description: Supplementary Figures and Supplementary Tables. File Name: Peer Review File Description:
 File Name: Supplementary Information Description: Supplementary Figures and Supplementary Tables File Name: Peer Review File Description: Primer Name Sequence (5'-3') AT ( C) RT-PCR USP21 F 5'-TTCCCATGGCTCCTTCCACATGAT-3'
Supplementary Figure 1. MAT IIα is Acetylated at Lysine 81.
 IP: Flag a Mascot PTM Modified Mass Error Position Gene Names Score Score Sequence m/z [ppm] 81 MAT2A;AMS2;MATA2 35.6 137.28 _AAVDYQK(ac)VVR_ 595.83-2.28 b Pre-immu After-immu Flag- WT K81R WT K81R / Flag
(A) SW480, DLD1, RKO and HCT116 cells were treated with DMSO or XAV939 (5 µm)
 SW480, DLD1, RKO and HCT116 cells were treated with DMSO or XAV939 (5 µm)") Supplementary Figure Legends Figure S1. Tankyrase inhibition suppresses cell proliferation in an axin/β-catenin independent manner. (A) SW480, DLD1, RKO and HCT116 cells were treated with DMSO or XAV939
Supplementary Figure Legends Figure S1. Tankyrase inhibition suppresses cell proliferation in an axin/β-catenin independent manner. (A) SW480, DLD1, RKO and HCT116 cells were treated with DMSO or XAV939
Supplementary Figure 1
 Supplementary Figure 1 Supplementary Figure 1 Schematic depiction of the tandem Fc GDF15. Supplementary Figure 2 Supplementary Figure 2 Gfral mrna levels in the brains of both wild-type and knockout Gfral
SUPPLEMENTAL FIGURE LEGENDS
 SUPPLEMENTAL FIGURE LEGENDS Supplemental Figure S1: Endogenous interaction between RNF2 and H2AX: Whole cell extracts from 293T were subjected to immunoprecipitation with anti-rnf2 or anti-γ-h2ax antibodies
Supplementary Fig. 1: ATM is phosphorylated in HER2 breast cancer cell lines. (A) ATM is phosphorylated in SKBR3 cells depending on ATM and HER2
 ATM is phosphorylated in SKBR3 cells depending on ATM and HER2") Supplementary Fig. 1: ATM is phosphorylated in HER2 breast cancer cell lines. (A) ATM is phosphorylated in SKBR3 cells depending on ATM and HER2 activity. Upper panel: Representative histograms for FACS
Supplementary Fig. 1: ATM is phosphorylated in HER2 breast cancer cell lines. (A) ATM is phosphorylated in SKBR3 cells depending on ATM and HER2 activity. Upper panel: Representative histograms for FACS
Supplementary Information Supplementary Fig. 1. Elevated Usp9x in melanoma and NRAS mutant melanoma cells are dependent on NRAS for 3D growth.
 Supplementary Information Supplementary Fig. 1. Elevated Usp9x in melanoma and NRAS mutant melanoma cells are dependent on NRAS for 3D growth. a. Immunoblot for Usp9x protein in NRAS mutant melanoma cells
Supplementary Figure 1
 Supplementary Figure 1 Asymmetrical function of 5p and 3p arms of mir-181 and mir-30 families and mir-142 and mir-154. (a) Control experiments using mirna sensor vector and empty pri-mirna overexpression
Supplementary Figure 1. The CagA-dependent wound healing or transwell migration of gastric cancer cell. AGS cells transfected with vector control or
 Supplementary Figure 1. The CagA-dependent wound healing or transwell migration of gastric cancer cell. AGS cells transfected with vector control or 3xflag-CagA expression vector were wounded using a pipette
Supplementary Information
 Supplementary Information mediates STAT3 activation at retromer-positive structures to promote colitis and colitis-associated carcinogenesis Zhang et al. a b d e g h Rel. Luc. Act. Rel. mrna Rel. mrna
p47 negatively regulates IKK activation by inducing the lysosomal degradation of polyubiquitinated NEMO
 Supplementary Information p47 negatively regulates IKK activation by inducing the lysosomal degradation of polyubiquitinated NEMO Yuri Shibata, Masaaki Oyama, Hiroko Kozuka-Hata, Xiao Han, Yuetsu Tanaka,
SUPPLEMENTARY INFORMATION
 DOI: 10.1038/ncb3076 Supplementary Figure 1 btrcp targets Cep68 for degradation during mitosis. a) Cep68 immunofluorescence in interphase and metaphase. U-2OS cells were transfected with control sirna
Supplementary Materials
 Supplementary Materials Supplementary Figure S1 Regulation of Ubl4A stability by its assembly partner A, The translation rate of Ubl4A is not affected in the absence of Bag6. Control, Bag6 and Ubl4A CRISPR
SUPPLEMENTARY INFORMATION
 doi:10.1038/nature10962 Supplementary Figure 1. Expression of AvrAC-FLAG in protoplasts. Total protein extracted from protoplasts described in Fig. 1a was subjected to anti-flag immunoblot to detect AvrAC-FLAG
(a) Schematic diagram of the FS mutation of UVRAG in exon 8 containing the highly instable
 Schematic diagram of the FS mutation of UVRAG in exon 8 containing the highly instable") Supplementary Figure 1. Frameshift (FS) mutation in UVRAG. (a) Schematic diagram of the FS mutation of UVRAG in exon 8 containing the highly instable A 10 DNA repeat, generating a premature stop codon
Supplementary Figure 1. Frameshift (FS) mutation in UVRAG. (a) Schematic diagram of the FS mutation of UVRAG in exon 8 containing the highly instable A 10 DNA repeat, generating a premature stop codon
S1a S1b S1c. S1d. S1f S1g S1h SUPPLEMENTARY FIGURE 1. - si sc Il17rd Il17ra bp. rig/s IL-17RD (ng) -100 IL-17RD
 -100 IL-17RD") SUPPLEMENTARY FIGURE 1 0 20 50 80 100 IL-17RD (ng) S1a S1b S1c IL-17RD β-actin kda S1d - si sc Il17rd Il17ra rig/s15-574 - 458-361 bp S1f S1g S1h S1i S1j Supplementary Figure 1. Knockdown of IL-17RD enhances
SUPPLEMENTARY FIGURE 1 0 20 50 80 100 IL-17RD (ng) S1a S1b S1c IL-17RD β-actin kda S1d - si sc Il17rd Il17ra rig/s15-574 - 458-361 bp S1f S1g S1h S1i S1j Supplementary Figure 1. Knockdown of IL-17RD enhances
SUPPLEMENTARY INFORMATION
 DOI: 10.1038/ncb2607 Figure S1 Elf5 loss promotes EMT in mammary epithelium while Elf5 overexpression inhibits TGFβ induced EMT. (a, c) Different confocal slices through the Z stack image. (b, d) 3D rendering
SUPPLEMENTARY INFORMATION
 Supplementary Table 1. Cell sphingolipids and S1P bound to endogenous TRAF2. Sphingolipid Cell pmol/mg TRAF2 immunoprecipitate pmol/mg Sphingomyelin 4200 ± 250 Not detected Monohexosylceramide 311 ± 18
Supplementary Figure 1. Confocal immunofluorescence showing mitochondrial translocation of Drp1. Cardiomyocytes treated with H 2 O 2 were prestained
 Supplementary Figure 1. Confocal immunofluorescence showing mitochondrial translocation of Drp1. Cardiomyocytes treated with H 2 O 2 were prestained with MitoTracker (red), then were immunostained with
William C. Comb, Jessica E. Hutti, Patricia Cogswell, Lewis C. Cantley, and Albert S. Baldwin
 Molecular Cell, Volume 45 Supplemental Information p85 SH2 Domain Phosphorylation by IKK Promotes Feedback Inhibition of PI3K and Akt in Response to Cellular Starvation William C. Comb, Jessica E. Hutti,
Kidney. Heart. Lung. Sirt1. Gapdh. Mouse IgG DAPI. Rabbit IgG DAPI
 a e Na V 1.5 Ad-LacZ Ad- 110KD b Scn5a/ (relative to Ad-LacZ) f 150 100 50 0 p = 0.65 Ad-LacZ Ad- c Heart Lung Kidney Spleen 110KD d fl/fl c -/- DAPI 20 µm Na v 1.5 250KD fl/fl Rabbit IgG DAPI fl/fl Mouse
Supplementary information
 Supplementary information Human Cytomegalovirus MicroRNA mir-us4-1 Inhibits CD8 + T Cell Response by Targeting ERAP1 Sungchul Kim, Sanghyun Lee, Jinwook Shin, Youngkyun Kim, Irini Evnouchidou, Donghyun
Supplementary Materials for
 www.sciencesignaling.org/cgi/content/full/8/398/rs12/dc1 Supplementary Materials for Quantitative phosphoproteomics reveals new roles for the protein phosphatase PP6 in mitotic cells Scott F. Rusin, Kate
condition. Left panel, the HCT-116 cells were lysed with RIPA buffer containing 0.1%
 FIGURE LEGENDS Supplementary Fig 1 (A) sumoylation pattern detected under denaturing condition. Left panel, the HCT-116 cells were lysed with RIPA buffer containing 0.1% SDS in the presence and absence
Supplementary Figure 1. PAQR3 knockdown inhibits SREBP-2 processing in CHO-7 cells CHO-7 cells were transfected with control sirna or a sirna
 Supplementary Figure 1. PAQR3 knockdown inhibits SREBP-2 processing in CHO-7 cells CHO-7 cells were transfected with control sirna or a sirna targeted for hamster PAQR3. At 24 h after the transfection,
supplementary information
 DOI: 1.138/ncb1 Control Atg7 / NAC 1 1 1 1 (mm) Control Atg7 / NAC 1 1 1 1 (mm) Lamin B Gstm1 Figure S1 Neither the translocation of into the nucleus nor the induction of antioxidant proteins in autophagydeficient
(A) RT-PCR for components of the Shh/Gli pathway in normal fetus cell (MRC-5) and a
 RT-PCR for components of the Shh/Gli pathway in normal fetus cell (MRC-5) and a") Supplementary figure legends Supplementary Figure 1. Expression of Shh signaling components in a panel of gastric cancer. (A) RT-PCR for components of the Shh/Gli pathway in normal fetus cell (MRC-5) and
Supplementary figure legends Supplementary Figure 1. Expression of Shh signaling components in a panel of gastric cancer. (A) RT-PCR for components of the Shh/Gli pathway in normal fetus cell (MRC-5) and
Supplementary Figure 1: STAT3 suppresses Kras-induced lung tumorigenesis
 Supplementary Figure 1: STAT3 suppresses Kras-induced lung tumorigenesis (a) Immunohistochemical (IHC) analysis of tyrosine 705 phosphorylation status of STAT3 (P- STAT3) in tumors and stroma (all-time
Supplementary Materials for
 www.sciencesignaling.org/cgi/content/full/6/283/ra57/dc1 Supplementary Materials for JNK3 Couples the Neuronal Stress Response to Inhibition of Secretory Trafficking Guang Yang,* Xun Zhou, Jingyan Zhu,
Supplementary Figures
 Supplementary Figures Supplementary Figure 1 DOT1L regulates the expression of epithelial and mesenchymal markers. (a) The expression levels and cellular localizations of EMT markers were confirmed by
Supplementary Figure 1 Cell line TRIB2 status. Supplementary Figure 2 TRIB2 status has no impact on the cell cycle after PI3K inhibition. a. b.
 Supplementary Figure 1 Cell line TRIB2 status. TRIB2 protein expression to determine endogenous expression and to determine the effectiveness of each of our TRIB2 knockdown constructs. Supplementary Figure
SUPPLEMENTARY INFORMATION
 DOI: 10.1038/ncb3311 A B TSC2 -/- MEFs C Rapa Hours WCL 0 6 12 24 36 pakt.s473 AKT ps6k S6K CM IGF-1 Recipient WCL - + - + - + pigf-1r IGF-1R pakt ps6 AKT D 1 st SILAC 2 nd SILAC E GAPDH FGF21 ALKPGVIQILGVK
Supplementary Figure 1 ITGB1 and ITGA11 increase with evidence for heterodimers following HSC activation. (a) Time course of rat HSC activation
 Time course of rat HSC activation") Supplementary Figure 1 ITGB1 and ITGA11 increase with evidence for heterodimers following HSC activation. (a) Time course of rat HSC activation indicated by the detection of -SMA and COL1 (log scale).
Supplementary Figure 1 ITGB1 and ITGA11 increase with evidence for heterodimers following HSC activation. (a) Time course of rat HSC activation indicated by the detection of -SMA and COL1 (log scale).
2.5. AMPK activity
 Supplement Fig. A 3 B phos-ampk 2.5 * Control AICAR AMPK AMPK activity (Absorbance at 45 nm) 2.5.5 Control AICAR Supplement Fig. Effects of AICAR on AMPK activation in macrophages. J774. macrophages were
Supplementary Figure 1
 Supplementary Figure 1 YAP negatively regulates IFN- signaling. (a) Immunoblot analysis of Yap knockdown efficiency with sh-yap (#1 to #4 independent constructs) in Raw264.7 cells. (b) IFN- -Luc and PRDs
T H E J O U R N A L O F C E L L B I O L O G Y
 T H E J O U R N A L O F C E L L B I O L O G Y Supplemental material Krenn et al., http://www.jcb.org/cgi/content/full/jcb.201110013/dc1 Figure S1. Levels of expressed proteins and demonstration that C-terminal
Nature Structural and Molecular Biology: doi: /nsmb Supplementary Figure 1
 Supplementary Figure 1 Mutational analysis of the SA2-Scc1 interaction in vitro and in human cells. (a) Autoradiograph (top) and Coomassie stained gel (bottom) of 35 S-labeled Myc-SA2 proteins (input)
Blocking c-met mediated PARP1 phosphorylation enhances anti-tumor effects of PARP inhibitors
 CORRECTION NOTICE Nat. Med. 22, 194 21 (216) Blocking mediated phosphorylation enhances anti-tumor effects of PARP inhibitors Yi Du, Hirohito Yamaguchi, Yongkun Wei, Jennifer L Hsu, Hung-Ling Wang, Yi-Hsin
BIO360 Fall 2013 Quiz 1
 BIO360 Fall 2013 Quiz 1 1. Examine the diagram below. There are two homologous copies of chromosome one and the allele of YFG carried on the light gray chromosome has undergone a loss-of-function mutation.
SUPPLEMENTARY FIGURES AND TABLE
 SUPPLEMENTARY FIGURES AND TABLE Supplementary Figure S1: Characterization of IRE1α mutants. A. U87-LUC cells were transduced with the lentiviral vector containing the GFP sequence (U87-LUC Tet-ON GFP).
Supplementary Figure 1 Role of Raf-1 in TLR2-Dectin-1-mediated cytokine expression
 Supplementary Figure 1 Supplementary Figure 1 Role of Raf-1 in TLR2-Dectin-1-mediated cytokine expression. Quantitative real-time PCR of indicated mrnas in DCs stimulated with TLR2-Dectin-1 agonist zymosan
Supplementary Figure 1. Spatial distribution of LRP5 and β-catenin in intact cardiomyocytes. (a) and (b) Immunofluorescence staining of endogenous
 and (b) Immunofluorescence staining of endogenous") Supplementary Figure 1. Spatial distribution of LRP5 and β-catenin in intact cardiomyocytes. (a) and (b) Immunofluorescence staining of endogenous LRP5 in intact adult mouse ventricular myocytes (AMVMs)
Supplementary Figure 1. Spatial distribution of LRP5 and β-catenin in intact cardiomyocytes. (a) and (b) Immunofluorescence staining of endogenous LRP5 in intact adult mouse ventricular myocytes (AMVMs)
ACC ELOVL MCAD. CPT1α 1.5 *** 0.5. Reverbα *** *** 0.5. Fasted. Refed
 Supplementary Figure A 8 SREBPc 6 5 FASN ELOVL6.5.5.5 ACC.5.5 CLOCK.5.5 CRY.5.5 PPARα.5.5 ACSL CPTα.5.5.5.5 MCAD.5.5 PEPCK.5.5 G6Pase 5.5.5.5 BMAL.5.5 Reverbα.5.5 Reverbβ.5.5 PER.5.5 PER B Fasted Refed
Supplementary Table 1. Metabolic parameters in GFP and OGT-treated mice
 Supplementary Table 1. Metabolic parameters in GFP and OGT-treated mice Fasted Refed GFP OGT GFP OGT Liver G6P (mmol/g) 0.03±0.01 0.04±0.02 0.60±0.04 0.42±0.10 A TGs (mg/g of liver) 20.08±5.17 16.29±0.8
Supplementary Figure 1
 Supplementary Figure 1 14 12 SEM4C PLXN2 8 SEM4C C 3 Cancer Cell Non Cancer Cell Expression 1 8 6 6 4 log2 ratio Expression 2 1 4 2 2 p value.1 D Supplementary Figure 1. Expression of Sema4C and Plexin2
SUPPLEMENTARY INFORMATION. Supplementary Figures S1-S9. Supplementary Methods
 SUPPLEMENTARY INFORMATION SUMO1 modification of PTEN regulates tumorigenesis by controlling its association with the plasma membrane Jian Huang 1,2#, Jie Yan 1,2#, Jian Zhang 3#, Shiguo Zhu 1, Yanli Wang
ANGPTL2 increases bone metastasis of breast cancer cells through. Tetsuro Masuda, Motoyoshi Endo, Yutaka Yamamoto, Haruki Odagiri, Tsuyoshi
 Masuda et al. Supplementary information for ANGPTL2 increases bone metastasis of breast cancer cells through enhancing CXCR4 signaling Tetsuro Masuda, Motoyoshi Endo, Yutaka Yamamoto, Haruki Odagiri, Tsuyoshi
Supplemental Figure 1. Western blot analysis indicated that MIF was detected in the fractions of
 Supplemental Figure Legends Supplemental Figure 1. Western blot analysis indicated that was detected in the fractions of plasma membrane and cytosol but not in nuclear fraction isolated from Pkd1 null
Supplementary Figure 1. Characterization of NMuMG-ErbB2 and NIC breast cancer cells expressing shrnas targeting LPP. NMuMG-ErbB2 cells (a) and NIC
 and NIC") Supplementary Figure 1. Characterization of NMuMG-ErbB2 and NIC breast cancer cells expressing shrnas targeting LPP. NMuMG-ErbB2 cells (a) and NIC cells (b) were engineered to stably express either a LucA-shRNA
Supplementary Figure 1. Characterization of NMuMG-ErbB2 and NIC breast cancer cells expressing shrnas targeting LPP. NMuMG-ErbB2 cells (a) and NIC cells (b) were engineered to stably express either a LucA-shRNA
A. List of selected proteins with high SILAC (H/L) ratios identified in mass
 ratios identified in mass") Supplementary material Figure S1. Interaction between UBL5 and FANCI A. List of selected proteins with high SILAC (H/L) ratios identified in mass spectrometry (MS)-based analysis of UBL5-interacting proteins,
Supplementary material Figure S1. Interaction between UBL5 and FANCI A. List of selected proteins with high SILAC (H/L) ratios identified in mass spectrometry (MS)-based analysis of UBL5-interacting proteins,
Supplementary Table S1. Tumor samples used for analysis Tumor size (cm) BNG (grade) ERα PR. pn-
 BNG (grade) ERα PR. pn-") Supplementary Table S1. Tumor samples used for analysis Sample# Age Tumor size (cm) pn- Stage Stage BNG (grade) ERα PR HER2 (FISH) Triple negative T1 46 3 N1a III 2 Pos Neg N T2 58 1 N(i-) I 3 Pos Neg
Supplementary Table S1. Tumor samples used for analysis Sample# Age Tumor size (cm) pn- Stage Stage BNG (grade) ERα PR HER2 (FISH) Triple negative T1 46 3 N1a III 2 Pos Neg N T2 58 1 N(i-) I 3 Pos Neg
(a) Significant biological processes (upper panel) and disease biomarkers (lower panel)
 Significant biological processes (upper panel) and disease biomarkers (lower panel)") Supplementary Figure 1. Functional enrichment analyses of secretomic proteins. (a) Significant biological processes (upper panel) and disease biomarkers (lower panel) 2 involved by hrab37-mediated secretory
Supplementary Figure 1. Functional enrichment analyses of secretomic proteins. (a) Significant biological processes (upper panel) and disease biomarkers (lower panel) 2 involved by hrab37-mediated secretory
Tyrosine phosphorylation and protein degradation control the transcriptional activity of WRKY involved in benzylisoquinoline alkaloid biosynthesis
 Supplementary information Tyrosine phosphorylation and protein degradation control the transcriptional activity of WRKY involved in benzylisoquinoline alkaloid biosynthesis Yasuyuki Yamada, Fumihiko Sato
Supplementary Figure 1. Deletion of Smad3 prevents B16F10 melanoma invasion and metastasis in a mouse s.c. tumor model.
 A B16F1 s.c. Lung LN Distant lymph nodes Colon B B16F1 s.c. Supplementary Figure 1. Deletion of Smad3 prevents B16F1 melanoma invasion and metastasis in a mouse s.c. tumor model. Highly invasive growth
SUPPLEMENTARY INFORMATION
 doi:10.1038/nature12652 Supplementary Figure 1. PRDM16 interacts with endogenous EHMT1 in brown adipocytes. Immunoprecipitation of PRDM16 complex by flag antibody (M2) followed by Western blot analysis
Supplemental Figure 1
 Supplemental Figure 1 1a 1c PD-1 MFI fold change 6 5 4 3 2 1 IL-1α IL-2 IL-4 IL-6 IL-1 IL-12 IL-13 IL-15 IL-17 IL-18 IL-21 IL-23 IFN-α Mut Human PD-1 promoter SBE-D 5 -GTCTG- -1.2kb SBE-P -CAGAC- -1.kb
HIF-inducible mir-191 promotes migration in breast cancer through complex regulation of TGFβ-signaling in hypoxic microenvironment.
 HIF-inducible mir-9 promotes migration in breast cancer through complex regulation of TGFβ-signaling in hypoxic microenvironment. Neha Nagpal, Hafiz M Ahmad, Shibu Chameettachal3, Durai Sundar, Sourabh
Supplementary Figure 1
 Supplementary Figure 1 Constitutive EGFR signaling does not activate canonical EGFR signals (a) U251EGFRInd cells with or without tetracycline exposure (24h, 1µg/ml) were treated with EGF for 15 minutes
Supplementary Figure 1. HOPX is hypermethylated in NPC. (a) Methylation levels of HOPX in Normal (n = 24) and NPC (n = 24) tissues from the
 Methylation levels of HOPX in Normal (n = 24) and NPC (n = 24) tissues from the") Supplementary Figure 1. HOPX is hypermethylated in NPC. (a) Methylation levels of HOPX in Normal (n = 24) and NPC (n = 24) tissues from the genome-wide methylation microarray data. Mean ± s.d.; Student
Supplementary Figure 1. HOPX is hypermethylated in NPC. (a) Methylation levels of HOPX in Normal (n = 24) and NPC (n = 24) tissues from the genome-wide methylation microarray data. Mean ± s.d.; Student
Supplementary Figure 1. Procedures for p38 activity imaging in living cells. (a) Schematic model of the p38 activity reporter. The reporter consists
 Schematic model of the p38 activity reporter. The reporter consists") Supplementary Figure 1. Procedures for p38 activity imaging in living cells. (a) Schematic model of the p38 activity reporter. The reporter consists of: (i) the YPet domain (an enhanced YFP); (ii) the
Supplementary Figure 1. Procedures for p38 activity imaging in living cells. (a) Schematic model of the p38 activity reporter. The reporter consists of: (i) the YPet domain (an enhanced YFP); (ii) the
supplementary information
 DOI: 10.1038/ncb1875 Figure S1 (a) The 79 surgical specimens from NSCLC patients were analysed by immunohistochemistry with an anti-p53 antibody and control serum (data not shown). The normal bronchi served
hexahistidine tagged GRP78 devoid of the KDEL motif (GRP78-His) on SDS-PAGE. This
 on SDS-PAGE. This") SUPPLEMENTAL FIGURE LEGEND Fig. S1. Generation and characterization of. (A) Coomassie staining of soluble hexahistidine tagged GRP78 devoid of the KDEL motif (GRP78-His) on SDS-PAGE. This protein was expressed
SUPPLEMENTAL FIGURE LEGEND Fig. S1. Generation and characterization of. (A) Coomassie staining of soluble hexahistidine tagged GRP78 devoid of the KDEL motif (GRP78-His) on SDS-PAGE. This protein was expressed
SUPPLEMENTARY INFORMATION
 Supplementary Figures Supplementary Figure S1. Binding of full-length OGT and deletion mutants to PIP strips (Echelon Biosciences). Supplementary Figure S2. Binding of the OGT (919-1036) fragments with
SUPPLEMENTARY INFORMATION
 doi: 1.138/nature89 IFN- (ng ml ) 5 4 3 1 Splenocytes NS IFN- (ng ml ) 6 4 Lymph node cells NS Nfkbiz / Nfkbiz / Nfkbiz / Nfkbiz / IL- (ng ml ) 3 1 Splenocytes IL- (ng ml ) 1 8 6 4 *** ** Lymph node cells
18s AAACGGCTACCACATCCAAG CCTCCAATGGATCCTCGTTA. 36b4 GTTCTTGCCCATCAGCACC AGATGCAGCAGATCCGCAT. Acc1 AGCAGATCCGCAGCTTG ACCTCTGCTCGCTGAGTGC
 Supplementary Table 1. Quantitative PCR primer sequences Gene symbol Sequences (5 to 3 ) Forward Reverse 18s AAACGGCTACCACATCCAAG CCTCCAATGGATCCTCGTTA 36b4 GTTCTTGCCCATCAGCACC AGATGCAGCAGATCCGCAT Acc1
Xenoestrogen-induced Regulation of EZH2 and Histone Methylation via Non-Genomic Estrogen
 Xenoestrogen-induced Regulation of EZH2 and Histone Methylation via Non-Genomic Estrogen Receptor Signaling to PI3K/AKT Tiffany G. Bredfeldt, Kristen L. Greathouse, Stephen H. Safe, Mien-Chie Hung, Mark
T H E J O U R N A L O F C E L L B I O L O G Y
 Supplemental material Jewell et al., http://www.jcb.org/cgi/content/full/jcb.201007176/dc1 T H E J O U R N A L O F C E L L B I O L O G Y Figure S1. IR Munc18c association is independent of IRS-1. (A and
SUPPLEMENTARY INFORMATION
 doi: 10.1038/nature06994 A phosphatase cascade by which rewarding stimuli control nucleosomal response A. Stipanovich*, E. Valjent*, M. Matamales*, A. Nishi, J.H. Ahn, M. Maroteaux, J. Bertran-Gonzalez,
SUPPLEMENTARY INFORMATION
 Supplementary Discussion The cell cycle machinery and the DNA damage response network are highly interconnected and co-regulated in assuring faithful duplication and partition of genetic materials into
Expanded View Figures
 Shao-Ming Shen et al Role of I in MT of cancers MO reports xpanded View igures igure V1. nalysis of the expression of I isoforms in cancer cells and their interaction with PTN. RT PR detection of Ish and
Supplementary Figure 1 IL-27 IL
 Tim-3 Supplementary Figure 1 Tc0 49.5 0.6 Tc1 63.5 0.84 Un 49.8 0.16 35.5 0.16 10 4 61.2 5.53 10 3 64.5 5.66 10 2 10 1 10 0 31 2.22 10 0 10 1 10 2 10 3 10 4 IL-10 28.2 1.69 IL-27 Supplementary Figure 1.
Expanded View Figures
 MO reports PR3 dephosphorylates TZ Xian-o Lv et al xpanded View igures igure V1. PR3 dephosphorylates and inactivates YP/TZ., Overexpression of tight junction proteins Pals1 () or LIN7 () has no effect
Supplementary Figure 1 CD4 + T cells from PKC-θ null mice are defective in NF-κB activation during T cell receptor signaling. CD4 + T cells were
 Supplementary Figure 1 CD4 + T cells from PKC-θ null mice are defective in NF-κB activation during T cell receptor signaling. CD4 + T cells were isolated from wild type (PKC-θ- WT) or PKC-θ null (PKC-θ-KO)
Supplementary Figure S1 Supplementary Figure S2
 Supplementary Figure S A) The blots shown in Figure B were qualified by using Gel-Pro analyzer software (Rockville, MD, USA). The ratio of LC3II/LC3I to actin was then calculated. The data are represented
33VASTVNGATSANNHGEPPS51PADARPR58
 Pro-rich region Trans-membrane region 214 246 359 381 UL50 1 397 211SSRTAS216PPPPPR222 NLS CR1 CR2 CR3 CR4 UL53 1 376 11RERRS15ALRS19LLRKRRR25 33VASTVNGATSANNHGEPPS51PADARPR58 FIG S1. UL97 phosphorylation
Supplementary Figure 1. Prevalence of U539C and G540A nucleotide and E172K amino acid substitutions among H9N2 viruses. Full-length H9N2 NS
 Supplementary Figure 1. Prevalence of U539C and G540A nucleotide and E172K amino acid substitutions among H9N2 viruses. Full-length H9N2 NS nucleotide sequences (a, b) or amino acid sequences (c) from
Plasma exposure levels from individual mice 4 hours post IP administration at the
 Supplemental Figure Legends Figure S1. Plasma exposure levels of MKC-3946 in mice. Plasma exposure levels from individual mice 4 hours post IP administration at the indicated dose mg/kg. Data represent
Supplementary Figure 1: High-throughput profiling of survival after exposure to - radiation. (a) Cells were plated in at least 7 wells in a 384-well
 Cells were plated in at least 7 wells in a 384-well") Supplementary Figure 1: High-throughput profiling of survival after exposure to - radiation. (a) Cells were plated in at least 7 wells in a 384-well plate at cell densities ranging from 25-225 cells in
Supplementary Figure 1: High-throughput profiling of survival after exposure to - radiation. (a) Cells were plated in at least 7 wells in a 384-well plate at cell densities ranging from 25-225 cells in
Nature Immunology: doi: /ni Supplementary Figure 1. IC261 inhibits a virus-induced type I interferon response.
 Supplementary Figure 1 IC261 inhibits a virus-induced type I interferon response. (a) HEK293T cells were cultured in 384 wells and transiently transfected with 50 ng of the IFN-β promoter-luc construct
Construction of a hepatocellular carcinoma cell line that stably expresses stathmin with a Ser25 phosphorylation site mutation
 Construction of a hepatocellular carcinoma cell line that stably expresses stathmin with a Ser25 phosphorylation site mutation J. Du 1, Z.H. Tao 2, J. Li 2, Y.K. Liu 3 and L. Gan 2 1 Department of Chemistry,
a b G75 G60 Sw-2 Sw-1 Supplementary Figure 1. Structure predictions by I-TASSER Server.
 a b G75 2 2 G60 Sw-2 Sw-1 Supplementary Figure 1. Structure predictions by I-TASSER Server. a. Overlay of top 10 models generated by I-TASSER illustrates the potential effect of 7 amino acid insertion
Supplemental Information
 Supplemental Information Tobacco-specific Carcinogen Induces DNA Methyltransferases 1 Accumulation through AKT/GSK3β/βTrCP/hnRNP-U in Mice and Lung Cancer patients Ruo-Kai Lin, 1 Yi-Shuan Hsieh, 2 Pinpin
Supplemental Fig. 1. Relative mrna Expression. Relative mrna Expression WT KO WT KO RT 4 0 C
 Supplemental Fig. 1 A 1.5 1..5 Hdac11 (ibat) n=4 n=4 n=4 n=4 n=4 n=4 n=4 n=4 WT KO WT KO WT KO WT KO RT 4 C RT 4 C Supplemental Figure 1. Hdac11 mrna is undetectable in KO adipose tissue. Quantitative
CA Tel.: ; Fax: ; ucsd.edu.
 THE JOURNAL OF BIOLOGICAL CHEMISTRY VOL. 283, NO. 10, pp. 6300 6311, March 7, 2008 2008 by The American Society for Biochemistry and Molecular Biology, Inc. Printed in the U.S.A. The Phosphatase PHLPP
Supplementary Figure 1. A. Bar graph representing the expression levels of the 19 indicated genes in the microarrays analyses comparing human lung
 Supplementary Figure 1. A. Bar graph representing the expression levels of the 19 indicated genes in the microarrays analyses comparing human lung immortalized broncho-epithelial cells (AALE cells) expressing
ERK1/2/MAPK pathway-dependent regulation of the telomeric factor TRF2
 ERK1/2/MAPK pathway-dependent regulation of the telomeric factor TRF2 SUPPLEMENTARY FIGURES AND TABLE Supplementary Figure S1: Conservation of the D domain throughout evolution. Alignment of TRF2 sequences
SUPPLEMENTARY INFORMATION
 DOI: 1.138/ncb3355 a S1A8 + cells/ total.1.8.6.4.2 b S1A8/?-Actin c % T-cell proliferation 3 25 2 15 1 5 T cells Supplementary Figure 1 Inter-tumoral heterogeneity of MDSC accumulation in mammary tumor