Supplementary Figures
|
|
|
- Justina Wright
- 5 years ago
- Views:
Transcription


 cell")
.")
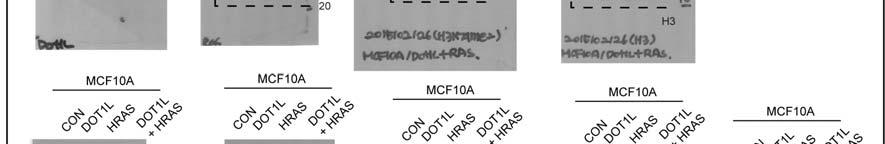
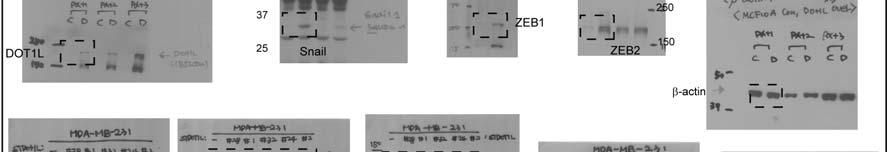
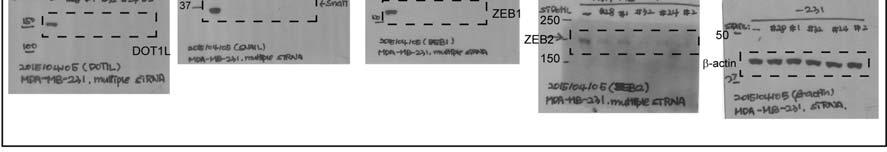
1 Supplementary Figures Supplementary Figure 1 DOT1L regulates the expression of epithelial and mesenchymal markers. (a) The expression levels and cellular localizations of EMT markers were confirmed by immunofluorescence staining. (b) Flow cytometric analysis of E-cadherin expression in DOT1L-overexpressing MCF10A cells. The histogram shows the percentage of the E-cadherinexpressing (Alexa Fluor 488-positive) cell population. Error bars represent means ± s.d. of triplicate measurements. *P < 0.05 vs. controls (Student s t-test). (c) Effect of DOT1L sirna on epithelial and mesenchymal markers in MCF10A cells expressing DOT1L wild type or sirnaresistant DOT1L mutant (si MUT) were examined by immunoblotting. (d) MDA-MB-231 cells were transiently transfected with DOT1L sirnas and subjected to immunoblotting. 1
2 Supplementary Figure 2 Effect of TGF-β on DOT1L-induced breast cancer migration and invasion. (a,b) DOT1L-overexpressing MCF10A cells and its control cells in the presence or absence of 100 pm TGF- 1 were treated with 10 µm TGF- inhibitor SB , 1 µm DOT1L inhibitor EPZ (EPZ), or both for 48 h, and invasion (a) and migration (b) by the indicated cells were analyzed and quantified. Results are shown as means ± s.d. of experiments in triplicate. *P < 0.05, **P < 0.01, *P < 0.001, vs. CON (lane 1); P < 0.05, P < 0.01, P < 0.001, vs. vehicles (lanes 2, 6, and 10) by Student s t-test. 2

 SK-BR-3 cell lines were analyzed using")
 Representative images and quantification of invasion (upper) and migration (lower)")
3 Supplementary Figure 3 Effect of DOT1L on EMT and invasion ability in human breast cancer cell lines. (a) The expression levels of epithelial and mesenchymal markers in DOT1Loverexpressing T47D or Tet-inducible DOT1L knockdown (shdot1l) SK-BR-3 cell lines were analyzed using immunoblotting. (b,c) Representative images and quantification of invasion (upper) and migration (lower) by the indicated cells (b, T47D; c, SK-BR-3). The data represents the means ± s.d. of triplicate assays. *P < 0.05 compared with CON or shcon (Student s t-test). 3
 The expression levels of DOT1L, E-cadherin and H3K79me2 in HuMEC normal human epithelial cells, MCF10A immortalized non-cancer cells and eight breast cancer cell lines were")
 The breast CSC (CD44 + /CD24 - /ESA + ) and non-csc (Non-CSC) subpopulations among MCF10A, T47D, MCF7 and MDA-MB-231 cells were sorted using FACS Aria and the DOT1L mrna")
4 Supplementary Figure 4 DOT1L expression in breast normal and cancer cell lines and breast CSCs. (a) The expression levels of DOT1L, E-cadherin and H3K79me2 in HuMEC normal human epithelial cells, MCF10A immortalized non-cancer cells and eight breast cancer cell lines were analyzed by immunoblotting. (b) The breast CSC (CD44 + /CD24 - /ESA + ) and non-csc (Non-CSC) subpopulations among MCF10A, T47D, MCF7 and MDA-MB-231 cells were sorted using FACS Aria and the DOT1L mrna level in the indicated fractions was determined using qrt-pcr. The 18S gene was used as an internal control for qrt-pcr. The data represents the means ± s.d. of triplicate assays. *P < 0.05 compared with Non-CSC (Student s t-test). 4
5 Supplementary Figure 5 Effect of DOT1L knockdown on breast CSC population. Cells were transfected with indicated DOT1L sirnas for 48 h and subjected to FACS analysis for measurement of changes in the CD44 + /CD24 - /ESA + cell population. The data represents the means ± s.d. of triplicate assays. *P < 0.05 compared with sicon (Student s t-test). 5
 Soft-agar colony formation assay was performed to examine anchorage-independent")

 To assess the effect of DOT1L overexpression on in vivo tumor growth, NOD/SCID")


6 Supplementary Figure 6 DOT1L accelerates in vitro and in vivo breast tumor growth. (a) Soft-agar colony formation assay was performed to examine anchorage-independent tumor growth in stable DOT1L-overexpressing and Tet-inducible DOT1L shrna-expressing cells. Results are shown as means ± s.d. of experiments in triplicate. Scale bars = 100 µm. *P < 0.05 vs. controls (Student s t-test). (b) To assess the effect of DOT1L overexpression on in vivo tumor growth, NOD/SCID mice were orthotopically injected with control or DOT1Loverexpressing T47D cells, and the tumor size in each group was measured twice per week for 40 days. (c) The tumor growth rate in xenograft mice with Tet-inducible DOT1L-knockdown MDA-MB-231 cells was analyzed as described above. Error bars in b-c indicate the means ± s.e.m (n = 5). * P < 0.05 vs. controls (Student s t-test). 6
 MCF10A cells expressing either DOT1L or HRAS and MCF10A cells coexpressing DOT1L and HRAS (DOT1L + HRAS) were treated with either 1 µm EPZ004777 (EPZ) for 48 h, or 20 µm RAF inhibitor Sorafenib")
7 Supplementary Figure 7 DOT1L and HRAS effect on breast cancer migration and invasion in MCF10A cells. (a,b) MCF10A cells expressing either DOT1L or HRAS and MCF10A cells coexpressing DOT1L and HRAS (DOT1L + HRAS) were treated with either 1 µm EPZ (EPZ) for 48 h, or 20 µm RAF inhibitor Sorafenib for 24 h, or both inhibitors. The invasion (a) and migration (b) by the indicated cells were analyzed and quantified. Results are shown as means ± s.d. of experiments in triplicate. *P < 0.05, **P < 0.01, *P < 0.001, vs. CON (lane 1); P < 0.05, P < 0.01, P < 0.001, vs. vehicles (lanes 2, 6, and 10) by Student s t-test. 7
 MCF10A cells expressing DOT1L wild type or sirna-resistant DOT1L mutant (si MUT) were treated with DOT1L sirna (#2) for 48 h.")
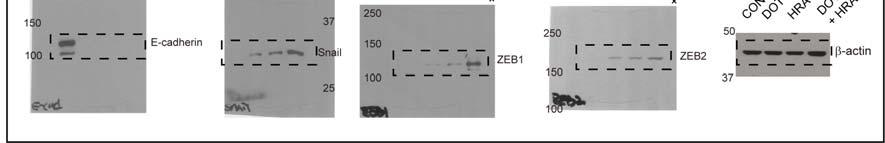
8 Supplementary Figure 8 DOT1L regulates EMT-TFs expression. (a,b) MCF10A cells expressing DOT1L wild type or sirna-resistant DOT1L mutant (si MUT) were treated with DOT1L sirna (#2) for 48 h. The lysates from indicated cells were then subjected to immunoblotting for analysis of EMT-TFs expression. 8
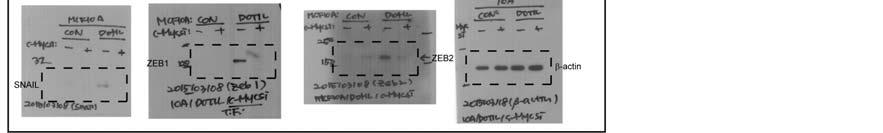
9 Supplementary Figure 9 DOT1L epigenetically regulates ZEB1 and ZEB2 gene expression. (a,b) ChIP analysis showing the recruitment of indicated proteins and enrichment of histone marks in the promoter regions of ZEB1 and ZEB2 genes. Results are shown as means ± s.d. of experiments in triplicate. *P < 0.05 vs. CON (Student s t-test). 9
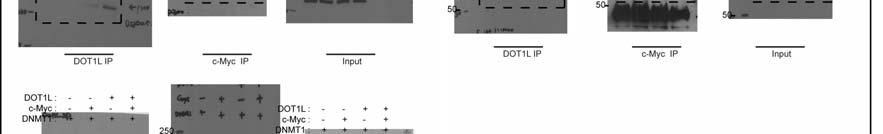
10 Supplementary Figure 10 Effect of c-myc on DOT1L-mediated epigenetic regulation of EMT-TFs. DOT1L-overexpressing or control MCF10A cells were transfected with c-myc sirna for 48 h. The dependency of EMT-TF regulation by DOT1L on c-myc was then analyzed by ChIP-qPCR assay in these cells. Results are shown as means ± s.d. of experiments in triplicate. * and, P < 0.05 vs. CON/siCON and DOT1L/siCON, respectively (Student s t- test). 10
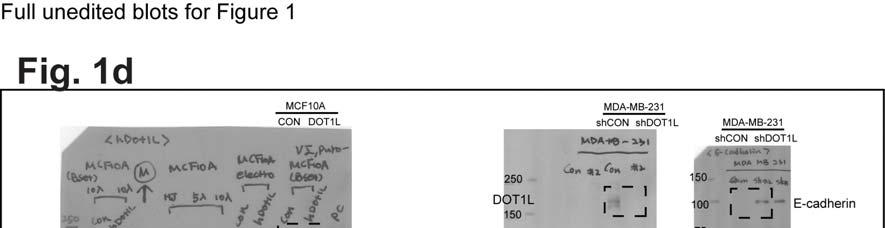
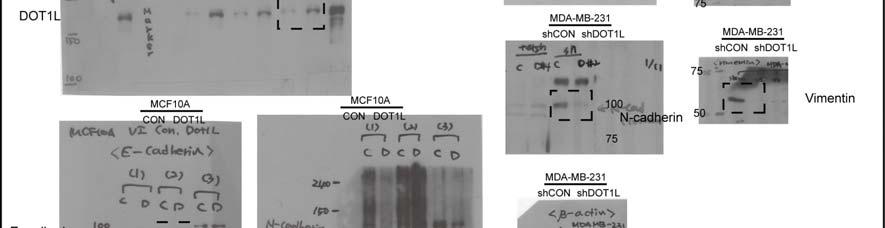
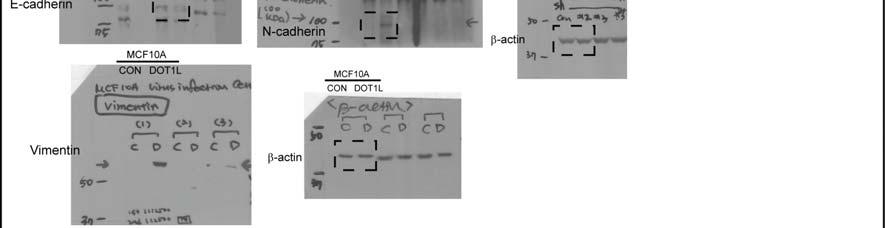
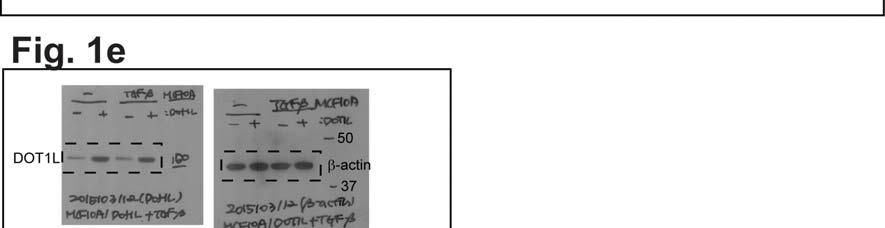
11 Supplementary Figure 11 Original images of Western blots for Figure 1 11

12 Supplementary Figure 11 (cont.) Original images of Western blots for Figure 2 12
13 Supplementary Figure 11 (cont.) Original images of Western blots for Figure 3 13
14 Supplementary Figure 11 (cont.) Original images of Western blots for Figure 4a-e 14
15 Supplementary Figure 11 (cont.) Original images of Western blots for Figure 4f,g 15
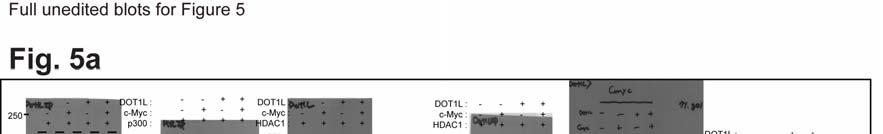
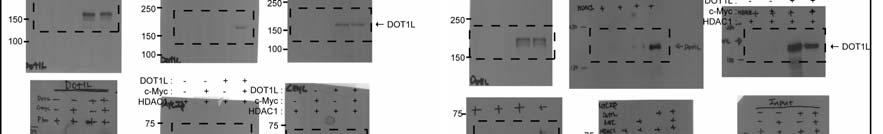
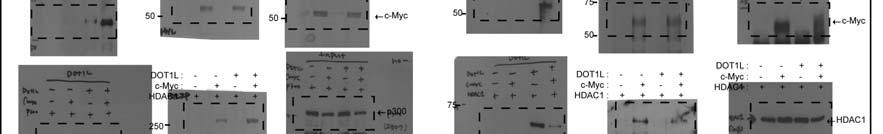
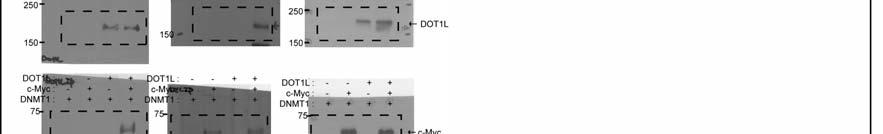

16 Supplementary Figure 11 (cont.) Original images of Western blots for Figure 5 16
17 Supplementary Table 1. Correlation of DOT1L expression with clinicopathologic data in breast cancers (n = 182) Clinico-pathologic Parameters n DOT1L Expression Negative Positive P value (χ 2 -test) AJCC Stage Stage I-II (66.7%) 42 (44.8%) Stage III-IV (54.5%) 25(45.5%) Lymph node metastasis Negative (74.4%) 22 (25.6%) Positive (53.1%) 45 (46.9%) Lymphatic invasion < Negative (78.2%) 17 (21.8%) Positive (51.9) 50 (48.1) Estrogen receptor Negative (56.0%) 40 (44.0%) Positive (70.3%) 27(29.7%) Progesterone receptor Negative 87 47(54.0%) 40 (46.0%) Positive (71.6%) 27 (28.4%) HER2 (IHC) Negative (62.3%) 20 (37.7%) Positive (63.3%) 47 (36.7%) Triple-negativity Triple-negative (58.5%) 56 (41.5%) Non-triple-negative (76.6%) 11 (23.4%) 17
18 Supplementary Table 2. Cox regression analysis of overall and disease-free survival of breast cancer patients according to DOT1L expression Total ER+ * ER- ** Overall survival P value Hazard ratio Disease free survival P value Hazard ratio Number of patients *ER+ and **ER-, estrogen receptor-positive and -negative breast cancer patients, respectively 18
Supplementary Fig. 1: ATM is phosphorylated in HER2 breast cancer cell lines. (A) ATM is phosphorylated in SKBR3 cells depending on ATM and HER2
 ATM is phosphorylated in SKBR3 cells depending on ATM and HER2") Supplementary Fig. 1: ATM is phosphorylated in HER2 breast cancer cell lines. (A) ATM is phosphorylated in SKBR3 cells depending on ATM and HER2 activity. Upper panel: Representative histograms for FACS
Supplementary Fig. 1: ATM is phosphorylated in HER2 breast cancer cell lines. (A) ATM is phosphorylated in SKBR3 cells depending on ATM and HER2 activity. Upper panel: Representative histograms for FACS
Supplementary Figure 1. HOPX is hypermethylated in NPC. (a) Methylation levels of HOPX in Normal (n = 24) and NPC (n = 24) tissues from the
 Methylation levels of HOPX in Normal (n = 24) and NPC (n = 24) tissues from the") Supplementary Figure 1. HOPX is hypermethylated in NPC. (a) Methylation levels of HOPX in Normal (n = 24) and NPC (n = 24) tissues from the genome-wide methylation microarray data. Mean ± s.d.; Student
Supplementary Figure 1. HOPX is hypermethylated in NPC. (a) Methylation levels of HOPX in Normal (n = 24) and NPC (n = 24) tissues from the genome-wide methylation microarray data. Mean ± s.d.; Student
SUPPLEMENTARY INFORMATION
 DOI: 10.1038/ncb2607 Figure S1 Elf5 loss promotes EMT in mammary epithelium while Elf5 overexpression inhibits TGFβ induced EMT. (a, c) Different confocal slices through the Z stack image. (b, d) 3D rendering
(A) RT-PCR for components of the Shh/Gli pathway in normal fetus cell (MRC-5) and a
 RT-PCR for components of the Shh/Gli pathway in normal fetus cell (MRC-5) and a") Supplementary figure legends Supplementary Figure 1. Expression of Shh signaling components in a panel of gastric cancer. (A) RT-PCR for components of the Shh/Gli pathway in normal fetus cell (MRC-5) and
Supplementary figure legends Supplementary Figure 1. Expression of Shh signaling components in a panel of gastric cancer. (A) RT-PCR for components of the Shh/Gli pathway in normal fetus cell (MRC-5) and
Supplementary Table S1. Tumor samples used for analysis Tumor size (cm) BNG (grade) ERα PR. pn-
 BNG (grade) ERα PR. pn-") Supplementary Table S1. Tumor samples used for analysis Sample# Age Tumor size (cm) pn- Stage Stage BNG (grade) ERα PR HER2 (FISH) Triple negative T1 46 3 N1a III 2 Pos Neg N T2 58 1 N(i-) I 3 Pos Neg
Supplementary Table S1. Tumor samples used for analysis Sample# Age Tumor size (cm) pn- Stage Stage BNG (grade) ERα PR HER2 (FISH) Triple negative T1 46 3 N1a III 2 Pos Neg N T2 58 1 N(i-) I 3 Pos Neg
UTX inhibits EMT-induced breast CSC properties by epigenetic repression of EMT genes in cooperation with LSD1 and HDAC1
 EMBO reports - Peer Review Process File - EMBOR-2015-40244 Manuscript EMBOR-2015-40244 UTX inhibits EMT-induced breast CSC properties by epigenetic repression of EMT genes in cooperation with LSD1 and
Supplementary Figure 1.TRIM33 binds β-catenin in the nucleus. a & b, Co-IP of endogenous TRIM33 with β-catenin in HT-29 cells (a) and HEK 293T cells
 and HEK 293T cells") Supplementary Figure 1.TRIM33 binds β-catenin in the nucleus. a & b, Co-IP of endogenous TRIM33 with β-catenin in HT-29 cells (a) and HEK 293T cells (b). TRIM33 was immunoprecipitated, and the amount of
Supplementary Figure 1.TRIM33 binds β-catenin in the nucleus. a & b, Co-IP of endogenous TRIM33 with β-catenin in HT-29 cells (a) and HEK 293T cells (b). TRIM33 was immunoprecipitated, and the amount of
Supplementary Figure 1. The CagA-dependent wound healing or transwell migration of gastric cancer cell. AGS cells transfected with vector control or
 Supplementary Figure 1. The CagA-dependent wound healing or transwell migration of gastric cancer cell. AGS cells transfected with vector control or 3xflag-CagA expression vector were wounded using a pipette
Supplementary Information and Figure legends
 Supplementary Information and Figure legends Table S1. Primers for quantitative RT-PCR Target Sequence (5 -> 3 ) Target Sequence (5 -> 3 ) DAB2IP F:TGGACGATGTGCTCTATGCC R:GGATGGTGATGGTTTGGTAG Snail F:CCTCCCTGTCAGATGAGGAC
Supplemental Table S1
 Supplemental Table S. Tumorigenicity and metastatic potential of 44SQ cell subpopulations a Tumorigenicity b Average tumor volume (mm ) c Lung metastasis d CD high /4 8. 8/ CD low /4 6./ a Mice were injected
(a) Significant biological processes (upper panel) and disease biomarkers (lower panel)
 Significant biological processes (upper panel) and disease biomarkers (lower panel)") Supplementary Figure 1. Functional enrichment analyses of secretomic proteins. (a) Significant biological processes (upper panel) and disease biomarkers (lower panel) 2 involved by hrab37-mediated secretory
Supplementary Figure 1. Functional enrichment analyses of secretomic proteins. (a) Significant biological processes (upper panel) and disease biomarkers (lower panel) 2 involved by hrab37-mediated secretory
Type of file: PDF Size of file: 0 KB Title of file for HTML: Supplementary Information Description: Supplementary Figures
 Type of file: PDF Size of file: 0 KB Title of file for HTML: Supplementary Information Description: Supplementary Figures Supplementary Figure 1 mir-128-3p is highly expressed in chemoresistant, metastatic
Fang et al. NMuMG. PyVmT unstained Anti-CCR2-PE MDA-MB MCF MCF10A
 A NMuMG PyVmT 16.5+.5 47.+7.2 Fang et al. unstained Anti-CCR2-PE 4T1 Control 37.6+6.3 56.1+.65 MCF1A 16.1+3. MCF-7 3.1+5.4 MDA-M-231 42.1+5.5 unstained Secondary antibody only Anti-CCR2 SUPPLEMENTAL FIGURE
Supplementary Figure 1. The mir-182 binding site of SMAD7 3 UTR and the. mutated sequence.
 Supplementary Figure 1. The mir-182 binding site of SMAD7 3 UTR and the mutated sequence. 1 Supplementary Figure 2. Expression of mir-182 and SMAD7 in various cell lines. (A) Basal levels of mir-182 expression
Supplementary Figures
 Supplementary Figures Supplementary Figure 1. Confirmation of Dnmt1 conditional knockout out mice. a, Representative images of sorted stem (Lin - CD49f high CD24 + ), luminal (Lin - CD49f low CD24 + )
SREBP-2 promotes stem cell-like properties and metastasis by transcriptional activation of c-myc in prostate cancer
 SREBP-2 promotes stem cell-like properties and metastasis by transcriptional activation of c-myc in prostate cancer Supplementary Material Supplementary Methods Supplementary References Supplementary Figure
Supplemental Figure 1. Western blot analysis indicated that MIF was detected in the fractions of
 Supplemental Figure Legends Supplemental Figure 1. Western blot analysis indicated that was detected in the fractions of plasma membrane and cytosol but not in nuclear fraction isolated from Pkd1 null
Supplementary Figure 1. Basal level EGFR across a panel of ESCC lines. Immunoblots demonstrate the expression of phosphorylated and total EGFR as
 Supplementary Figure 1. Basal level EGFR across a panel of ESCC lines. Immunoblots demonstrate the expression of phosphorylated and total EGFR as well as their downstream effectors across a panel of ESCC
HIF-inducible mir-191 promotes migration in breast cancer through complex regulation of TGFβ-signaling in hypoxic microenvironment.
 HIF-inducible mir-9 promotes migration in breast cancer through complex regulation of TGFβ-signaling in hypoxic microenvironment. Neha Nagpal, Hafiz M Ahmad, Shibu Chameettachal3, Durai Sundar, Sourabh
Does EMT Contribute to Radiation Resistance in Human Breast Cancer?
 AD Award Number: W81XWH-10-1-0592 TITLE: Does EMT Contribute to Radiation Resistance in Human Breast Cancer? PRINCIPAL INVESTIGATOR: Anupama Munshi, Ph.D CONTRACTING ORGANIZATION: University of Oklahoma
mir-509-5p and mir-1243 increase the sensitivity to gemcitabine by inhibiting
 mir-509-5p and mir-1243 increase the sensitivity to gemcitabine by inhibiting epithelial-mesenchymal transition in pancreatic cancer Hidekazu Hiramoto, M.D. 1,3, Tomoki Muramatsu, Ph.D. 1, Daisuke Ichikawa,
Supplementary Figure 1. A. Bar graph representing the expression levels of the 19 indicated genes in the microarrays analyses comparing human lung
 Supplementary Figure 1. A. Bar graph representing the expression levels of the 19 indicated genes in the microarrays analyses comparing human lung immortalized broncho-epithelial cells (AALE cells) expressing
(A) Dose response curves of HMLE_shGFP (blue circle), HMLE_shEcad (red square),
 Dose response curves of HMLE_shGFP (blue circle), HMLE_shEcad (red square),") Supplementary Figures and Tables Figure S1. Validation of EMT-selective small molecules (A) Dose response curves of HMLE_shGFP (blue circle), HMLE_shEcad (red square), and HMLE_Twist (black diamond) cells
Supplementary Figures and Tables Figure S1. Validation of EMT-selective small molecules (A) Dose response curves of HMLE_shGFP (blue circle), HMLE_shEcad (red square), and HMLE_Twist (black diamond) cells
Supplementary Figure (OH) 22 nanoparticles did not affect cell viability and apoposis. MDA-MB-231, MCF-7, MCF-10A and BT549 cells were
 22 nanoparticles did not affect cell viability and apoposis. MDA-MB-231, MCF-7, MCF-10A and BT549 cells were") Supplementary Figure 1. Gd@C 82 (OH) 22 nanoparticles did not affect cell viability and apoposis. MDA-MB-231, MCF-7, MCF-10A and BT549 cells were treated with PBS, Gd@C 82 (OH) 22, C 60 (OH) 22 or GdCl
Supplementary Figure 1. Gd@C 82 (OH) 22 nanoparticles did not affect cell viability and apoposis. MDA-MB-231, MCF-7, MCF-10A and BT549 cells were treated with PBS, Gd@C 82 (OH) 22, C 60 (OH) 22 or GdCl
supplementary information
 DOI: 10.1038/ncb1875 Figure S1 (a) The 79 surgical specimens from NSCLC patients were analysed by immunohistochemistry with an anti-p53 antibody and control serum (data not shown). The normal bronchi served
Supplementary Figures
 Supplementary Figures Supplementary Figure 1 Correlation between LKB1 and YAP expression in human lung cancer samples. (a) Representative photos showing LKB1 and YAP immunohistochemical staining in human
m 6 A mrna methylation regulates AKT activity to promote the proliferation and tumorigenicity of endometrial cancer
 SUPPLEMENTARY INFORMATION Articles https://doi.org/10.1038/s41556-018-0174-4 In the format provided by the authors and unedited. m 6 A mrna methylation regulates AKT activity to promote the proliferation
Supplementary Figure 1. Characterization of NMuMG-ErbB2 and NIC breast cancer cells expressing shrnas targeting LPP. NMuMG-ErbB2 cells (a) and NIC
 and NIC") Supplementary Figure 1. Characterization of NMuMG-ErbB2 and NIC breast cancer cells expressing shrnas targeting LPP. NMuMG-ErbB2 cells (a) and NIC cells (b) were engineered to stably express either a LucA-shRNA
Supplementary Figure 1. Characterization of NMuMG-ErbB2 and NIC breast cancer cells expressing shrnas targeting LPP. NMuMG-ErbB2 cells (a) and NIC cells (b) were engineered to stably express either a LucA-shRNA
T H E J O U R N A L O F C E L L B I O L O G Y
 Supplemental material Díaz et al., http://www.jcb.org/cgi/content/full/jcb.201209151/dc1 T H E J O U R N A L O F C E L L B I O L O G Y Figure S1. Hypoxia induces invadopodia formation in different epithelial
SUPPLEMENTARY INFORMATION
 doi:.38/nature8975 SUPPLEMENTAL TEXT Unique association of HOTAIR with patient outcome To determine whether the expression of other HOX lincrnas in addition to HOTAIR can predict patient outcome, we measured
Supplementary Figure S1 Expression of mir-181b in EOC (A) Kaplan-Meier
 Kaplan-Meier") Supplementary Figure S1 Expression of mir-181b in EOC (A) Kaplan-Meier curves for progression-free survival (PFS) and overall survival (OS) in a cohort of patients (N=52) with stage III primary ovarian
Supplementary Figure S1 Expression of mir-181b in EOC (A) Kaplan-Meier curves for progression-free survival (PFS) and overall survival (OS) in a cohort of patients (N=52) with stage III primary ovarian
Supplementary Figure 1. Characterization of ALDH-positive cell population in MCF-7 cells. (a) Expression level of stem cell markers in MCF-7 cells or
 Expression level of stem cell markers in MCF-7 cells or") Supplementary Figure 1. Characterization of ALDH-positive cell population in MCF-7 cells. (a) Expression level of stem cell markers in MCF-7 cells or ALDH-positive cell population by qpcr. Data represent
Supplementary Figure 1. Characterization of ALDH-positive cell population in MCF-7 cells. (a) Expression level of stem cell markers in MCF-7 cells or ALDH-positive cell population by qpcr. Data represent
Supplementary Figure S1: Defective heterochromatin repair in HGPS progeroid cells
 Supplementary Figure S1: Defective heterochromatin repair in HGPS progeroid cells Immunofluorescence staining of H3K9me3 and 53BP1 in PH and HGADFN003 (HG003) cells at 24 h after γ-irradiation. Scale bar,
Inhibition of TGFβ enhances chemotherapy action against triple negative breast cancer by abrogation of
 SUPPLEMENTAL DATA Inhibition of TGFβ enhances chemotherapy action against triple negative breast cancer by abrogation of cancer stem cells and interleukin-8 Neil E. Bhola 1, Justin M. Balko 1, Teresa C.
Supplementary Figure 1. Expression of CUGBP1 in non-parenchymal liver cells treated with TGF-β
 Supplementary Figures Supplementary Figure 1. Expression of CUGBP1 in non-parenchymal liver cells treated with TGF-β and LPS. Non-parenchymal liver cells were isolated and treated with or without TGF-β
Supplementary Figure S1 Supplementary Figure S2
 Supplementary Figure S A) The blots shown in Figure B were qualified by using Gel-Pro analyzer software (Rockville, MD, USA). The ratio of LC3II/LC3I to actin was then calculated. The data are represented
Supplementary Materials for
 www.sciencesignaling.org/cgi/content/full/8/364/ra18/dc1 Supplementary Materials for The tyrosine phosphatase (Pez) inhibits metastasis by altering protein trafficking Leila Belle, Naveid Ali, Ana Lonic,
SUPPLEMENTARY INFORMATION
 DOI: 1.138/ncb3355 a S1A8 + cells/ total.1.8.6.4.2 b S1A8/?-Actin c % T-cell proliferation 3 25 2 15 1 5 T cells Supplementary Figure 1 Inter-tumoral heterogeneity of MDSC accumulation in mammary tumor
Supplementary Figure 1
 A B D Relative TAp73 mrna p73 Supplementary Figure 1 25 2 15 1 5 p63 _-tub. MDA-468 HCC1143 HCC38 SUM149 MDA-468 HCC1143 HCC38 SUM149 HCC-1937 MDA-MB-468 ΔNp63_ TAp73_ TAp73β E C Relative ΔNp63 mrna TAp73
Table S1. Primer sequences used for qrt-pcr. CACCATTGGCAATGAGCGGTTC AGGTCTTTGCGGATGTCCACGT ACTB AAGTCCATGTGCTGGCAGCACT ATCACCACTCCGAAGTCCGTCT LCOR
 Table S1. Primer sequences used for qrt-pcr. ACTB LCOR KLF6 CTBP1 CDKN1A CDH1 ATF3 PLAU MMP9 TFPI2 CACCATTGGCAATGAGCGGTTC AGGTCTTTGCGGATGTCCACGT AAGTCCATGTGCTGGCAGCACT ATCACCACTCCGAAGTCCGTCT CGGCTGCAGGAAAGTTTACA
(a) Schematic diagram of the FS mutation of UVRAG in exon 8 containing the highly instable
 Schematic diagram of the FS mutation of UVRAG in exon 8 containing the highly instable") Supplementary Figure 1. Frameshift (FS) mutation in UVRAG. (a) Schematic diagram of the FS mutation of UVRAG in exon 8 containing the highly instable A 10 DNA repeat, generating a premature stop codon
Supplementary Figure 1. Frameshift (FS) mutation in UVRAG. (a) Schematic diagram of the FS mutation of UVRAG in exon 8 containing the highly instable A 10 DNA repeat, generating a premature stop codon
Supplementary Figure 1
 Supplementary Figure 1 14 12 SEM4C PLXN2 8 SEM4C C 3 Cancer Cell Non Cancer Cell Expression 1 8 6 6 4 log2 ratio Expression 2 1 4 2 2 p value.1 D Supplementary Figure 1. Expression of Sema4C and Plexin2
PKCζ Promotes Breast Cancer Invasion by Regulating Expression of E-cadherin and Zonula Occludens-1 (ZO-1) via NFκB-p65
 via NFκB-p65") SUPPLEMENTARY INFORMATION TITLE: PKCζ Promotes Breast Cancer Invasion by Regulating Expression of E-cadherin and Zonula Occludens-1 (ZO-1) via NFκB-p65 RUNNING TITLE: PKCζ-NFκB Signaling in Breast Cancer
SUPPLEMENTARY INFORMATION TITLE: PKCζ Promotes Breast Cancer Invasion by Regulating Expression of E-cadherin and Zonula Occludens-1 (ZO-1) via NFκB-p65 RUNNING TITLE: PKCζ-NFκB Signaling in Breast Cancer
Supplementary Figure 1. Spatial distribution of LRP5 and β-catenin in intact cardiomyocytes. (a) and (b) Immunofluorescence staining of endogenous
 and (b) Immunofluorescence staining of endogenous") Supplementary Figure 1. Spatial distribution of LRP5 and β-catenin in intact cardiomyocytes. (a) and (b) Immunofluorescence staining of endogenous LRP5 in intact adult mouse ventricular myocytes (AMVMs)
Supplementary Figure 1. Spatial distribution of LRP5 and β-catenin in intact cardiomyocytes. (a) and (b) Immunofluorescence staining of endogenous LRP5 in intact adult mouse ventricular myocytes (AMVMs)
An epithelial-to-mesenchymal transition-inducing potential of. granulocyte macrophage colony-stimulating factor in colon. cancer
 An epithelial-to-mesenchymal transition-inducing potential of granulocyte macrophage colony-stimulating factor in colon cancer Yaqiong Chen, Zhi Zhao, Yu Chen, Zhonglin Lv, Xin Ding, Renxi Wang, He Xiao,
Yanrong Su *, Nathan R. Hopfinger, Theresa D. Nguyen, Thomas J. Pogash, Julia Santucci-Pereira and Jose Russo *
 Su et al. Journal of Experimental & Clinical Cancer Research (2018) 37:314 https://doi.org/10.1186/s13046-018-0988-8 RESEARCH Open Access Epigenetic reprogramming of epithelial mesenchymal transition in
ANGPTL2 increases bone metastasis of breast cancer cells through. Tetsuro Masuda, Motoyoshi Endo, Yutaka Yamamoto, Haruki Odagiri, Tsuyoshi
 Masuda et al. Supplementary information for ANGPTL2 increases bone metastasis of breast cancer cells through enhancing CXCR4 signaling Tetsuro Masuda, Motoyoshi Endo, Yutaka Yamamoto, Haruki Odagiri, Tsuyoshi
Breeding scheme, transgenes, histological analysis and site distribution of SB-mutagenized osteosarcoma.
 Supplementary Figure 1 Breeding scheme, transgenes, histological analysis and site distribution of SB-mutagenized osteosarcoma. (a) Breeding scheme. R26-LSL-SB11 homozygous mice were bred to Trp53 LSL-R270H/+
SUPPLEMENTAL FIGURE LEGENDS
 SUPPLEMENTAL FIGURE LEGENDS Supplemental Figure S1: Endogenous interaction between RNF2 and H2AX: Whole cell extracts from 293T were subjected to immunoprecipitation with anti-rnf2 or anti-γ-h2ax antibodies
Supplementary Figure 1: STAT3 suppresses Kras-induced lung tumorigenesis
 Supplementary Figure 1: STAT3 suppresses Kras-induced lung tumorigenesis (a) Immunohistochemical (IHC) analysis of tyrosine 705 phosphorylation status of STAT3 (P- STAT3) in tumors and stroma (all-time
Figure S1: Effects on haptotaxis are independent of effects on cell velocity A)
") Supplemental Figures Figure S1: Effects on haptotaxis are independent of effects on cell velocity A) Velocity of MV D7 fibroblasts expressing different GFP-tagged Ena/VASP family proteins in the haptotaxis
Supplemental Figures Figure S1: Effects on haptotaxis are independent of effects on cell velocity A) Velocity of MV D7 fibroblasts expressing different GFP-tagged Ena/VASP family proteins in the haptotaxis
Dynamic cohesin-mediated chromatin architecture controls epithelial mesenchymal plasticity in cancer
 Article Dynamic cohesin-mediated chromatin architecture controls epithelial mesenchymal plasticity in cancer Jiyeon Yun,, Sang-Hyun Song, Hwang-Phill Kim, Sae-Won Han,, Eugene C Yi & Tae-You Kim,,, Abstract
SUPPLEMENTARY FIGURES
 SUPPLEMENTARY FIGURES Figure S1. Clinical significance of ZNF322A overexpression in Caucasian lung cancer patients. (A) Representative immunohistochemistry images of ZNF322A protein expression in tissue
EPIGENETIC RE-EXPRESSION OF HIF-2α SUPPRESSES SOFT TISSUE SARCOMA GROWTH
 EPIGENETIC RE-EXPRESSION OF HIF-2α SUPPRESSES SOFT TISSUE SARCOMA GROWTH Supplementary Figure 1. Supplementary Figure 1. Characterization of KP and KPH2 autochthonous UPS tumors. a) Genotyping of KPH2
Supplementary Information Titles Journal: Nature Medicine
 Supplementary Information Titles Journal: Nature Medicine Article Title: Corresponding Author: Supplementary Item & Number Supplementary Fig.1 Fig.2 Fig.3 Fig.4 Fig.5 Fig.6 Fig.7 Fig.8 Fig.9 Fig. Fig.11
ZEB1 drives epithelial-to-mesenchymal transition in lung cancer
 The Journal of Clinical Investigation ZEB1 drives epithelial-to-mesenchymal transition in lung cancer Jill E. Larsen, 1,2,3 Vaishnavi Nathan, 2 Jihan K. Osborne, 4 Rebecca K. Farrow, 2 Dhruba Deb, 1 James
Supplementary Materials for
 www.sciencesignaling.org/cgi/content/full/7/318/ra29/dc1 Supplementary Materials for Antagonism of EGFR and HER3 Enhances the Response to Inhibitors of the PI3K-Akt Pathway in Triple-Negative Breast Cancer
Bmi-1 regulates stem cell-like properties of gastric cancer cells via modulating mirnas
 Wang et al. Journal of Hematology & Oncology (2016) 9:90 DOI 10.1186/s13045-016-0323-9 RESEARCH Bmi-1 regulates stem cell-like properties of gastric cancer cells via modulating mirnas Open Access Xiaofeng
Supplementary Figure 1. Deletion of Smad3 prevents B16F10 melanoma invasion and metastasis in a mouse s.c. tumor model.
 A B16F1 s.c. Lung LN Distant lymph nodes Colon B B16F1 s.c. Supplementary Figure 1. Deletion of Smad3 prevents B16F1 melanoma invasion and metastasis in a mouse s.c. tumor model. Highly invasive growth
SUPPLEMENTARY INFORMATION
 doi:10.1038/nature12652 Supplementary Figure 1. PRDM16 interacts with endogenous EHMT1 in brown adipocytes. Immunoprecipitation of PRDM16 complex by flag antibody (M2) followed by Western blot analysis
RAW264.7 cells stably expressing control shrna (Con) or GSK3b-specific shrna (sh-
 or GSK3b-specific shrna (sh-") 1 a b Supplementary Figure 1. Effects of GSK3b knockdown on poly I:C-induced cytokine production. RAW264.7 cells stably expressing control shrna (Con) or GSK3b-specific shrna (sh- GSK3b) were stimulated
1 a b Supplementary Figure 1. Effects of GSK3b knockdown on poly I:C-induced cytokine production. RAW264.7 cells stably expressing control shrna (Con) or GSK3b-specific shrna (sh- GSK3b) were stimulated
Supplemental Data. TGF-β-mediated mir-181a expression promotes breast cancer metastasis by targeting Bim.
 Supplemental Data TGF-β-mediated mir-181a expression promotes breast cancer metastasis by targeting Bim. Molly A. Taylor 1, Khalid Sossey-Alaoui 2, Cheryl L. Thompson 3, David Danielpour 4, and William
CYLD Negatively Regulates Transforming Growth Factor-β Signaling via Deubiquitinating Akt
 Supplementary Information CYLD Negatively Regulates Transforming Growth Factor-β Signaling via Deubiquitinating Akt Jae Hyang Lim, Hirofumi Jono, Kensei Komatsu, Chang-Hoon Woo, Jiyun Lee, Masanori Miyata,
Supplementary Information
 Supplementary Information Supplementary Figure 1. Effect of mir mimics and anti-mirs on DTPs a, Representative fluorescence microscopy images of GFP vector control or mir mimicexpressing parental and DTP
Supplementary Figure 1 Induction of cellular senescence and isolation of exosome. a to c, Pre-senescent primary normal human diploid fibroblasts
 Supplementary Figure 1 Induction of cellular senescence and isolation of exosome. a to c, Pre-senescent primary normal human diploid fibroblasts (TIG-3 cells) were rendered senescent by either serial passage
Supplementary Information
 Supplementary Information mediates STAT3 activation at retromer-positive structures to promote colitis and colitis-associated carcinogenesis Zhang et al. a b d e g h Rel. Luc. Act. Rel. mrna Rel. mrna
SALL1 functions as a tumor suppressor in breast cancer by regulating cancer cell senescence and metastasis through the NuRD complex
 Ma et al. Molecular Cancer (2018) 17:78 https://doi.org/10.1186/s12943-018-0824-y RESEARCH SALL1 functions as a tumor suppressor in breast cancer by regulating cancer cell senescence and metastasis through
SUPPLEMENTARY FIGURES
 SUPPLEMENTARY FIGURES Supplementary Figure 1. (A) Left, western blot analysis of ISGylated proteins in Jurkat T cells treated with 1000U ml -1 IFN for 16h (IFN) or left untreated (CONT); right, western
Supplemental Information
 Supplemental Information Tobacco-specific Carcinogen Induces DNA Methyltransferases 1 Accumulation through AKT/GSK3β/βTrCP/hnRNP-U in Mice and Lung Cancer patients Ruo-Kai Lin, 1 Yi-Shuan Hsieh, 2 Pinpin
TRAF6 ubiquitinates TGFβ type I receptor to promote its cleavage and nuclear translocation in cancer
 Supplementary Information TRAF6 ubiquitinates TGFβ type I receptor to promote its cleavage and nuclear translocation in cancer Yabing Mu, Reshma Sundar, Noopur Thakur, Maria Ekman, Shyam Kumar Gudey, Mariya
Supplementary Figure S1. Venn diagram analysis of mrna microarray data and mirna target analysis. (a) Western blot analysis of T lymphoblasts (CLS)
 Western blot analysis of T lymphoblasts (CLS)") Supplementary Figure S1. Venn diagram analysis of mrna microarray data and mirna target analysis. (a) Western blot analysis of T lymphoblasts (CLS) and their exosomes (EXO) in resting (REST) and activated
Supplementary Figure S1. Venn diagram analysis of mrna microarray data and mirna target analysis. (a) Western blot analysis of T lymphoblasts (CLS) and their exosomes (EXO) in resting (REST) and activated
Figure S1. Reduction in glomerular mir-146a levels correlate with progression to higher albuminuria in diabetic patients.
 Supplementary Materials Supplementary Figures Figure S1. Reduction in glomerular mir-146a levels correlate with progression to higher albuminuria in diabetic patients. Figure S2. Expression level of podocyte
Supplementary Materials for
 www.sciencesignaling.org/cgi/content/full/7/310/ra11/dc1 Supplementary Materials for STAT3 Induction of mir-146b Forms a Feedback Loop to Inhibit the NF-κB to IL-6 Signaling Axis and STAT3-Driven Cancer
Supplemental Figure 1
 Supplemental Figure 1 1a 1c PD-1 MFI fold change 6 5 4 3 2 1 IL-1α IL-2 IL-4 IL-6 IL-1 IL-12 IL-13 IL-15 IL-17 IL-18 IL-21 IL-23 IFN-α Mut Human PD-1 promoter SBE-D 5 -GTCTG- -1.2kb SBE-P -CAGAC- -1.kb
Title: MYBBP1A suppresses breast cancer tumorigenesis by enhancing the p53 dependent anoikis
 Author's response to reviews Title: MYBBP1A suppresses breast cancer tumorigenesis by enhancing the p53 dependent anoikis Authors: Kensuke Akaogi (kensuke.akaogi@gmail.com) Wakana Ono (wakana315@gmail.com)
SUPPLEMENTARY FIGURE LEGENDS. atypical adenomatous hyperplasias (AAH); Grade II: adenomas; Grade III: adenocarcinomas;
; Grade II: adenomas; Grade III: adenocarcinomas;") SUPPLEMENTARY FIGURE LEGENDS Supplementary Figure S1: Tumor grades in Ras G12D ; p53 / lung tumors. Representative histology (H&E) of K-Ras G12D ; p53 / lung tumors 13 weeks after tumor initiation. Grade
SUPPLEMENTARY FIGURE LEGENDS Supplementary Figure S1: Tumor grades in Ras G12D ; p53 / lung tumors. Representative histology (H&E) of K-Ras G12D ; p53 / lung tumors 13 weeks after tumor initiation. Grade
(A) SW480, DLD1, RKO and HCT116 cells were treated with DMSO or XAV939 (5 µm)
 SW480, DLD1, RKO and HCT116 cells were treated with DMSO or XAV939 (5 µm)") Supplementary Figure Legends Figure S1. Tankyrase inhibition suppresses cell proliferation in an axin/β-catenin independent manner. (A) SW480, DLD1, RKO and HCT116 cells were treated with DMSO or XAV939
Supplementary Figure Legends Figure S1. Tankyrase inhibition suppresses cell proliferation in an axin/β-catenin independent manner. (A) SW480, DLD1, RKO and HCT116 cells were treated with DMSO or XAV939
TEB. Id4 p63 DAPI Merge. Id4 CK8 DAPI Merge
 a Duct TEB b Id4 p63 DAPI Merge Id4 CK8 DAPI Merge c d e Supplementary Figure 1. Identification of Id4-positive MECs and characterization of the Comma-D model. (a) IHC analysis of ID4 expression in the
Expanded View Figures
 MO reports PR3 dephosphorylates TZ Xian-o Lv et al xpanded View igures igure V1. PR3 dephosphorylates and inactivates YP/TZ., Overexpression of tight junction proteins Pals1 () or LIN7 () has no effect
Supplementary Figures
 Supplementary Figures Supplementary Fig. 1. Galectin-3 is present within tumors. (A) mrna expression levels of Lgals3 (galectin-3) and Lgals8 (galectin-8) in the four classes of cell lines as determined
Predictive PP1Ca binding region in BIG3 : 1,228 1,232aa (-KAVSF-) HEK293T cells *** *** *** KPL-3C cells - E E2 treatment time (h)
 HEK293T cells *** *** *** KPL-3C cells - E E2 treatment time (h)") Relative expression ERE-luciferase activity activity (pmole/min) activity (pmole/min) activity (pmole/min) activity (pmole/min) MCF-7 KPL-3C ZR--1 BT-474 T47D HCC15 KPL-1 HBC4 activity (pmole/min) a d
Relative expression ERE-luciferase activity activity (pmole/min) activity (pmole/min) activity (pmole/min) activity (pmole/min) MCF-7 KPL-3C ZR--1 BT-474 T47D HCC15 KPL-1 HBC4 activity (pmole/min) a d
MEL-18 loss mediates estrogen receptor α downregulation and hormone independence
 MEL-18 loss mediates estrogen receptor α downregulation and hormone independence Jeong-Yeon Lee, 1 Hee-Young Won, 2 Ji-Hye Park, 1 Hye-Yeon Kim, 2 Hee-Joo Choi, 2 Dong-Hui Shin, 2 Ju-Hee Kang, 3 Jong-Kyu
Supplementary Figure 1. PD-L1 is glycosylated in cancer cells. (a) Western blot analysis of PD-L1 in breast cancer cells. (b) Western blot analysis
 Western blot analysis of PD-L1 in breast cancer cells. (b) Western blot analysis") Supplementary Figure 1. PD-L1 is glycosylated in cancer cells. (a) Western blot analysis of PD-L1 in breast cancer cells. (b) Western blot analysis of PD-L1 in ovarian cancer cells. (c) Western blot analysis
Supplementary Figure 1. PD-L1 is glycosylated in cancer cells. (a) Western blot analysis of PD-L1 in breast cancer cells. (b) Western blot analysis of PD-L1 in ovarian cancer cells. (c) Western blot analysis
Tbk1-TKO! DN cells (%)! 15! 10!
! 15! 10!") a! T Cells! TKO! B Cells! TKO! b! CD4! 8.9 85.2 3.4 2.88 CD8! Tbk1-TKO! 1.1 84.8 2.51 2.54 c! DN cells (%)! 4 3 2 1 DP cells (%)! 9 8 7 6 CD4 + SP cells (%)! 5 4 3 2 1 5 TKO! TKO! TKO! TKO! 15 1 5 CD8
a! T Cells! TKO! B Cells! TKO! b! CD4! 8.9 85.2 3.4 2.88 CD8! Tbk1-TKO! 1.1 84.8 2.51 2.54 c! DN cells (%)! 4 3 2 1 DP cells (%)! 9 8 7 6 CD4 + SP cells (%)! 5 4 3 2 1 5 TKO! TKO! TKO! TKO! 15 1 5 CD8
SUPPLEMENTARY INFORMATION
 SUPPLEMENTARY INFORMATION doi:10.1038/nature11429 S1a 6 7 8 9 Nlrc4 allele S1b Nlrc4 +/+ Nlrc4 +/F Nlrc4 F/F 9 Targeting construct 422 bp 273 bp FRT-neo-gb-PGK-FRT 3x.STOP S1c Nlrc4 +/+ Nlrc4 F/F casp1
Supplemental Table 1 Molecular Profile of the SCLC Cell Line Panel
 Supplemental Table 1 Molecular Profile of the SCLC Cell Line Panel p53 RB Myc Cell Line Mutation A Mutation A Amplification B COR-L103 C p.y234c p.d584e L-Myc NCI-H526 p.s33_splice None N-Myc NCI-H1048
2.5. AMPK activity
 Supplement Fig. A 3 B phos-ampk 2.5 * Control AICAR AMPK AMPK activity (Absorbance at 45 nm) 2.5.5 Control AICAR Supplement Fig. Effects of AICAR on AMPK activation in macrophages. J774. macrophages were
Supplemental Figure 1
 1 Supplemental Figure 1 Effects of DATE shortening on HGF promoter activity. The HGF promoter region (-1037 to +56) containing wild-type (30As) or truncated DATE (26As, 27As, 28A, 29As) from breast cancer
Figure S1, related to Figure 1. Escaper p38a-expressing cancer cells repopulate the tumors (A) Scheme of the mt/mg reporter that expresses a
 Scheme of the mt/mg reporter that expresses a") Cancer Cell, Volume 33 Supplemental Information Targeting p38a Increases DNA Damage, Chromosome Instability, and the Anti-tumoral Response to Taxanes in Breast Cancer Cells Begoña Cánovas, Ana Igea, Alessandro
Cancer Cell, Volume 33 Supplemental Information Targeting p38a Increases DNA Damage, Chromosome Instability, and the Anti-tumoral Response to Taxanes in Breast Cancer Cells Begoña Cánovas, Ana Igea, Alessandro
c Ischemia (30 min) Reperfusion (8 w) Supplementary Figure bp 300 bp Ischemia (30 min) Reperfusion (4 h) Dox 20 mg/kg i.p.
 Reperfusion (8 w) Supplementary Figure bp 300 bp Ischemia (30 min) Reperfusion (4 h) Dox 20 mg/kg i.p.") a Marker Ripk3 +/ 5 bp 3 bp b Ischemia (3 min) Reperfusion (4 h) d 2 mg/kg i.p. 1 w 5 w Sacrifice for IF size A subset for echocardiography and morphological analysis c Ischemia (3 min) Reperfusion (8
a Marker Ripk3 +/ 5 bp 3 bp b Ischemia (3 min) Reperfusion (4 h) d 2 mg/kg i.p. 1 w 5 w Sacrifice for IF size A subset for echocardiography and morphological analysis c Ischemia (3 min) Reperfusion (8
Supplementary Figure 1. PAQR3 knockdown inhibits SREBP-2 processing in CHO-7 cells CHO-7 cells were transfected with control sirna or a sirna
 Supplementary Figure 1. PAQR3 knockdown inhibits SREBP-2 processing in CHO-7 cells CHO-7 cells were transfected with control sirna or a sirna targeted for hamster PAQR3. At 24 h after the transfection,
Supplementary Information Supplementary Fig. 1. Elevated Usp9x in melanoma and NRAS mutant melanoma cells are dependent on NRAS for 3D growth.
 Supplementary Information Supplementary Fig. 1. Elevated Usp9x in melanoma and NRAS mutant melanoma cells are dependent on NRAS for 3D growth. a. Immunoblot for Usp9x protein in NRAS mutant melanoma cells
Supplementary Fig. 1. GPRC5A post-transcriptionally down-regulates EGFR expression. (a) Plot of the changes in steady state mrna levels versus
 Plot of the changes in steady state mrna levels versus") Supplementary Fig. 1. GPRC5A post-transcriptionally down-regulates EGFR expression. (a) Plot of the changes in steady state mrna levels versus changes in corresponding proteins between wild type and Gprc5a-/-
Supplementary Fig. 1. GPRC5A post-transcriptionally down-regulates EGFR expression. (a) Plot of the changes in steady state mrna levels versus changes in corresponding proteins between wild type and Gprc5a-/-
Supplementary Figures for
 Supplementary Figures for SOX2 suppresses CDKN1A to sustain growth of lung squamous cell carcinoma Takuya Fukazawa 1, Minzhe Guo 4, 5, Naomasa Ishida 1, Tomoki Yamatsuji 1, Munenori Takaoka 1, Etsuko Yokota
Supplementary Figure 1 IMQ-Induced Mouse Model of Psoriasis. IMQ cream was
 Supplementary Figure 1 IMQ-Induced Mouse Model of Psoriasis. IMQ cream was painted on the shaved back skin of CBL/J and BALB/c mice for consecutive days. (a, b) Phenotypic presentation of mouse back skin
Supplementary Figure 1. Efficiency of Mll4 deletion and its effect on T cell populations in the periphery. Nature Immunology: doi: /ni.
 Supplementary Figure 1 Efficiency of Mll4 deletion and its effect on T cell populations in the periphery. Expression of Mll4 floxed alleles (16-19) in naive CD4 + T cells isolated from lymph nodes and
Pharmacologic inhibition of histone demethylation as a therapy for pediatric brainstem glioma
 Supplementary information for: Pharmacologic inhibition of histone demethylation as a therapy for pediatric brainstem glioma Rintaro Hashizume 1, Noemi Andor 2, Yuichiro Ihara 2, Robin Lerner 2, Haiyun
Supplementary Figure 1: Expression of NFAT proteins in Nfat2-deleted B cells (a+b) Protein expression of NFAT2 (a) and NFAT1 (b) in isolated splenic
 Protein expression of NFAT2 (a) and NFAT1 (b) in isolated splenic") Supplementary Figure 1: Expression of NFAT proteins in Nfat2-deleted B cells (a+b) Protein expression of NFAT2 (a) and NFAT1 (b) in isolated splenic B cells from WT Nfat2 +/+, TCL1 Nfat2 +/+ and TCL1 Nfat2
Supplementary Figure 1: Expression of NFAT proteins in Nfat2-deleted B cells (a+b) Protein expression of NFAT2 (a) and NFAT1 (b) in isolated splenic B cells from WT Nfat2 +/+, TCL1 Nfat2 +/+ and TCL1 Nfat2
Supplementary Information
 Supplementary Information Supplementary Figure 1. EBV-gB 23-431 mainly exists as trimer in HEK 293FT cells. (a) Western blotting analysis for DSS crosslinked FLAG-gB 23-431. HEK 293FT cells transfected
Supplementary Data Table of Contents:
 Supplementary Data Table of Contents: - Supplementary Methods - Supplementary Figures S1(A-B) - Supplementary Figures S2 (A-B) - Supplementary Figures S3 - Supplementary Figures S4(A-B) - Supplementary