Leucine Deprivation Reveals a Targetable Liability
|
|
|
- Drusilla Harper
- 5 years ago
- Views:
Transcription
1 Cancer Cell, 19 Supplemental Information Defective Regulation of Autophagy upon Leucine Deprivation Reveals a Targetable Liability of Human Melanoma Cells In Vitro and In Vivo Joon-Ho Sheen, Roberto Zoncu, Dohoon Kim, and David M. Sabatini INVENTORY OF SUPPLEMENTAL INFORMATION 1) Figure S1, related to Figure 1. 2) Figure S2, related to Figure 3. 3) Figure S3, related to Figure 4. 4) Figure S4, related to Figure 5. 5) Figure S5, related to Figure 7. 1
2 2
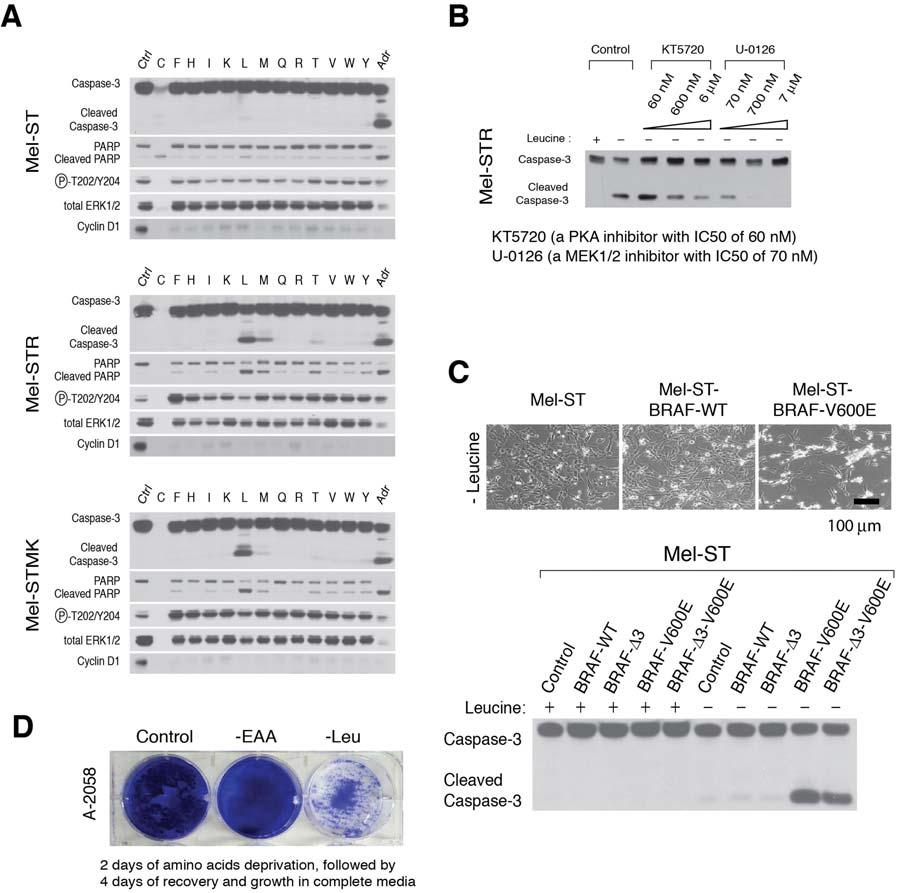
3 Figure S1, related to Figure 1. Hyperactivation of the RAS-MEK pathway renders melanocytes sensitive to leucine deprivation. (A) Immunoblot analyses showing hyperactivated MAPK signaling in Mel-STR and Mel-STMK cells using dual phosphorylation of Thr-202 and Tyr-204 of ERK1/2 as a measure of MAPK pathway activity. Cyclin D1 levels were used to detect cell cycle arrest upon deprivation of any single essential amino acid. Ctrl, control RPMI-1640 media; C-F-H-I-K-L-M-Q-R-T-V- W-Y, deprivation of the indicated single amino acid (single-letter code for amino acid); Adr, adriamycin at 2 g/ml. (B) Inhibition of MAPK signaling with a MEK1/2 inhibitor (U-0126) suppresses apoptosis upon leucine deprivation. Immunoblots show the effects of an increasing amount of a MEK1/2 inhibitor or a PKA inhibitor (KT5720) on the leucine deprivation-induced apoptosis in Mel-STR cells. (C) Representative micrographs show morphological changes in Mel-ST cells expressing oncogenic BRAF-V600E following deprivation of leucine for 2 days. BRAF- 3 is an allele of BRAF that interacts poorly with CRAF. Scale bar = 100 m. Immunoblot analyses show activation and cleavage of caspase-3 upon leucine deprivation in the same cells. (D) Clonogenic survival assay showing effects on viability of A-2058 melanoma cells following deprivation for all essential amino acids or just leucine. After indicated deprivations, cells were re-seeded into complete media and allowed to grow and proliferate for 4 days after which cells were visualized by staining them with crystal violet. 3
4 4
5 Figure S2, related to Figure 3. Development and validation of a dual color reporter for measuring autophagy activity. (A) Schematic diagram showing the concept behind the DsRed-LC3-GFP autophagy reporter. (B) Immunoblot analyses of the levels of fulllength DsRed-LC3-GFP reporter following deprivations of amino acids, isoleucine, or leucine. (C) Flow cytometric data showing changes in levels of fluorescence of GFP upon nutrient deprivation. *, dotted line indicates the median fluorescence intensity of FL1 (Fluorescence 1, green fluorescence from GFP). DsRed-LC3-GFP, the dual-color reporter wild type LC3; DsRed-LC3 -GFP, a control dual-color reporter with mutant LC3 that lacks the TALAV sequence (see Experimental Procedures for additional details). (D, E) Bar graphs indicate the median fluorescence intensities of the DsRed-LC3-GFP and DsRed-LC3 -GFP reporters upon nutrient starvation. (F) The bar graph indicates the autophagy index upon nutrient starvation, which was assessed by measuring relative changes in the median fluorescence intensity of FL1 following normalization with the median fluorescence intensity of FL2 (Fluorescence 2, DsRed fluorescence). 5
6 6
7 Figure S3, related to Figure 4. Quantitative analyses of the mtor-lamp2 colocalization upon deprivations of all amino acids or leucine. (A - C) Representative images of the co-localized mtor and LAMP2 in Mel-STV cells (left) and Mel-STMK cells (right) co-stained for mtor (red) and LAMP2 (green). Scale bar = 10 m. (D) Bar graphs exhibit fractions of the co-localized mtor and LAMP2 following deprivations of all amino acids or just leucine. Each value represents the average of 15 cells from 3 independent fields. 7
8 8
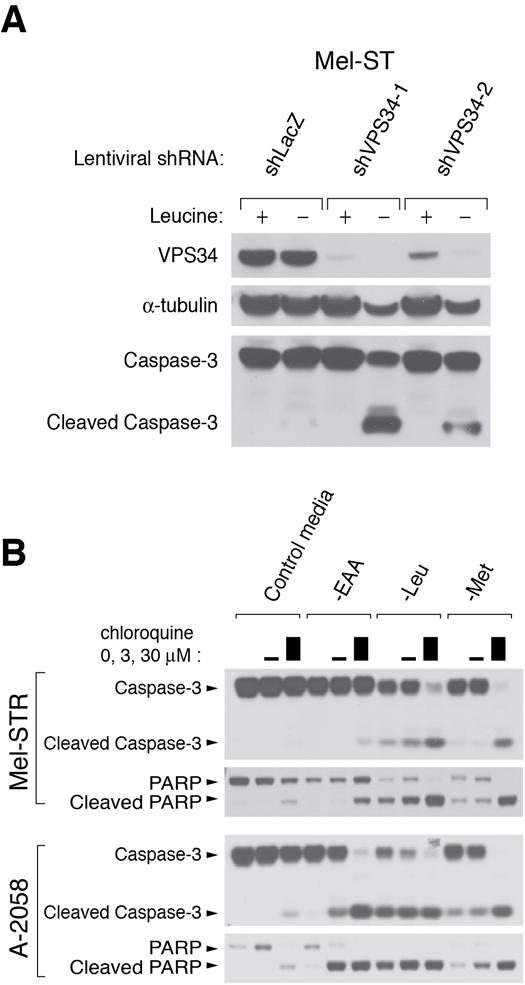
9 Figure S4, related to Figure 5. Autophagy inhibition sensitizes melanoma cells to apoptosis upon deprivation of essential amino acids. (A) Knockdown of VPS34 sensitizes Mel-ST cells to leucine deprivation. Immunoblots show the decreased level of endogenous VPS34 following shrna-mediated RNA interference as well as cleavage of caspase-3. (B) Chloroquine synergizes with leucine deprivation (-Leu) in inducing apoptosis of melanoma cells, as well as renders the melanoma cells sensitive to apoptosis upon deprivation of all essential amino acids (-EAA) or just methionine (-Met). Immunoblots demonstrate cleavage and activation of caspase-3 and cleavage of PARP. 9
10 10
11 Figure S5, related to Figure 7. Effect of chloroquine on autophagy activity in vitro and in vivo, and on the activation of caspase-3 in vivo. (A) Immunoblot analyses showing changes in autophagy related markers (LC3, p62/sqstm1) upon leucine deprivation in the presence or absence of chloroquine. (B) Immunohistochemical analyses for p62 in sections of tumor xenografts from animals fed indicated diets and treated with or without chloroquine (CQ). Images were taken at a 400X magnification and insets show the features of 2-3 cells. Capillaries in the tumor section are denoted with arrows. Scale bar = 30 m. (C) Immunohistochemical analyses for Melan A, a melanocyte specific IHC marker, and D175 caspase site specific cleaved caspase-3 in sections of A-2058 tumor xenografts from animals fed leucine free diet and treated with chloroquine (CQ). Micrographs show the border area between tumors and murine tissues surrounding the xenografts. Scale bar = 100 m. 11
SD-1 SD-1: Cathepsin B levels in TNF treated hch
 SD-1 SD-1: Cathepsin B levels in TNF treated hch. A. RNA and B. protein extracts from TNF treated and untreated human chondrocytes (hch) were analyzed via qpcr (left) and immunoblot analyses (right) for
Supplementary Figure 1. a. b. Relative cell viability. Nature Genetics: doi: /ng SCR shyap1-1 shyap
 Supplementary Figure 1. a. b. p-value for depletion in vehicle (DMSO) 1e-05 1e-03 1e-01 1 0 1000 2000 3000 4000 5000 Genes log2 normalized shrna counts in T0 0 2 4 6 8 sh1 shluc 0 2 4 6 8 log2 normalized
A. Generation and characterization of Ras-expressing autophagycompetent
 Supplemental Material Supplemental Figure Legends Fig. S1 A. Generation and characterization of Ras-expressing autophagycompetent and -deficient cell lines. HA-tagged H-ras V12 was stably expressed in
mtor Inhibition Specifically Sensitizes Colorectal Cancers with KRAS or BRAF Mutations to BCL-2/BCL-
 Supplementary Material for mtor Inhibition Specifically Sensitizes Colorectal Cancers with KRAS or BRAF Mutations to BCL-2/BCL- XL Inhibition by Suppressing MCL-1 Anthony C. Faber 1,2 *, Erin M. Coffee
Supplementary Materials
 Supplementary Materials Figure S1. MTT Cell viability assay. To measure the cytotoxic potential of the oxidative treatment, the MTT [3-(4,5-dimethylthiazol- 2-yl)-2,5-diphenyl tetrazolium bromide] assay
Supplemental Figures:
 Supplemental Figures: Figure 1: Intracellular distribution of VWF by electron microscopy in human endothelial cells. a) Immunogold labeling of LC3 demonstrating an LC3-positive autophagosome (white arrow)
Supplementary Figure 1. BMS enhances human T cell activation in vitro in a
 Supplementary Figure 1. BMS98662 enhances human T cell activation in vitro in a concentration-dependent manner. Jurkat T cells were activated with anti-cd3 and anti-cd28 antibody in the presence of titrated
Supplementary Table 1. Example of cationic drugs that can be considered triethylamine derivatives. concentration that vacuolizes cells in 4 h or less
 Marceau et al., Data Supplement Supplementary Table 1. Example of cationic drugs that can be considered triethylamine derivatives. Cationic drug a logp pk a Threshold concentration that vacuolizes cells
Tumor suppressor Spred2 interaction with LC3 promotes autophagosome maturation and induces autophagy-dependent cell death
 www.impactjournals.com/oncotarget/ Oncotarget, Supplementary Materials 2016 Tumor suppressor Spred2 interaction with LC3 promotes autophagosome maturation and induces autophagy-dependent cell death Supplementary
Early cell death (FGF) B No RunX transcription factor produced Yes No differentiation
 B No RunX transcription factor produced Yes No differentiation") Solution Key - Practice Questions Question 1 a) A recent publication has shown that the fat stem cells (FSC) can act as bone stem cells to repair cavities in the skull, when transplanted into immuno-compromised
Solution Key - Practice Questions Question 1 a) A recent publication has shown that the fat stem cells (FSC) can act as bone stem cells to repair cavities in the skull, when transplanted into immuno-compromised
(a) Schematic diagram of the FS mutation of UVRAG in exon 8 containing the highly instable
 Schematic diagram of the FS mutation of UVRAG in exon 8 containing the highly instable") Supplementary Figure 1. Frameshift (FS) mutation in UVRAG. (a) Schematic diagram of the FS mutation of UVRAG in exon 8 containing the highly instable A 10 DNA repeat, generating a premature stop codon
Supplementary Figure 1. Frameshift (FS) mutation in UVRAG. (a) Schematic diagram of the FS mutation of UVRAG in exon 8 containing the highly instable A 10 DNA repeat, generating a premature stop codon
Supplementary material. Supplementary Figure legends
 Supplementary material Supplementary Figure legends Supplementary Figure 1: Senescence-associated proliferation stop in response to oncogenic N-RAS expression Proliferation of NHEM cells without (ctrl.)
Samali A Figure S1.
 Deegan S, Saveljeva S, Logue SE, Pakos-Zebrucka K, Gupta S, Vandenabeele P, Bertrand MJ,Samali A. (2014) Deficiency in the mitochondrial apoptotic pathway reveals the toxic potential of autophagy under
SUPPLEMENTARY FIGURES AND TABLES
 SUPPLEMENTARY FIGURES AND TABLES Supplementary Figure S1: CaSR expression in neuroblastoma models. A. Proteins were isolated from three neuroblastoma cell lines and from the liver metastasis of a MYCN-non
Supplementary Figure 1.
 Supplementary Figure 1. Increased β cell mass and islet diameter in βtsc2 -/- mice up to 35 weeks A: Reconstruction of multiple anti-insulin immunofluorescence images showing differences in β cell mass
Supplementary Figure 1. PD-L1 is glycosylated in cancer cells. (a) Western blot analysis of PD-L1 in breast cancer cells. (b) Western blot analysis
 Western blot analysis of PD-L1 in breast cancer cells. (b) Western blot analysis") Supplementary Figure 1. PD-L1 is glycosylated in cancer cells. (a) Western blot analysis of PD-L1 in breast cancer cells. (b) Western blot analysis of PD-L1 in ovarian cancer cells. (c) Western blot analysis
Supplementary Figure 1. PD-L1 is glycosylated in cancer cells. (a) Western blot analysis of PD-L1 in breast cancer cells. (b) Western blot analysis of PD-L1 in ovarian cancer cells. (c) Western blot analysis
Complexity of intra- and inter-pathway loops in colon cancer and melanoma: implications for targeted therapies
 Complexity of intra- and inter-pathway loops in colon cancer and melanoma: implications for targeted therapies René Bernards The Netherlands Cancer Institute Amsterdam The Netherlands Molecular versus
hexahistidine tagged GRP78 devoid of the KDEL motif (GRP78-His) on SDS-PAGE. This
 on SDS-PAGE. This") SUPPLEMENTAL FIGURE LEGEND Fig. S1. Generation and characterization of. (A) Coomassie staining of soluble hexahistidine tagged GRP78 devoid of the KDEL motif (GRP78-His) on SDS-PAGE. This protein was expressed
SUPPLEMENTAL FIGURE LEGEND Fig. S1. Generation and characterization of. (A) Coomassie staining of soluble hexahistidine tagged GRP78 devoid of the KDEL motif (GRP78-His) on SDS-PAGE. This protein was expressed
SUPPLEMENTARY INFORMATION
 Figure S1 Induction of non-apoptotic death of SV40-transformed and primary DKO MEFs, and DKO thymocytes. (A-F) STS-induced non-apoptotic death of DKO MEF. (A, B) Reduced viability of DKO MEFs after exposure
Supplementary Figure 1. Spatial distribution of LRP5 and β-catenin in intact cardiomyocytes. (a) and (b) Immunofluorescence staining of endogenous
 and (b) Immunofluorescence staining of endogenous") Supplementary Figure 1. Spatial distribution of LRP5 and β-catenin in intact cardiomyocytes. (a) and (b) Immunofluorescence staining of endogenous LRP5 in intact adult mouse ventricular myocytes (AMVMs)
Supplementary Figure 1. Spatial distribution of LRP5 and β-catenin in intact cardiomyocytes. (a) and (b) Immunofluorescence staining of endogenous LRP5 in intact adult mouse ventricular myocytes (AMVMs)
Supplementary Figure 1
 A B D Relative TAp73 mrna p73 Supplementary Figure 1 25 2 15 1 5 p63 _-tub. MDA-468 HCC1143 HCC38 SUM149 MDA-468 HCC1143 HCC38 SUM149 HCC-1937 MDA-MB-468 ΔNp63_ TAp73_ TAp73β E C Relative ΔNp63 mrna TAp73
SUPPLEMENTARY INFORMATION
 DOI: 10.1038/ncb2535 Figure S1 SOX10 is expressed in human giant congenital nevi and its expression in human melanoma samples suggests that SOX10 functions in a MITF-independent manner. a, b, Representative
Overexpression of Mcl-1 confers resistance to BRAFV600E inhibitors alone and in combination with MEK1/2 inhibitors in melanoma
 Overexpression of Mcl-1 confers resistance to BRAFV600E inhibitors alone and in combination with MEK1/2 inhibitors in melanoma The Harvard community has made this article openly available. Please share
Supplementary Figure 1: Digitoxin induces apoptosis in primary human melanoma cells but not in normal melanocytes, which express lower levels of the
 Supplementary Figure 1: Digitoxin induces apoptosis in primary human melanoma cells but not in normal melanocytes, which express lower levels of the cardiac glycoside target, ATP1A1. (a) The percentage
EPIGENETIC RE-EXPRESSION OF HIF-2α SUPPRESSES SOFT TISSUE SARCOMA GROWTH
 EPIGENETIC RE-EXPRESSION OF HIF-2α SUPPRESSES SOFT TISSUE SARCOMA GROWTH Supplementary Figure 1. Supplementary Figure 1. Characterization of KP and KPH2 autochthonous UPS tumors. a) Genotyping of KPH2
Supplementary Figure 1. The CagA-dependent wound healing or transwell migration of gastric cancer cell. AGS cells transfected with vector control or
 Supplementary Figure 1. The CagA-dependent wound healing or transwell migration of gastric cancer cell. AGS cells transfected with vector control or 3xflag-CagA expression vector were wounded using a pipette
GFP-LC3 +/+ CLU -/- kda CLU GFP. Actin. GFP-LC3 +/+ CLU -/- kda CLU GFP. Actin
 Supplementary Fig. 1 a CQ treatment ScrB OGX11 MG132 I II AZD5363 I II b GFP / / GFP / / GFP / / GFP / / GFP GFP Actin Actin ctrl CQ GFP / / GFP / / GFP / / GFP / / GFP GFP Actin Actin rapamycin rapamycincq
Type of file: PDF Size of file: 0 KB Title of file for HTML: Supplementary Information Description: Supplementary Figures
 Type of file: PDF Size of file: 0 KB Title of file for HTML: Supplementary Information Description: Supplementary Figures Supplementary Figure 1 mir-128-3p is highly expressed in chemoresistant, metastatic
Mechanical Stress-Dependent Autophagy Components Release via Extracellular
 Supporting Information for Mechanical Stress-Dependent Autophagy Components Release via Extracellular Nanovesicles in Tumor Cells Kaizhe Wang,, Yuhui Wei,, Wenjing Liu,, Lin Liu,, Zhen Guo,, Chunhai Fan,,
Supplementary Materials for
 www.sciencesignaling.org/cgi/content/full/7/322/ra38/dc1 Supplementary Materials for Dynamic Reprogramming of Signaling Upon Met Inhibition Reveals a Mechanism of Drug Resistance in Gastric Cancer Andrea
T H E J O U R N A L O F C E L L B I O L O G Y
 T H E J O U R N A L O F C E L L B I O L O G Y Supplemental material Krenn et al., http://www.jcb.org/cgi/content/full/jcb.201110013/dc1 Figure S1. Levels of expressed proteins and demonstration that C-terminal
Response and resistance to BRAF inhibitors in melanoma
 Response and resistance to BRAF inhibitors in melanoma Keith T. Flaherty, M.D. Massachusetts General Hospital Cancer Center Disclosures Roche/Genentech: consultant GlaxoSmithKline: consultant BRAF mutations
Breeding scheme, transgenes, histological analysis and site distribution of SB-mutagenized osteosarcoma.
 Supplementary Figure 1 Breeding scheme, transgenes, histological analysis and site distribution of SB-mutagenized osteosarcoma. (a) Breeding scheme. R26-LSL-SB11 homozygous mice were bred to Trp53 LSL-R270H/+
Supplementary Figure 1: si-craf but not si-braf sensitizes tumor cells to radiation.
 Supplementary Figure 1: si-craf but not si-braf sensitizes tumor cells to radiation. (a) Embryonic fibroblasts isolated from wildtype (WT), BRAF -/-, or CRAF -/- mice were irradiated (6 Gy) and DNA damage
Supplementary Figure 1. Basal level EGFR across a panel of ESCC lines. Immunoblots demonstrate the expression of phosphorylated and total EGFR as
 Supplementary Figure 1. Basal level EGFR across a panel of ESCC lines. Immunoblots demonstrate the expression of phosphorylated and total EGFR as well as their downstream effectors across a panel of ESCC
Supplementary Figure 1
 Supplementary Figure 1 6 HE-50 HE-116 E-1 HE-108 Supplementary Figure 1. Targeted drug response curves of endometrial cancer cells. Endometrial cancer cell lines were incubated with serial dilutions of
Supplementary Information Supplementary Fig. 1. Elevated Usp9x in melanoma and NRAS mutant melanoma cells are dependent on NRAS for 3D growth.
 Supplementary Information Supplementary Fig. 1. Elevated Usp9x in melanoma and NRAS mutant melanoma cells are dependent on NRAS for 3D growth. a. Immunoblot for Usp9x protein in NRAS mutant melanoma cells
Understanding Signaling Pathways by Modifying Sensitivity to PLX4720 in B-RAF V600E Melanoma
 Understanding Signaling Pathways by Modifying Sensitivity to PLX4720 in B-RAF V600E Melanoma Muska Hassan NCI-ICBP Summer Fellow Broad Institute of MIT and Harvard: Cancer Program Mentor: Cory Johannessen,
AACR 101st Annual Meeting 2010, Washington D.C. Experimental and Molecular Therapeutics Section 29; Abstract #3855
 Investigation of the Growth Inhibitory Activity of the MEK Inhibitor ARRY-162 in Combination with Everolimus in a Variety of KRas and PI3K Pathway Mutant Cancers Brian Tunquist, Tyler Risom, Debbie Anderson,
Rationale and results from. BRAFi and immunotherapy
 Rationale and results from emerging combinations of BRAFi and immunotherapy Antoni Ribas, M.D. rofessor of Medicine rofessor of Surgery rofessor of Molecular and Medical harmacology Director, Tumor Immunology
Supplementary Materials for
 www.sciencesignaling.org/cgi/content/full/6/283/ra57/dc1 Supplementary Materials for JNK3 Couples the Neuronal Stress Response to Inhibition of Secretory Trafficking Guang Yang,* Xun Zhou, Jingyan Zhu,
Supporting Information. Epigallocatechin-3-gallate (EGCG) promotes autophagy-dependent survival via
 promotes autophagy-dependent survival via") Supporting Information Epigallocatechin-3-gallate (EGCG) promotes autophagy-dependent survival via influencing the balance of mtor-ampk pathways upon endoplasmic reticulum stress Figure S1. EGCG induces
Supporting Information Epigallocatechin-3-gallate (EGCG) promotes autophagy-dependent survival via influencing the balance of mtor-ampk pathways upon endoplasmic reticulum stress Figure S1. EGCG induces
Supplementary Information
 Supplementary Information Figure S1. Int6 gene silencing efficiency. (A) Western Blot analysis of Int6 expression at different times after sirna transfection. Int6 expression is strongly silenced in Int6
AWARD NUMBER: W81XWH TITLE: An in Vivo shrna-drug Screen to Identify Novel Targeted Therapy Combinations for KRAS Mutant Cancers
 AWARD NUMBER: W81XWH-12-1-0420 TITLE: An in Vivo shrna-drug Screen to Identify Novel Targeted Therapy Combinations for KRAS Mutant Cancers PRINCIPAL INVESTIGATOR: Ryan B. Corcoran, M.D., Ph.D. CONTRACTING
Supplementary material. VAMP7 controls T cell activation by regulating recruitment and phosphorylation of vesicular
 Supplementary material VAMP7 controls T cell activation by regulating recruitment and phosphorylation of vesicular Lat to the TCR activation sites. Paola Larghi, David J Williamson, Jean-Marie Carpier,
AP VP DLP H&E. p-akt DLP
 A B AP VP DLP H&E AP AP VP DLP p-akt wild-type prostate PTEN-null prostate Supplementary Fig. 1. Targeted deletion of PTEN in prostate epithelium resulted in HG-PIN in all three lobes. (A) The anatomy
Supplementary Figure 1. A. Bar graph representing the expression levels of the 19 indicated genes in the microarrays analyses comparing human lung
 Supplementary Figure 1. A. Bar graph representing the expression levels of the 19 indicated genes in the microarrays analyses comparing human lung immortalized broncho-epithelial cells (AALE cells) expressing
Nature Structural and Molecular Biology: doi: /nsmb Supplementary Figure 1
 Supplementary Figure 1 Mutational analysis of the SA2-Scc1 interaction in vitro and in human cells. (a) Autoradiograph (top) and Coomassie stained gel (bottom) of 35 S-labeled Myc-SA2 proteins (input)
Expanded View Figures
 PEX13 functions in selective autophagy Ming Y Lee et al Expanded View Figures Figure EV1. PEX13 is required for Sindbis virophagy. A, B Quantification of mcherry-capsid puncta per cell (A) and GFP-LC3
Figure S1. Effect of bafilomycin on EGF-induced Akt and Erk signaling. Effect of chloroquine on EGF-stimulated mtorc1, Akt and Erk
 EGF induced VATPase assembly and mtorc1 activation Supplemental Information Supplemental Figure Legends Figure S1. Effect of bafilomycin on EGFinduced Akt and Erk signaling. A. Hepatocytes were treated
Supplementary Materials for VAMP4 directs synaptic vesicles to a pool that selectively maintains asynchronous neurotransmission
 Supplementary Materials for VAMP4 directs synaptic vesicles to a pool that selectively maintains asynchronous neurotransmission Jesica Raingo, Mikhail Khvotchev, Pei Liu, Frederic Darios, Ying C. Li, Denise
Nimbolide inhibits pancreatic cancer growth and metastasis through ROS-mediated
 Nimbolide inhibits pancreatic cancer growth and metastasis through ROS-mediated apoptosis and inhibition of epithelial-to-mesenchymal transition Ramadevi Subramani a, Ph.D., Elizabeth Gonzalez b, MS.,
stability and tumor suppression
 Supplementary information The stress kinase MKK7 couples oncogenic stress to p53 stability and tumor suppression Daniel Schramek 1, Athanassios Kotsinas 2, Arabella Meixner 1, Teiji Wada 1, Ulrich Elling
Sestrin2 and BNIP3 (Bcl-2/adenovirus E1B 19kDa-interacting. protein3) regulate autophagy and mitophagy in renal tubular cells in. acute kidney injury
 regulate autophagy and mitophagy in renal tubular cells in. acute kidney injury") Sestrin2 and BNIP3 (Bcl-2/adenovirus E1B 19kDa-interacting protein3) regulate autophagy and mitophagy in renal tubular cells in acute kidney injury by Masayuki Ishihara 1, Madoka Urushido 2, Kazu Hamada
Sestrin2 and BNIP3 (Bcl-2/adenovirus E1B 19kDa-interacting protein3) regulate autophagy and mitophagy in renal tubular cells in acute kidney injury by Masayuki Ishihara 1, Madoka Urushido 2, Kazu Hamada
IP: anti-gfp VPS29-GFP. IP: anti-vps26. IP: anti-gfp - + +
 FAM21 Strump. WASH1 IP: anti- 1 2 3 4 5 6 FAM21 Strump. FKBP IP: anti-gfp VPS29- GFP GFP-FAM21 tail H H/P P H H/P P c FAM21 FKBP Strump. VPS29-GFP IP: anti-gfp 1 2 3 FKBP VPS VPS VPS VPS29 1 = VPS29-GFP
1.Basis of resistance 2.Mechanisms of resistance 3.How to overcome resistance. 13/10/2017 Sara Redaelli
 Dott.ssa Sara Redaelli 13/10/2017 1.Basis of resistance 2.Mechanisms of resistance 3.How to overcome resistance Tumor Heterogeneity: Oncogenic Drivers in NSCLC The Promise of Genotype-Directed Therapy
Loss of RhoA promotes skin tumor formation. Supplementary Figure 1. Loss of RhoA does not impair F-actin organization.
 Supplementary Figure Legends Supplementary Figure 1. Loss of RhoA does not impair F-actin organization. a. Representative IF images of F-actin staining of big and small control (left) and RhoA ko tumors
Supplementary Figure S1
 Supplementary Figure S1 Supplementary Figure S1. PARP localization patterns using GFP-PARP and PARP-specific antibody libraries GFP-PARP localization in non-fixed (A) and formaldehyde fixed (B) GFP-PARPx
Supplementary information
 Supplementary information 1 Supplementary Figure 1. CALM regulates autophagy. (a). Quantification of LC3 levels in the experiment described in Figure 1A. Data are mean +/- SD (n > 3 experiments for each
WNT5A enhances resistance of melanoma cells to targeted BRAF inhibitors
 Research article WNT5A enhances resistance of melanoma cells to targeted BRAF inhibitors Jamie N. Anastas, 1,2 Rima M. Kulikauskas, 3 Tigist Tamir, 4 Helen Rizos, 5 Georgina V. Long, 5 Erika M. von Euw,
Supplementary Figure 1.TRIM33 binds β-catenin in the nucleus. a & b, Co-IP of endogenous TRIM33 with β-catenin in HT-29 cells (a) and HEK 293T cells
 and HEK 293T cells") Supplementary Figure 1.TRIM33 binds β-catenin in the nucleus. a & b, Co-IP of endogenous TRIM33 with β-catenin in HT-29 cells (a) and HEK 293T cells (b). TRIM33 was immunoprecipitated, and the amount of
Supplementary Figure 1.TRIM33 binds β-catenin in the nucleus. a & b, Co-IP of endogenous TRIM33 with β-catenin in HT-29 cells (a) and HEK 293T cells (b). TRIM33 was immunoprecipitated, and the amount of
Muse Assays for Cell Analysis
 Muse Assays for Cell Analysis Multiple Assay Outputs for Cell Analysis Cell Health Cell Signalling Immunology Muse Count & Viability Kit Muse Cell Cycle Kit Muse Annexin V & Dead Cell Kit Muse Caspase
RCPA Research Award Final Progress Review
 RCPA Research Award 2010-2011 Final Progress Review Name: Dr Craig Wallington-Beddoe Degree/Institution/Year: PhD, The University of Sydney, Year 2 Research Project Title: New Therapeutic Strategies for
Supplementary Fig. 1 V-ATPase depletion induces unique and robust phenotype in Drosophila fat body cells.
 Supplementary Fig. 1 V-ATPase depletion induces unique and robust phenotype in Drosophila fat body cells. a. Schematic of the V-ATPase proton pump macro-complex structure. The V1 complex is composed of
The incidence of melanoma has risen rapidly in the past
 BASIC INVESTIGATION The MEK1/2 Inhibitor AS703026 Circumvents Resistance to the BRAF Inhibitor PLX4032 in Human Malignant Melanoma Cells Seong Joon Park, MD, Seung-Woo Hong, PhD, Jai-Hee Moon, PhD, Dong-Hoon
A dual PI3 kinase/mtor inhibitor reveals emergent efficacy in glioma
 Supplemental data A dual PI3 kinase/mtor inhibitor reveals emergent efficacy in glioma Qi-Wen Fan, Zachary A. Knight, David D. Goldenberg, Wei Yu, Keith E. Mostov, David Stokoe, Kevan M. Shokat, and William
Supplementary Information
 Supplementary Information Supplementary Figure 1. Effect of mir mimics and anti-mirs on DTPs a, Representative fluorescence microscopy images of GFP vector control or mir mimicexpressing parental and DTP
Interleukin-6 promotes pancreatic cancer cell migration by rapidly activating the small GTPase CDC42
 Interleukin-6 promotes pancreatic cancer cell migration by rapidly activating the small GTPase CDC42 Gina L. Razidlo, Kevin M. Burton, and Mark A. McNiven SUPPORTING INFORMATION Figure S1. IL-6 promotes
Supplementary Figure 1. Genotyping strategies for Mcm3 +/+, Mcm3 +/Lox and Mcm3 +/- mice and luciferase activity in Mcm3 +/Lox mice. A.
 Supplementary Figure 1. Genotyping strategies for Mcm3 +/+, Mcm3 +/Lox and Mcm3 +/- mice and luciferase activity in Mcm3 +/Lox mice. A. Upper part, three-primer PCR strategy at the Mcm3 locus yielding
Supplementary Figure 1. Double-staining immunofluorescence analysis of invasive colon and breast cancers. Specimens from invasive ductal breast
 Supplementary Figure 1. Double-staining immunofluorescence analysis of invasive colon and breast cancers. Specimens from invasive ductal breast carcinoma (a) and colon adenocarcinoma (b) were staining
SUPPLEMENTARY INFORMATION
 SUPPLEMENTARY INFORMATION doi:1.138/nature9814 a A SHARPIN FL B SHARPIN ΔNZF C SHARPIN T38L, F39V b His-SHARPIN FL -1xUb -2xUb -4xUb α-his c Linear 4xUb -SHARPIN FL -SHARPIN TF_LV -SHARPINΔNZF -SHARPIN
SUPPLEMENTARY INFORMATION
 DOI:.38/ncb3399 a b c d FSP DAPI 5mm mm 5mm 5mm e Correspond to melanoma in-situ Figure a DCT FSP- f MITF mm mm MlanaA melanoma in-situ DCT 5mm FSP- mm mm mm mm mm g melanoma in-situ MITF MlanaA mm mm
SUPPLEMENTAL EXPERIMENTAL PROCEDURES
 SUPPLEMENTAL EXPERIMENTAL PROCEDURES Crystal violet assay Cells were seeded in 24-well plates and cultured in media supplemented with % FBS for 7 days. Media were then removed, plates were briefly washed
Supplementary Material. Contents include:
 Supplementary Material Contents include: 1. Supplementary Figures (p. 2-7) 2. Supplementary Figure Legends (p. 8-9) 3. Supplementary Tables (p. 10-12) 4. Supplementary Table Legends (p. 13) 1 Wellen_FigS1
Supplementary Fig. 1: ATM is phosphorylated in HER2 breast cancer cell lines. (A) ATM is phosphorylated in SKBR3 cells depending on ATM and HER2
 ATM is phosphorylated in SKBR3 cells depending on ATM and HER2") Supplementary Fig. 1: ATM is phosphorylated in HER2 breast cancer cell lines. (A) ATM is phosphorylated in SKBR3 cells depending on ATM and HER2 activity. Upper panel: Representative histograms for FACS
Supplementary Fig. 1: ATM is phosphorylated in HER2 breast cancer cell lines. (A) ATM is phosphorylated in SKBR3 cells depending on ATM and HER2 activity. Upper panel: Representative histograms for FACS
Kinome Profiling: The Potential in ER-Negative Patients. Charles M. Perou, Ph.D. Departments of Genetics and Pathology
 Kinome Profiling: The Potential in ER-Negative Patients Charles M. Perou, Ph.D. Departments of Genetics and Pathology Lineberger Comprehensive Cancer Center University of North Carolina Chapel Hill, North
(A) SW480, DLD1, RKO and HCT116 cells were treated with DMSO or XAV939 (5 µm)
 SW480, DLD1, RKO and HCT116 cells were treated with DMSO or XAV939 (5 µm)") Supplementary Figure Legends Figure S1. Tankyrase inhibition suppresses cell proliferation in an axin/β-catenin independent manner. (A) SW480, DLD1, RKO and HCT116 cells were treated with DMSO or XAV939
Supplementary Figure Legends Figure S1. Tankyrase inhibition suppresses cell proliferation in an axin/β-catenin independent manner. (A) SW480, DLD1, RKO and HCT116 cells were treated with DMSO or XAV939
Supplementary Figure 1. Characterization of NMuMG-ErbB2 and NIC breast cancer cells expressing shrnas targeting LPP. NMuMG-ErbB2 cells (a) and NIC
 and NIC") Supplementary Figure 1. Characterization of NMuMG-ErbB2 and NIC breast cancer cells expressing shrnas targeting LPP. NMuMG-ErbB2 cells (a) and NIC cells (b) were engineered to stably express either a LucA-shRNA
Supplementary Figure 1. Characterization of NMuMG-ErbB2 and NIC breast cancer cells expressing shrnas targeting LPP. NMuMG-ErbB2 cells (a) and NIC cells (b) were engineered to stably express either a LucA-shRNA
Nature Structural & Molecular Biology: doi: /nsmb.3218
 Supplementary Figure 1 Endogenous EGFR trafficking and responses depend on biased ligands. (a) Lysates from HeLa cells stimulated for 2 min. with increasing concentration of ligands were immunoblotted
Supplementary Fig. 1. GPRC5A post-transcriptionally down-regulates EGFR expression. (a) Plot of the changes in steady state mrna levels versus
 Plot of the changes in steady state mrna levels versus") Supplementary Fig. 1. GPRC5A post-transcriptionally down-regulates EGFR expression. (a) Plot of the changes in steady state mrna levels versus changes in corresponding proteins between wild type and Gprc5a-/-
Supplementary Fig. 1. GPRC5A post-transcriptionally down-regulates EGFR expression. (a) Plot of the changes in steady state mrna levels versus changes in corresponding proteins between wild type and Gprc5a-/-
Suppl. Figure 1. T 3 induces autophagic flux in hepatic cells. (A) RFP-GFP-LC3 transfected HepG2/TRα cells were visualized and cells were quantified
 RFP-GFP-LC3 transfected HepG2/TRα cells were visualized and cells were quantified") Suppl. Figure 1. T 3 induces autophagic flux in hepatic cells. (A) RFP-GFP-LC3 transfected HepG2/TRα cells were visualized and cells were quantified for RFP-LC3 puncta (red dots) representing both autolysosomes
Suppl. Figure 1. T 3 induces autophagic flux in hepatic cells. (A) RFP-GFP-LC3 transfected HepG2/TRα cells were visualized and cells were quantified for RFP-LC3 puncta (red dots) representing both autolysosomes
Corporate Medical Policy
 Corporate Medical Policy BRAF Gene Variant Testing to Select Melanoma or Glioma Patients File Name: Origination: Last CAP Review: Next CAP Review: Last Review: braf_gene_variant_testing_to_select_melanoma_or_glioma_patients_for_targeted_
LAB#23: Biochemical Evidence of Evolution Name: Period Date :
 LAB#23: Biochemical Evidence of Name: Period Date : Laboratory Experience #23 Bridge Worth 80 Lab Minutes If two organisms have similar portions of DNA (genes), these organisms will probably make similar
Supplementary Information
 Supplementary Information mediates STAT3 activation at retromer-positive structures to promote colitis and colitis-associated carcinogenesis Zhang et al. a b d e g h Rel. Luc. Act. Rel. mrna Rel. mrna
Supplemental Table 1 Molecular Profile of the SCLC Cell Line Panel
 Supplemental Table 1 Molecular Profile of the SCLC Cell Line Panel p53 RB Myc Cell Line Mutation A Mutation A Amplification B COR-L103 C p.y234c p.d584e L-Myc NCI-H526 p.s33_splice None N-Myc NCI-H1048
Supporting Information
 Supporting Information Franco et al. 10.1073/pnas.1015557108 SI Materials and Methods Drug Administration. PD352901 was dissolved in 0.5% (wt/vol) hydroxyl-propyl-methylcellulose, 0.2% (vol/vol) Tween
nature methods Organelle-specific, rapid induction of molecular activities and membrane tethering
 nature methods Organelle-specific, rapid induction of molecular activities and membrane tethering Toru Komatsu, Igor Kukelyansky, J Michael McCaffery, Tasuku Ueno, Lidenys C Varela & Takanari Inoue Supplementary
Normal RAS-RAF (MAPK) pathway signaling
 pathway signaling") BRAF-Mutations in Melanomas L. Mazzucchelli Istituto Cantonale di Patologia, Locarno 77. Annual Meeting Swiss Society of Pathology, Lucerne 2011 Sponsored by Roche Pharma Switzerland Melanoma has increased
BRAF-Mutations in Melanomas L. Mazzucchelli Istituto Cantonale di Patologia, Locarno 77. Annual Meeting Swiss Society of Pathology, Lucerne 2011 Sponsored by Roche Pharma Switzerland Melanoma has increased
Problem Set 8 Key 1 of 8
 7.06 2003 Problem Set 8 Key 1 of 8 7.06 2003 Problem Set 8 Key 1. As a bright MD/PhD, you are interested in questions about the control of cell number in the body. Recently, you've seen three patients
Supplementary Figure 1: STAT3 suppresses Kras-induced lung tumorigenesis
 Supplementary Figure 1: STAT3 suppresses Kras-induced lung tumorigenesis (a) Immunohistochemical (IHC) analysis of tyrosine 705 phosphorylation status of STAT3 (P- STAT3) in tumors and stroma (all-time
Targeting ER stress induced autophagy overcomes BRAF inhibitor resistance in melanoma
 Targeting ER stress induced autophagy overcomes BRAF inhibitor resistance in melanoma Xiao-Hong Ma,, Constantinos Koumenis, Ravi K. Amaravadi J Clin Invest. 2014;124(3):1406-1417. https://doi.org/10.1172/jci70454.
Cells and reagents. Synaptopodin knockdown (1) and dynamin knockdown (2)
 and dynamin knockdown (2)") Supplemental Methods Cells and reagents. Synaptopodin knockdown (1) and dynamin knockdown (2) podocytes were cultured as described previously. Staurosporine, angiotensin II and actinomycin D were all obtained
Supplemental Methods Cells and reagents. Synaptopodin knockdown (1) and dynamin knockdown (2) podocytes were cultured as described previously. Staurosporine, angiotensin II and actinomycin D were all obtained
Supplementary Figure 1. SA-β-Gal positive senescent cells in various cancer tissues. Representative frozen sections of breast, thyroid, colon and
 Supplementary Figure 1. SA-β-Gal positive senescent cells in various cancer tissues. Representative frozen sections of breast, thyroid, colon and stomach cancer were stained with SA-β-Gal and nuclear fast
Kinase Inhibitor p21 WAF1/CIP1 in Apoptosis and Autophagy
 Pivotal Role of the Cyclin-dependent Kinase Inhibitor p21 WAF1/CIP1 in Apoptosis and Autophagy Keishi Fujiwara, Shigeru Daido, Akitsugu Yamamoto, Ryuji Kobayash, Tomohisa Yokoyama, Hiroshi Aok, Eiji Iwado,
Kaul 1. Kaul et al _Inventory of Supplemental Materials. Supplemental Figures and Figure Legends. Figure S1, related to Figure 1
 Kaul 1 Kaul et al _Inventory of Supplemental Materials Supplemental Figures and Figure Legends Figure S1, related to Figure 1 Figure S2, related to Figure 2 Figure S3, related to Figure 3 Figure S4, related
Appendix Table of Contents. 1. Appendix Figure legends S1-S13 and Appendix Table S1 and S2. 2. Appendix Figures S1-S13
 Appendix Table of Contents. Appendix Figure legends S-S3 and Appendix Table S and S. Appendix Figures S-S3 . Appendix Figure legends S-S3 and Appendix Table S and S Appendix Figure S. Western blot analysis
Supplementary Information File
 Supplementary Information File Supplementary Table 1. List of synthesized sirna sequences for target genes sirna Species Sequence Ctrl sirna mouse sense 5 -UUCUCCGAACGUGUCACGUTT-3 Antisense 5 -ACGUGACACGUUCGGAGAATT-3
SUPPLEMENTARY FIGURES
 SUPPLEMENTARY FIGURES Supplementary Figure 1. (A) Left, western blot analysis of ISGylated proteins in Jurkat T cells treated with 1000U ml -1 IFN for 16h (IFN) or left untreated (CONT); right, western
m 6 A mrna methylation regulates AKT activity to promote the proliferation and tumorigenicity of endometrial cancer
 SUPPLEMENTARY INFORMATION Articles https://doi.org/10.1038/s41556-018-0174-4 In the format provided by the authors and unedited. m 6 A mrna methylation regulates AKT activity to promote the proliferation
 Many Forms of Cell-Cell Communication Regulate Tissue Function and Phenotype Physiological Functions of Gap Junctions Homeostasis buffering/sharing of ions, nutrients, and water Metabolic support nutrient