IP: anti-gfp VPS29-GFP. IP: anti-vps26. IP: anti-gfp - + +
|
|
|
- Shawn York
- 6 years ago
- Views:
Transcription


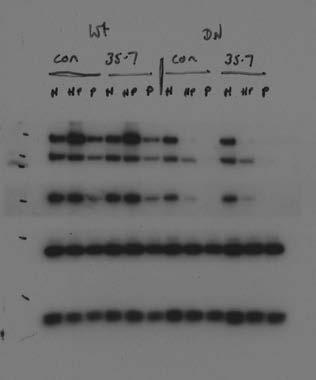
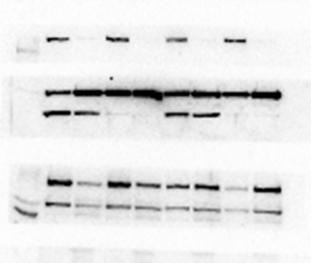
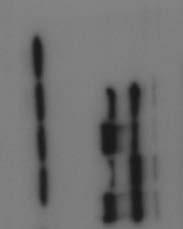
1 FAM21 Strump. WASH1 IP: anti FAM21 Strump. FKBP IP: anti-gfp VPS29- GFP GFP-FAM21 tail H H/P P H H/P P c FAM21 FKBP Strump. VPS29-GFP IP: anti-gfp FKBP VPS VPS VPS VPS29 1 = VPS29-GFP 2 = VPS29 V90D-GFP 3 = HeLa control 4 = HeLa 5 = GFP-VPS 6 = GFP-VPS endogenous VPS KD CAPZα VPS29 H = HEPES lysis f H/P = HEPES/PBS mix P = PBS lysis f Lysates. (1% total) FAM21 FKBP Strump. VPS d FAM21 Strump. WASH1 FKBP GFP-VPS IP: anti-gfp Lysates (1% total) - mcherry- mcherry- FKBP FKBP FKBP Strump. PBS lysis uffer 1 = control 2 = FAM21 KD 3 = FKBP KD Supplementary Figure 1. Interactions of the retromer CSC. (a) Cells staly expressing GFP-tagged wild-type or point mutant versions of VPS29 or VPS along with untransfected HeLa cells were lysed and immunoprecipitated with anti- antisera. () Cells staly expressing VPS29-GFP or GFP-FAM21 tail were lysed using either the low stringency HEPES uffer (H), the higher stringency PBS uffer (P) or the mixed HEPES/PBS uffer (H/P) as in Figure 2. Lysates were treated with anti-gfp to recover the respective GFP-tagged protein. (c) FKBP or FAM21 expression was aolished with sirna treatment in the VPS29-GFP expressing cells. Cells were lysed and the VPS29-GFP recovered y native IP. (d) Cells staly expressing either wild-type GFP-VPS or the mutant were transiently transfected with mcherry-fkbp or a control plasmid 48 hours prior to lysis in the higher stringency PBS uffer. GFP-VPS and associated proteins were recovered y native IP.


 Untransfected HeLa cells and")
 and were")


 fixed and laeled with")


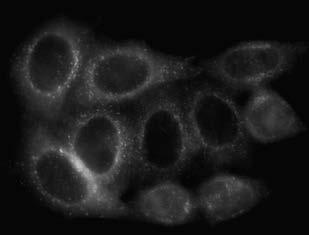
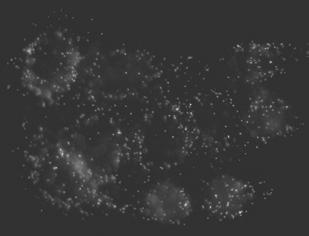
2 HeLa control HeLa VPS KD GFP-VPS VPS KD SNX1 SNX1 SNX1 SNX1 GFP-VPS VPS KD GFP GFP GFP GFP GFP CIMPR c GFP-VPS GFP-VPS LAMP1 GFP-VPS GFP-VPS LAMP1 Supplementary Figure 2. The VPS mutant localizes normally to endosomes. (a) Untransfected HeLa cells and HeLa cells staly expressing GFP-VPS wild-type () and were treated with sirna to silence endogenous VPS expression. 72 hours post-transfection, cells were fixed and stained with antiodies against GFP, SNX1 and. The loss of VPS results in loss of. Expression of either or VPS rescues the staining and oth and VPS appear to localize to SNX1-positive structures. () Cells expressing either wild-type GFP-VPS or were treated with sirna to silence expression of endogenous VPS. 72 hours post-transfection, cells were fixed and laeled with antiodies against and CIMPR. (c) HeLa cells staly expressing GFP-VPS wild-type () and were fixed and laeled with antiody against LAMP1. LAMP1 staining did not appear markedly different from cells expressing VPS. Scale ars in (a)-(c) = 20 µm.


 Untransfected HeLa cells and HeLa cells staly expressing GFP-VPS wild-type ()")


3 2 hrs 4 hrs 6 hrs HeLa GFP-VPS GFP-VPS Average Cell Perimeter, as proportion of perimeter at 2 hrs hours after plating HeLa GFP-VPS GFP-VPS HeLa control HeLa VPS KD GFP-VPS VPS KD GFP-VPS VPS KD GLUT-1 SNX1 Supplementary Figure 3. The VPS mutant impacts on WASH-associated phenotypes. (a) Untransfected HeLa cells and HeLa cells staly expressing GFP-VPS wild-type () and were plated on glass coverslips and fixed at 2, 4, and 6 hours after plating. Representative images are shown for each condition. Scale ar = µm. The graph represents the average cell perimeter quantified y Cellomics automated fluorescence microscopy. A minimum of 5000 cells per coverslip were analysed. () Untransfected HeLa cells and HeLa cells staly expressing GFP-VPS wild-type () and were treated with sirna to silence endogenous VPS expression. 72 hours post-transfection, cells were fixed and stained with antiodies against SNX1 and GLUT-1. Cells were selected for imaging y viewing in the SNX1 channel without viewing the GLUT-1 staining so as to avoid iasing the oserved GLUT-1 localisation. The knockdown of VPS shifts the localization of GLUT1 to intracellular structures. The expression of GFP-tagged VPS can rescue GLUT-1 localisation ut the mutant displays GLUT-1 localisation more similar to a VPS KD in untransfected HeLa cells.
4 a GFP-VPS clone 9 c DMSO GFP-VPS GFP-VPS clone 8 control KD GFP-VPS GFP-VPS GFP-VPS clone 9 DMSO endog VPS KD Bafilomycin GFP-VPS GFP-VPS clone 8 GFP-VPS tuulin LC3-II GFP-VPS LC3-II/tuulin normalised to wt GFP-VPS GFP-VPS clone9 Bafilomycin endog control KD VPS KD GFP-VPS * ** GFP-VPS clone8 DMSO Baf tuulin LC3-II (low exp) LC3-II (high exp) d LC3-II/tuulin, normalised to control DMSO Baf e 0 sictrl control KD sictrl sivps sivps DMSO endog VPS KD Bafilomycin endog control KD VPS KD GFP-VPS GFP-VPS GFP-VPS GFP-VPS GFP-VPS GFP-VPS GFP-VPS GFP-VPS GFP-VPS endog VPS tuulin Supplementary Figure 4. VPS impairs autophagy in independent clones and is unaffected y knockdown of the endogenous protein. (a) HeLa cells staly expressing GFP-VPS wild-type () and were derived from clones different than those in Fig. 1. The cells were treated with Bafilomycin A1, lysed, and assessed for LC3-II and tuulin levels as descried previously. A representative lot is shown. () The experiment in triplicate shown in (a) is quantified with LC3-II levels normalised to tuulin and expressed as a ratio of levels in wild-type. Error ars indicate SEM. * indicates p=0.03 and ** indicates p=0.004 y 2-tailed Student s t-test. (c) The original clones of HeLa cells staly expressing GFP-VPS and were treated once with 40 nm sirna to silence endogenous human VPS without affecting the GFP-tagged murine construct. Cells were treated with Bafilomycin A1 as previously descried and assessed for LC3-II and tuulin levels. (low exp: low exposure: high exp: high exposure) (d) Quantification of the experiment in triplicate shown in (c). Error ars indicate SEM. The p-values (all two-tailed) etween wild-type and cells with a control knockdown are and for DMSO and Baf, respectively. The p-values etween wild-type and cells depleted of endogenous VPS are and for DMSO and Baf, respectively. The p-value for the comparison of cells with and without depletion of endogenous VPS in DMSO is All other comparisons etween cells with and without depletion of endogenous VPS are nonsignificant.
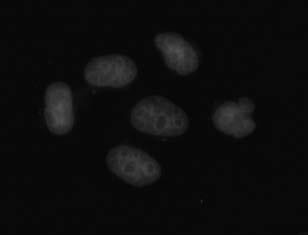
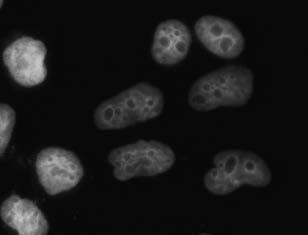
5 anti-vps/lank anti-vps/anti- anti-vps/anti- PLA signal GFP-VPS DAPI PLA signal GFP-VPS DAPI anti-vps/lank anti-vps/anti- anti-vps/anti- Supplementary Figure 5 (continued on next page)


 HeLa cells were transfected")
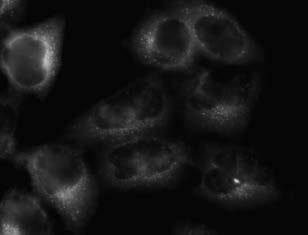
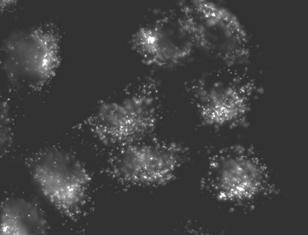
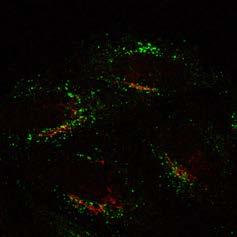
6 nti-vps/lank anti-vps/anti- anti-vps/anti- PLA signal DAPI ATG9-GFP mrfp-rab5 WASH1 Supplementary Figure 5. resides in the same compartment as VPS and the WASH complex. (a) Untransfected HeLa cells, or cells staly expressing GFP-VPS or GFP-VPS were fixed and analysed using the proximity ligation assay (PLA), with primary antiodies as indicated. The cells were imaged y epifluorescence microscopy. Scale ar = 20 µm. () HeLa cells were transfected with -GFP and mrfp-rab5, immunostained for endogenous WASH1, and sujected confocal microscopy. Scale ar = µm.


 HeLa cells staly")
 and were depleted of")


 HeLa cells staly () and")


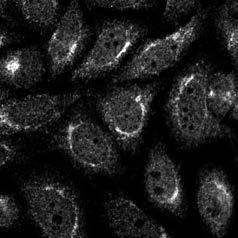
7 TGN46 GFP-VPS GFP-VPS 2 hr stv 1 hr stv 30 min stv asal TGN46 TGN46 TGN46 TGN46 TGN46 TGN46 TGN46 TGN46 TGN46 Supplementary Figure 6. VPS affects trafficking and localization of. (a) HeLa cells staly expressing GFP-VPS wild-type () and were depleted of endogenous VPS using 40 nm of sirna, and susequently immunostained for TGN46 and endogenous and sujected to confocal microscopy, as in Fig. 6d. Compressed z-stack images are shown. () HeLa cells staly expressing GFP-VPS wild-type () and were starved in HBSS for the time indicated or kept in full medium ( asal ). Following fixation, cells were immunostained for TGN46 and endogenous and sujected to confocal microscopy. Confocal slices are shown. Scale ars in (a) and () = µm.


 HeLa cells staly")
 and were")


 = µm.")
8 GFP-VPS Golgin-97 GFP-VPS Golgin-97 GFP-VPS GM GFP-VPS GM Supplementary Figure 7. VPS alters Golgi and TGN morphology. (a) HeLa cells staly expressing GFP-VPS wild-type () and were depleted of endogenous VPS using 40 nm of sirna, and susequently immunostained for Golgin-97 and sujected to confocal microscopy. () HeLa cells staly expressing GFP-VPS wild-type () and were fixed and immunostained for GM and sujected to confocal microscopy. Scale ars in (a) and () = µm.


9 VPS TGN46 WASH1 KD starvation WASH1 KD asal control KD starvation control KD asal VPS TGN46 VPS TGN46 VPS TGN46 Golgin-97 c control GM Golgin-97 WASH1 KD WASH1 KD control KD GM Supplementary Figure 8. WASH1 depletion affects ATG9 localization, as well as TGN and Golgi morphology. (a) HeLa cells depleted of WASH1 with two successive sirna treatments were either starved in HBSS for one hour or kept in full medium. Following fixation, cells were immunostained for TGN46,, and VPS and sujected to confocal microscopy, as in Fig. 7a. Compressed z-stack images are shown. () HeLa cells were depleted of WASH1 and fixed as in (a), and immunostained for and Golgin-97. Confocal slices are shown. (c) HeLa cells were depleted of WASH1 and fixed as in (a), and immunostained for GM. Confocal slices are shown. Scale ars in (a)-(c) = µm.


 HeLa cells staly expressing")


 HeLa cells depleted of WASH1")

 and () = µm.")
10 GFP-VPS RFP-LC3 GFP-VPS RFP-LC3 GFP-LC3 control GFP-LC3 WASH1 KD Supplementary Figure 9. VPS and WASH1 depletion impair trafficking to autophagosomes. (a) HeLa cells staly expressing GFP-VPS wild-type and were transfected with mrfp-lc3 for 24 hours, immunostained for endogenous, and imaged y confocal microscopy. Compressed z-stack images are shown. () HeLa cells depleted of WASH1 with two successive sirna treatments were then transfected with GFP-LC3 for 24 hours, immunostained for endogenous, and imaged y confocal microscopy. Compressed z-stack images are shown. Scale ars in (a) and () = µm.


 and 27 cells ().")


.")
11 GFP-VPS mstr-atg16l1, asal GFP-VPS mstr-atg16l1, asal /mstr-atg16l1 d /mstr-atg16l1 Proportion of ATG16L1 signal that contains *** Proportion of ATG16L1 signal that contains control WASH1 KD c control KD mstr-atg16l1 WASH1 KD ns mstr-atg16l1 Supplementary Figure. VPS and WASH1 depletion do not alter ATG16 distriution. (a) HeLa cells staly expressing GFP-VPS wild-type and were transfected with mstrawerry-atg16l1 for 24 hours, immunostained for endogenous, and imaged y confocal microscopy. () Colocalization is expressed in terms of Mander s coefficient M1 to indicate the proportion of ATG16L1 intensities that also contain intensities. n=34 cells () and 27 cells (). Error ars represent SEM and *** indicates p= y 2-tailed Student s t-test. (c) HeLa cells depleted of WASH1 with two successive sirna treatments were then transfected with mstrawerry-atg16l1 for 24 hours, immunostained for endogenous, and imaged y confocal microscopy. (d) Colocalization expressed as Mander s coefficent, as in (). n=18 cells (control) and 19 cells (WASH1 knockdown). Error ars indicate SEM, p=0.14 y 2-tailed Student s t-test. Scale ars in (a) and (c) = µm.


 HeLa cells depleted")

 and")
12 GFP-VPS mch-rab11 GFP-VPS mch-rab11 WASH1 KD control mch-rab11 mch-rab11 Supplementary Figure 11. VPS and WASH1 depletion alter recycling endosome morphology. (a) HeLa cells staly expressing GFP-VPS wild-type and were transfected with mcherry-rab11 for 24 hours, immunostained for endogenous, and imaged y confocal microscopy. () HeLa cells depleted of WASH1 with two successive sirna treatments were then transfected with mcherry-rab11 for 24 hours, immunostained for endogenous, and imaged y confocal microscopy. Scale ars in (a) and () = µm.


 WB: FKBP, VPS,, (lower exp.")


 31 WB: , VPS29 VPS29")


13 Figure FKBP Strump WASH1 VPS29 VPS WB: FKBP, Strumpellin, WASH1, Figure 1c WB: FKBP, Strumpellin, WASH1,, VPS29 (phosphoimager image) WB: VPS FKBP VPS FAM21 Strump WASH1 Strump VPS29 WB: FKBP, VPS,, FAM21, Strumpellin, WASH1 (higher exp.) WB: FKBP, VPS,, FAM21, Strumpellin, WASH1 (lower exp.) WB: Strumpellin,, VPS29 Figure 1d Figure 2a FKBP Strump WASH1 WB: FAM21, Strumpellin, FKBP, VPS,, VPS29 (phosphoimager image) 31 WB: FKBP, Strumpellin, WASH1,, VPS29 VPS29 WB: FAM21, Strumpellin, FKBP, VPS,, VPS29 Figure 2a, continued WB: FAM21, Strumpellin, WASH1, WB: FKBP, VPS,, VPS29 Supplementary Figure 12. Full scans of uncropped lots

 WB:")
 FKBP GFP-VPS FKBP")
 FAM21 GFP-VPS WB:")
 Figure 3d")
14 Figure 2 Figure 2c FAM21 Strump WASH1 FKBP Strump WASH1 VPS29 WB: FAM21, Strumpellin, WASH1, (right image is from phosphoimager) WB: FKBP, Strumpellin, WASH1,, VPS29 (lower exp) FKBP GFP-VPS FKBP Strump WASH1 VPS29 VPS29 WB: FKBP, Strumpellin, WASH1,, VPS29 (higher exp) FAM21 GFP-VPS WB: FKBP, VPS, VPS29 (right image is from phosphoimager) WB: FAM21, VPS (phosphoimager image) Figure 3d Supplementary Figure 12. continued
 WB: LC3 (DMSO) WB: LC3 (Baf)")

 WB: tuulin (DMSO) 98 64")

 WB: VPS,, VPS29 (DMSO, higher exp.")
 70 70 25 25 WB: VPS,,")
 WB: VPS,, VPS29 (Baf, higher exp.")
15 Figure 4a WB: tuulin (DMSO) WB: tuulin (Baf) WB: LC3 (DMSO) WB: LC3 (Baf) Figure 4f Figure 4h non-specific GFP-α-synuclein A53T GFP WB: GFP (lower exp) Figure 4h, cont WB: GFP (higher exp) WB: tuulin (DMSO) WB: tuulin (Baf) WB: LC3 (DMSO) WB: LC3 (Baf) Figure 4j WB: VPS,, VPS29 (DMSO, lower exp.) WB: VPS,, VPS29 (DMSO, higher exp.) WB: tuulin (DMSO - top, Baf - ottom, shown upside down) WB: VPS,, VPS29 (Baf, lower exp.) WB: VPS,, VPS29 (Baf, higher exp.) Supplementary Figure 12. continued
 WB: LC3 (DMSO) WB: LC3 (Baf)")
 WB: LC3 (higher exp) WB:")
 WB: WASH1 &")
 WB:")

16 Figure 5a WB: tuulin (DMSO) WB: tuulin (Baf) WB: LC3 (DMSO) WB: LC3 (Baf) Figure 5c Figure 5e WB: tuulin WB: LC3 (lower exp) WB: LC3 (higher exp) WB: tuulin (DMSO) WB: tuulin (Baf) WB: LC3 (DMSO) WB: LC3 (Baf) WB: WASH1 & GAPDH (DMSO, lower exp) WB: WASH1 & GAPDH (DMSO, higher exp) WB: WASH1 & GAPDH (Baf, lower exp) WB: WASH1 & GAPDH (Baf, higher exp) Supplementary Figure 12. continued
 WB: LC3")
 WB: LC3")
 WB: tuulin (DMSO)")
 WB: FKBP (Baf) Figure")
 WB: WASH1, GAPDH (medium")
 25 WB: tuulin WB: LC3")
17 Figure 5j WB: tuulin (DMSO) WB: tuulin (Baf) WB: LC3 (DMSO, lower exp) WB: LC3 (DMSO, higher exp) WB: LC3 (Baf, lower exp) WB: LC3 (Baf, higher exp) WB: tuulin (DMSO) WB: tuulin (Baf) WB: FKBP (DMSO) WB: FKBP (Baf) Figure 9a 70 WB: WASH1, GAPDH (high exp) WB: WASH1, GAPDH (medium exp) WB: WASH1, GAPDH (low exp) 25 WB: tuulin WB: LC3 Supplementary Figure 12. continued


 1 1c")


")


18 Supplementary Figure 1a WB: FAM21, Strumpellin, WASH1, FKBP, VPS,, VPS29 (lower exp) WB: FAM21, Strumpellin, WASH1, FKBP, VPS,, VPS29 (higher exp) Supplementary Figure 1 Supplementary Figure 1c WB: FAM21, Strumpellin, VPS,, CAPZa, VPS29 (right image is from phosphoimager) Supplementary Figure 1d WB: FKBP, Strumpellin, VPS, VPS29,, FAM21, TBC1D5 (lower exp) (higher exp) WB: FAM21, Strumpellin WB: FKBP, VPS WB: WB: WASH1, Supplementary Figure 12. continued
 WB: LC3 (DMSO, higher exp) WB: LC3 (Baf, higher exp) Supplementary Figure 4e WB: tuulin (DMSO) WB: tuulin (Baf) WB: VPS (DMSO) WB: VPS (Baf) Supplementary Figure 12. continued")
19 Supplementary Figure 4a WB: tuulin (DMSO) WB: tuulin (Baf) WB: LC3 (DMSO) WB: LC3 (Baf) Supplementary Figure 4c WB: tuulin (DMSO) WB: tuulin (Baf) WB: LC3 (DMSO, lower exp) WB: LC3 (Baf, lower exp) WB: LC3 (DMSO, higher exp) WB: LC3 (Baf, higher exp) Supplementary Figure 4e WB: tuulin (DMSO) WB: tuulin (Baf) WB: VPS (DMSO) WB: VPS (Baf) Supplementary Figure 12. continued
Ctrl CCT7 CCT2 GAPDH * * ** ** * Ctrl Size of LC3 dots (a.u.) mrfp GFP mrfp-gfp-lc3 CCT5 KD CCT7 KD
 mrfp GFP mrfp-gfp-lc3 CCT5 KD CCT7 KD") CCT7 Size of dots (a.u.) CCT7 CCT7 /GAPH deitometry (a.u.) /GAPH deitometry (a.u.) a CCT7 Primary cortical neuro 55 CCT5 55 CCT7 55 CCT7 55 55 55 c 3 25 2 DMSO 2 8 Bafilomycin A 5 6 4 5 2 2 3 2 3 d mrfpgfp
CCT7 Size of dots (a.u.) CCT7 CCT7 /GAPH deitometry (a.u.) /GAPH deitometry (a.u.) a CCT7 Primary cortical neuro 55 CCT5 55 CCT7 55 CCT7 55 55 55 c 3 25 2 DMSO 2 8 Bafilomycin A 5 6 4 5 2 2 3 2 3 d mrfpgfp
SUPPLEMENTARY FIGURES
 SUPPLEMENTARY FIGURES Supplementary Figure 1. (A) Left, western blot analysis of ISGylated proteins in Jurkat T cells treated with 1000U ml -1 IFN for 16h (IFN) or left untreated (CONT); right, western
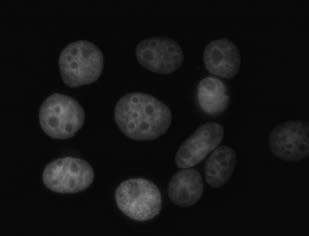
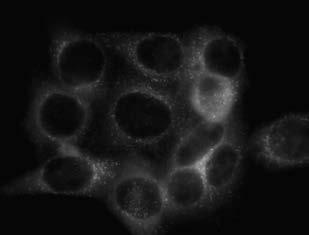
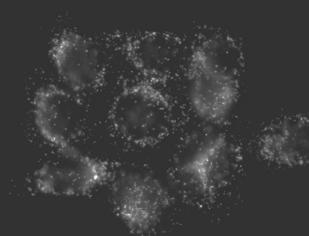
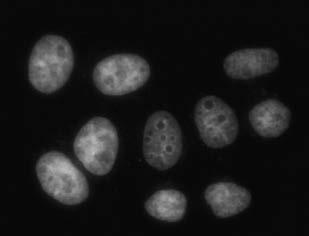
Supplementary Information. Cofilin Regulates Nuclear Architecture through a Myosin-II Dependent Mechanotransduction Module
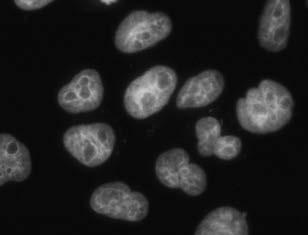
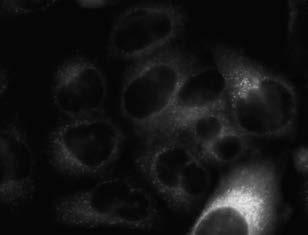
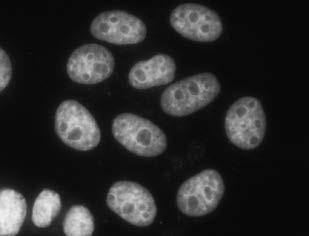
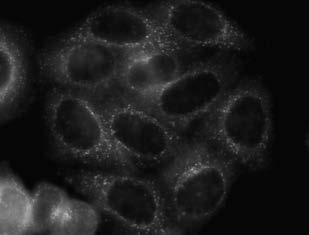
 Supplementary Information Cofilin Regulates Nuclear Architecture through a Myosin-II Dependent Mechanotransduction Module O Neil Wiggan, Bryce Schroder, Diego Krapf, James R. Bamurg and Jennifer G. DeLuca
SUPPLEMENTARY INFORMATION
 DOI:.38/ncb2822 a MTC02 FAO cells EEA1 b +/+ MEFs /DAPI -/- MEFs /DAPI -/- MEFs //DAPI c HEK 293 cells WCE N M C P AKT TBC1D7 Lamin A/C EEA1 VDAC d HeLa cells WCE N M C P AKT Lamin A/C EEA1 VDAC Figure
Expanded View Figures
 PEX13 functions in selective autophagy Ming Y Lee et al Expanded View Figures Figure EV1. PEX13 is required for Sindbis virophagy. A, B Quantification of mcherry-capsid puncta per cell (A) and GFP-LC3
Supplementary Information
 Supplementary Information Supplementary Figure 1: cholesterol manipulation alters the positioning of autophagosomes in cells, related to figure 1. (a) HeLa cells were treated for 24h under conditions reducing
Supplemental information contains 7 movies and 4 supplemental Figures
 1 2 3 4 5 6 7 8 9 10 11 12 13 14 15 16 17 18 19 20 21 22 23 24 25 26 27 Supplemental information contains 7 movies and 4 supplemental Figures Movies: Movie 1. Single virus tracking of A4-mCherry-WR MV
Supplementary information
 Supplementary information 1 Supplementary Figure 1. CALM regulates autophagy. (a). Quantification of LC3 levels in the experiment described in Figure 1A. Data are mean +/- SD (n > 3 experiments for each
A. Generation and characterization of Ras-expressing autophagycompetent
 Supplemental Material Supplemental Figure Legends Fig. S1 A. Generation and characterization of Ras-expressing autophagycompetent and -deficient cell lines. HA-tagged H-ras V12 was stably expressed in
Tumor suppressor Spred2 interaction with LC3 promotes autophagosome maturation and induces autophagy-dependent cell death
 www.impactjournals.com/oncotarget/ Oncotarget, Supplementary Materials 2016 Tumor suppressor Spred2 interaction with LC3 promotes autophagosome maturation and induces autophagy-dependent cell death Supplementary
SUPPLEMENTARY FIGURE LEGENDS
 SUPPLEMENTARY FIGURE LEGENDS Supplemental FIG. 1. Localization of myosin Vb in cultured neurons varies with maturation stage. A and B, localization of myosin Vb in cultured hippocampal neurons. A, in DIV
Supplemental Materials. STK16 regulates actin dynamics to control Golgi organization and cell cycle
 Supplemental Materials STK16 regulates actin dynamics to control Golgi organization and cell cycle Juanjuan Liu 1,2,3, Xingxing Yang 1,3, Binhua Li 1, Junjun Wang 1,2, Wenchao Wang 1, Jing Liu 1, Qingsong
 Supplementary Figure Legends Supplementary Figure S1. Aurora-A is essential for SAC establishment in early mitosis. (a-c) RPE cells were treated with DMSO (a), MLN8237 (b) or BI2536 (c) for Two hours.
Neocortex Zbtb20 / NFIA / Sox9
 Neocortex / NFIA / Sox9 Supplementary Figure 1. Expression of, NFIA, and Sox9 in the mouse neocortex at. The lower panels are higher magnification views of the oxed area. Arrowheads indicate triple-positive
THE ROLE OF ALTERED CALCIUM AND mtor SIGNALING IN THE PATHOGENESIS OF CYSTINOSIS
 Research Foundation, 18 month progress report THE ROLE OF ALTERED CALCIUM AND mtor SIGNALING IN THE PATHOGENESIS OF CYSTINOSIS Ekaterina Ivanova, doctoral student Elena Levtchenko, MD, PhD, PI Antonella
TFEB-mediated increase in peripheral lysosomes regulates. Store Operated Calcium Entry
 TFEB-mediated increase in peripheral lysosomes regulates Store Operated Calcium Entry Luigi Sbano, Massimo Bonora, Saverio Marchi, Federica Baldassari, Diego L. Medina, Andrea Ballabio, Carlotta Giorgi
genome edited transient transfection, CMV promoter
 Supplementary Figure 1. In the absence of new protein translation, overexpressed caveolin-1-gfp is degraded faster than caveolin-1-gfp expressed from the endogenous caveolin 1 locus % loss of total caveolin-1-gfp
Supporting Information
 Supporting Information Fig. S1. Overexpression of Rpr causes progenitor cell death. (A) TUNEL assay of control intestines. No progenitor cell death could be observed, except that some ECs are undergoing
Supplementary information. The Light Intermediate Chain 2 Subpopulation of Dynein Regulates Mitotic. Spindle Orientation
 Supplementary information The Light Intermediate Chain 2 Subpopulation of Dynein Regulates Mitotic Spindle Orientation Running title: Dynein LICs distribute mitotic functions. Sagar Mahale a, d, *, Megha
SUPPLEMENTARY INFORMATION
 DOI: 10.1038/ncb2566 Figure S1 CDKL5 protein expression pattern and localization in mouse brain. (a) Multiple-tissue western blot from a postnatal day (P) 21 mouse probed with an antibody against CDKL5.
Supplementary Figure 1.TRIM33 binds β-catenin in the nucleus. a & b, Co-IP of endogenous TRIM33 with β-catenin in HT-29 cells (a) and HEK 293T cells
 and HEK 293T cells") Supplementary Figure 1.TRIM33 binds β-catenin in the nucleus. a & b, Co-IP of endogenous TRIM33 with β-catenin in HT-29 cells (a) and HEK 293T cells (b). TRIM33 was immunoprecipitated, and the amount of
Supplementary Figure 1.TRIM33 binds β-catenin in the nucleus. a & b, Co-IP of endogenous TRIM33 with β-catenin in HT-29 cells (a) and HEK 293T cells (b). TRIM33 was immunoprecipitated, and the amount of
Supplementary Fig. 1 V-ATPase depletion induces unique and robust phenotype in Drosophila fat body cells.
 Supplementary Fig. 1 V-ATPase depletion induces unique and robust phenotype in Drosophila fat body cells. a. Schematic of the V-ATPase proton pump macro-complex structure. The V1 complex is composed of
Nature Structural and Molecular Biology: doi: /nsmb Supplementary Figure 1
 Supplementary Figure 1 Mutational analysis of the SA2-Scc1 interaction in vitro and in human cells. (a) Autoradiograph (top) and Coomassie stained gel (bottom) of 35 S-labeled Myc-SA2 proteins (input)
Supplemental Information. Autophagy in Oncogenic K-Ras. Promotes Basal Extrusion. of Epithelial Cells by Degrading S1P. Current Biology, Volume 24
 Current Biology, Volume 24 Supplemental Information Autophagy in Oncogenic K-Ras Promotes Basal Extrusion of Epithelial Cells by Degrading S1P Gloria Slattum, Yapeng Gu, Roger Sabbadini, and Jody Rosenblatt
T H E J O U R N A L O F C E L L B I O L O G Y
 Supplemental material Jewell et al., http://www.jcb.org/cgi/content/full/jcb.201007176/dc1 T H E J O U R N A L O F C E L L B I O L O G Y Figure S1. IR Munc18c association is independent of IRS-1. (A and
Supplementary Figure 1. Characterization of NMuMG-ErbB2 and NIC breast cancer cells expressing shrnas targeting LPP. NMuMG-ErbB2 cells (a) and NIC
 and NIC") Supplementary Figure 1. Characterization of NMuMG-ErbB2 and NIC breast cancer cells expressing shrnas targeting LPP. NMuMG-ErbB2 cells (a) and NIC cells (b) were engineered to stably express either a LucA-shRNA
Supplementary Figure 1. Characterization of NMuMG-ErbB2 and NIC breast cancer cells expressing shrnas targeting LPP. NMuMG-ErbB2 cells (a) and NIC cells (b) were engineered to stably express either a LucA-shRNA
Supplemental Figures:
 Supplemental Figures: Figure 1: Intracellular distribution of VWF by electron microscopy in human endothelial cells. a) Immunogold labeling of LC3 demonstrating an LC3-positive autophagosome (white arrow)
Figure S1. Western blot analysis of clathrin RNA interference in human DCs Human immature DCs were transfected with 100 nm Clathrin SMARTpool or
 Figure S1. Western blot analysis of clathrin RNA interference in human DCs Human immature DCs were transfected with 100 nm Clathrin SMARTpool or control nontargeting sirnas. At 90 hr after transfection,
293T cells were transfected with indicated expression vectors and the whole-cell extracts were subjected
 SUPPLEMENTARY INFORMATION Supplementary Figure 1. Formation of a complex between Slo1 and CRL4A CRBN E3 ligase. (a) HEK 293T cells were transfected with indicated expression vectors and the whole-cell
Fig. S1. Subcellular localization of overexpressed LPP3wt-GFP in COS-7 and HeLa cells. Cos7 (top) and HeLa (bottom) cells expressing for 24 h human
 and HeLa (bottom) cells expressing for 24 h human") Fig. S1. Subcellular localization of overexpressed LPP3wt-GFP in COS-7 and HeLa cells. Cos7 (top) and HeLa (bottom) cells expressing for 24 h human LPP3wt-GFP, fixed and stained for GM130 (A) or Golgi97
Fig. S1. Subcellular localization of overexpressed LPP3wt-GFP in COS-7 and HeLa cells. Cos7 (top) and HeLa (bottom) cells expressing for 24 h human LPP3wt-GFP, fixed and stained for GM130 (A) or Golgi97
Rescue of mutant rhodopsin traffic by metformin-induced AMPK activation accelerates photoreceptor degeneration Athanasiou et al
 Supplementary Material Rescue of mutant rhodopsin traffic by metformin-induced AMPK activation accelerates photoreceptor degeneration Athanasiou et al Supplementary Figure 1. AICAR improves P23H rod opsin
Supplementary Figure 1. Rab27a-KD inhibits speed and persistence of HEp3 cells migrating in the chick CAM. (a) Western blot analysis of Rab27a
 Western blot analysis of Rab27a") Supplementary Figure 1. Rab27a-KD inhibits speed and persistence of HEp3 cells migrating in the chick CAM. (a) Western blot analysis of Rab27a expression in GFP-expressing HEp3 cells. (b) Representative
Supplementary Figure 1. Rab27a-KD inhibits speed and persistence of HEp3 cells migrating in the chick CAM. (a) Western blot analysis of Rab27a expression in GFP-expressing HEp3 cells. (b) Representative
Supplementary Figure 1. Spatial distribution of LRP5 and β-catenin in intact cardiomyocytes. (a) and (b) Immunofluorescence staining of endogenous
 and (b) Immunofluorescence staining of endogenous") Supplementary Figure 1. Spatial distribution of LRP5 and β-catenin in intact cardiomyocytes. (a) and (b) Immunofluorescence staining of endogenous LRP5 in intact adult mouse ventricular myocytes (AMVMs)
Supplementary Figure 1. Spatial distribution of LRP5 and β-catenin in intact cardiomyocytes. (a) and (b) Immunofluorescence staining of endogenous LRP5 in intact adult mouse ventricular myocytes (AMVMs)
(a) Significant biological processes (upper panel) and disease biomarkers (lower panel)
 Significant biological processes (upper panel) and disease biomarkers (lower panel)") Supplementary Figure 1. Functional enrichment analyses of secretomic proteins. (a) Significant biological processes (upper panel) and disease biomarkers (lower panel) 2 involved by hrab37-mediated secretory
Supplementary Figure 1. Functional enrichment analyses of secretomic proteins. (a) Significant biological processes (upper panel) and disease biomarkers (lower panel) 2 involved by hrab37-mediated secretory
SUPPLEMENTARY INFORMATION
 DOI: 10.1038/ncb2607 Figure S1 Elf5 loss promotes EMT in mammary epithelium while Elf5 overexpression inhibits TGFβ induced EMT. (a, c) Different confocal slices through the Z stack image. (b, d) 3D rendering
Supplementary Figure 1. The CagA-dependent wound healing or transwell migration of gastric cancer cell. AGS cells transfected with vector control or
 Supplementary Figure 1. The CagA-dependent wound healing or transwell migration of gastric cancer cell. AGS cells transfected with vector control or 3xflag-CagA expression vector were wounded using a pipette
Nature Neuroscience: doi: /nn Supplementary Figure 1. PICALM expression in brain capillary endothelium in human brain and in mouse brain.
 Supplementary Figure 1 PICALM expression in brain capillary endothelium in human brain and in mouse brain. a, Double immunostaining for PICALM (red, left) and lectin positive endothelial profiles (blue,
SUPPLEMENTARY INFORMATION
 DOI: 1.138/ncb222 / b. WB anti- WB anti- ulin Mitotic index (%) 14 1 6 2 T (h) 32 48-1 1 2 3 4 6-1 4 16 22 28 3 33 e. 6 4 2 Time (min) 1-6- 11-1 > 1 % cells Figure S1 depletion leads to mitotic defects
Supplementary Figure 1 Expression of Crb3 in mouse sciatic nerve: biochemical analysis (a) Schematic of Crb3 isoforms, ERLI and CLPI, indicating the
 Schematic of Crb3 isoforms, ERLI and CLPI, indicating the") Supplementary Figure 1 Expression of Crb3 in mouse sciatic nerve: biochemical analysis (a) Schematic of Crb3 isoforms, ERLI and CLPI, indicating the location of the transmembrane (TM), FRM binding (FB)
Supplementary Figure 1 Expression of Crb3 in mouse sciatic nerve: biochemical analysis (a) Schematic of Crb3 isoforms, ERLI and CLPI, indicating the location of the transmembrane (TM), FRM binding (FB)
Supplemental information
 Carcinoemryonic antigen-related cell adhesion molecule 6 (CEACAM6) promotes EGF receptor signaling of oral squamous cell carcinoma metastasis via the complex N-glycosylation y Chiang et al. Supplemental
Type of file: PDF Title of file for HTML: Supplementary Information Description: Supplementary Figures and Supplementary Table.
 Type of file: PDF Title of file for HTML: Supplementary Information Description: Supplementary Figures and Supplementary Tale. Type of file: VI Title of file for HTML: Supplementary Movie 1 Description:
Supplementary Materials for
 www.sciencesignaling.org/cgi/content/full/6/283/ra57/dc1 Supplementary Materials for JNK3 Couples the Neuronal Stress Response to Inhibition of Secretory Trafficking Guang Yang,* Xun Zhou, Jingyan Zhu,
Supplementary Figure 1
 Supplementary Figure 1 a γ-h2ax MDC1 RNF8 FK2 BRCA1 U2OS Cells sgrna-1 ** 60 sgrna 40 20 0 % positive Cells (>5 foci per cell) b ** 80 sgrna sgrna γ-h2ax MDC1 γ-h2ax RNF8 FK2 MDC1 BRCA1 RNF8 FK2 BRCA1
SUPPLEMENTARY INFORMATION
 doi:10.1038/nature12652 Supplementary Figure 1. PRDM16 interacts with endogenous EHMT1 in brown adipocytes. Immunoprecipitation of PRDM16 complex by flag antibody (M2) followed by Western blot analysis
Nature Structural & Molecular Biology: doi: /nsmb Supplementary Figure 1. Differential expression of mirnas from the pri-mir-17-92a locus.
 Supplementary Figure 1 Differential expression of mirnas from the pri-mir-17-92a locus. (a) The mir-17-92a expression unit in the third intron of the host mir-17hg transcript. (b,c) Impact of knockdown
Supplementary information. MARCH8 inhibits HIV-1 infection by reducing virion incorporation of envelope glycoproteins
 Supplementary information inhibits HIV-1 infection by reducing virion incorporation of envelope glycoproteins Takuya Tada, Yanzhao Zhang, Takayoshi Koyama, Minoru Tobiume, Yasuko Tsunetsugu-Yokota, Shoji
SUPPLEMENTARY INFORMATION
 SUPPLEMENTARY INFORMATION doi:1.138/nature9814 a A SHARPIN FL B SHARPIN ΔNZF C SHARPIN T38L, F39V b His-SHARPIN FL -1xUb -2xUb -4xUb α-his c Linear 4xUb -SHARPIN FL -SHARPIN TF_LV -SHARPINΔNZF -SHARPIN
A. List of selected proteins with high SILAC (H/L) ratios identified in mass
 ratios identified in mass") Supplementary material Figure S1. Interaction between UBL5 and FANCI A. List of selected proteins with high SILAC (H/L) ratios identified in mass spectrometry (MS)-based analysis of UBL5-interacting proteins,
Supplementary material Figure S1. Interaction between UBL5 and FANCI A. List of selected proteins with high SILAC (H/L) ratios identified in mass spectrometry (MS)-based analysis of UBL5-interacting proteins,
* * A3027. A4623 e A3507 A3507 A3507
 a c L A327 d e A37 A37 A37 Supplementary Figure 1. Clinical manifestations of individuals with mutations. (a) Renal ultrasound of right kidney in A327 reveals small renal cysts, loss of corticomedullary
Appendix. Table of Contents
 Appendix Table of Contents Appendix Figures Figure S1: Gp78 is not required for the degradation of mcherry-cl1 in Hela Cells. Figure S2: Indel formation in the MARCH6 sgrna targeted HeLa clones. Figure
Supplementary Figure 1: si-craf but not si-braf sensitizes tumor cells to radiation.
 Supplementary Figure 1: si-craf but not si-braf sensitizes tumor cells to radiation. (a) Embryonic fibroblasts isolated from wildtype (WT), BRAF -/-, or CRAF -/- mice were irradiated (6 Gy) and DNA damage
T H E J O U R N A L O F C E L L B I O L O G Y
 T H E J O U R N A L O F C E L L B I O L O G Y Supplemental material Krenn et al., http://www.jcb.org/cgi/content/full/jcb.201110013/dc1 Figure S1. Levels of expressed proteins and demonstration that C-terminal
Supplementary Figure 1. MAT IIα is Acetylated at Lysine 81.
 IP: Flag a Mascot PTM Modified Mass Error Position Gene Names Score Score Sequence m/z [ppm] 81 MAT2A;AMS2;MATA2 35.6 137.28 _AAVDYQK(ac)VVR_ 595.83-2.28 b Pre-immu After-immu Flag- WT K81R WT K81R / Flag
Supplementary Information
 1 Supplementary Information A role for primary cilia in glutamatergic synaptic integration of adult-orn neurons Natsuko Kumamoto 1,4,5, Yan Gu 1,4, Jia Wang 1,4, Stephen Janoschka 1,2, Ken-Ichi Takemaru
Effects of UBL5 knockdown on cell cycle distribution and sister chromatid cohesion
 Supplementary Figure S1. Effects of UBL5 knockdown on cell cycle distribution and sister chromatid cohesion A. Representative examples of flow cytometry profiles of HeLa cells transfected with indicated
SUPPLEMENTARY INFORMATION
 Figure S1 Induction of non-apoptotic death of SV40-transformed and primary DKO MEFs, and DKO thymocytes. (A-F) STS-induced non-apoptotic death of DKO MEF. (A, B) Reduced viability of DKO MEFs after exposure
Dynamic Interaction of Stress Granule, DDX3X and IKK-α Mediates Multiple Functions in
 Dynamic Interaction of Stress Granule, and Mediates Multiple Functions in Hepatitis C Virus Infection Véronique Pène, Qisheng Li#, Catherine Sodroski, Ching-Sheng Hsu, T. Jake Liang# Liver Diseases Branch,
Supplemental information
 Supplemental information PI(3)K p11δ controls the sucellular compartmentalization of TLR4 signaling and protects from endotoxic shock Ezra Aksoy, Salma Taoui, David Torres, Sandrine Delauve, Aderrahman
SUPPLEMENTARY INFORMATION
 sirna pool: Control Tetherin -HA-GFP HA-Tetherin -Tubulin Supplementary Figure S1. Knockdown of HA-tagged tetherin expression by tetherin specific sirnas. HeLa cells were cotransfected with plasmids expressing
Figure S1. HP1α localizes to centromeres in mitosis and interacts with INCENP. (A&B) HeLa
 HeLa") SUPPLEMENTARY FIGURES Figure S1. HP1α localizes to centromeres in mitosis and interacts with INCENP. (A&B) HeLa tet-on cells that stably express HP1α-CFP, HP1β-CFP, or HP1γ-CFP were monitored with livecell
SUPPLEMENTARY FIGURES Figure S1. HP1α localizes to centromeres in mitosis and interacts with INCENP. (A&B) HeLa tet-on cells that stably express HP1α-CFP, HP1β-CFP, or HP1γ-CFP were monitored with livecell
SUPPLEMENTARY INFORMATION
 DOI: 10.1038/ncb2988 Supplementary Figure 1 Kif7 L130P encodes a stable protein that does not localize to cilia tips. (a) Immunoblot with KIF7 antibody in cell lysates of wild-type, Kif7 L130P and Kif7
Boucher et al NCOMMS B
 1 Supplementary Figure 1 (linked to Figure 1). mvegfr1 constitutively internalizes in endothelial cells. (a) Immunoblot of mflt1 from undifferentiated mouse embryonic stem (ES) cells with indicated genotypes;
Supplementary Materials
 Supplementary Materials Supplementary Figure S1 Regulation of Ubl4A stability by its assembly partner A, The translation rate of Ubl4A is not affected in the absence of Bag6. Control, Bag6 and Ubl4A CRISPR
Supplementary material Legends to Supplementary Figures Figure S1. Figure S2. Figure S3.
 Supplementary material Legends to Supplementary Figures. Figure S1. Expression of BICD-N-MTS fusion does not affect the distribution of the Golgi and endosomes. HeLa cells were transfected with GFP-BICD-N-MTS
Supplementary Information
 Supplementary Information Supplementary Figure 1. EBV-gB 23-431 mainly exists as trimer in HEK 293FT cells. (a) Western blotting analysis for DSS crosslinked FLAG-gB 23-431. HEK 293FT cells transfected
a b G75 G60 Sw-2 Sw-1 Supplementary Figure 1. Structure predictions by I-TASSER Server.
 a b G75 2 2 G60 Sw-2 Sw-1 Supplementary Figure 1. Structure predictions by I-TASSER Server. a. Overlay of top 10 models generated by I-TASSER illustrates the potential effect of 7 amino acid insertion
Rapid parallel measurements of macroautophagy and mitophagy in
 Supplemental Figures Rapid parallel measurements of macroautophagy and mitophagy in mammalian cells using a single fluorescent biosensor Sargsyan A, Cai J, Fandino LB, Labasky ME, Forostyan T, Colosimo
a Anti-Dab2 RGD Merge
 a Anti-Da Merge *** ** Percentage of cells adhered 8 6 4 RGE RAD RGE RAD Supplementary Figure Da are localized at clusters. (a) Endogenous Da is localized at clusters. (), ut not RGE nor RAD peptides can
6. TNF-α regulates oxidative stress, mitochondrial function and autophagy in neuronal cells
 6. TNF-α regulates oxidative stress, mitochondrial function and autophagy in neuronal cells 6.1 TNF-α induces mitochondrial oxidative stress in SH-SY5Y cells. The dysregulation of mitochondria and oxidative
Schwarz et al. Activity-Dependent Ubiquitination of GluA1 Mediates a Distinct AMPAR Endocytosis
 Schwarz et al Activity-Dependent Ubiquitination of GluA1 Mediates a Distinct AMPAR Endocytosis and Sorting Pathway Supplemental Data Supplemental Fie 1: AMPARs undergo activity-mediated ubiquitination
GFP-LC3 +/+ CLU -/- kda CLU GFP. Actin. GFP-LC3 +/+ CLU -/- kda CLU GFP. Actin
 Supplementary Fig. 1 a CQ treatment ScrB OGX11 MG132 I II AZD5363 I II b GFP / / GFP / / GFP / / GFP / / GFP GFP Actin Actin ctrl CQ GFP / / GFP / / GFP / / GFP / / GFP GFP Actin Actin rapamycin rapamycincq
Supplementary Figure 1. PD-L1 is glycosylated in cancer cells. (a) Western blot analysis of PD-L1 in breast cancer cells. (b) Western blot analysis
 Western blot analysis of PD-L1 in breast cancer cells. (b) Western blot analysis") Supplementary Figure 1. PD-L1 is glycosylated in cancer cells. (a) Western blot analysis of PD-L1 in breast cancer cells. (b) Western blot analysis of PD-L1 in ovarian cancer cells. (c) Western blot analysis
Supplementary Figure 1. PD-L1 is glycosylated in cancer cells. (a) Western blot analysis of PD-L1 in breast cancer cells. (b) Western blot analysis of PD-L1 in ovarian cancer cells. (c) Western blot analysis
Nature Structural & Molecular Biology: doi: /nsmb.3218
 Supplementary Figure 1 Endogenous EGFR trafficking and responses depend on biased ligands. (a) Lysates from HeLa cells stimulated for 2 min. with increasing concentration of ligands were immunoblotted
Supplementary Information CAND1 controls in vivo dynamics of the Cullin 1-RING ubiquitin ligase repertoire
 Supplementary Information CAD1 controls in vivo dynamics of the Cullin 1-RIG uiquitin ligase repertoire Shuangding Wu, Wenhong Zhu, Tina han, Julia I. Toth, Matthew D. Petroski, Dieter A. Wolf 1 c knd1
F-actin VWF Vinculin. F-actin. Vinculin VWF
 a F-actin VWF Vinculin b F-actin VWF Vinculin Supplementary Fig. 1. WPBs in HUVECs are located along stress fibers and at focal adhesions. (a) Immunofluorescence images of f-actin (cyan), VWF (yellow),
Supplementary Information for. A cancer-associated BRCA2 mutation reveals masked nuclear. export signals controlling localization
 Supplementary Information for A cancer-associated BRCA2 mutation reveals masked nuclear export signals controlling localization Anand D Jeyasekharan 1, Yang Liu 1, Hiroyoshi Hattori 1,3, Venkat Pisupati
BMDCs were generated in vitro from bone marrow cells cultured in 10 % RPMI supplemented
 Supplemental Materials Figure S1. Cultured BMDCs express CD11c BMDCs were generated in vitro from bone marrow cells cultured in 10 % RPMI supplemented with 15 ng/ml GM-CSF. Media was changed and fresh
TBC1D5 and the AP2 complex regulate ATG9 trafficking and initiation of autophagy
 Scientific Report TBC1D5 and the AP2 complex regulate ATG9 trafficking and initiation of autophagy Doris Popovic & Ivan Dikic * Abstract The RabGAP protein TBC1D5 controls cellular endomembrane trafficking
SUPPLEMENTARY LEGENDS...
 TABLE OF CONTENTS SUPPLEMENTARY LEGENDS... 2 11 MOVIE S1... 2 FIGURE S1 LEGEND... 3 FIGURE S2 LEGEND... 4 FIGURE S3 LEGEND... 5 FIGURE S4 LEGEND... 6 FIGURE S5 LEGEND... 7 FIGURE S6 LEGEND... 8 FIGURE
SUPPLEMENTARY INFORMATION
 SUPPLEENTRY INFORTION DOI: 1.138/ncb2577 Early Telophase Late Telophase B icrotubules within the ICB (percent of total cells in telophase) D G ultinucleate cells (% total) 8 6 4 2 2 15 1 5 T without gaps
Supplementary Figure 1. Confocal immunofluorescence showing mitochondrial translocation of Drp1. Cardiomyocytes treated with H 2 O 2 were prestained
 Supplementary Figure 1. Confocal immunofluorescence showing mitochondrial translocation of Drp1. Cardiomyocytes treated with H 2 O 2 were prestained with MitoTracker (red), then were immunostained with
tom tom 24hpf tom tom 48hpf tom 60hpf tom tom 72hpf tom
 a 24hpf c 48hpf d e 60hpf f g 72hpf h i j k ISV ISV Figure 1. Vascular integrity defects and endothelial regression in mutant emryos. (a,c,e,g,i) Bright-field and (,d,f,h,j) corresponding fluorescent micrographs
Supplementary Figure S1
 Supplementary Figure S1 Supplementary Figure S1. PARP localization patterns using GFP-PARP and PARP-specific antibody libraries GFP-PARP localization in non-fixed (A) and formaldehyde fixed (B) GFP-PARPx
Chapter 3. Expression of α5-megfp in Mouse Cortical Neurons. on the β subunit. Signal sequences in the M3-M4 loop of β nachrs bind protein factors to
 22 Chapter 3 Expression of α5-megfp in Mouse Cortical Neurons Subcellular localization of the neuronal nachr subtypes α4β2 and α4β4 depends on the β subunit. Signal sequences in the M3-M4 loop of β nachrs
Diverse Autophagosome Membrane Sources Coalesce in Recycling Endosomes
 Diverse Autophagosome Membrane Sources Coalesce in Recycling Endosomes Claudia Puri, 1 Maurizio Renna, 1 Carla F. Bento, 1 Kevin Moreau, 1 and David C. Rubinsztein 1, * 1 Department of Medical Genetics,
El Azzouzi et al., http ://www.jcb.org /cgi /content /full /jcb /DC1
 Supplemental material JCB El Azzouzi et al., http ://www.jcb.org /cgi /content /full /jcb.201510043 /DC1 THE JOURNAL OF CELL BIOLOGY Figure S1. Acquisition of -phluorin correlates negatively with podosome
effects on organ development. a-f, Eye and wing discs with clones of ε j2b10 show no
 Supplementary Figure 1. Loss of function clones of 14-3-3 or 14-3-3 show no significant effects on organ development. a-f, Eye and wing discs with clones of 14-3-3ε j2b10 show no obvious defects in Elav
Sestrin2 and BNIP3 (Bcl-2/adenovirus E1B 19kDa-interacting. protein3) regulate autophagy and mitophagy in renal tubular cells in. acute kidney injury
 regulate autophagy and mitophagy in renal tubular cells in. acute kidney injury") Sestrin2 and BNIP3 (Bcl-2/adenovirus E1B 19kDa-interacting protein3) regulate autophagy and mitophagy in renal tubular cells in acute kidney injury by Masayuki Ishihara 1, Madoka Urushido 2, Kazu Hamada
Sestrin2 and BNIP3 (Bcl-2/adenovirus E1B 19kDa-interacting protein3) regulate autophagy and mitophagy in renal tubular cells in acute kidney injury by Masayuki Ishihara 1, Madoka Urushido 2, Kazu Hamada
(a) Schematic diagram of the FS mutation of UVRAG in exon 8 containing the highly instable
 Schematic diagram of the FS mutation of UVRAG in exon 8 containing the highly instable") Supplementary Figure 1. Frameshift (FS) mutation in UVRAG. (a) Schematic diagram of the FS mutation of UVRAG in exon 8 containing the highly instable A 10 DNA repeat, generating a premature stop codon
Supplementary Figure 1. Frameshift (FS) mutation in UVRAG. (a) Schematic diagram of the FS mutation of UVRAG in exon 8 containing the highly instable A 10 DNA repeat, generating a premature stop codon
SUPPLEMENTARY INFORMATION
 DOI: 10.1038/ncb3076 Supplementary Figure 1 btrcp targets Cep68 for degradation during mitosis. a) Cep68 immunofluorescence in interphase and metaphase. U-2OS cells were transfected with control sirna
Prolonged mitotic arrest induces a caspase-dependent DNA damage
 SUPPLEMENTARY INFORMATION Prolonged mitotic arrest induces a caspase-dependent DNA damage response at telomeres that determines cell survival Karolina O. Hain, Didier J. Colin, Shubhra Rastogi, Lindsey
Supplementary Figure S1: TIPF reporter validation in the wing disc.
 Supplementary Figure S1: TIPF reporter validation in the wing disc. a,b, Test of put RNAi. a, In wildtype discs the Dpp target gene Sal (red) is expressed in a broad stripe in the centre of the ventral
Supplementary Figure 1. PAQR3 knockdown inhibits SREBP-2 processing in CHO-7 cells CHO-7 cells were transfected with control sirna or a sirna
 Supplementary Figure 1. PAQR3 knockdown inhibits SREBP-2 processing in CHO-7 cells CHO-7 cells were transfected with control sirna or a sirna targeted for hamster PAQR3. At 24 h after the transfection,
supplementary information
 Figure S1 Nucleotide binding status of RagA mutants. Wild type and mutant forms of MycRagA was transfected into HEK293 cells and the transfected cells were labeled with 32 Pphosphate. MycRagA was immunoprecipitated
SUPPLEMENTARY FIGURES
 SUPPLEMENTARY FIGURES Supplementary Figure S1: Fibroblast-induced elongation of cancer cells requires direct contact with living fibroblasts. A. Representative images of HT29-GFP cultured in the presence
Live cell imaging of trafficking of the chaperone complex vaccine to the ER. BMDCs were incubated with ER-Tracker Red (1 M) in staining solution for
 in staining solution for") Live cell imaging of trafficking of the chaperone complex vaccine to the ER. BMDCs were incubated with ER-Tracker Red (1 M) in staining solution for 15 min at 37 C and replaced with fresh complete medium.
Live cell imaging of trafficking of the chaperone complex vaccine to the ER. BMDCs were incubated with ER-Tracker Red (1 M) in staining solution for 15 min at 37 C and replaced with fresh complete medium.
HEK293FT cells were transiently transfected with reporters, N3-ICD construct and
 Supplementary Information Luciferase reporter assay HEK293FT cells were transiently transfected with reporters, N3-ICD construct and increased amounts of wild type or kinase inactive EGFR. Transfections
Downregulation of the small GTPase SAR1A: a key event underlying alcohol-induced Golgi fragmentation in hepatocytes
 Downregulation of the small GTPase SAR1A: a key event underlying alcohol-induced Golgi fragmentation in hepatocytes Armen Petrosyan 1*, Pi-Wan Cheng 1,3, Dahn L. Clemens 2,3 & Carol A. Casey 2,3 1 Department
Supplementary Figure 1. MLN8237 treatments show an unusual camel-back response pattern.
 Supplementary Figure 1. MLN8237 treatments show an unusual camel-ack response pattern. NCI-H1819 cells were treated with serial concentrations of MLN8237 and four days after treatment, cell viaility was
Supplementary Fig. 1. GPRC5A post-transcriptionally down-regulates EGFR expression. (a) Plot of the changes in steady state mrna levels versus
 Plot of the changes in steady state mrna levels versus") Supplementary Fig. 1. GPRC5A post-transcriptionally down-regulates EGFR expression. (a) Plot of the changes in steady state mrna levels versus changes in corresponding proteins between wild type and Gprc5a-/-
Supplementary Fig. 1. GPRC5A post-transcriptionally down-regulates EGFR expression. (a) Plot of the changes in steady state mrna levels versus changes in corresponding proteins between wild type and Gprc5a-/-